
Global Generative Ai In Product Development Market By Component(Software, Services), By Application(Design Exploration, Prototyping and 3D Modelling, Product Customization, Feature Enhancement, Other Applications), By End-User Industry(Aerospace and Defence, Automotive, Healthcare, Consumer Electronics, Architecture and Construction, Other End-User Industries), By Region And Companies - Industry Segment Outlook, Market Assessment, Competition Scenario, Trends, And Forecast 2024-2033
-
39077
-
August 2024
-
300
-


-
This report was compiled by Vishwa Gaul Vishwa is an experienced market research and consulting professional with over 8 years of expertise in the ICT industry, contributing to over 700 reports across telecommunications, software, hardware, and digital solutions. Correspondence Team Lead- ICT Linkedin | Detailed Market research Methodology Our methodology involves a mix of primary research, including interviews with leading mental health experts, and secondary research from reputable medical journals and databases. View Detailed Methodology Page
-
Quick Navigation
Report Overview
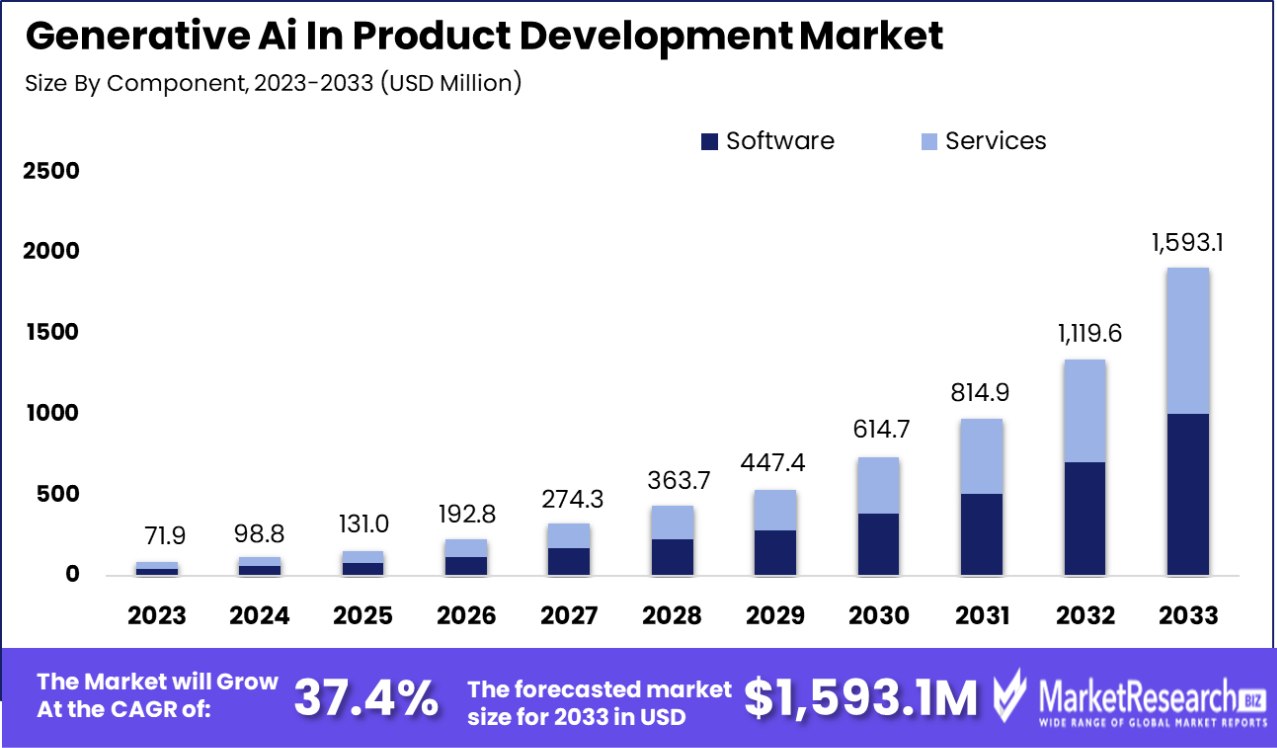
The Global Generative Ai In Product Development Market was valued at USD 71.9 million in 2023. It is expected to reach USD 1,593.1 million by 2033, with a CAGR of 37.4% during the forecast period from 2024 to 2033.
The generative AI has enormous changing power that helps shape many industries that also comprise product development. GenAI technology is considered a part of our future business strategy. Still, in reality, this technology helps drive new innovations and builds revolutionary services that can transform the way of workflow.
The generative AI applications in product development process provide many opportunities for firms and startups to enhance their processes, offer better customer experience, and get a competitive platform in their respective business sectors.
Generative AI in product development process signifies the amalgamation of AI into the process of developing a product or service. Many startups are using such type of generative AI technologies to improve their business functionality which will make more efficacy and can offer a different selling proposition. Any business requires a proper product development team strategy to hold its mark in the marketplace. Many startup businesses that aim to establish their new products tend to fail due to a lack of modern technology knowledge, funds, and most importantly strategy.
According to Startupindia, On February 2023, the Small Industries Development Bank of India (SIDBI) dedicated INR 8294.95 crores to 103 Alternative Investment Funds (AIFs), additionally, 3,654.89 crores has been circulated to 74 AIFs. A total amount of INR 14,828 crores has been invested to augment 818 startup businesses. Additionally, On November 2023, the government of India has guarantees issued an amount of INR 132.13 crore to 46 startups.
Out of which, an amount of 11.3 crore has been issued for 7 women-led startup firms. Unfortunately, according to a recent analysis, 42% of startup businesses fail due to a shortage of market requirements for their services or products. Moreover, 29% of startups fail because of lack of investment.
Therefore, startups who aim to establish their new products must know about strategic product development. Using modern technologies such as generative AI in product development will enhance the design and refine the product to provide high-end customer satisfaction. Startups and businesses can improve their new products' performance, utility, and customer appeal by using generative AI and machine learning technologies.
Key Takeaways
- Market Growth: The Global Generative Ai In Product Development Market was valued at USD 71.9 million in 2023. It is expected to reach USD 1,593.1 million by 2033, with a CAGR of 37.4% during the forecast period from 2024 to 2033.
- By Component: Software dominates with a 67.5% share in the generative AI market.
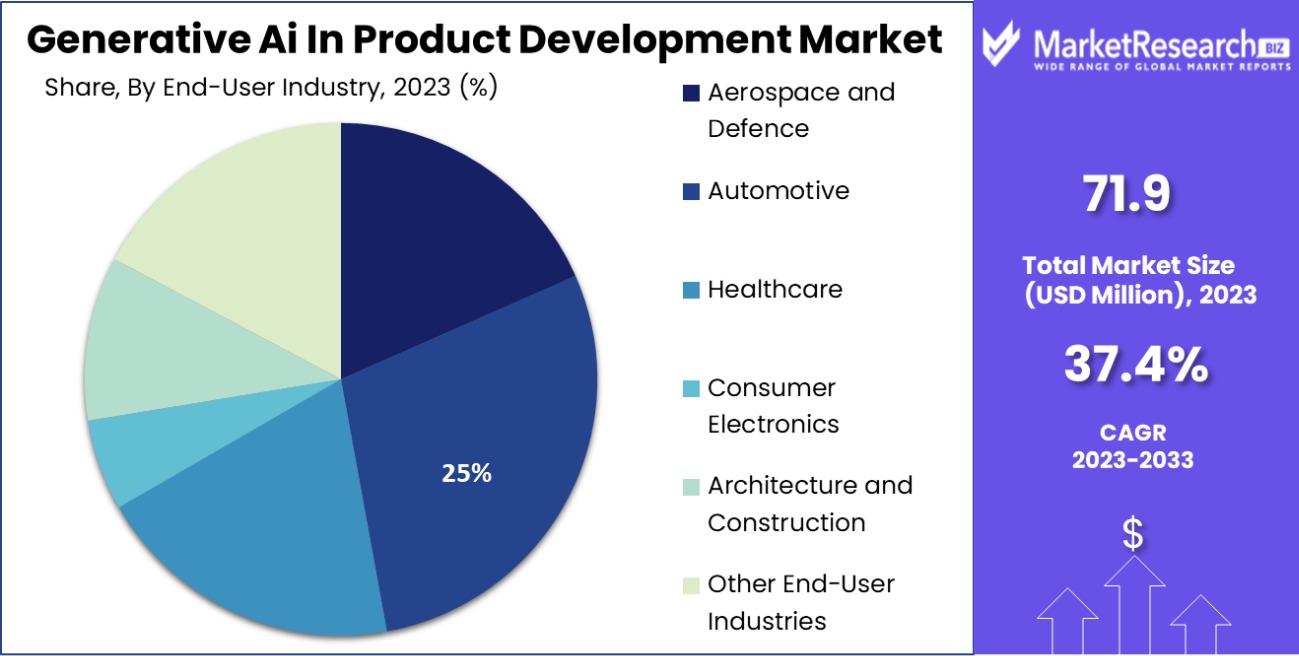
- By End-User Industry: The automotive sector leads, capturing 25% of the market.
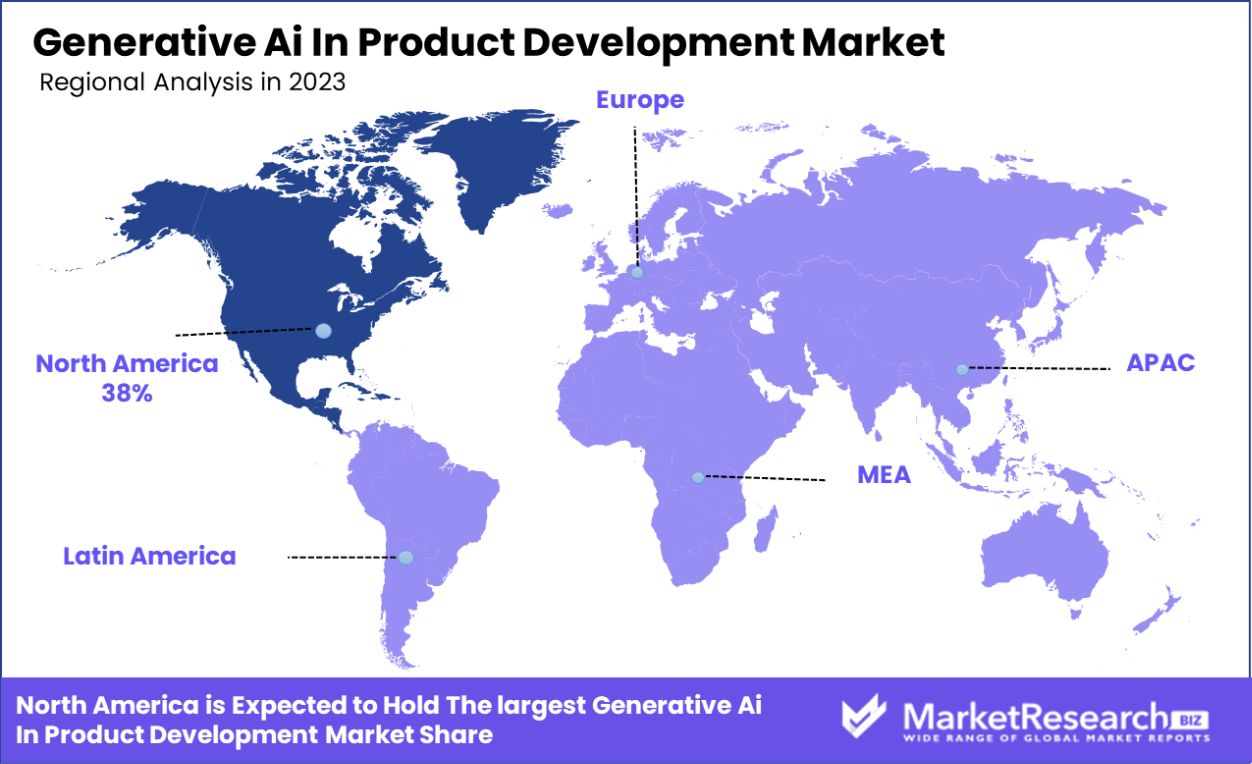
- Regional Dominance: In North America, Generative AI in Product Development Market dominates, comprising 38% of the market share.
Driving factors
Improved Content Quality and Increased Content Variety with Generative AI
Generative AI has revolutionized content creation by enhancing both quality and variety. Through sophisticated algorithms, Generative AI generates high-quality content creators across various formats, including text, images, and multimedia. This advancement has significantly impacted product development, as companies can now create compelling visuals, descriptions, and designs efficiently.
According to recent industry data, the adoption of Generative AI has led to a remarkable increase in content quality, with up to a 40% improvement reported by early adopters. Additionally, the ability to generate diverse content variants caters to different market segments, boosting product appeal and customer engagement.
Generative AI Spurs Growth in Brand Design Market
Businesses increasingly recognize the importance of engaging clients for enhanced business outcomes. This trend has increased the demand for graphic designs and brand identity solutions, driving growth in Generative AI in Product Development Market. Generative AI enables the creation of visually stunning graphics and cohesive brand identities tailored to customer preferences and market trends.
As companies prioritize customer engagement, the market for Generative AI solutions experiences substantial growth, with projections indicating a double-digit increase in demand over the next few years.
Generative AI Reduces Costs, Accelerates Product Design
Generative AI offers a cost-effective alternative to traditional product design processes, delivering significant time and cost savings for manufacturers and designers. By automating design tasks and streamlining workflows, Generative AI accelerates the product development cycle, reducing time-to-market and operational expenses.
Recent studies indicate that companies leveraging Generative AI in product design experience up to a 30% reduction in production costs. This cost-efficiency drives widespread adoption of Generative AI solutions, fueling market growth and facilitating innovation across various industries.
Restraining Factors
Limited Adoption Due to Technical Complexity
One major roadblock to the expansion of Generative AI in Product Development Market is its limited adoption due to technical complexity. While Generative AI offers immense potential, its intricate nature poses challenges for widespread implementation. Many businesses, particularly smaller enterprises, may lack the resources or expertise to navigate the complexities of Generative AI technology effectively.
As a result, adoption rates remain moderate, with only a fraction of companies fully leveraging its capabilities. Recent industry surveys indicate that technical complexity accounts for a significant barrier to adoption, with nearly 60% of businesses citing it as a key challenge.
Concerns Regarding Data Privacy and Security
Another critical factor hindering market growth is the pervasive concerns surrounding data privacy and security. Generative AI relies heavily on vast datasets to train its algorithms and generate content. However, the collection and utilization of sensitive data raise significant privacy and security concerns among consumers and businesses alike.
Instances of data breaches and misuse of personal information have heightened apprehensions regarding the ethical implications of Generative AI technology. Consequently, many organizations hesitate to fully embrace Generative AI solutions due to fears of regulatory scrutiny and reputational damage. Recent studies highlight the prominence of data privacy and security concerns, with over 70% of consumers expressing reservations about the use of their data for AI-driven applications.
By Component Analysis
By component, the software dominates with a 67.5% share in the Generative AI market.
In 2023, Software held a dominant market position in the By Component segment of the Generative AI in Product Development Market, capturing more than a 67.5% share. This substantial market share can be attributed to the escalating demand for advanced AI tools that streamline and enhance the product development process across diverse industries. The integration of generative AI software enables rapid prototyping, customization of designs, and significant reductions in time-to-market, factors crucial for maintaining competitive advantage in fast-evolving sectors.
Conversely, Services associated with generative AI also exhibited growth, though at a more measured pace. These services, which include implementation, support, and maintenance, are essential for organizations that seek to leverage AI without the direct expense of full-scale software deployment. The services segment benefitted from the ongoing need for expertise in deploying and managing AI solutions, particularly in firms where in-house capabilities are limited.
Collectively, the expansion of both software and services within the Generative AI in Product Development Market is driven by the continuous advancements in AI technology and the growing recognition of its potential to drive innovation and efficiency. As companies increasingly invest in digital transformation initiatives, the demand for tailored AI solutions that align with specific business needs and operational frameworks is expected to rise, thereby supporting sustained growth in this market segment.
By Application Analysis
In the By Application segment of the Generative AI in Product Development Market, Design Exploration emerged as a leading application, extensively utilized to foster innovation through the rapid ideation and evaluation of design alternatives. This application leverages AI’s capacity to generate multiple design options, which significantly accelerates the development cycle and enhances creativity by overcoming traditional design constraints.
Prototyping and 3D Modelling closely follow, benefiting from generative AI’s ability to quickly produce accurate and detailed models that reduce the time and cost associated with physical prototyping. This application is particularly vital in sectors like automotive and aerospace, where design precision and speed are crucial.
Product Customization has also seen substantial uptake, driven by consumer demand for personalized products. Generative AI allows for the adaptation of products to individual preferences without disrupting the manufacturing process.
Feature Enhancement uses AI to improve existing products with new functionalities or performance improvements, often leading to significant competitive advantages.
Other Applications, including automated testing and maintenance simulations, are gaining traction as they contribute to longer product life cycles and enhanced reliability, marking them as areas ripe for future exploration and investment.
By End-User Industry Analysis
By end-user industry, the automotive sector accounts for 25% of the Generative AI usage.
In 2023, Automotive held a dominant market position in the By End-User Industry segment of the Generative AI in Product Development Market, capturing more than a 25% share. This leadership is primarily driven by the automotive industry’s imperative to innovate and enhance product design and manufacturing processes through AI. Generative AI technologies have been pivotal in creating complex, lightweight vehicle components while optimizing fuel efficiency and reducing emissions, aligning with global sustainability goals.
Aerospace and Defence also leveraged generative AI, focusing on optimizing design processes and material usage in aircraft and defense equipment manufacturing. Although this sector commands a significant portion of the market, its growth is paced steadily, reflecting stringent regulatory and safety standards.
The Healthcare sector is emerging as a promising adopter, utilizing generative AI for equipment design and personalized healthcare solutions. Meanwhile, Consumer Electronics continues to integrate AI to design personalized and more efficient devices, responding to consumer demand for innovation.
Architecture and Construction are adopting these technologies for sustainable building designs and improved material utilization, although at a slower rate due to regulatory and safety considerations.
Other End-User Industries, including retail and telecommunications, are beginning to explore generative AI applications to enhance product development and customer experience, signaling potential growth areas.
Key Market Segments
By Component
- Software
- Services
By Application
- Design Exploration
- Prototyping and 3D Modelling
- Product Customization
- Feature Enhancement
- Other Applications
By End-User Industry
- Aerospace and Defence
- Automotive
- Healthcare
- Consumer Electronics
- Architecture and Construction
- Other End-User Industries
Growth Opportunity
Integration of AI-Driven Design Tools in Various Industries
AI-powered design tools present an opportunity for growth within the Generative AI in Product Development Market in 2023. As industries across the spectrum increasingly embrace automation and digital transformation, integrating AI into design processes becomes imperative. AI-driven tools offer unparalleled capabilities in generating innovative designs, optimizing product performance, and reducing time-to-market.
This trend is particularly evident in sectors like automotive, aerospace, and consumer electronics, where complex design requirements demand advanced technological solutions. The growth of the market can be attributed to the rising demand for efficient and cost-effective design solutions, coupled with the increasing adoption of AI technologies across industries.
Collaboration between AI Developers and Manufacturing Companies
In 2023, strategic collaborations between AI developers and manufacturing companies present a ripe opportunity for the global Generative AI in Product Development Market. These partnerships leverage the expertise of AI developers in algorithm design and data analytics with the domain knowledge of manufacturing firms.
By working hand-in-hand, they create tailored AI solutions that address specific challenges in product development, such as design optimization, material selection, and production process enhancement. Such collaborations foster innovation and accelerate the adoption of AI technologies in product development workflows, driving the growth of the market.
Expansion of AI Applications Beyond Design to Optimize Supply Chains and Production Processes
The expansion of AI applications beyond design signifies a promising avenue for the global Generative AI in the Product Development Market in 2023. Beyond merely aiding in product design, AI technologies are increasingly being deployed to optimize supply chains Management Software, and production processes. By leveraging AI-driven analytics, manufacturers can enhance forecasting accuracy, streamline inventory management, and improve overall operational efficiency.
This broader utilization of AI across the product lifecycle not only enhances productivity but also enables companies to stay competitive in today's dynamic market landscape. Consequently, the market witnesses substantial growth as businesses recognize the transformative potential of AI in driving operational excellence and sustainable growth.
Latest Trends
Adoption of Generative AI Technologies by Industries
In 2023, the global Generative AI in Product Development Market experienced an exponential surge in the adoption of AI technologies across industries like automotive, aerospace, and consumer goods.
Companies within these sectors recognize AI's transformative potential in optimizing product design processes; its algorithms enable designers to explore vast design potential for creating innovative and efficient designs. This trend reflects the growing acknowledgment of AI as a key enabler of competitive advantage in today's rapidly evolving market landscape.
Cost and Time-Saving Benefits of Generative AI Algorithms
The latest trends in the global Generative AI in the Product Development Market highlight the substantial cost and time-saving benefits offered by generative AI algorithms. By automating and accelerating various stages of the product development lifecycle, including conceptualization, prototyping, and optimization, these algorithms streamline processes and enhance efficiency.
Companies leveraging generative AI experience reduced development cycles, lower production costs, and faster time-to-market for their products. This not only translates to tangible economic benefits but also empowers organizations to maintain a competitive edge in their respective markets.
Regional Analysis
In North America, the Generative AI in Product Development market holds a substantial 38% market share.
The Generative AI in Product Development market demonstrates varied growth dynamics across different regions, driven by distinct technological adoption rates and industrial activities. North America emerges as the dominating region, holding a 38% share of the global market. This prominence is bolstered by substantial investments in AI technologies and a robust presence of leading technology firms pioneering in AI-driven design solutions. North America's market benefits from a well-established tech infrastructure and a culture of innovation, leading to significant efficiencies in product development processes.
In Europe, the market is propelled by stringent regulations favoring innovative and sustainable product development practices, making Generative AI a strategic asset for European manufacturers. Europe's advanced manufacturing sector, especially in automotive and aerospace, leverages AI to enhance design precision and operational efficiency, further stimulating market growth.
Asia Pacific is witnessing rapid market expansion, fueled by industrial growth in emerging economies like China and India. The region's commitment to manufacturing excellence and digital transformation strategies are key drivers. The adoption of Generative AI in product design is expected to escalate, supported by growing technological expertise and government initiatives aimed at boosting AI capabilities.
The Middle East & Africa, and Latin America, though smaller in market size, are experiencing noticeable growth. These regions are gradually embracing digital tools in manufacturing, with Generative AI seen as a pivotal technology to drive future industrial advancements. The focus on diversifying economies and increasing competitive edge in manufacturing is expected to enhance the adoption of Generative AI solutions in these markets.
Key Regions and Countries
North America
- The US
- Canada
- Rest of North America
Europe
- Germany
- France
- The UK
- Spain
- Netherlands
- Russia
- Italy
- Rest of Europe
Asia-Pacific
- China
- Japan
- Singapore
- Thailand
- South Korea
- Vietnam
- India
- New Zealand
- Rest of Asia Pacific
Latin America
- Mexico
- Brazil
- Rest of Latin America
Middle East & Africa
- Saudi Arabia
- South Africa
- UAE
- Rest of Middle East & Africa
Key Players Analysis
In the rapidly evolving Generative AI in Product Development market of 2023, the role of key players such as IBM Corporation, Autodesk, Inc., and NVIDIA Corporation, among others, is pivotal. These companies are instrumental in shaping the market through continuous innovation and strategic partnerships.
IBM Corporation leverages its advanced artificial intelligence and machine learning capabilities to enhance product design and development efficiencies across industries. Their tools are designed to integrate seamlessly into existing workflows, thereby reducing the barrier to adoption and fostering market growth.
Autodesk, Inc., known for its robust design software, is incorporating AI to automate and optimize product development. Their solutions are particularly favored in architecture, engineering, and construction sectors for their ability to dramatically reduce time-to-market and enhance customization.
NVIDIA Corporation, primarily through its powerful GPU technologies, is enabling more complex and computationally intensive design processes. NVIDIA’s AI platforms are crucial for running sophisticated algorithms that drive innovation in product development, particularly in the automotive and electronics sectors.
Dassault Systèmes SE and PTC Inc. are also significant contributors, offering AI-driven design and simulation tools that help companies test and modify prototypes digitally, significantly reducing costs and product lifecycle times.
Ansys, Inc., Altair Engineering, Inc., and Synopsys, Inc. focus on the simulation and analysis part of product development, enhancing predictive capabilities that save costs and improve product reliability and performance.
Tech giants such as Microsoft Corporation and Google LLC are expanding their reach in the market by offering cloud-based AI solutions that empower smaller developers with access to cutting-edge tools without hefty investments.
Companies like Fictiv are revolutionizing the market by integrating AI with digital manufacturing, thus speeding up the prototype process and allowing for rapid iteration and testing.
Market Key Players
- IBM Corporation
- Autodesk, Inc.
- PTC Inc.
- Dassault Systèmes SE
- NVIDIA Corporation
- Ansys, Inc.
- Altair Engineering, Inc.
- Microsoft Corporation
- Google LLC
- Synopsys, Inc.
- Fictiv
- Other Key Players
Recent Development
- In June 2023, IBM Corporation launched a new AI-driven tool, designed to enhance product design and optimization. This tool integrates seamlessly with existing systems, allowing designers to leverage AI for more efficient prototype developments. The introduction of this tool marks IBM’s ongoing commitment to streamlining the product development lifecycle.
- In May 2023, PTC Inc. has recently stepped up its game in the generative design market by launching an upgraded version of its flagship product, which incorporates enhanced AI capabilities to predict design outcomes more accurately. This upgrade is expected to reduce the design to production time by up to 20% for their clients.
- In April 2023, Autodesk, Inc. announced the acquisition of a small AI design startup, enhancing its capabilities in AI in architectural design. This acquisition is aimed at expanding Autodesk's portfolio and integrating new AI functionalities that cater to the needs of modern construction and design professionals.
- In March 2023, Dassault Systèmes SE received a significant investment for its cloud-based AI design platforms, amounting to $50 million. This funding is directed towards expanding the global reach of their generative design solutions and enhancing the computational efficiency of their software.
Report Scope
Report Features Description Market Value (2023) USD 71.9 Million Forecast Revenue (2033) USD 1,593.1 Million CAGR (2024-2032) 37.4% Base Year for Estimation 2023 Historic Period 2016-2023 Forecast Period 2024-2033 Report Coverage Revenue Forecast, Market Dynamics, COVID-19 Impact, Competitive Landscape, Recent Developments Segments Covered By Component(Software, Services), By Application(Design Exploration, Prototyping and 3D Modelling, Product Customization, Feature Enhancement, Other Applications), By End-User Industry(Aerospace and Defence, Automotive, Healthcare, Consumer Electronics, Architecture and Construction, Other End-User Industries) Regional Analysis North America - The US, Canada, Rest of North America, Europe - Germany, France, The UK, Spain, Italy, Russia, Netherlands, Rest of Europe, Asia-Pacific - China, Japan, South Korea, India, New Zealand, Singapore, Thailand, Vietnam, Rest of Asia Pacific, Latin America - Brazil, Mexico, Rest of Latin America, Middle East & Africa - South Africa, Saudi Arabia, UAE, Rest of Middle East & Africa Competitive Landscape IBM Corporation, Autodesk, Inc., PTC Inc., Dassault Systèmes SE, NVIDIA Corporation, Ansys, Inc., Altair Engineering, Inc., Microsoft Corporation, Google LLC, Synopsys, Inc., Fictiv, Other Key Players Customization Scope Customization for segments, region/country-level will be provided. Moreover, additional customization can be done based on the requirements. Purchase Options We have three licenses to opt for Single User License, Multi-User License (Up to 5 Users), Corporate Use License (Unlimited User and Printable PDF) -
-
- IBM Corporation
- Autodesk, Inc.
- PTC Inc.
- Dassault Systèmes SE
- NVIDIA Corporation
- Ansys, Inc.
- Altair Engineering, Inc.
- Microsoft Corporation
- Google LLC
- Synopsys, Inc.
- Fictiv
- Other Key Players
Our Clients


View Our Licence Options
