
Generative AI in Health Insurance Market By Component (Software and Services), By Application, By Deployment Mode (Cloud-based and On-premises), By Region and Companies - Industry Segment Outlook, Market Assessment, Competition Scenario, Trends, and Forecast 2023-2032
38808
July 2023
168
Report Overview
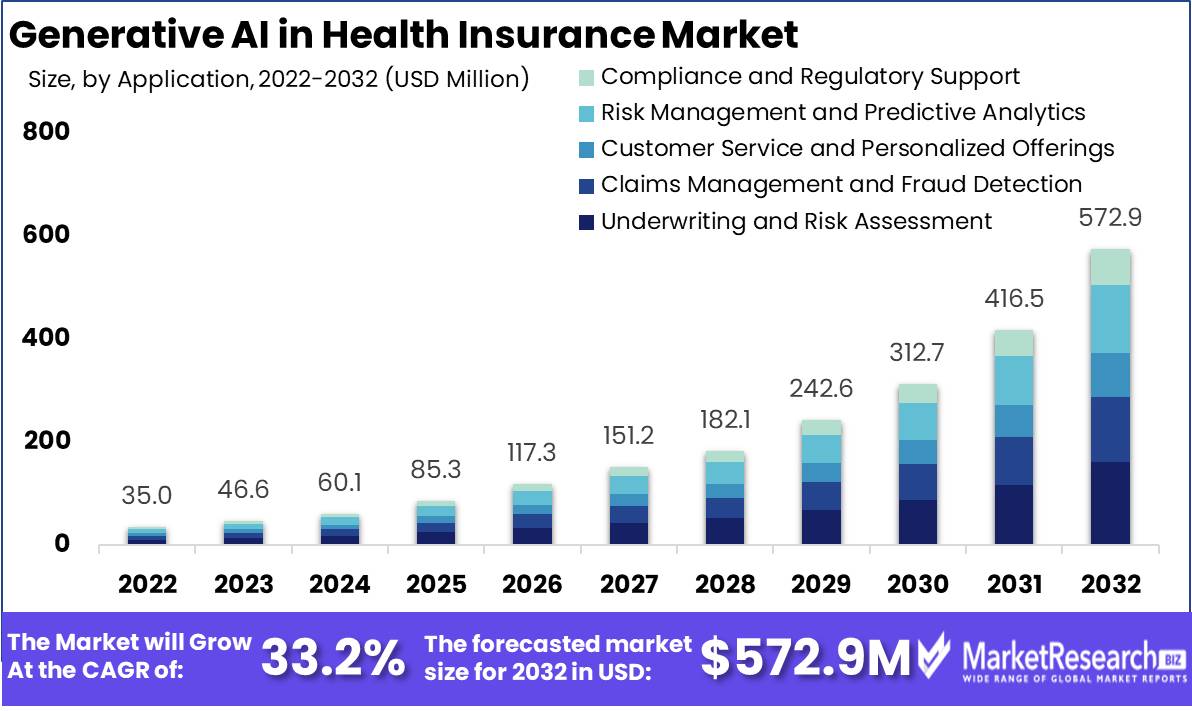
Generative AI in Health Insurance Market size is expected to be worth around USD 572.9 Mn by 2032 from USD 35.0 Mn in 2022, growing at a CAGR of 33.2% during the forecast period from 2023 to 2032.
The global market for generative AI in health insurance is emerging, and Generative AI has the potential to transform various aspects of the health insurance industry, offering innovative solutions to improve risk assessment, underwriting processes, claims management, fraud detection, and customer experience. One of the key drivers for the adoption of generative AI in health insurance is the ability to leverage vast amounts of healthcare data to assess individual health risks accurately. By applying advanced analytics and machine learning algorithms, generative AI can analyze medical records, demographics, lifestyle factors, and genetic information to provide more precise risk assessment and enable personalized insurance plans.
Driving factors
Increasing Complexity of Healthcare Data
The healthcare industry generates vast amounts of data from electronic health records, medical imaging, wearable devices, and other sources. Generative AI can handle the complexity and volume of this data, allowing insurers to extract valuable insights and make informed decisions.
Personalization and Precision:
Generative AI enables insurers to personalize insurance plans and services based on individual health profiles, demographics, and other relevant factors. This precision in risk assessment and underwriting can lead to more accurate pricing and coverage tailored to the specific needs of policyholders.
Restraining Factors
Cost and Return on Investment
Implementing generative AI solutions involves significant investments in technology, infrastructure, data management, and talent acquisition. The costs associated with deploying and maintaining AI systems may pose a barrier for some health insurance companies, especially smaller organizations.
Integration with Existing Systems
Integrating generative AI solutions into existing health insurance systems and workflows can be complex and require significant changes to infrastructure and processes. Legacy systems, interoperability issues, and resistance to change may slow down the adoption of generative AI in health insurance.
Covid-19 Impact on Generative AI in Health Insurance Market
Increased Demand for Digital Solutions:
The pandemic accelerated the healthcare industry's adoption of digital technologies and remote services. Health insurers increasingly turned to AI-powered solutions, including generative AI, to facilitate telehealth, remote claims processing, and customer support. The demand for digital solutions may have further accelerated the integration of generative AI into health insurance processes.
Impact on Claims Processing and Fraud Detection:
The COVID-19 pandemic led to an increase in healthcare claims related to testing, treatment, and hospitalization. Insurers faced challenges in processing these claims efficiently and accurately. Generative AI may have been utilized to streamline claims processing and enhance fraud detection capabilities to handle the surge in claims and identify potentially fraudulent activities.
By Component Analysis
Based on components, the market is segmented into software and services. Both software and services are important components in the implementation of generative AI in the health insurance industry. Software refers to the technology and algorithms used to develop and deploy generative AI models, while services encompass the implementation, customization, and ongoing support provided by AI solution providers.
By Application Analysis
Based on application, the market is segmented into underwriting and risk assessment, claims management and fraud detection, customer service and personalized offerings, risk management and predictive analytics, compliance, and regulatory support. Among these applications, the underwriting and risk assessment is expected to be the most lucrative in the global generative AI in the health insurance market. Underwriting and risk assessment are critical functions in the health insurance industry.
Generative AI can analyze vast amounts of data, such as medical histories, demographics, and lifestyle factors, to assess risk and determine appropriate underwriting decisions. This application is essential for accurate risk evaluation and pricing of insurance policies. Claims management is a key area where generative AI can be applied. AI models can analyze claims data, identify patterns, and detect anomalies to streamline claims processing and detect potentially fraudulent activities. This application helps improve the efficiency and accuracy of claims management while minimizing financial losses due to fraud.
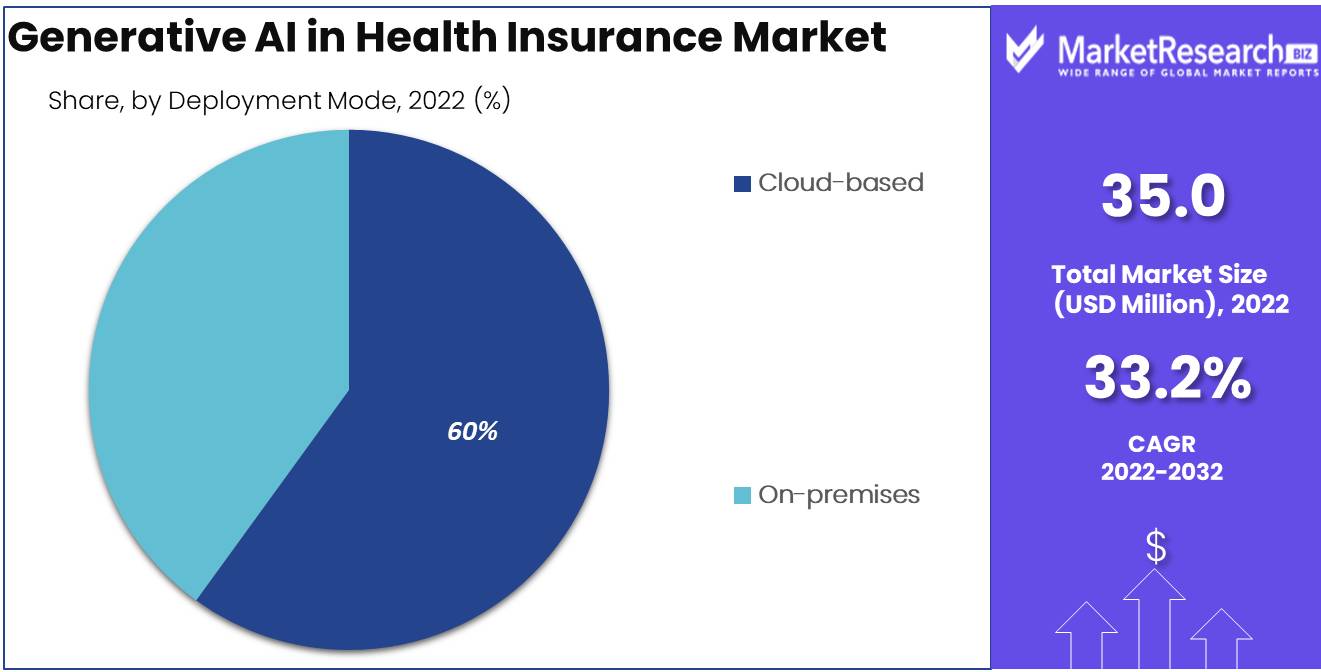
By Deployment Mode Analysis
Based on deployment mode, the market is segmented into cloud-based and on-premises. Among these, the cloud-based is expected to be the most lucrative in the global generative AI in the health insurance market. The Cloud-based deployments offer scalability, flexibility, and accessibility allowing organizations to leverage the power of generative AI without significant upfront infrastructure investments.
The cloud-based platforms provide collaboration, data sharing, and integration opportunities with other cloud-based services. On-premises deployments offer organizations more control over their data & infrastructure. Some health insurance companies may prefer to keep sensitive data on-premises due to privacy concerns or regulatory requirements. On-premises deployments require organizations to invest in their own hardware, software, and IT resources, which can provide higher customization and security.
Key Market Segments
Based on Component
- Software
- Services
Based on Application
- Underwriting and Risk Assessment
- Claims Management and Fraud Detection
- Customer Service and Personalized Offerings
- Risk Management and Predictive Analytics
- Compliance and Regulatory Support
Based on the Deployment Mode
- Cloud-based
- On-premises
Growth Opportunity
Enhanced Risk Assessment and Underwriting
Generative AI can significantly improve risk assessment and underwriting processes in health insurance. As AI algorithms become more sophisticated and capable of analyzing vast amounts of health data, insurers can make more accurate predictions of individual health risks. This enables personalized insurance plans, optimized premiums, and better risk management strategies.
Data-Driven Insights and Decision-Making
Generative AI in health insurance can provide valuable insights and support data-driven decision-making. AI algorithms can identify trends, patterns, and correlations by analyzing large volumes of healthcare data. These insights can help insurers optimize pricing strategies, develop targeted interventions, and improve risk management practices.
Latest Trends
Advanced Fraud Detection:
Generative AI models are being leveraged to enhance fraud detection capabilities in health insurance. By analyzing claims data and identifying patterns indicative of potential fraud, insurers can improve their ability to detect and prevent fraudulent activities, ultimately reducing losses and protecting the integrity of the insurance system.
Telehealth and Remote Services:
The COVID-19 pandemic has accelerated the adoption of telehealth and remote services in healthcare. Generative AI can support remote health monitoring, diagnosis, and treatment, as well as facilitate telehealth consultations and claims processing.
Natural Language Processing (NLP) Applications:
NLP techniques are being increasingly integrated into generative AI solutions in health insurance. NLP allows insurers to extract insights from unstructured healthcare data, such as medical records and doctor's notes, enabling better risk assessment, claims processing, and customer support.
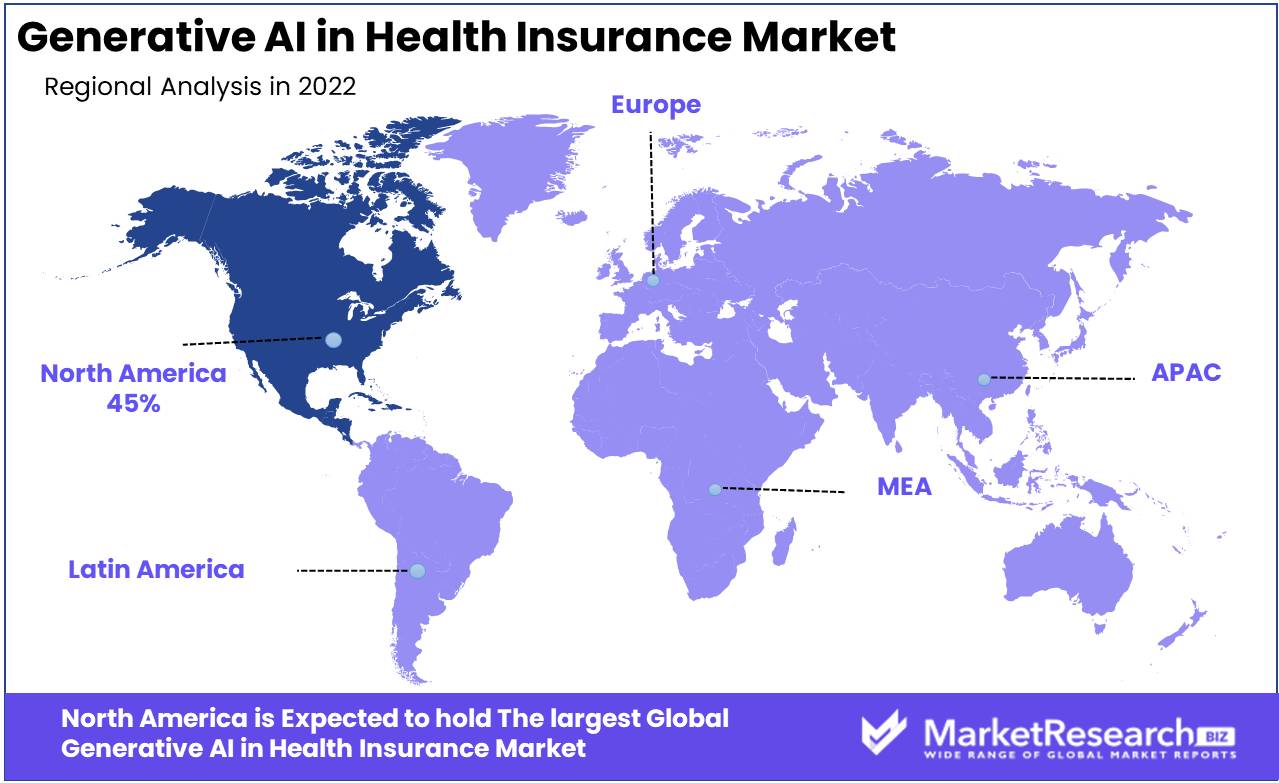
Regional Analysis
North America, especially the United States, has been at the forefront of adopting generative artificial intelligence technologies in health insurance. The region has a well-developed health insurance market and advanced AI capabilities. The United States, in particular, has seen a rise in AI-driven solutions in areas such as risk assessment, claims processing, and fraud detection.
Asia Pacific countries like China, Japan, South Korea, and Singapore are investing heavily in R&D focused on healthcare applications of generative AI technologies, with major countries investing heavily into healthcare research & development projects for healthcare applications specifically. The region's large population and growing healthcare needs make it an attractive market for generative AI solutions in health insurance.
Key Regions and Countries
North America
- US
- Canada
- Mexico
Western Europe
- Germany
- France
- The UK
- Spain
- Italy
- Portugal
- Ireland
- Austria
- Switzerland
- Benelux
- Nordic
- Rest of Western Europe
Eastern Europe
- Russia
- Poland
- The Czech Republic
- Greece
- Rest of Eastern Europe
APAC
- China
- Japan
- South Korea
- India
- Australia & New Zealand
- Indonesia
- Malaysia
- Philippines
- Singapore
- Thailand
- Vietnam
- Rest of APAC
Latin America
- Brazil
- Colombia
- Chile
- Argentina
- Costa Rica
- Rest of Latin America
Middle East & Africa
- Algeria
- Egypt
- Israel
- Kuwait
- Nigeria
- Saudi Arabia
- South Africa
- Turkey
- United Arab Emirates
- Rest of MEA
Market Share & Key Players Analysis
Startups and insurtech companies focusing on AI-driven solutions may play a significant role in the generative AI space within health insurance. Companies offer a range of AI-powered solutions and technologies that can be relevant to risk assessment, claims processing, fraud detection, and personalized healthcare in the health insurance sector.
Top Key Players in Generative AI in Health Insurance Market
- Oscar Health
- Tractable
- Anthem Inc.
- DataRobot Inc.
- Allstate
- Lemonade
- Microsoft Corporation
- Amazon Web Services
- Google LLC
- IBM Watson
- Other Key Players
Recent Development
- Jan 2023: Microsoft Azure OpenAI Service has become compliant with HIPAA (Health Insurance Portability and Accountability Act) regulations, making it even easier for healthcare companies to utilize generative AI to predict better medical outcomes.
Report Scope:
Report Features Description Market Value (2022) USD 35.0 Mn Forecast Revenue (2032) USD 572.9 Mn CAGR (2023-2032) 33.2% Base Year for Estimation 2022 Historic Period 2016-2022 Forecast Period 2023-2032 Report Coverage Revenue Forecast, Market Dynamics, COVID-19 Impact, Competitive Landscape, Recent Developments Segments Covered Based on Component (Software, Services)
Based on Application (Underwriting and Risk Assessment, Claims Management and Fraud Detection, Customer Service and Personalized Offerings, Risk Management and Predictive Analytics, Compliance and Regulatory Support)
Based on the Deployment Mode (Cloud-based, On-premises)Regional Analysis North America – The US, Canada, & Mexico; Western Europe – Germany, France, The UK, Spain, Italy, Portugal, Ireland, Austria, Switzerland, Benelux, Nordic, & Rest of Western Europe; Eastern Europe – Russia, Poland, The Czech Republic, Greece, & Rest of Eastern Europe; APAC – China, Japan, South Korea, India, Australia & New Zealand, Indonesia, Malaysia, Philippines, Singapore, Thailand, Vietnam, & Rest of APAC; Latin America – Brazil, Colombia, Chile, Argentina, Costa Rica, & Rest of Latin America; Middle East & Africa – Algeria, Egypt, Israel, Kuwait, Nigeria, Saudi Arabia, South Africa, Turkey, United Arab Emirates, & Rest of MEA Competitive Landscape Oscar Health, Tractable, Anthem Inc., DataRobot Inc., Allstate, Lemonade, Microsoft Corporation, Amazon Web Services, Google LLC, IBM Watson, Other Key Players Customization Scope Customization for segments, region/country-level will be provided. Moreover, additional customization can be done based on the requirements. Purchase Options We have three licenses to opt for: Single User License, Multi-User License (Up to 5 Users), Corporate Use License (Unlimited User and Printable PDF) - Oscar Health
- Tractable
- Anthem Inc.
- DataRobot Inc.
- Allstate
- Lemonade
- Microsoft Corporation
- Amazon Web Services
- Google LLC
- IBM Watson
- Other Key Players
- 1. Executive Summary
- 1.1. Definition
- 1.2. Taxonomy
- 1.3. Research Scope
- 1.4. Key Analysis
- 1.5. Key Findings by Major Segments
- 1.6. Top strategies by Major Players
- 2. Global Generative AI in Health Insurance Market Overview
- 2.1. Generative AI in Health Insurance Market Dynamics
- 2.1.1. Drivers
- 2.1.2. Opportunities
- 2.1.3. Restraints
- 2.1.4. Challenges
- 2.2. Macro-economic Factors
- 2.3. Regulatory Framework
- 2.4. Market Investment Feasibility Index
- 2.5. PEST Analysis
- 2.6. PORTER’S Five Force Analysis
- 2.7. Drivers & Restraints Impact Analysis
- 2.8. Industry Chain Analysis
- 2.9. Cost Structure Analysis
- 2.10. Marketing Strategy
- 2.11. Russia-Ukraine War Impact Analysis
- 2.12. Opportunity Map Analysis
- 2.13. Market Competition Scenario Analysis
- 2.14. Product Life Cycle Analysis
- 2.15. Opportunity Orbits
- 2.16. Manufacturer Intensity Map
- 2.17. Major Companies sales by Value & Volume
- 2.1. Generative AI in Health Insurance Market Dynamics
- 3. Global Generative AI in Health Insurance Market Analysis, Opportunity and Forecast, 2016-2032
- 3.1. Global Generative AI in Health Insurance Market Analysis, 2016-2021
- 3.2. Global Generative AI in Health Insurance Market Opportunity and Forecast, 2023-2032
- 3.3. Global Generative AI in Health Insurance Market Analysis, Opportunity and Forecast, By Based on Component, 2016-2032
- 3.3.1. Global Generative AI in Health Insurance Market Analysis by Based on Component: Introduction
- 3.3.2. Market Size Absolute $ Opportunity Analysis and Forecast, By Based on Component, 2016-2032
- 3.3.3. Software
- 3.3.4. Services
- 3.4. Global Generative AI in Health Insurance Market Analysis, Opportunity and Forecast, By Based on Application, 2016-2032
- 3.4.1. Global Generative AI in Health Insurance Market Analysis by Based on Application: Introduction
- 3.4.2. Market Size Absolute $ Opportunity Analysis and Forecast, By Based on Application, 2016-2032
- 3.4.3. Underwriting and Risk Assessment
- 3.4.4. Claims Management and Fraud Detection
- 3.4.5. Customer Service and Personalized Offerings
- 3.4.6. Risk Management and Predictive Analytics
- 3.4.7. Compliance and Regulatory Support
- 3.5. Global Generative AI in Health Insurance Market Analysis, Opportunity and Forecast, By Based on the Deployment Mode, 2016-2032
- 3.5.1. Global Generative AI in Health Insurance Market Analysis by Based on the Deployment Mode: Introduction
- 3.5.2. Market Size Absolute $ Opportunity Analysis and Forecast, By Based on the Deployment Mode, 2016-2032
- 3.5.3. Cloud-based
- 3.5.4. On-premises
- 4. North America Generative AI in Health Insurance Market Analysis, Opportunity and Forecast, 2016-2032
- 4.1. North America Generative AI in Health Insurance Market Analysis, 2016-2021
- 4.2. North America Generative AI in Health Insurance Market Opportunity and Forecast, 2023-2032
- 4.3. North America Generative AI in Health Insurance Market Analysis, Opportunity and Forecast, By Based on Component, 2016-2032
- 4.3.1. North America Generative AI in Health Insurance Market Analysis by Based on Component: Introduction
- 4.3.2. Market Size Absolute $ Opportunity Analysis and Forecast, By Based on Component, 2016-2032
- 4.3.3. Software
- 4.3.4. Services
- 4.4. North America Generative AI in Health Insurance Market Analysis, Opportunity and Forecast, By Based on Application, 2016-2032
- 4.4.1. North America Generative AI in Health Insurance Market Analysis by Based on Application: Introduction
- 4.4.2. Market Size Absolute $ Opportunity Analysis and Forecast, By Based on Application, 2016-2032
- 4.4.3. Underwriting and Risk Assessment
- 4.4.4. Claims Management and Fraud Detection
- 4.4.5. Customer Service and Personalized Offerings
- 4.4.6. Risk Management and Predictive Analytics
- 4.4.7. Compliance and Regulatory Support
- 4.5. North America Generative AI in Health Insurance Market Analysis, Opportunity and Forecast, By Based on the Deployment Mode, 2016-2032
- 4.5.1. North America Generative AI in Health Insurance Market Analysis by Based on the Deployment Mode: Introduction
- 4.5.2. Market Size Absolute $ Opportunity Analysis and Forecast, By Based on the Deployment Mode, 2016-2032
- 4.5.3. Cloud-based
- 4.5.4. On-premises
- 4.6. North America Generative AI in Health Insurance Market Analysis, Opportunity and Forecast, By Country , 2016-2032
- 4.6.1. North America Generative AI in Health Insurance Market Analysis by Country : Introduction
- 4.6.2. Market Size Absolute $ Opportunity Analysis and Forecast, Country , 2016-2032
- 4.6.2.1. The US
- 4.6.2.2. Canada
- 4.6.2.3. Mexico
- 5. Western Europe Generative AI in Health Insurance Market Analysis, Opportunity and Forecast, 2016-2032
- 5.1. Western Europe Generative AI in Health Insurance Market Analysis, 2016-2021
- 5.2. Western Europe Generative AI in Health Insurance Market Opportunity and Forecast, 2023-2032
- 5.3. Western Europe Generative AI in Health Insurance Market Analysis, Opportunity and Forecast, By Based on Component, 2016-2032
- 5.3.1. Western Europe Generative AI in Health Insurance Market Analysis by Based on Component: Introduction
- 5.3.2. Market Size Absolute $ Opportunity Analysis and Forecast, By Based on Component, 2016-2032
- 5.3.3. Software
- 5.3.4. Services
- 5.4. Western Europe Generative AI in Health Insurance Market Analysis, Opportunity and Forecast, By Based on Application, 2016-2032
- 5.4.1. Western Europe Generative AI in Health Insurance Market Analysis by Based on Application: Introduction
- 5.4.2. Market Size Absolute $ Opportunity Analysis and Forecast, By Based on Application, 2016-2032
- 5.4.3. Underwriting and Risk Assessment
- 5.4.4. Claims Management and Fraud Detection
- 5.4.5. Customer Service and Personalized Offerings
- 5.4.6. Risk Management and Predictive Analytics
- 5.4.7. Compliance and Regulatory Support
- 5.5. Western Europe Generative AI in Health Insurance Market Analysis, Opportunity and Forecast, By Based on the Deployment Mode, 2016-2032
- 5.5.1. Western Europe Generative AI in Health Insurance Market Analysis by Based on the Deployment Mode: Introduction
- 5.5.2. Market Size Absolute $ Opportunity Analysis and Forecast, By Based on the Deployment Mode, 2016-2032
- 5.5.3. Cloud-based
- 5.5.4. On-premises
- 5.6. Western Europe Generative AI in Health Insurance Market Analysis, Opportunity and Forecast, By Country , 2016-2032
- 5.6.1. Western Europe Generative AI in Health Insurance Market Analysis by Country : Introduction
- 5.6.2. Market Size Absolute $ Opportunity Analysis and Forecast, Country , 2016-2032
- 5.6.2.1. Germany
- 5.6.2.2. France
- 5.6.2.3. The UK
- 5.6.2.4. Spain
- 5.6.2.5. Italy
- 5.6.2.6. Portugal
- 5.6.2.7. Ireland
- 5.6.2.8. Austria
- 5.6.2.9. Switzerland
- 5.6.2.10. Benelux
- 5.6.2.11. Nordic
- 5.6.2.12. Rest of Western Europe
- 6. Eastern Europe Generative AI in Health Insurance Market Analysis, Opportunity and Forecast, 2016-2032
- 6.1. Eastern Europe Generative AI in Health Insurance Market Analysis, 2016-2021
- 6.2. Eastern Europe Generative AI in Health Insurance Market Opportunity and Forecast, 2023-2032
- 6.3. Eastern Europe Generative AI in Health Insurance Market Analysis, Opportunity and Forecast, By Based on Component, 2016-2032
- 6.3.1. Eastern Europe Generative AI in Health Insurance Market Analysis by Based on Component: Introduction
- 6.3.2. Market Size Absolute $ Opportunity Analysis and Forecast, By Based on Component, 2016-2032
- 6.3.3. Software
- 6.3.4. Services
- 6.4. Eastern Europe Generative AI in Health Insurance Market Analysis, Opportunity and Forecast, By Based on Application, 2016-2032
- 6.4.1. Eastern Europe Generative AI in Health Insurance Market Analysis by Based on Application: Introduction
- 6.4.2. Market Size Absolute $ Opportunity Analysis and Forecast, By Based on Application, 2016-2032
- 6.4.3. Underwriting and Risk Assessment
- 6.4.4. Claims Management and Fraud Detection
- 6.4.5. Customer Service and Personalized Offerings
- 6.4.6. Risk Management and Predictive Analytics
- 6.4.7. Compliance and Regulatory Support
- 6.5. Eastern Europe Generative AI in Health Insurance Market Analysis, Opportunity and Forecast, By Based on the Deployment Mode, 2016-2032
- 6.5.1. Eastern Europe Generative AI in Health Insurance Market Analysis by Based on the Deployment Mode: Introduction
- 6.5.2. Market Size Absolute $ Opportunity Analysis and Forecast, By Based on the Deployment Mode, 2016-2032
- 6.5.3. Cloud-based
- 6.5.4. On-premises
- 6.6. Eastern Europe Generative AI in Health Insurance Market Analysis, Opportunity and Forecast, By Country , 2016-2032
- 6.6.1. Eastern Europe Generative AI in Health Insurance Market Analysis by Country : Introduction
- 6.6.2. Market Size Absolute $ Opportunity Analysis and Forecast, Country , 2016-2032
- 6.6.2.1. Russia
- 6.6.2.2. Poland
- 6.6.2.3. The Czech Republic
- 6.6.2.4. Greece
- 6.6.2.5. Rest of Eastern Europe
- 7. APAC Generative AI in Health Insurance Market Analysis, Opportunity and Forecast, 2016-2032
- 7.1. APAC Generative AI in Health Insurance Market Analysis, 2016-2021
- 7.2. APAC Generative AI in Health Insurance Market Opportunity and Forecast, 2023-2032
- 7.3. APAC Generative AI in Health Insurance Market Analysis, Opportunity and Forecast, By Based on Component, 2016-2032
- 7.3.1. APAC Generative AI in Health Insurance Market Analysis by Based on Component: Introduction
- 7.3.2. Market Size Absolute $ Opportunity Analysis and Forecast, By Based on Component, 2016-2032
- 7.3.3. Software
- 7.3.4. Services
- 7.4. APAC Generative AI in Health Insurance Market Analysis, Opportunity and Forecast, By Based on Application, 2016-2032
- 7.4.1. APAC Generative AI in Health Insurance Market Analysis by Based on Application: Introduction
- 7.4.2. Market Size Absolute $ Opportunity Analysis and Forecast, By Based on Application, 2016-2032
- 7.4.3. Underwriting and Risk Assessment
- 7.4.4. Claims Management and Fraud Detection
- 7.4.5. Customer Service and Personalized Offerings
- 7.4.6. Risk Management and Predictive Analytics
- 7.4.7. Compliance and Regulatory Support
- 7.5. APAC Generative AI in Health Insurance Market Analysis, Opportunity and Forecast, By Based on the Deployment Mode, 2016-2032
- 7.5.1. APAC Generative AI in Health Insurance Market Analysis by Based on the Deployment Mode: Introduction
- 7.5.2. Market Size Absolute $ Opportunity Analysis and Forecast, By Based on the Deployment Mode, 2016-2032
- 7.5.3. Cloud-based
- 7.5.4. On-premises
- 7.6. APAC Generative AI in Health Insurance Market Analysis, Opportunity and Forecast, By Country , 2016-2032
- 7.6.1. APAC Generative AI in Health Insurance Market Analysis by Country : Introduction
- 7.6.2. Market Size Absolute $ Opportunity Analysis and Forecast, Country , 2016-2032
- 7.6.2.1. China
- 7.6.2.2. Japan
- 7.6.2.3. South Korea
- 7.6.2.4. India
- 7.6.2.5. Australia & New Zeland
- 7.6.2.6. Indonesia
- 7.6.2.7. Malaysia
- 7.6.2.8. Philippines
- 7.6.2.9. Singapore
- 7.6.2.10. Thailand
- 7.6.2.11. Vietnam
- 7.6.2.12. Rest of APAC
- 8. Latin America Generative AI in Health Insurance Market Analysis, Opportunity and Forecast, 2016-2032
- 8.1. Latin America Generative AI in Health Insurance Market Analysis, 2016-2021
- 8.2. Latin America Generative AI in Health Insurance Market Opportunity and Forecast, 2023-2032
- 8.3. Latin America Generative AI in Health Insurance Market Analysis, Opportunity and Forecast, By Based on Component, 2016-2032
- 8.3.1. Latin America Generative AI in Health Insurance Market Analysis by Based on Component: Introduction
- 8.3.2. Market Size Absolute $ Opportunity Analysis and Forecast, By Based on Component, 2016-2032
- 8.3.3. Software
- 8.3.4. Services
- 8.4. Latin America Generative AI in Health Insurance Market Analysis, Opportunity and Forecast, By Based on Application, 2016-2032
- 8.4.1. Latin America Generative AI in Health Insurance Market Analysis by Based on Application: Introduction
- 8.4.2. Market Size Absolute $ Opportunity Analysis and Forecast, By Based on Application, 2016-2032
- 8.4.3. Underwriting and Risk Assessment
- 8.4.4. Claims Management and Fraud Detection
- 8.4.5. Customer Service and Personalized Offerings
- 8.4.6. Risk Management and Predictive Analytics
- 8.4.7. Compliance and Regulatory Support
- 8.5. Latin America Generative AI in Health Insurance Market Analysis, Opportunity and Forecast, By Based on the Deployment Mode, 2016-2032
- 8.5.1. Latin America Generative AI in Health Insurance Market Analysis by Based on the Deployment Mode: Introduction
- 8.5.2. Market Size Absolute $ Opportunity Analysis and Forecast, By Based on the Deployment Mode, 2016-2032
- 8.5.3. Cloud-based
- 8.5.4. On-premises
- 8.6. Latin America Generative AI in Health Insurance Market Analysis, Opportunity and Forecast, By Country , 2016-2032
- 8.6.1. Latin America Generative AI in Health Insurance Market Analysis by Country : Introduction
- 8.6.2. Market Size Absolute $ Opportunity Analysis and Forecast, Country , 2016-2032
- 8.6.2.1. Brazil
- 8.6.2.2. Colombia
- 8.6.2.3. Chile
- 8.6.2.4. Argentina
- 8.6.2.5. Costa Rica
- 8.6.2.6. Rest of Latin America
- 9. Middle East & Africa Generative AI in Health Insurance Market Analysis, Opportunity and Forecast, 2016-2032
- 9.1. Middle East & Africa Generative AI in Health Insurance Market Analysis, 2016-2021
- 9.2. Middle East & Africa Generative AI in Health Insurance Market Opportunity and Forecast, 2023-2032
- 9.3. Middle East & Africa Generative AI in Health Insurance Market Analysis, Opportunity and Forecast, By Based on Component, 2016-2032
- 9.3.1. Middle East & Africa Generative AI in Health Insurance Market Analysis by Based on Component: Introduction
- 9.3.2. Market Size Absolute $ Opportunity Analysis and Forecast, By Based on Component, 2016-2032
- 9.3.3. Software
- 9.3.4. Services
- 9.4. Middle East & Africa Generative AI in Health Insurance Market Analysis, Opportunity and Forecast, By Based on Application, 2016-2032
- 9.4.1. Middle East & Africa Generative AI in Health Insurance Market Analysis by Based on Application: Introduction
- 9.4.2. Market Size Absolute $ Opportunity Analysis and Forecast, By Based on Application, 2016-2032
- 9.4.3. Underwriting and Risk Assessment
- 9.4.4. Claims Management and Fraud Detection
- 9.4.5. Customer Service and Personalized Offerings
- 9.4.6. Risk Management and Predictive Analytics
- 9.4.7. Compliance and Regulatory Support
- 9.5. Middle East & Africa Generative AI in Health Insurance Market Analysis, Opportunity and Forecast, By Based on the Deployment Mode, 2016-2032
- 9.5.1. Middle East & Africa Generative AI in Health Insurance Market Analysis by Based on the Deployment Mode: Introduction
- 9.5.2. Market Size Absolute $ Opportunity Analysis and Forecast, By Based on the Deployment Mode, 2016-2032
- 9.5.3. Cloud-based
- 9.5.4. On-premises
- 9.6. Middle East & Africa Generative AI in Health Insurance Market Analysis, Opportunity and Forecast, By Country , 2016-2032
- 9.6.1. Middle East & Africa Generative AI in Health Insurance Market Analysis by Country : Introduction
- 9.6.2. Market Size Absolute $ Opportunity Analysis and Forecast, Country , 2016-2032
- 9.6.2.1. Algeria
- 9.6.2.2. Egypt
- 9.6.2.3. Israel
- 9.6.2.4. Kuwait
- 9.6.2.5. Nigeria
- 9.6.2.6. Saudi Arabia
- 9.6.2.7. South Africa
- 9.6.2.8. Turkey
- 9.6.2.9. The UAE
- 9.6.2.10. Rest of MEA
- 10. Global Generative AI in Health Insurance Market Analysis, Opportunity and Forecast, By Region , 2016-2032
- 10.1. Global Generative AI in Health Insurance Market Analysis by Region : Introduction
- 10.2. Market Size Absolute $ Opportunity Analysis and Forecast, By Region , 2016-2032
- 10.2.1. North America
- 10.2.2. Western Europe
- 10.2.3. Eastern Europe
- 10.2.4. APAC
- 10.2.5. Latin America
- 10.2.6. Middle East & Africa
- 11. Global Generative AI in Health Insurance Market Competitive Landscape, Market Share Analysis, and Company Profiles
- 11.1. Market Share Analysis
- 11.2. Company Profiles
- 11.3. Oscar Health
- 11.3.1. Company Overview
- 11.3.2. Financial Highlights
- 11.3.3. Product Portfolio
- 11.3.4. SWOT Analysis
- 11.3.5. Key Strategies and Developments
- 11.4. Tractable
- 11.4.1. Company Overview
- 11.4.2. Financial Highlights
- 11.4.3. Product Portfolio
- 11.4.4. SWOT Analysis
- 11.4.5. Key Strategies and Developments
- 11.5. Anthem Inc.
- 11.5.1. Company Overview
- 11.5.2. Financial Highlights
- 11.5.3. Product Portfolio
- 11.5.4. SWOT Analysis
- 11.5.5. Key Strategies and Developments
- 11.6. DataRobot Inc.
- 11.6.1. Company Overview
- 11.6.2. Financial Highlights
- 11.6.3. Product Portfolio
- 11.6.4. SWOT Analysis
- 11.6.5. Key Strategies and Developments
- 11.7. Allstate
- 11.7.1. Company Overview
- 11.7.2. Financial Highlights
- 11.7.3. Product Portfolio
- 11.7.4. SWOT Analysis
- 11.7.5. Key Strategies and Developments
- 11.8. Lemonade
- 11.8.1. Company Overview
- 11.8.2. Financial Highlights
- 11.8.3. Product Portfolio
- 11.8.4. SWOT Analysis
- 11.8.5. Key Strategies and Developments
- 11.9. Microsoft Corporation
- 11.9.1. Company Overview
- 11.9.2. Financial Highlights
- 11.9.3. Product Portfolio
- 11.9.4. SWOT Analysis
- 11.9.5. Key Strategies and Developments
- 11.10. Amazon Web Services
- 11.10.1. Company Overview
- 11.10.2. Financial Highlights
- 11.10.3. Product Portfolio
- 11.10.4. SWOT Analysis
- 11.10.5. Key Strategies and Developments
- 11.11. Google LLC
- 11.11.1. Company Overview
- 11.11.2. Financial Highlights
- 11.11.3. Product Portfolio
- 11.11.4. SWOT Analysis
- 11.11.5. Key Strategies and Developments
- 11.12. IBM Watson
- 11.12.1. Company Overview
- 11.12.2. Financial Highlights
- 11.12.3. Product Portfolio
- 11.12.4. SWOT Analysis
- 11.12.5. Key Strategies and Developments
- 11.13. Other Key Players
- 11.13.1. Company Overview
- 11.13.2. Financial Highlights
- 11.13.3. Product Portfolio
- 11.13.4. SWOT Analysis
- 11.13.5. Key Strategies and Developments
- 12. Assumptions and Acronyms
- 13. Research Methodology
- 14. Contact
- List of Figures
- Figure 1: Global Generative AI in Health Insurance Market Revenue (US$ Mn) Market Share by Based on Component in 2022
- Figure 2: Global Generative AI in Health Insurance Market Attractiveness Analysis by Based on Component, 2016-2032
- Figure 3: Global Generative AI in Health Insurance Market Revenue (US$ Mn) Market Share by Based on Applicationin 2022
- Figure 4: Global Generative AI in Health Insurance Market Attractiveness Analysis by Based on Application, 2016-2032
- Figure 5: Global Generative AI in Health Insurance Market Revenue (US$ Mn) Market Share by Based on the Deployment Modein 2022
- Figure 6: Global Generative AI in Health Insurance Market Attractiveness Analysis by Based on the Deployment Mode, 2016-2032
- Figure 7: Global Generative AI in Health Insurance Market Revenue (US$ Mn) Market Share by Region in 2022
- Figure 8: Global Generative AI in Health Insurance Market Attractiveness Analysis by Region, 2016-2032
- Figure 9: Global Generative AI in Health Insurance Market Revenue (US$ Mn) (2016-2032)
- Figure 10: Global Generative AI in Health Insurance Market Revenue (US$ Mn) Comparison by Region (2016-2032)
- Figure 11: Global Generative AI in Health Insurance Market Revenue (US$ Mn) Comparison by Based on Component (2016-2032)
- Figure 12: Global Generative AI in Health Insurance Market Revenue (US$ Mn) Comparison by Based on Application (2016-2032)
- Figure 13: Global Generative AI in Health Insurance Market Revenue (US$ Mn) Comparison by Based on the Deployment Mode (2016-2032)
- Figure 14: Global Generative AI in Health Insurance Market Y-o-Y Growth Rate Comparison by Region (2016-2032)
- Figure 15: Global Generative AI in Health Insurance Market Y-o-Y Growth Rate Comparison by Based on Component (2016-2032)
- Figure 16: Global Generative AI in Health Insurance Market Y-o-Y Growth Rate Comparison by Based on Application (2016-2032)
- Figure 17: Global Generative AI in Health Insurance Market Y-o-Y Growth Rate Comparison by Based on the Deployment Mode (2016-2032)
- Figure 18: Global Generative AI in Health Insurance Market Share Comparison by Region (2016-2032)
- Figure 19: Global Generative AI in Health Insurance Market Share Comparison by Based on Component (2016-2032)
- Figure 20: Global Generative AI in Health Insurance Market Share Comparison by Based on Application (2016-2032)
- Figure 21: Global Generative AI in Health Insurance Market Share Comparison by Based on the Deployment Mode (2016-2032)
- Figure 22: North America Generative AI in Health Insurance Market Revenue (US$ Mn) Market Share by Based on Componentin 2022
- Figure 23: North America Generative AI in Health Insurance Market Attractiveness Analysis by Based on Component, 2016-2032
- Figure 24: North America Generative AI in Health Insurance Market Revenue (US$ Mn) Market Share by Based on Applicationin 2022
- Figure 25: North America Generative AI in Health Insurance Market Attractiveness Analysis by Based on Application, 2016-2032
- Figure 26: North America Generative AI in Health Insurance Market Revenue (US$ Mn) Market Share by Based on the Deployment Modein 2022
- Figure 27: North America Generative AI in Health Insurance Market Attractiveness Analysis by Based on the Deployment Mode, 2016-2032
- Figure 28: North America Generative AI in Health Insurance Market Revenue (US$ Mn) Market Share by Country in 2022
- Figure 29: North America Generative AI in Health Insurance Market Attractiveness Analysis by Country, 2016-2032
- Figure 30: North America Generative AI in Health Insurance Market Revenue (US$ Mn) (2016-2032)
- Figure 31: North America Generative AI in Health Insurance Market Revenue (US$ Mn) Comparison by Country (2016-2032)
- Figure 32: North America Generative AI in Health Insurance Market Revenue (US$ Mn) Comparison by Based on Component (2016-2032)
- Figure 33: North America Generative AI in Health Insurance Market Revenue (US$ Mn) Comparison by Based on Application (2016-2032)
- Figure 34: North America Generative AI in Health Insurance Market Revenue (US$ Mn) Comparison by Based on the Deployment Mode (2016-2032)
- Figure 35: North America Generative AI in Health Insurance Market Y-o-Y Growth Rate Comparison by Country (2016-2032)
- Figure 36: North America Generative AI in Health Insurance Market Y-o-Y Growth Rate Comparison by Based on Component (2016-2032)
- Figure 37: North America Generative AI in Health Insurance Market Y-o-Y Growth Rate Comparison by Based on Application (2016-2032)
- Figure 38: North America Generative AI in Health Insurance Market Y-o-Y Growth Rate Comparison by Based on the Deployment Mode (2016-2032)
- Figure 39: North America Generative AI in Health Insurance Market Share Comparison by Country (2016-2032)
- Figure 40: North America Generative AI in Health Insurance Market Share Comparison by Based on Component (2016-2032)
- Figure 41: North America Generative AI in Health Insurance Market Share Comparison by Based on Application (2016-2032)
- Figure 42: North America Generative AI in Health Insurance Market Share Comparison by Based on the Deployment Mode (2016-2032)
- Figure 43: Western Europe Generative AI in Health Insurance Market Revenue (US$ Mn) Market Share by Based on Componentin 2022
- Figure 44: Western Europe Generative AI in Health Insurance Market Attractiveness Analysis by Based on Component, 2016-2032
- Figure 45: Western Europe Generative AI in Health Insurance Market Revenue (US$ Mn) Market Share by Based on Applicationin 2022
- Figure 46: Western Europe Generative AI in Health Insurance Market Attractiveness Analysis by Based on Application, 2016-2032
- Figure 47: Western Europe Generative AI in Health Insurance Market Revenue (US$ Mn) Market Share by Based on the Deployment Modein 2022
- Figure 48: Western Europe Generative AI in Health Insurance Market Attractiveness Analysis by Based on the Deployment Mode, 2016-2032
- Figure 49: Western Europe Generative AI in Health Insurance Market Revenue (US$ Mn) Market Share by Country in 2022
- Figure 50: Western Europe Generative AI in Health Insurance Market Attractiveness Analysis by Country, 2016-2032
- Figure 51: Western Europe Generative AI in Health Insurance Market Revenue (US$ Mn) (2016-2032)
- Figure 52: Western Europe Generative AI in Health Insurance Market Revenue (US$ Mn) Comparison by Country (2016-2032)
- Figure 53: Western Europe Generative AI in Health Insurance Market Revenue (US$ Mn) Comparison by Based on Component (2016-2032)
- Figure 54: Western Europe Generative AI in Health Insurance Market Revenue (US$ Mn) Comparison by Based on Application (2016-2032)
- Figure 55: Western Europe Generative AI in Health Insurance Market Revenue (US$ Mn) Comparison by Based on the Deployment Mode (2016-2032)
- Figure 56: Western Europe Generative AI in Health Insurance Market Y-o-Y Growth Rate Comparison by Country (2016-2032)
- Figure 57: Western Europe Generative AI in Health Insurance Market Y-o-Y Growth Rate Comparison by Based on Component (2016-2032)
- Figure 58: Western Europe Generative AI in Health Insurance Market Y-o-Y Growth Rate Comparison by Based on Application (2016-2032)
- Figure 59: Western Europe Generative AI in Health Insurance Market Y-o-Y Growth Rate Comparison by Based on the Deployment Mode (2016-2032)
- Figure 60: Western Europe Generative AI in Health Insurance Market Share Comparison by Country (2016-2032)
- Figure 61: Western Europe Generative AI in Health Insurance Market Share Comparison by Based on Component (2016-2032)
- Figure 62: Western Europe Generative AI in Health Insurance Market Share Comparison by Based on Application (2016-2032)
- Figure 63: Western Europe Generative AI in Health Insurance Market Share Comparison by Based on the Deployment Mode (2016-2032)
- Figure 64: Eastern Europe Generative AI in Health Insurance Market Revenue (US$ Mn) Market Share by Based on Componentin 2022
- Figure 65: Eastern Europe Generative AI in Health Insurance Market Attractiveness Analysis by Based on Component, 2016-2032
- Figure 66: Eastern Europe Generative AI in Health Insurance Market Revenue (US$ Mn) Market Share by Based on Applicationin 2022
- Figure 67: Eastern Europe Generative AI in Health Insurance Market Attractiveness Analysis by Based on Application, 2016-2032
- Figure 68: Eastern Europe Generative AI in Health Insurance Market Revenue (US$ Mn) Market Share by Based on the Deployment Modein 2022
- Figure 69: Eastern Europe Generative AI in Health Insurance Market Attractiveness Analysis by Based on the Deployment Mode, 2016-2032
- Figure 70: Eastern Europe Generative AI in Health Insurance Market Revenue (US$ Mn) Market Share by Country in 2022
- Figure 71: Eastern Europe Generative AI in Health Insurance Market Attractiveness Analysis by Country, 2016-2032
- Figure 72: Eastern Europe Generative AI in Health Insurance Market Revenue (US$ Mn) (2016-2032)
- Figure 73: Eastern Europe Generative AI in Health Insurance Market Revenue (US$ Mn) Comparison by Country (2016-2032)
- Figure 74: Eastern Europe Generative AI in Health Insurance Market Revenue (US$ Mn) Comparison by Based on Component (2016-2032)
- Figure 75: Eastern Europe Generative AI in Health Insurance Market Revenue (US$ Mn) Comparison by Based on Application (2016-2032)
- Figure 76: Eastern Europe Generative AI in Health Insurance Market Revenue (US$ Mn) Comparison by Based on the Deployment Mode (2016-2032)
- Figure 77: Eastern Europe Generative AI in Health Insurance Market Y-o-Y Growth Rate Comparison by Country (2016-2032)
- Figure 78: Eastern Europe Generative AI in Health Insurance Market Y-o-Y Growth Rate Comparison by Based on Component (2016-2032)
- Figure 79: Eastern Europe Generative AI in Health Insurance Market Y-o-Y Growth Rate Comparison by Based on Application (2016-2032)
- Figure 80: Eastern Europe Generative AI in Health Insurance Market Y-o-Y Growth Rate Comparison by Based on the Deployment Mode (2016-2032)
- Figure 81: Eastern Europe Generative AI in Health Insurance Market Share Comparison by Country (2016-2032)
- Figure 82: Eastern Europe Generative AI in Health Insurance Market Share Comparison by Based on Component (2016-2032)
- Figure 83: Eastern Europe Generative AI in Health Insurance Market Share Comparison by Based on Application (2016-2032)
- Figure 84: Eastern Europe Generative AI in Health Insurance Market Share Comparison by Based on the Deployment Mode (2016-2032)
- Figure 85: APAC Generative AI in Health Insurance Market Revenue (US$ Mn) Market Share by Based on Componentin 2022
- Figure 86: APAC Generative AI in Health Insurance Market Attractiveness Analysis by Based on Component, 2016-2032
- Figure 87: APAC Generative AI in Health Insurance Market Revenue (US$ Mn) Market Share by Based on Applicationin 2022
- Figure 88: APAC Generative AI in Health Insurance Market Attractiveness Analysis by Based on Application, 2016-2032
- Figure 89: APAC Generative AI in Health Insurance Market Revenue (US$ Mn) Market Share by Based on the Deployment Modein 2022
- Figure 90: APAC Generative AI in Health Insurance Market Attractiveness Analysis by Based on the Deployment Mode, 2016-2032
- Figure 91: APAC Generative AI in Health Insurance Market Revenue (US$ Mn) Market Share by Country in 2022
- Figure 92: APAC Generative AI in Health Insurance Market Attractiveness Analysis by Country, 2016-2032
- Figure 93: APAC Generative AI in Health Insurance Market Revenue (US$ Mn) (2016-2032)
- Figure 94: APAC Generative AI in Health Insurance Market Revenue (US$ Mn) Comparison by Country (2016-2032)
- Figure 95: APAC Generative AI in Health Insurance Market Revenue (US$ Mn) Comparison by Based on Component (2016-2032)
- Figure 96: APAC Generative AI in Health Insurance Market Revenue (US$ Mn) Comparison by Based on Application (2016-2032)
- Figure 97: APAC Generative AI in Health Insurance Market Revenue (US$ Mn) Comparison by Based on the Deployment Mode (2016-2032)
- Figure 98: APAC Generative AI in Health Insurance Market Y-o-Y Growth Rate Comparison by Country (2016-2032)
- Figure 99: APAC Generative AI in Health Insurance Market Y-o-Y Growth Rate Comparison by Based on Component (2016-2032)
- Figure 100: APAC Generative AI in Health Insurance Market Y-o-Y Growth Rate Comparison by Based on Application (2016-2032)
- Figure 101: APAC Generative AI in Health Insurance Market Y-o-Y Growth Rate Comparison by Based on the Deployment Mode (2016-2032)
- Figure 102: APAC Generative AI in Health Insurance Market Share Comparison by Country (2016-2032)
- Figure 103: APAC Generative AI in Health Insurance Market Share Comparison by Based on Component (2016-2032)
- Figure 104: APAC Generative AI in Health Insurance Market Share Comparison by Based on Application (2016-2032)
- Figure 105: APAC Generative AI in Health Insurance Market Share Comparison by Based on the Deployment Mode (2016-2032)
- Figure 106: Latin America Generative AI in Health Insurance Market Revenue (US$ Mn) Market Share by Based on Componentin 2022
- Figure 107: Latin America Generative AI in Health Insurance Market Attractiveness Analysis by Based on Component, 2016-2032
- Figure 108: Latin America Generative AI in Health Insurance Market Revenue (US$ Mn) Market Share by Based on Applicationin 2022
- Figure 109: Latin America Generative AI in Health Insurance Market Attractiveness Analysis by Based on Application, 2016-2032
- Figure 110: Latin America Generative AI in Health Insurance Market Revenue (US$ Mn) Market Share by Based on the Deployment Modein 2022
- Figure 111: Latin America Generative AI in Health Insurance Market Attractiveness Analysis by Based on the Deployment Mode, 2016-2032
- Figure 112: Latin America Generative AI in Health Insurance Market Revenue (US$ Mn) Market Share by Country in 2022
- Figure 113: Latin America Generative AI in Health Insurance Market Attractiveness Analysis by Country, 2016-2032
- Figure 114: Latin America Generative AI in Health Insurance Market Revenue (US$ Mn) (2016-2032)
- Figure 115: Latin America Generative AI in Health Insurance Market Revenue (US$ Mn) Comparison by Country (2016-2032)
- Figure 116: Latin America Generative AI in Health Insurance Market Revenue (US$ Mn) Comparison by Based on Component (2016-2032)
- Figure 117: Latin America Generative AI in Health Insurance Market Revenue (US$ Mn) Comparison by Based on Application (2016-2032)
- Figure 118: Latin America Generative AI in Health Insurance Market Revenue (US$ Mn) Comparison by Based on the Deployment Mode (2016-2032)
- Figure 119: Latin America Generative AI in Health Insurance Market Y-o-Y Growth Rate Comparison by Country (2016-2032)
- Figure 120: Latin America Generative AI in Health Insurance Market Y-o-Y Growth Rate Comparison by Based on Component (2016-2032)
- Figure 121: Latin America Generative AI in Health Insurance Market Y-o-Y Growth Rate Comparison by Based on Application (2016-2032)
- Figure 122: Latin America Generative AI in Health Insurance Market Y-o-Y Growth Rate Comparison by Based on the Deployment Mode (2016-2032)
- Figure 123: Latin America Generative AI in Health Insurance Market Share Comparison by Country (2016-2032)
- Figure 124: Latin America Generative AI in Health Insurance Market Share Comparison by Based on Component (2016-2032)
- Figure 125: Latin America Generative AI in Health Insurance Market Share Comparison by Based on Application (2016-2032)
- Figure 126: Latin America Generative AI in Health Insurance Market Share Comparison by Based on the Deployment Mode (2016-2032)
- Figure 127: Middle East & Africa Generative AI in Health Insurance Market Revenue (US$ Mn) Market Share by Based on Componentin 2022
- Figure 128: Middle East & Africa Generative AI in Health Insurance Market Attractiveness Analysis by Based on Component, 2016-2032
- Figure 129: Middle East & Africa Generative AI in Health Insurance Market Revenue (US$ Mn) Market Share by Based on Applicationin 2022
- Figure 130: Middle East & Africa Generative AI in Health Insurance Market Attractiveness Analysis by Based on Application, 2016-2032
- Figure 131: Middle East & Africa Generative AI in Health Insurance Market Revenue (US$ Mn) Market Share by Based on the Deployment Modein 2022
- Figure 132: Middle East & Africa Generative AI in Health Insurance Market Attractiveness Analysis by Based on the Deployment Mode, 2016-2032
- Figure 133: Middle East & Africa Generative AI in Health Insurance Market Revenue (US$ Mn) Market Share by Country in 2022
- Figure 134: Middle East & Africa Generative AI in Health Insurance Market Attractiveness Analysis by Country, 2016-2032
- Figure 135: Middle East & Africa Generative AI in Health Insurance Market Revenue (US$ Mn) (2016-2032)
- Figure 136: Middle East & Africa Generative AI in Health Insurance Market Revenue (US$ Mn) Comparison by Country (2016-2032)
- Figure 137: Middle East & Africa Generative AI in Health Insurance Market Revenue (US$ Mn) Comparison by Based on Component (2016-2032)
- Figure 138: Middle East & Africa Generative AI in Health Insurance Market Revenue (US$ Mn) Comparison by Based on Application (2016-2032)
- Figure 139: Middle East & Africa Generative AI in Health Insurance Market Revenue (US$ Mn) Comparison by Based on the Deployment Mode (2016-2032)
- Figure 140: Middle East & Africa Generative AI in Health Insurance Market Y-o-Y Growth Rate Comparison by Country (2016-2032)
- Figure 141: Middle East & Africa Generative AI in Health Insurance Market Y-o-Y Growth Rate Comparison by Based on Component (2016-2032)
- Figure 142: Middle East & Africa Generative AI in Health Insurance Market Y-o-Y Growth Rate Comparison by Based on Application (2016-2032)
- Figure 143: Middle East & Africa Generative AI in Health Insurance Market Y-o-Y Growth Rate Comparison by Based on the Deployment Mode (2016-2032)
- Figure 144: Middle East & Africa Generative AI in Health Insurance Market Share Comparison by Country (2016-2032)
- Figure 145: Middle East & Africa Generative AI in Health Insurance Market Share Comparison by Based on Component (2016-2032)
- Figure 146: Middle East & Africa Generative AI in Health Insurance Market Share Comparison by Based on Application (2016-2032)
- Figure 147: Middle East & Africa Generative AI in Health Insurance Market Share Comparison by Based on the Deployment Mode (2016-2032)
- List of Tables
- Table 1: Global Generative AI in Health Insurance Market Comparison by Based on Component (2016-2032)
- Table 2: Global Generative AI in Health Insurance Market Comparison by Based on Application (2016-2032)
- Table 3: Global Generative AI in Health Insurance Market Comparison by Based on the Deployment Mode (2016-2032)
- Table 4: Global Generative AI in Health Insurance Market Revenue (US$ Mn) Comparison by Region (2016-2032)
- Table 5: Global Generative AI in Health Insurance Market Revenue (US$ Mn) (2016-2032)
- Table 6: Global Generative AI in Health Insurance Market Revenue (US$ Mn) Comparison by Region (2016-2032)
- Table 7: Global Generative AI in Health Insurance Market Revenue (US$ Mn) Comparison by Based on Component (2016-2032)
- Table 8: Global Generative AI in Health Insurance Market Revenue (US$ Mn) Comparison by Based on Application (2016-2032)
- Table 9: Global Generative AI in Health Insurance Market Revenue (US$ Mn) Comparison by Based on the Deployment Mode (2016-2032)
- Table 10: Global Generative AI in Health Insurance Market Y-o-Y Growth Rate Comparison by Region (2016-2032)
- Table 11: Global Generative AI in Health Insurance Market Y-o-Y Growth Rate Comparison by Based on Component (2016-2032)
- Table 12: Global Generative AI in Health Insurance Market Y-o-Y Growth Rate Comparison by Based on Application (2016-2032)
- Table 13: Global Generative AI in Health Insurance Market Y-o-Y Growth Rate Comparison by Based on the Deployment Mode (2016-2032)
- Table 14: Global Generative AI in Health Insurance Market Share Comparison by Region (2016-2032)
- Table 15: Global Generative AI in Health Insurance Market Share Comparison by Based on Component (2016-2032)
- Table 16: Global Generative AI in Health Insurance Market Share Comparison by Based on Application (2016-2032)
- Table 17: Global Generative AI in Health Insurance Market Share Comparison by Based on the Deployment Mode (2016-2032)
- Table 18: North America Generative AI in Health Insurance Market Comparison by Based on Application (2016-2032)
- Table 19: North America Generative AI in Health Insurance Market Comparison by Based on the Deployment Mode (2016-2032)
- Table 20: North America Generative AI in Health Insurance Market Revenue (US$ Mn) Comparison by Country (2016-2032)
- Table 21: North America Generative AI in Health Insurance Market Revenue (US$ Mn) (2016-2032)
- Table 22: North America Generative AI in Health Insurance Market Revenue (US$ Mn) Comparison by Country (2016-2032)
- Table 23: North America Generative AI in Health Insurance Market Revenue (US$ Mn) Comparison by Based on Component (2016-2032)
- Table 24: North America Generative AI in Health Insurance Market Revenue (US$ Mn) Comparison by Based on Application (2016-2032)
- Table 25: North America Generative AI in Health Insurance Market Revenue (US$ Mn) Comparison by Based on the Deployment Mode (2016-2032)
- Table 26: North America Generative AI in Health Insurance Market Y-o-Y Growth Rate Comparison by Country (2016-2032)
- Table 27: North America Generative AI in Health Insurance Market Y-o-Y Growth Rate Comparison by Based on Component (2016-2032)
- Table 28: North America Generative AI in Health Insurance Market Y-o-Y Growth Rate Comparison by Based on Application (2016-2032)
- Table 29: North America Generative AI in Health Insurance Market Y-o-Y Growth Rate Comparison by Based on the Deployment Mode (2016-2032)
- Table 30: North America Generative AI in Health Insurance Market Share Comparison by Country (2016-2032)
- Table 31: North America Generative AI in Health Insurance Market Share Comparison by Based on Component (2016-2032)
- Table 32: North America Generative AI in Health Insurance Market Share Comparison by Based on Application (2016-2032)
- Table 33: North America Generative AI in Health Insurance Market Share Comparison by Based on the Deployment Mode (2016-2032)
- Table 34: Western Europe Generative AI in Health Insurance Market Comparison by Based on Component (2016-2032)
- Table 35: Western Europe Generative AI in Health Insurance Market Comparison by Based on Application (2016-2032)
- Table 36: Western Europe Generative AI in Health Insurance Market Comparison by Based on the Deployment Mode (2016-2032)
- Table 37: Western Europe Generative AI in Health Insurance Market Revenue (US$ Mn) Comparison by Country (2016-2032)
- Table 38: Western Europe Generative AI in Health Insurance Market Revenue (US$ Mn) (2016-2032)
- Table 39: Western Europe Generative AI in Health Insurance Market Revenue (US$ Mn) Comparison by Country (2016-2032)
- Table 40: Western Europe Generative AI in Health Insurance Market Revenue (US$ Mn) Comparison by Based on Component (2016-2032)
- Table 41: Western Europe Generative AI in Health Insurance Market Revenue (US$ Mn) Comparison by Based on Application (2016-2032)
- Table 42: Western Europe Generative AI in Health Insurance Market Revenue (US$ Mn) Comparison by Based on the Deployment Mode (2016-2032)
- Table 43: Western Europe Generative AI in Health Insurance Market Y-o-Y Growth Rate Comparison by Country (2016-2032)
- Table 44: Western Europe Generative AI in Health Insurance Market Y-o-Y Growth Rate Comparison by Based on Component (2016-2032)
- Table 45: Western Europe Generative AI in Health Insurance Market Y-o-Y Growth Rate Comparison by Based on Application (2016-2032)
- Table 46: Western Europe Generative AI in Health Insurance Market Y-o-Y Growth Rate Comparison by Based on the Deployment Mode (2016-2032)
- Table 47: Western Europe Generative AI in Health Insurance Market Share Comparison by Country (2016-2032)
- Table 48: Western Europe Generative AI in Health Insurance Market Share Comparison by Based on Component (2016-2032)
- Table 49: Western Europe Generative AI in Health Insurance Market Share Comparison by Based on Application (2016-2032)
- Table 50: Western Europe Generative AI in Health Insurance Market Share Comparison by Based on the Deployment Mode (2016-2032)
- Table 51: Eastern Europe Generative AI in Health Insurance Market Comparison by Based on Component (2016-2032)
- Table 52: Eastern Europe Generative AI in Health Insurance Market Comparison by Based on Application (2016-2032)
- Table 53: Eastern Europe Generative AI in Health Insurance Market Comparison by Based on the Deployment Mode (2016-2032)
- Table 54: Eastern Europe Generative AI in Health Insurance Market Revenue (US$ Mn) Comparison by Country (2016-2032)
- Table 55: Eastern Europe Generative AI in Health Insurance Market Revenue (US$ Mn) (2016-2032)
- Table 56: Eastern Europe Generative AI in Health Insurance Market Revenue (US$ Mn) Comparison by Country (2016-2032)
- Table 57: Eastern Europe Generative AI in Health Insurance Market Revenue (US$ Mn) Comparison by Based on Component (2016-2032)
- Table 58: Eastern Europe Generative AI in Health Insurance Market Revenue (US$ Mn) Comparison by Based on Application (2016-2032)
- Table 59: Eastern Europe Generative AI in Health Insurance Market Revenue (US$ Mn) Comparison by Based on the Deployment Mode (2016-2032)
- Table 60: Eastern Europe Generative AI in Health Insurance Market Y-o-Y Growth Rate Comparison by Country (2016-2032)
- Table 61: Eastern Europe Generative AI in Health Insurance Market Y-o-Y Growth Rate Comparison by Based on Component (2016-2032)
- Table 62: Eastern Europe Generative AI in Health Insurance Market Y-o-Y Growth Rate Comparison by Based on Application (2016-2032)
- Table 63: Eastern Europe Generative AI in Health Insurance Market Y-o-Y Growth Rate Comparison by Based on the Deployment Mode (2016-2032)
- Table 64: Eastern Europe Generative AI in Health Insurance Market Share Comparison by Country (2016-2032)
- Table 65: Eastern Europe Generative AI in Health Insurance Market Share Comparison by Based on Component (2016-2032)
- Table 66: Eastern Europe Generative AI in Health Insurance Market Share Comparison by Based on Application (2016-2032)
- Table 67: Eastern Europe Generative AI in Health Insurance Market Share Comparison by Based on the Deployment Mode (2016-2032)
- Table 68: APAC Generative AI in Health Insurance Market Comparison by Based on Component (2016-2032)
- Table 69: APAC Generative AI in Health Insurance Market Comparison by Based on Application (2016-2032)
- Table 70: APAC Generative AI in Health Insurance Market Comparison by Based on the Deployment Mode (2016-2032)
- Table 71: APAC Generative AI in Health Insurance Market Revenue (US$ Mn) Comparison by Country (2016-2032)
- Table 72: APAC Generative AI in Health Insurance Market Revenue (US$ Mn) (2016-2032)
- Table 73: APAC Generative AI in Health Insurance Market Revenue (US$ Mn) Comparison by Country (2016-2032)
- Table 74: APAC Generative AI in Health Insurance Market Revenue (US$ Mn) Comparison by Based on Component (2016-2032)
- Table 75: APAC Generative AI in Health Insurance Market Revenue (US$ Mn) Comparison by Based on Application (2016-2032)
- Table 76: APAC Generative AI in Health Insurance Market Revenue (US$ Mn) Comparison by Based on the Deployment Mode (2016-2032)
- Table 77: APAC Generative AI in Health Insurance Market Y-o-Y Growth Rate Comparison by Country (2016-2032)
- Table 78: APAC Generative AI in Health Insurance Market Y-o-Y Growth Rate Comparison by Based on Component (2016-2032)
- Table 79: APAC Generative AI in Health Insurance Market Y-o-Y Growth Rate Comparison by Based on Application (2016-2032)
- Table 80: APAC Generative AI in Health Insurance Market Y-o-Y Growth Rate Comparison by Based on the Deployment Mode (2016-2032)
- Table 81: APAC Generative AI in Health Insurance Market Share Comparison by Country (2016-2032)
- Table 82: APAC Generative AI in Health Insurance Market Share Comparison by Based on Component (2016-2032)
- Table 83: APAC Generative AI in Health Insurance Market Share Comparison by Based on Application (2016-2032)
- Table 84: APAC Generative AI in Health Insurance Market Share Comparison by Based on the Deployment Mode (2016-2032)
- Table 85: Latin America Generative AI in Health Insurance Market Comparison by Based on Component (2016-2032)
- Table 86: Latin America Generative AI in Health Insurance Market Comparison by Based on Application (2016-2032)
- Table 87: Latin America Generative AI in Health Insurance Market Comparison by Based on the Deployment Mode (2016-2032)
- Table 88: Latin America Generative AI in Health Insurance Market Revenue (US$ Mn) Comparison by Country (2016-2032)
- Table 89: Latin America Generative AI in Health Insurance Market Revenue (US$ Mn) (2016-2032)
- Table 90: Latin America Generative AI in Health Insurance Market Revenue (US$ Mn) Comparison by Country (2016-2032)
- Table 91: Latin America Generative AI in Health Insurance Market Revenue (US$ Mn) Comparison by Based on Component (2016-2032)
- Table 92: Latin America Generative AI in Health Insurance Market Revenue (US$ Mn) Comparison by Based on Application (2016-2032)
- Table 93: Latin America Generative AI in Health Insurance Market Revenue (US$ Mn) Comparison by Based on the Deployment Mode (2016-2032)
- Table 94: Latin America Generative AI in Health Insurance Market Y-o-Y Growth Rate Comparison by Country (2016-2032)
- Table 95: Latin America Generative AI in Health Insurance Market Y-o-Y Growth Rate Comparison by Based on Component (2016-2032)
- Table 96: Latin America Generative AI in Health Insurance Market Y-o-Y Growth Rate Comparison by Based on Application (2016-2032)
- Table 97: Latin America Generative AI in Health Insurance Market Y-o-Y Growth Rate Comparison by Based on the Deployment Mode (2016-2032)
- Table 98: Latin America Generative AI in Health Insurance Market Share Comparison by Country (2016-2032)
- Table 99: Latin America Generative AI in Health Insurance Market Share Comparison by Based on Component (2016-2032)
- Table 100: Latin America Generative AI in Health Insurance Market Share Comparison by Based on Application (2016-2032)
- Table 101: Latin America Generative AI in Health Insurance Market Share Comparison by Based on the Deployment Mode (2016-2032)
- Table 102: Middle East & Africa Generative AI in Health Insurance Market Comparison by Based on Component (2016-2032)
- Table 103: Middle East & Africa Generative AI in Health Insurance Market Comparison by Based on Application (2016-2032)
- Table 104: Middle East & Africa Generative AI in Health Insurance Market Comparison by Based on the Deployment Mode (2016-2032)
- Table 105: Middle East & Africa Generative AI in Health Insurance Market Revenue (US$ Mn) Comparison by Country (2016-2032)
- Table 106: Middle East & Africa Generative AI in Health Insurance Market Revenue (US$ Mn) (2016-2032)
- Table 107: Middle East & Africa Generative AI in Health Insurance Market Revenue (US$ Mn) Comparison by Country (2016-2032)
- Table 108: Middle East & Africa Generative AI in Health Insurance Market Revenue (US$ Mn) Comparison by Based on Component (2016-2032)
- Table 109: Middle East & Africa Generative AI in Health Insurance Market Revenue (US$ Mn) Comparison by Based on Application (2016-2032)
- Table 110: Middle East & Africa Generative AI in Health Insurance Market Revenue (US$ Mn) Comparison by Based on the Deployment Mode (2016-2032)
- Table 111: Middle East & Africa Generative AI in Health Insurance Market Y-o-Y Growth Rate Comparison by Country (2016-2032)
- Table 112: Middle East & Africa Generative AI in Health Insurance Market Y-o-Y Growth Rate Comparison by Based on Component (2016-2032)
- Table 113: Middle East & Africa Generative AI in Health Insurance Market Y-o-Y Growth Rate Comparison by Based on Application (2016-2032)
- Table 114: Middle East & Africa Generative AI in Health Insurance Market Y-o-Y Growth Rate Comparison by Based on the Deployment Mode (2016-2032)
- Table 115: Middle East & Africa Generative AI in Health Insurance Market Share Comparison by Country (2016-2032)
- Table 116: Middle East & Africa Generative AI in Health Insurance Market Share Comparison by Based on Component (2016-2032)
- Table 117: Middle East & Africa Generative AI in Health Insurance Market Share Comparison by Based on Application (2016-2032)
- Table 118: Middle East & Africa Generative AI in Health Insurance Market Share Comparison by Based on the Deployment Mode (2016-2032)
- 1. Executive Summary
Inquiry Form
Why Choose Us
- 360 Degree Approach
- Growth Consulting
- 24/7 Research Support
- Comprehensive-Level of Customization
- Competitive Intelligence
- Single-Country/ Region Intelligence
- Post-Sale Service Assistance
- Access to Lead Analysts
- Available in PDF, Excel, Word/ PPT
Request for Customization
OUR CLIENTS
Don't just take our word. We are trusted by these great companies!