
Global Generative AI in Biology Market, By Application (Medical Imaging, Genomics & Proteomics, and Other), By Technology (Generative Adversarial Networks, Variational Autoencoders, Other), By End-User, By Region and Companies - Industry Segment Outlook, Market Assessment, Competition Scenario, Trends, and Forecast 2023-2032
-
38017
-
June 2023
-
178
-


-
This report was compiled by Vishwa Gaul Vishwa is an experienced market research and consulting professional with over 8 years of expertise in the ICT industry, contributing to over 700 reports across telecommunications, software, hardware, and digital solutions. Correspondence Team Lead- ICT Linkedin | Detailed Market research Methodology Our methodology involves a mix of primary research, including interviews with leading mental health experts, and secondary research from reputable medical journals and databases. View Detailed Methodology Page
-
Quick Navigation
- Report Overview
- Driving Factors
- Restraining Factors
- Generative AI in Biology Market Segmentation Analysis
- Key Market Segments
- Generative AI in Biology Market Growth Opportunities
- Generative AI in Biology Market Regional Analysis
- Generative AI in Biology Market Key Player Analysis
- Market Key Players
- Recent Development
- Report Scope
Report Overview
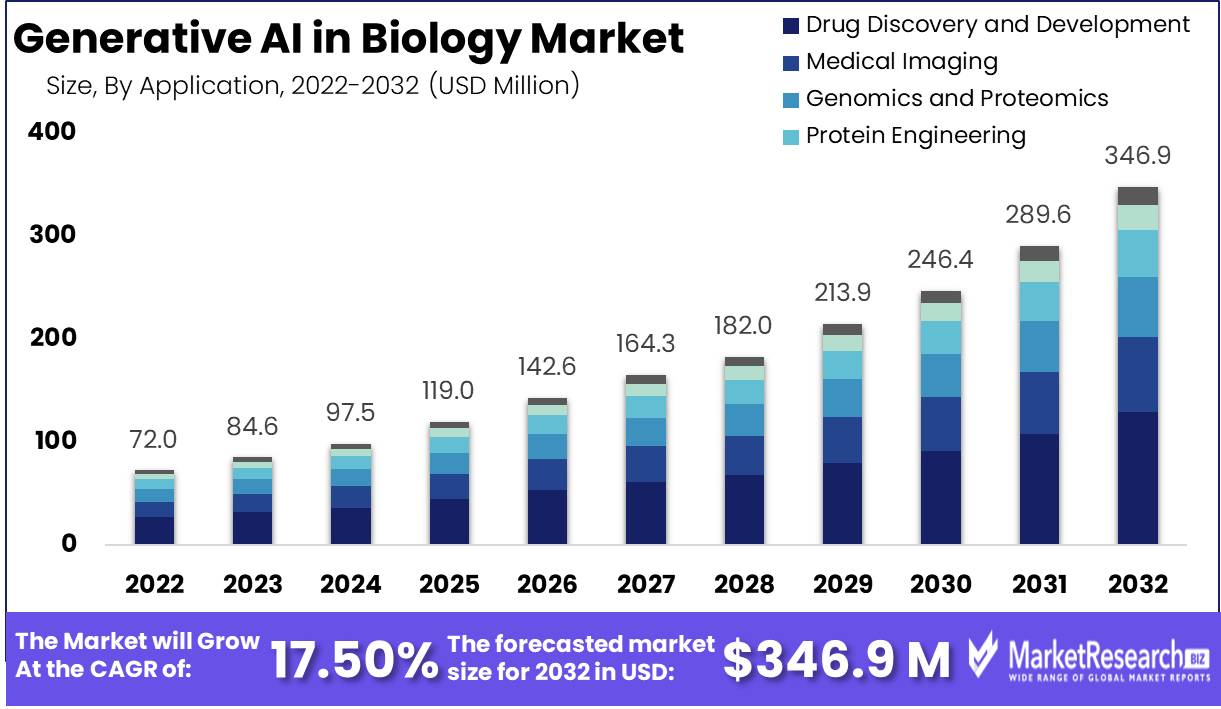
Global Generative AI in Biology Market size is expected to be worth around USD 346.9 million by 2032 from USD 72.0 million in 2022, growing at a CAGR of 17.50 %. during the forecast period from 2023 to 2032.
Generative artificial intelligence (AI) refers to machine learning models that can create novel, realistic artifacts rather than simply classify or predict. In biology, generative AI can produce synthetic biological data that retains the statistical properties of real biological data sets. This allows researchers to augment limited real-world data and investigate biological phenomena in silico.
Key applications include generating genome sequences, cellular images, protein structures, and simulated expressions of genes and proteins. Though promising, evaluative benchmarks are needed to ensure generative biology models produce artifacts with fidelity and utility for downstream biologists.
The Generative AI in Biology Market is being driven by several key factors. The vast amounts of biological data being generated through high-throughput experiments and testing are enabling new opportunities for applying generative AI models. As more data is accumulated, generative models can be better trained to produce novel and reliable biological insights.
MIT scientists have developed an open-source, automated machine-learning platform called BioAutoMATED to generate artificial intelligence (AI) models for biology research. The system aims to democratize AI for research labs by simplifying the process of building machine-learning models, particularly for those without extensive machine-learning expertise.
Moreover, major tech and pharmaceutical companies are partnering with AI startups to leverage generative models for drug discovery and development. For Instance, In August 2023, Ginkgo Bioworks entered into a partnership with Google Cloud to develop a generative AI platform for biology and biosecurity. The company emphasizes the importance of data as a crucial resource for powering machine learning applications in the field of biological development.
Additionally, the need for accelerated drug discovery and development is fueling demand for the Generative AI in Biology Market. Pharmaceutical companies are increasingly adopting these AI tools to help model protein folding, predict drug-target interactions, and simulate complex biological processes to streamline R&D pipelines. The ability to generate and prioritize higher-quality drug candidates earlier in development is a major appeal of Generative AI in the Biology Market.
In November 2023, Dutch-Swiss startup Cradle successfully raised €21.9 million in a Series A funding round, led by Index Ventures Cradle specializes in leveraging generative artificial intelligence (AI) for protein design and engineering in the field of biology. The projects encompass various protein modalities such as enzymes, vaccines, peptides, and antibodies, targeting properties like stability, expression, activity, binding affinity, and specificity.
Other drivers include the wider availability of cloud computing resources to run complex generative AI models, as well as a push for more predictive and personalized medicine. As healthcare continues trending toward precision and individualization, technologies like generative AI can help enable that future through biology-specific applications.
In June 2023, Pioneering a new frontier in AI-powered drug discovery, Enable Medicine has launched Generative Biological Search (GBS). This groundbreaking technology seamlessly integrates large language models, vast biological datasets, and scalable research workflows. By simplifying and enhancing data-driven exploration, GBS establishes a robust platform for rapid innovation that keeps pace with the lightning speed of progress in artificial intelligence.
With multiple strong driving factors, the Generative AI in Biology Market is poised for robust growth in the coming years as generative AI capabilities continue advancing.
Driving Factors
Biomarker Discovery Fuels Generative AI Advancements in Biology
The rising emphasis on biomarker discovery is significantly contributing to the growth of generative AI in the biology market. Biomarkers are vital for understanding complex biological processes and diseases, and their identification is crucial for developing targeted therapies. Generative AI accelerates this discovery process by analyzing vast biological datasets to identify potential biomarkers more efficiently than traditional methods.
This capability is particularly important in personalized medicine, where understanding individual variations is key. The increasing focus on biomarker discovery in research and clinical settings indicates a sustained demand for generative AI solutions in biology, promising continued market growth driven by the need for more precise and personalized healthcare solutions.
Computational Power and Infrastructure Drive Generative AI in Biology
The availability of computational power and advanced infrastructure is a primary driver of growth for generative AI in biology. The exponential increase in computational capabilities has enabled the handling of complex biological datasets, allowing for more sophisticated AI models that can generate novel biological insights.
This infrastructure is crucial for training and running advanced AI algorithms capable of simulating and predicting biological processes. The continuing advancements in computational power and infrastructure are expected to further boost the generative AI market in biology, facilitating more comprehensive and accurate biological analyses and innovations.
Drug Discovery and Development Propel Generative AI in Life Sciences
The emphasis on drug discovery and development is a key driving factor for the generative AI in life sciences market. The pharmaceutical industry's need for faster, more efficient drug development processes is well-aligned with the capabilities of generative AI.
These AI systems can rapidly analyze complex biochemical interactions and predict the efficacy and safety of potential drug compounds, significantly reducing the time and cost associated with drug development. This capability is invaluable in the current fast-paced, innovation-driven pharmaceutical environment. The ongoing demand for new and effective therapeutics suggests a sustained growth trajectory for generative AI in life sciences, particularly in streamlining the drug discovery and development process.
Restraining Factors
Data Security and Privacy Concerns Restrain Generative AI in Biology Market Growth
The growth of generative AI in the field of biology is significantly restrained by concerns related to data security and privacy. This is particularly pertinent in sensitive areas like healthcare and pharmaceuticals, where the handling of confidential patient data and proprietary research information is involved.
The risk of data breaches and unauthorized access to sensitive information raises serious concerns about adopting AI technologies. Ensuring compliance with stringent regulations like HIPAA in healthcare further complicates AI implementation. These security and privacy concerns can hinder the willingness of organizations to integrate generative AI into their operations, thereby limiting market expansion.
Quality and Reliability of Data from Generative AI Models Limit Market Growth
The quality and reliability of data generated by generative AI models are potential restraining factors in their application in biology, especially in critical areas such as drug discovery and medical imaging. The accuracy of generative AI outputs is crucial, as erroneous or unreliable data can lead to incorrect conclusions or decisions, particularly in high-stakes fields like medicine and pharmaceutical research.
Ensuring that generative AI models are trained on high-quality, comprehensive datasets and validating their outputs against real-world results is essential but challenging. Concerns about the fidelity and trustworthiness of AI-generated data can thus limit the adoption of these technologies in sensitive and critical biological applications.
Generative AI in Biology Market Segmentation Analysis
By Application
Generative AI's most significant impact in biology is in drug discovery and development. This dominance is driven by AI's ability to analyze vast datasets, identify novel drug candidates, predict drug-target interactions, and optimize drug design processes. AI accelerates the traditionally lengthy and costly drug development cycle, enabling quicker introduction of effective drugs to the market. Companies are leveraging AI to improve the efficiency of clinical trials, enhance precision medicine, and reduce the failure rate of drug candidates. The integration of generative AI in drug discovery is revolutionizing how pharmaceutical companies approach R&D, making this segment pivotal in the field.
Generative AI in medical imaging aids in diagnosis and treatment planning. In genomics and proteomics, AI enhances the understanding of complex biological data. AI in protein engineering is critical for developing new biological products. Synthetic biology benefits from AI in designing and engineering biological systems.
By Technology
Generative Adversarial Networks (GANs) are leading in generative AI technologies in biology, primarily due to their ability to create highly accurate and realistic synthetic biological data. This technology is instrumental in drug design, where it generates novel molecular structures, thereby accelerating the discovery of potential drug candidates. GANs' capacity to model complex biological processes makes them invaluable in research and development, significantly enhancing the predictive power of biological models.
Variational autoencoders are used for modeling and interpreting complex datasets, offering a robust framework for understanding biological variability and disease progression. Reinforcement learning is vital in optimizing therapeutic strategies and adaptive systems, particularly in personalizing treatment protocols. Other emerging technologies contribute to the diversification and enhancement of AI applications in biology, widening the scope of potential innovations and applications in the field.
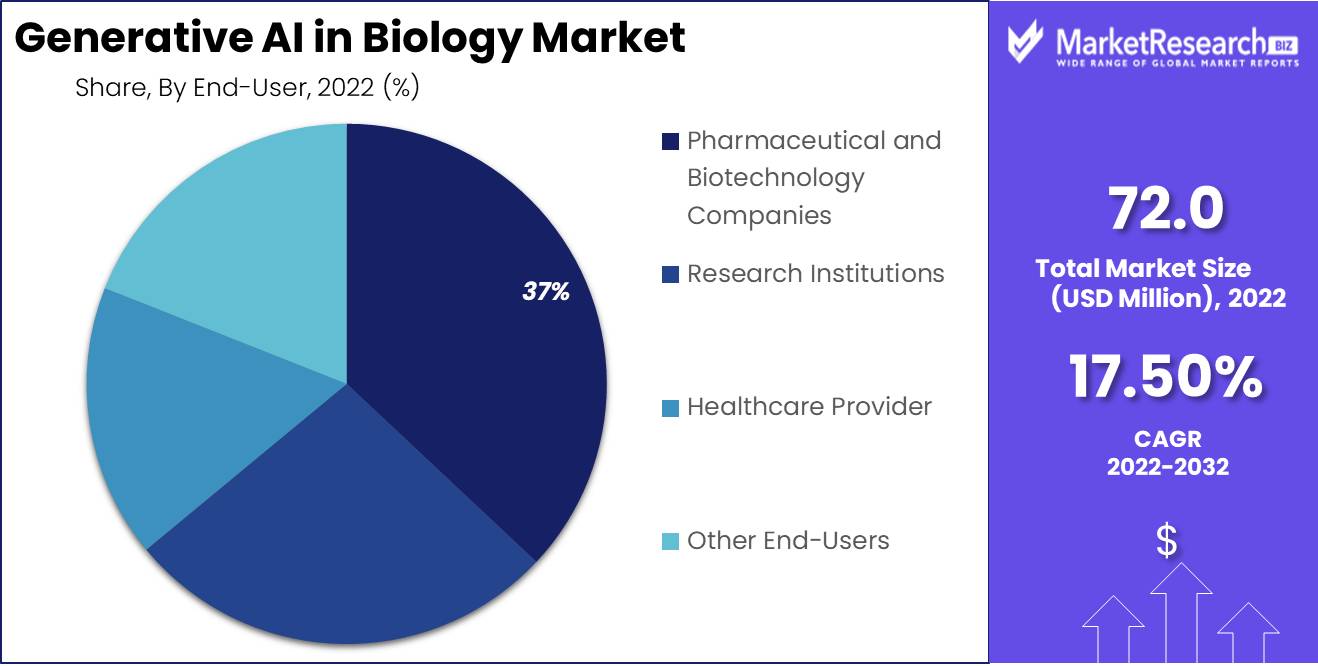
By End-Use
The pharmaceutical industry is the primary end-user of generative AI in biology. These companies use AI to innovate in drug discovery, reduce R&D costs, and speed up time-to-market for new therapies, significantly impacting the efficiency and effectiveness of drug development processes. AI's predictive capabilities are leveraged for identifying new drug targets and understanding disease mechanisms, offering novel insights into complex biological systems.
Healthcare providers use AI for precision medicine and diagnostic purposes, tailoring treatments to individual patients' genetic and clinical profiles. Research institutions utilize AI for biological research, advancing knowledge in various biological fields, and fostering interdisciplinary collaborations that push the boundaries of biological understanding.
Key Market Segments
Based On Application
- Medical Imaging
- Genomics and Proteomics
- Drug Discovery and Development
- Protein Engineering
- Synthetic Biology
- Other Applications
Based On Technology
- Generative Adversarial Networks
- Variational Autoencoders
- Reinforcement Learning
- Other Technologies
Based On End-User
- Pharmaceutical and Biotechnology Companies
- Research Institutions
- Healthcare Provider
- Other End-Users
Generative AI in Biology Market Growth Opportunities
Demand for Precision Medicine Drives Growth in Generative AI in Biology Market
The rising demand for precision medicine is a key factor driving the growth of generative AI in the biology market. Precision medicine relies heavily on the ability to analyze complex biological data and derive personalized treatment strategies.
Generative AI plays a crucial role in this process by enabling the analysis and interpretation of vast amounts of genomic and clinical data at an unprecedented scale and speed. This technology's ability to identify patterns and predict outcomes is transforming how treatments are tailored to individual patients, indicating a significant expansion potential within the precision medicine sphere.
Large Healthcare Datasets Fuel Growth in Generative AI in Healthcare Market
The increasing availability of large healthcare datasets is significantly contributing to the growth of generative AI in the healthcare market. The abundance of data, including genomic information, clinical trial data, and electronic health records, provides a rich resource for generative AI algorithms.
These algorithms can analyze complex datasets to uncover insights, predict disease progression, and optimize treatment protocols. The growing volume of healthcare data, coupled with advancements in AI technology, is enhancing the capacity for deep, actionable insights in healthcare, signaling robust market growth opportunities in areas such as disease prediction, drug discovery, and personalized treatment planning.
Generative AI in Biology Market Regional Analysis
North America Dominates with 37.50% Market Share
North America's leading 37.50% share in the Generative AI in Biology Market is primarily driven by the region's cutting-edge technological advancements and robust investment in AI and biotechnology. The United States, in particular, is home to numerous tech giants and innovative startups focused on integrating AI into biological research. High levels of funding from both government and private sectors for AI-driven biological research contribute significantly to this market dominance.
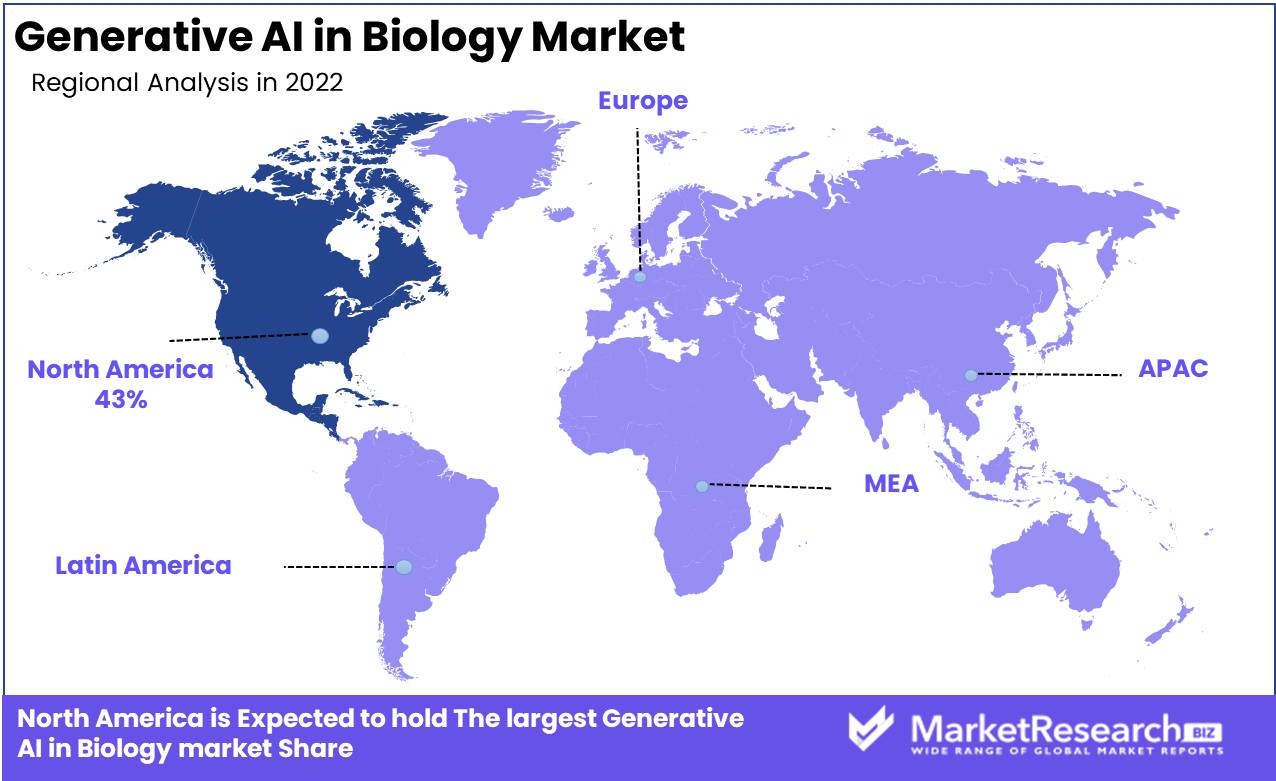
The market dynamics in North America are influenced by strong collaborations between tech companies, academic institutions, and biotech firms, fostering innovation in AI applications in biology. The region's advanced research infrastructure and the growing emphasis on personalized medicine and drug discovery also drive the demand for generative AI. Furthermore, the presence of a highly skilled workforce specializing in AI, data science, and biological sciences enhances the region's capacity for pioneering work in this field.
Europe Is A Hub for Research and Innovation
Europe’s generative AI in biology market is driven by its strong research infrastructure and focus on innovation. The region's emphasis on collaborative research, supported by various EU-funded programs, fosters the development of AI applications in biology. European countries are also leading in ethical AI research, ensuring responsible and sustainable development in this field.
Asia-Pacific's Rapid Technological Growth and Investment
In Asia-Pacific, the generative AI in biology market is expanding rapidly, fueled by increasing investments in AI and biotechnology sectors. Countries like China, Japan, and South Korea are investing heavily in AI research and development, focusing on its application in healthcare and biological sciences. The region's fast-growing tech industry and its efforts to advance in high-tech sectors position Asia-Pacific as a key emerging player in the global generative AI in biology market.
Generative AI in Biology Industry By Region
North America
- The US
- Canada
Europe
- Germany
- France
- The UK
- Spain
- Italy
- Russia
- Netherlands
- Rest of Europe
Asia-Pacific
- China
- Japan
- South Korea
- India
- New Zealand
- Singapore
- Thailand
- Vietnam
- Rest of Asia Pacific
Latin America
- Brazil
- Mexico
- Rest of Latin America
Middle East & Africa
- South Africa
- Saudi Arabia
- UAE
- Rest of the Middle East & Africa
Generative AI in Biology Market Key Player Analysis
In the rapidly emerging Generative AI in Biology Market, the companies listed are at the forefront of integrating artificial intelligence with biological research and drug discovery. Insilico Medicine, specializing in AI-driven drug discovery and development, leads the market with its innovative approach to identifying novel biological targets and molecules, demonstrating the significant potential of AI in accelerating and enhancing pharmaceutical research.
IBM Corporation, with its vast expertise in AI and machine learning, contributes significantly to the market through its advanced analytics and computational capabilities. These are crucial for processing complex biological data, thus enabling deeper insights into biological processes and drug interactions.
AiCure LLC, focusing on AI in patient monitoring and medication adherence, showcases the application of generative AI in enhancing patient care and treatment efficacy. Their technology represents a key shift towards more personalized and efficient healthcare solutions.
MosaicML, although a newer player, is carving out a niche in the market by optimizing machine learning models for biological data. Their work underscores the importance of tailored AI solutions in handling the unique challenges and complexities of biological research.
NVIDIA, known for its powerful GPUs and AI platforms, plays a critical role in providing the necessary computational power and infrastructure for AI applications in biology. Their technology enables the handling of vast datasets and complex computational tasks, which are integral to AI-driven biological research.
Collectively, these companies not only drive innovation in the Generative AI in Biology Market but also represent a range of strategies – from drug discovery and patient care to computational infrastructure – crucial for the advancement of AI applications in the field of biology.
Market Key Players
- NVIDIA Corporation
- IBM Corporation
- BenevolentAI
- DeepMind Technologies Limited
- Insilico Medicine
- Recursion Pharmaceuticals
- Zymergen
- Other Key Players
Recent Development
- Feb 2024 Successfully dosed the first patient in the study of GB-0895, an anti-TSLP monoclonal antibody for the treatment of mild-to-moderate asthma, in the United Kingdom. The primary endpoint of the study, which will also be conducted in Germany, aims to evaluate the safety and tolerability of GB-0895 for subcutaneous administration – with the goal of selecting 1–2 doses/regimens to advance in development.
- Nov 2023 Koninklijke Philips N.V., (Netherlands) collaborated with Vestre Viken Health Trust in Norway, deploying its AI Manager platform to enhance radiology workflows. The AI-enabled bone fracture application streamlined diagnoses, allowing radiologists to focus on complex cases. This initiative, spanning 30 hospitals and serving around 3.8 million people, marked Philips' most extensive AI deployment in Europe, contributing to improved patient care and accelerated diagnostic processes.
- Jun 2023: For processing various data sets, Insilico has introduced a new multimodal transformer-based aging clock.
Report Scope
Report Features Description Market Value (2022) USD 72.0 Mn Forecast Revenue (2032) USD 346.9 Mn CAGR (2023-2032) 17.50% Base Year for Estimation 2022 Historic Period 2016-2022 Forecast Period 2023-2032 Report Coverage Revenue Forecast, Market Dynamics, COVID-19 Impact, Competitive Landscape, Recent Developments Segments Covered By Application, By Technology, By End-Users Regional Analysis North America - The US, Canada, Europe - Germany, France, The UK, Spain, Italy, Russia, Netherlands, Rest of Europe, Asia-Pacific - China, Japan, South Korea, India, New Zealand, Singapore, Thailand, Vietnam, Rest of Asia Pacific, Latin America - Brazil, Mexico, Rest of Latin America, Middle East & Africa - South Africa, Saudi Arabia, UAE, Rest of Middle East & Africa Competitive Landscape NVIDIA Corporation, IBM Corporation, BenevolentAI, DeepMind Technologies Limited, Insilico Medicine, Recursion Pharmaceuticals, Zymergen, and Other Key Players Customization Scope Customization for segments, region/country-level will be provided. Moreover, additional customization can be done based on the requirements. Purchase Options We have three licenses to opt for: Single User License, Multi-User License (Up to 5 Users), Corporate Use License (Unlimited User and Printable PDF) -
- 1. Executive Summary
- 1.1. Definition
- 1.2. Taxonomy
- 1.3. Research Scope
- 1.4. Key Analysis
- 1.5. Key Findings by Major Segments
- 1.6. Top strategies by Major Players
- 2. Global Generative AI in Biology Market Overview
- 2.1. Generative AI in Biology Market Dynamics
- 2.1.1. Drivers
- 2.1.2. Opportunities
- 2.1.3. Restraints
- 2.1.4. Challenges
- 2.2. Macro-economic Factors
- 2.3. Regulatory Framework
- 2.4. Market Investment Feasibility Index
- 2.5. PEST Analysis
- 2.6. PORTER’S Five Force Analysis
- 2.7. Drivers & Restraints Impact Analysis
- 2.8. Industry Chain Analysis
- 2.9. Cost Structure Analysis
- 2.10. Marketing Strategy
- 2.11. Russia-Ukraine War Impact Analysis
- 2.12. Opportunity Map Analysis
- 2.13. Market Competition Scenario Analysis
- 2.14. Product Life Cycle Analysis
- 2.15. Opportunity Orbits
- 2.16. Manufacturer Intensity Map
- 2.17. Major Companies sales by Value & Volume
- 2.1. Generative AI in Biology Market Dynamics
- 3. Global Generative AI in Biology Market Analysis, Opportunity and Forecast, 2016-2032
- 3.1. Global Generative AI in Biology Market Analysis, 2016-2021
- 3.2. Global Generative AI in Biology Market Opportunity and Forecast, 2023-2032
- 3.3. Global Generative AI in Biology Market Analysis, Opportunity and Forecast, By Based On Application , 2016-2032
- 3.3.1. Global Generative AI in Biology Market Analysis by Based On Application : Introduction
- 3.3.2. Market Size Absolute $ Opportunity Analysis and Forecast, By Based On Application , 2016-2032
- 3.3.3. Drug Discovery and Development
- 3.3.4. Medical Imaging
- 3.3.5. Genomics and Proteomics
- 3.3.6. Protein Engineering
- 3.3.7. Synthetic Biology
- 3.3.8. Other Applications
- 3.4. Global Generative AI in Biology Market Analysis, Opportunity and Forecast, By Based On Technology, 2016-2032
- 3.4.1. Global Generative AI in Biology Market Analysis by Based On Technology: Introduction
- 3.4.2. Market Size Absolute $ Opportunity Analysis and Forecast, By Based On Technology, 2016-2032
- 3.4.3. Generative Adversarial Networks
- 3.4.4. Variational Autoencoders
- 3.4.5. Reinforcement Learning
- 3.4.6. Other Technologies
- 3.5. Global Generative AI in Biology Market Analysis, Opportunity and Forecast, By Based On End-User, 2016-2032
- 3.5.1. Global Generative AI in Biology Market Analysis by Based On End-User: Introduction
- 3.5.2. Market Size Absolute $ Opportunity Analysis and Forecast, By Based On End-User, 2016-2032
- 3.5.3. Pharmaceutical and Biotechnology Companies
- 3.5.4. Research Institutions
- 3.5.5. Healthcare Provider
- 3.5.6. Other End-Users
- 4. North America Generative AI in Biology Market Analysis, Opportunity and Forecast, 2016-2032
- 4.1. North America Generative AI in Biology Market Analysis, 2016-2021
- 4.2. North America Generative AI in Biology Market Opportunity and Forecast, 2023-2032
- 4.3. North America Generative AI in Biology Market Analysis, Opportunity and Forecast, By Based On Application , 2016-2032
- 4.3.1. North America Generative AI in Biology Market Analysis by Based On Application : Introduction
- 4.3.2. Market Size Absolute $ Opportunity Analysis and Forecast, By Based On Application , 2016-2032
- 4.3.3. Drug Discovery and Development
- 4.3.4. Medical Imaging
- 4.3.5. Genomics and Proteomics
- 4.3.6. Protein Engineering
- 4.3.7. Synthetic Biology
- 4.3.8. Other Applications
- 4.4. North America Generative AI in Biology Market Analysis, Opportunity and Forecast, By Based On Technology, 2016-2032
- 4.4.1. North America Generative AI in Biology Market Analysis by Based On Technology: Introduction
- 4.4.2. Market Size Absolute $ Opportunity Analysis and Forecast, By Based On Technology, 2016-2032
- 4.4.3. Generative Adversarial Networks
- 4.4.4. Variational Autoencoders
- 4.4.5. Reinforcement Learning
- 4.4.6. Other Technologies
- 4.5. North America Generative AI in Biology Market Analysis, Opportunity and Forecast, By Based On End-User, 2016-2032
- 4.5.1. North America Generative AI in Biology Market Analysis by Based On End-User: Introduction
- 4.5.2. Market Size Absolute $ Opportunity Analysis and Forecast, By Based On End-User, 2016-2032
- 4.5.3. Pharmaceutical and Biotechnology Companies
- 4.5.4. Research Institutions
- 4.5.5. Healthcare Provider
- 4.5.6. Other End-Users
- 4.6. North America Generative AI in Biology Market Analysis, Opportunity and Forecast, By Country , 2016-2032
- 4.6.1. North America Generative AI in Biology Market Analysis by Country : Introduction
- 4.6.2. Market Size Absolute $ Opportunity Analysis and Forecast, Country , 2016-2032
- 4.6.2.1. The US
- 4.6.2.2. Canada
- 4.6.2.3. Mexico
- 5. Western Europe Generative AI in Biology Market Analysis, Opportunity and Forecast, 2016-2032
- 5.1. Western Europe Generative AI in Biology Market Analysis, 2016-2021
- 5.2. Western Europe Generative AI in Biology Market Opportunity and Forecast, 2023-2032
- 5.3. Western Europe Generative AI in Biology Market Analysis, Opportunity and Forecast, By Based On Application , 2016-2032
- 5.3.1. Western Europe Generative AI in Biology Market Analysis by Based On Application : Introduction
- 5.3.2. Market Size Absolute $ Opportunity Analysis and Forecast, By Based On Application , 2016-2032
- 5.3.3. Drug Discovery and Development
- 5.3.4. Medical Imaging
- 5.3.5. Genomics and Proteomics
- 5.3.6. Protein Engineering
- 5.3.7. Synthetic Biology
- 5.3.8. Other Applications
- 5.4. Western Europe Generative AI in Biology Market Analysis, Opportunity and Forecast, By Based On Technology, 2016-2032
- 5.4.1. Western Europe Generative AI in Biology Market Analysis by Based On Technology: Introduction
- 5.4.2. Market Size Absolute $ Opportunity Analysis and Forecast, By Based On Technology, 2016-2032
- 5.4.3. Generative Adversarial Networks
- 5.4.4. Variational Autoencoders
- 5.4.5. Reinforcement Learning
- 5.4.6. Other Technologies
- 5.5. Western Europe Generative AI in Biology Market Analysis, Opportunity and Forecast, By Based On End-User, 2016-2032
- 5.5.1. Western Europe Generative AI in Biology Market Analysis by Based On End-User: Introduction
- 5.5.2. Market Size Absolute $ Opportunity Analysis and Forecast, By Based On End-User, 2016-2032
- 5.5.3. Pharmaceutical and Biotechnology Companies
- 5.5.4. Research Institutions
- 5.5.5. Healthcare Provider
- 5.5.6. Other End-Users
- 5.6. Western Europe Generative AI in Biology Market Analysis, Opportunity and Forecast, By Country , 2016-2032
- 5.6.1. Western Europe Generative AI in Biology Market Analysis by Country : Introduction
- 5.6.2. Market Size Absolute $ Opportunity Analysis and Forecast, Country , 2016-2032
- 5.6.2.1. Germany
- 5.6.2.2. France
- 5.6.2.3. The UK
- 5.6.2.4. Spain
- 5.6.2.5. Italy
- 5.6.2.6. Portugal
- 5.6.2.7. Ireland
- 5.6.2.8. Austria
- 5.6.2.9. Switzerland
- 5.6.2.10. Benelux
- 5.6.2.11. Nordic
- 5.6.2.12. Rest of Western Europe
- 6. Eastern Europe Generative AI in Biology Market Analysis, Opportunity and Forecast, 2016-2032
- 6.1. Eastern Europe Generative AI in Biology Market Analysis, 2016-2021
- 6.2. Eastern Europe Generative AI in Biology Market Opportunity and Forecast, 2023-2032
- 6.3. Eastern Europe Generative AI in Biology Market Analysis, Opportunity and Forecast, By Based On Application , 2016-2032
- 6.3.1. Eastern Europe Generative AI in Biology Market Analysis by Based On Application : Introduction
- 6.3.2. Market Size Absolute $ Opportunity Analysis and Forecast, By Based On Application , 2016-2032
- 6.3.3. Drug Discovery and Development
- 6.3.4. Medical Imaging
- 6.3.5. Genomics and Proteomics
- 6.3.6. Protein Engineering
- 6.3.7. Synthetic Biology
- 6.3.8. Other Applications
- 6.4. Eastern Europe Generative AI in Biology Market Analysis, Opportunity and Forecast, By Based On Technology, 2016-2032
- 6.4.1. Eastern Europe Generative AI in Biology Market Analysis by Based On Technology: Introduction
- 6.4.2. Market Size Absolute $ Opportunity Analysis and Forecast, By Based On Technology, 2016-2032
- 6.4.3. Generative Adversarial Networks
- 6.4.4. Variational Autoencoders
- 6.4.5. Reinforcement Learning
- 6.4.6. Other Technologies
- 6.5. Eastern Europe Generative AI in Biology Market Analysis, Opportunity and Forecast, By Based On End-User, 2016-2032
- 6.5.1. Eastern Europe Generative AI in Biology Market Analysis by Based On End-User: Introduction
- 6.5.2. Market Size Absolute $ Opportunity Analysis and Forecast, By Based On End-User, 2016-2032
- 6.5.3. Pharmaceutical and Biotechnology Companies
- 6.5.4. Research Institutions
- 6.5.5. Healthcare Provider
- 6.5.6. Other End-Users
- 6.6. Eastern Europe Generative AI in Biology Market Analysis, Opportunity and Forecast, By Country , 2016-2032
- 6.6.1. Eastern Europe Generative AI in Biology Market Analysis by Country : Introduction
- 6.6.2. Market Size Absolute $ Opportunity Analysis and Forecast, Country , 2016-2032
- 6.6.2.1. Russia
- 6.6.2.2. Poland
- 6.6.2.3. The Czech Republic
- 6.6.2.4. Greece
- 6.6.2.5. Rest of Eastern Europe
- 7. APAC Generative AI in Biology Market Analysis, Opportunity and Forecast, 2016-2032
- 7.1. APAC Generative AI in Biology Market Analysis, 2016-2021
- 7.2. APAC Generative AI in Biology Market Opportunity and Forecast, 2023-2032
- 7.3. APAC Generative AI in Biology Market Analysis, Opportunity and Forecast, By Based On Application , 2016-2032
- 7.3.1. APAC Generative AI in Biology Market Analysis by Based On Application : Introduction
- 7.3.2. Market Size Absolute $ Opportunity Analysis and Forecast, By Based On Application , 2016-2032
- 7.3.3. Drug Discovery and Development
- 7.3.4. Medical Imaging
- 7.3.5. Genomics and Proteomics
- 7.3.6. Protein Engineering
- 7.3.7. Synthetic Biology
- 7.3.8. Other Applications
- 7.4. APAC Generative AI in Biology Market Analysis, Opportunity and Forecast, By Based On Technology, 2016-2032
- 7.4.1. APAC Generative AI in Biology Market Analysis by Based On Technology: Introduction
- 7.4.2. Market Size Absolute $ Opportunity Analysis and Forecast, By Based On Technology, 2016-2032
- 7.4.3. Generative Adversarial Networks
- 7.4.4. Variational Autoencoders
- 7.4.5. Reinforcement Learning
- 7.4.6. Other Technologies
- 7.5. APAC Generative AI in Biology Market Analysis, Opportunity and Forecast, By Based On End-User, 2016-2032
- 7.5.1. APAC Generative AI in Biology Market Analysis by Based On End-User: Introduction
- 7.5.2. Market Size Absolute $ Opportunity Analysis and Forecast, By Based On End-User, 2016-2032
- 7.5.3. Pharmaceutical and Biotechnology Companies
- 7.5.4. Research Institutions
- 7.5.5. Healthcare Provider
- 7.5.6. Other End-Users
- 7.6. APAC Generative AI in Biology Market Analysis, Opportunity and Forecast, By Country , 2016-2032
- 7.6.1. APAC Generative AI in Biology Market Analysis by Country : Introduction
- 7.6.2. Market Size Absolute $ Opportunity Analysis and Forecast, Country , 2016-2032
- 7.6.2.1. China
- 7.6.2.2. Japan
- 7.6.2.3. South Korea
- 7.6.2.4. India
- 7.6.2.5. Australia & New Zeland
- 7.6.2.6. Indonesia
- 7.6.2.7. Malaysia
- 7.6.2.8. Philippines
- 7.6.2.9. Singapore
- 7.6.2.10. Thailand
- 7.6.2.11. Vietnam
- 7.6.2.12. Rest of APAC
- 8. Latin America Generative AI in Biology Market Analysis, Opportunity and Forecast, 2016-2032
- 8.1. Latin America Generative AI in Biology Market Analysis, 2016-2021
- 8.2. Latin America Generative AI in Biology Market Opportunity and Forecast, 2023-2032
- 8.3. Latin America Generative AI in Biology Market Analysis, Opportunity and Forecast, By Based On Application , 2016-2032
- 8.3.1. Latin America Generative AI in Biology Market Analysis by Based On Application : Introduction
- 8.3.2. Market Size Absolute $ Opportunity Analysis and Forecast, By Based On Application , 2016-2032
- 8.3.3. Drug Discovery and Development
- 8.3.4. Medical Imaging
- 8.3.5. Genomics and Proteomics
- 8.3.6. Protein Engineering
- 8.3.7. Synthetic Biology
- 8.3.8. Other Applications
- 8.4. Latin America Generative AI in Biology Market Analysis, Opportunity and Forecast, By Based On Technology, 2016-2032
- 8.4.1. Latin America Generative AI in Biology Market Analysis by Based On Technology: Introduction
- 8.4.2. Market Size Absolute $ Opportunity Analysis and Forecast, By Based On Technology, 2016-2032
- 8.4.3. Generative Adversarial Networks
- 8.4.4. Variational Autoencoders
- 8.4.5. Reinforcement Learning
- 8.4.6. Other Technologies
- 8.5. Latin America Generative AI in Biology Market Analysis, Opportunity and Forecast, By Based On End-User, 2016-2032
- 8.5.1. Latin America Generative AI in Biology Market Analysis by Based On End-User: Introduction
- 8.5.2. Market Size Absolute $ Opportunity Analysis and Forecast, By Based On End-User, 2016-2032
- 8.5.3. Pharmaceutical and Biotechnology Companies
- 8.5.4. Research Institutions
- 8.5.5. Healthcare Provider
- 8.5.6. Other End-Users
- 8.6. Latin America Generative AI in Biology Market Analysis, Opportunity and Forecast, By Country , 2016-2032
- 8.6.1. Latin America Generative AI in Biology Market Analysis by Country : Introduction
- 8.6.2. Market Size Absolute $ Opportunity Analysis and Forecast, Country , 2016-2032
- 8.6.2.1. Brazil
- 8.6.2.2. Colombia
- 8.6.2.3. Chile
- 8.6.2.4. Argentina
- 8.6.2.5. Costa Rica
- 8.6.2.6. Rest of Latin America
- 9. Middle East & Africa Generative AI in Biology Market Analysis, Opportunity and Forecast, 2016-2032
- 9.1. Middle East & Africa Generative AI in Biology Market Analysis, 2016-2021
- 9.2. Middle East & Africa Generative AI in Biology Market Opportunity and Forecast, 2023-2032
- 9.3. Middle East & Africa Generative AI in Biology Market Analysis, Opportunity and Forecast, By Based On Application , 2016-2032
- 9.3.1. Middle East & Africa Generative AI in Biology Market Analysis by Based On Application : Introduction
- 9.3.2. Market Size Absolute $ Opportunity Analysis and Forecast, By Based On Application , 2016-2032
- 9.3.3. Drug Discovery and Development
- 9.3.4. Medical Imaging
- 9.3.5. Genomics and Proteomics
- 9.3.6. Protein Engineering
- 9.3.7. Synthetic Biology
- 9.3.8. Other Applications
- 9.4. Middle East & Africa Generative AI in Biology Market Analysis, Opportunity and Forecast, By Based On Technology, 2016-2032
- 9.4.1. Middle East & Africa Generative AI in Biology Market Analysis by Based On Technology: Introduction
- 9.4.2. Market Size Absolute $ Opportunity Analysis and Forecast, By Based On Technology, 2016-2032
- 9.4.3. Generative Adversarial Networks
- 9.4.4. Variational Autoencoders
- 9.4.5. Reinforcement Learning
- 9.4.6. Other Technologies
- 9.5. Middle East & Africa Generative AI in Biology Market Analysis, Opportunity and Forecast, By Based On End-User, 2016-2032
- 9.5.1. Middle East & Africa Generative AI in Biology Market Analysis by Based On End-User: Introduction
- 9.5.2. Market Size Absolute $ Opportunity Analysis and Forecast, By Based On End-User, 2016-2032
- 9.5.3. Pharmaceutical and Biotechnology Companies
- 9.5.4. Research Institutions
- 9.5.5. Healthcare Provider
- 9.5.6. Other End-Users
- 9.6. Middle East & Africa Generative AI in Biology Market Analysis, Opportunity and Forecast, By Country , 2016-2032
- 9.6.1. Middle East & Africa Generative AI in Biology Market Analysis by Country : Introduction
- 9.6.2. Market Size Absolute $ Opportunity Analysis and Forecast, Country , 2016-2032
- 9.6.2.1. Algeria
- 9.6.2.2. Egypt
- 9.6.2.3. Israel
- 9.6.2.4. Kuwait
- 9.6.2.5. Nigeria
- 9.6.2.6. Saudi Arabia
- 9.6.2.7. South Africa
- 9.6.2.8. Turkey
- 9.6.2.9. The UAE
- 9.6.2.10. Rest of MEA
- 10. Global Generative AI in Biology Market Analysis, Opportunity and Forecast, By Region , 2016-2032
- 10.1. Global Generative AI in Biology Market Analysis by Region : Introduction
- 10.2. Market Size Absolute $ Opportunity Analysis and Forecast, By Region , 2016-2032
- 10.2.1. North America
- 10.2.2. Western Europe
- 10.2.3. Eastern Europe
- 10.2.4. APAC
- 10.2.5. Latin America
- 10.2.6. Middle East & Africa
- 11. Global Generative AI in Biology Market Competitive Landscape, Market Share Analysis, and Company Profiles
- 11.1. Market Share Analysis
- 11.2. Company Profiles
- 11.3. NVIDIA Corporation
- 11.3.1. Company Overview
- 11.3.2. Financial Highlights
- 11.3.3. Product Portfolio
- 11.3.4. SWOT Analysis
- 11.3.5. Key Strategies and Developments
- 11.4. IBM Corporation
- 11.4.1. Company Overview
- 11.4.2. Financial Highlights
- 11.4.3. Product Portfolio
- 11.4.4. SWOT Analysis
- 11.4.5. Key Strategies and Developments
- 11.5. BenevolentAI
- 11.5.1. Company Overview
- 11.5.2. Financial Highlights
- 11.5.3. Product Portfolio
- 11.5.4. SWOT Analysis
- 11.5.5. Key Strategies and Developments
- 11.6. DeepMind Technologies Limited
- 11.6.1. Company Overview
- 11.6.2. Financial Highlights
- 11.6.3. Product Portfolio
- 11.6.4. SWOT Analysis
- 11.6.5. Key Strategies and Developments
- 11.7. Insilico Medicine
- 11.7.1. Company Overview
- 11.7.2. Financial Highlights
- 11.7.3. Product Portfolio
- 11.7.4. SWOT Analysis
- 11.7.5. Key Strategies and Developments
- 11.8. Recursion Pharmaceuticals
- 11.8.1. Company Overview
- 11.8.2. Financial Highlights
- 11.8.3. Product Portfolio
- 11.8.4. SWOT Analysis
- 11.8.5. Key Strategies and Developments
- 11.9. Zymergen
- 11.9.1. Company Overview
- 11.9.2. Financial Highlights
- 11.9.3. Product Portfolio
- 11.9.4. SWOT Analysis
- 11.9.5. Key Strategies and Developments
- 11.10. Other Key Players
- 11.10.1. Company Overview
- 11.10.2. Financial Highlights
- 11.10.3. Product Portfolio
- 11.10.4. SWOT Analysis
- 11.10.5. Key Strategies and Developments
- 12. Assumptions and Acronyms
- 13. Research Methodology
- 14. Contact
List of Figures
-
- Figure 1: Global Generative AI in Biology Market Revenue (US$ Mn) Market Share by Based On Application in 2022
- Figure 2: Global Generative AI in Biology Market Attractiveness Analysis by Based On Application , 2016-2032
- Figure 3: Global Generative AI in Biology Market Revenue (US$ Mn) Market Share by Based On Technologyin 2022
- Figure 4: Global Generative AI in Biology Market Attractiveness Analysis by Based On Technology, 2016-2032
- Figure 5: Global Generative AI in Biology Market Revenue (US$ Mn) Market Share by Based On End-Userin 2022
- Figure 6: Global Generative AI in Biology Market Attractiveness Analysis by Based On End-User, 2016-2032
- Figure 7: Global Generative AI in Biology Market Revenue (US$ Mn) Market Share by Region in 2022
- Figure 8: Global Generative AI in Biology Market Attractiveness Analysis by Region, 2016-2032
- Figure 9: Global Generative AI in Biology Market Revenue (US$ Mn) (2016-2032)
- Figure 10: Global Generative AI in Biology Market Revenue (US$ Mn) Comparison by Region (2016-2032)
- Figure 11: Global Generative AI in Biology Market Revenue (US$ Mn) Comparison by Based On Application (2016-2032)
- Figure 12: Global Generative AI in Biology Market Revenue (US$ Mn) Comparison by Based On Technology (2016-2032)
- Figure 13: Global Generative AI in Biology Market Revenue (US$ Mn) Comparison by Based On End-User (2016-2032)
- Figure 14: Global Generative AI in Biology Market Y-o-Y Growth Rate Comparison by Region (2016-2032)
- Figure 15: Global Generative AI in Biology Market Y-o-Y Growth Rate Comparison by Based On Application (2016-2032)
- Figure 16: Global Generative AI in Biology Market Y-o-Y Growth Rate Comparison by Based On Technology (2016-2032)
- Figure 17: Global Generative AI in Biology Market Y-o-Y Growth Rate Comparison by Based On End-User (2016-2032)
- Figure 18: Global Generative AI in Biology Market Share Comparison by Region (2016-2032)
- Figure 19: Global Generative AI in Biology Market Share Comparison by Based On Application (2016-2032)
- Figure 20: Global Generative AI in Biology Market Share Comparison by Based On Technology (2016-2032)
- Figure 21: Global Generative AI in Biology Market Share Comparison by Based On End-User (2016-2032)
- Figure 22: North America Generative AI in Biology Market Revenue (US$ Mn) Market Share by Based On Application in 2022
- Figure 23: North America Generative AI in Biology Market Attractiveness Analysis by Based On Application , 2016-2032
- Figure 24: North America Generative AI in Biology Market Revenue (US$ Mn) Market Share by Based On Technologyin 2022
- Figure 25: North America Generative AI in Biology Market Attractiveness Analysis by Based On Technology, 2016-2032
- Figure 26: North America Generative AI in Biology Market Revenue (US$ Mn) Market Share by Based On End-Userin 2022
- Figure 27: North America Generative AI in Biology Market Attractiveness Analysis by Based On End-User, 2016-2032
- Figure 28: North America Generative AI in Biology Market Revenue (US$ Mn) Market Share by Country in 2022
- Figure 29: North America Generative AI in Biology Market Attractiveness Analysis by Country, 2016-2032
- Figure 30: North America Generative AI in Biology Market Revenue (US$ Mn) (2016-2032)
- Figure 31: North America Generative AI in Biology Market Revenue (US$ Mn) Comparison by Country (2016-2032)
- Figure 32: North America Generative AI in Biology Market Revenue (US$ Mn) Comparison by Based On Application (2016-2032)
- Figure 33: North America Generative AI in Biology Market Revenue (US$ Mn) Comparison by Based On Technology (2016-2032)
- Figure 34: North America Generative AI in Biology Market Revenue (US$ Mn) Comparison by Based On End-User (2016-2032)
- Figure 35: North America Generative AI in Biology Market Y-o-Y Growth Rate Comparison by Country (2016-2032)
- Figure 36: North America Generative AI in Biology Market Y-o-Y Growth Rate Comparison by Based On Application (2016-2032)
- Figure 37: North America Generative AI in Biology Market Y-o-Y Growth Rate Comparison by Based On Technology (2016-2032)
- Figure 38: North America Generative AI in Biology Market Y-o-Y Growth Rate Comparison by Based On End-User (2016-2032)
- Figure 39: North America Generative AI in Biology Market Share Comparison by Country (2016-2032)
- Figure 40: North America Generative AI in Biology Market Share Comparison by Based On Application (2016-2032)
- Figure 41: North America Generative AI in Biology Market Share Comparison by Based On Technology (2016-2032)
- Figure 42: North America Generative AI in Biology Market Share Comparison by Based On End-User (2016-2032)
- Figure 43: Western Europe Generative AI in Biology Market Revenue (US$ Mn) Market Share by Based On Application in 2022
- Figure 44: Western Europe Generative AI in Biology Market Attractiveness Analysis by Based On Application , 2016-2032
- Figure 45: Western Europe Generative AI in Biology Market Revenue (US$ Mn) Market Share by Based On Technologyin 2022
- Figure 46: Western Europe Generative AI in Biology Market Attractiveness Analysis by Based On Technology, 2016-2032
- Figure 47: Western Europe Generative AI in Biology Market Revenue (US$ Mn) Market Share by Based On End-Userin 2022
- Figure 48: Western Europe Generative AI in Biology Market Attractiveness Analysis by Based On End-User, 2016-2032
- Figure 49: Western Europe Generative AI in Biology Market Revenue (US$ Mn) Market Share by Country in 2022
- Figure 50: Western Europe Generative AI in Biology Market Attractiveness Analysis by Country, 2016-2032
- Figure 51: Western Europe Generative AI in Biology Market Revenue (US$ Mn) (2016-2032)
- Figure 52: Western Europe Generative AI in Biology Market Revenue (US$ Mn) Comparison by Country (2016-2032)
- Figure 53: Western Europe Generative AI in Biology Market Revenue (US$ Mn) Comparison by Based On Application (2016-2032)
- Figure 54: Western Europe Generative AI in Biology Market Revenue (US$ Mn) Comparison by Based On Technology (2016-2032)
- Figure 55: Western Europe Generative AI in Biology Market Revenue (US$ Mn) Comparison by Based On End-User (2016-2032)
- Figure 56: Western Europe Generative AI in Biology Market Y-o-Y Growth Rate Comparison by Country (2016-2032)
- Figure 57: Western Europe Generative AI in Biology Market Y-o-Y Growth Rate Comparison by Based On Application (2016-2032)
- Figure 58: Western Europe Generative AI in Biology Market Y-o-Y Growth Rate Comparison by Based On Technology (2016-2032)
- Figure 59: Western Europe Generative AI in Biology Market Y-o-Y Growth Rate Comparison by Based On End-User (2016-2032)
- Figure 60: Western Europe Generative AI in Biology Market Share Comparison by Country (2016-2032)
- Figure 61: Western Europe Generative AI in Biology Market Share Comparison by Based On Application (2016-2032)
- Figure 62: Western Europe Generative AI in Biology Market Share Comparison by Based On Technology (2016-2032)
- Figure 63: Western Europe Generative AI in Biology Market Share Comparison by Based On End-User (2016-2032)
- Figure 64: Eastern Europe Generative AI in Biology Market Revenue (US$ Mn) Market Share by Based On Application in 2022
- Figure 65: Eastern Europe Generative AI in Biology Market Attractiveness Analysis by Based On Application , 2016-2032
- Figure 66: Eastern Europe Generative AI in Biology Market Revenue (US$ Mn) Market Share by Based On Technologyin 2022
- Figure 67: Eastern Europe Generative AI in Biology Market Attractiveness Analysis by Based On Technology, 2016-2032
- Figure 68: Eastern Europe Generative AI in Biology Market Revenue (US$ Mn) Market Share by Based On End-Userin 2022
- Figure 69: Eastern Europe Generative AI in Biology Market Attractiveness Analysis by Based On End-User, 2016-2032
- Figure 70: Eastern Europe Generative AI in Biology Market Revenue (US$ Mn) Market Share by Country in 2022
- Figure 71: Eastern Europe Generative AI in Biology Market Attractiveness Analysis by Country, 2016-2032
- Figure 72: Eastern Europe Generative AI in Biology Market Revenue (US$ Mn) (2016-2032)
- Figure 73: Eastern Europe Generative AI in Biology Market Revenue (US$ Mn) Comparison by Country (2016-2032)
- Figure 74: Eastern Europe Generative AI in Biology Market Revenue (US$ Mn) Comparison by Based On Application (2016-2032)
- Figure 75: Eastern Europe Generative AI in Biology Market Revenue (US$ Mn) Comparison by Based On Technology (2016-2032)
- Figure 76: Eastern Europe Generative AI in Biology Market Revenue (US$ Mn) Comparison by Based On End-User (2016-2032)
- Figure 77: Eastern Europe Generative AI in Biology Market Y-o-Y Growth Rate Comparison by Country (2016-2032)
- Figure 78: Eastern Europe Generative AI in Biology Market Y-o-Y Growth Rate Comparison by Based On Application (2016-2032)
- Figure 79: Eastern Europe Generative AI in Biology Market Y-o-Y Growth Rate Comparison by Based On Technology (2016-2032)
- Figure 80: Eastern Europe Generative AI in Biology Market Y-o-Y Growth Rate Comparison by Based On End-User (2016-2032)
- Figure 81: Eastern Europe Generative AI in Biology Market Share Comparison by Country (2016-2032)
- Figure 82: Eastern Europe Generative AI in Biology Market Share Comparison by Based On Application (2016-2032)
- Figure 83: Eastern Europe Generative AI in Biology Market Share Comparison by Based On Technology (2016-2032)
- Figure 84: Eastern Europe Generative AI in Biology Market Share Comparison by Based On End-User (2016-2032)
- Figure 85: APAC Generative AI in Biology Market Revenue (US$ Mn) Market Share by Based On Application in 2022
- Figure 86: APAC Generative AI in Biology Market Attractiveness Analysis by Based On Application , 2016-2032
- Figure 87: APAC Generative AI in Biology Market Revenue (US$ Mn) Market Share by Based On Technologyin 2022
- Figure 88: APAC Generative AI in Biology Market Attractiveness Analysis by Based On Technology, 2016-2032
- Figure 89: APAC Generative AI in Biology Market Revenue (US$ Mn) Market Share by Based On End-Userin 2022
- Figure 90: APAC Generative AI in Biology Market Attractiveness Analysis by Based On End-User, 2016-2032
- Figure 91: APAC Generative AI in Biology Market Revenue (US$ Mn) Market Share by Country in 2022
- Figure 92: APAC Generative AI in Biology Market Attractiveness Analysis by Country, 2016-2032
- Figure 93: APAC Generative AI in Biology Market Revenue (US$ Mn) (2016-2032)
- Figure 94: APAC Generative AI in Biology Market Revenue (US$ Mn) Comparison by Country (2016-2032)
- Figure 95: APAC Generative AI in Biology Market Revenue (US$ Mn) Comparison by Based On Application (2016-2032)
- Figure 96: APAC Generative AI in Biology Market Revenue (US$ Mn) Comparison by Based On Technology (2016-2032)
- Figure 97: APAC Generative AI in Biology Market Revenue (US$ Mn) Comparison by Based On End-User (2016-2032)
- Figure 98: APAC Generative AI in Biology Market Y-o-Y Growth Rate Comparison by Country (2016-2032)
- Figure 99: APAC Generative AI in Biology Market Y-o-Y Growth Rate Comparison by Based On Application (2016-2032)
- Figure 100: APAC Generative AI in Biology Market Y-o-Y Growth Rate Comparison by Based On Technology (2016-2032)
- Figure 101: APAC Generative AI in Biology Market Y-o-Y Growth Rate Comparison by Based On End-User (2016-2032)
- Figure 102: APAC Generative AI in Biology Market Share Comparison by Country (2016-2032)
- Figure 103: APAC Generative AI in Biology Market Share Comparison by Based On Application (2016-2032)
- Figure 104: APAC Generative AI in Biology Market Share Comparison by Based On Technology (2016-2032)
- Figure 105: APAC Generative AI in Biology Market Share Comparison by Based On End-User (2016-2032)
- Figure 106: Latin America Generative AI in Biology Market Revenue (US$ Mn) Market Share by Based On Application in 2022
- Figure 107: Latin America Generative AI in Biology Market Attractiveness Analysis by Based On Application , 2016-2032
- Figure 108: Latin America Generative AI in Biology Market Revenue (US$ Mn) Market Share by Based On Technologyin 2022
- Figure 109: Latin America Generative AI in Biology Market Attractiveness Analysis by Based On Technology, 2016-2032
- Figure 110: Latin America Generative AI in Biology Market Revenue (US$ Mn) Market Share by Based On End-Userin 2022
- Figure 111: Latin America Generative AI in Biology Market Attractiveness Analysis by Based On End-User, 2016-2032
- Figure 112: Latin America Generative AI in Biology Market Revenue (US$ Mn) Market Share by Country in 2022
- Figure 113: Latin America Generative AI in Biology Market Attractiveness Analysis by Country, 2016-2032
- Figure 114: Latin America Generative AI in Biology Market Revenue (US$ Mn) (2016-2032)
- Figure 115: Latin America Generative AI in Biology Market Revenue (US$ Mn) Comparison by Country (2016-2032)
- Figure 116: Latin America Generative AI in Biology Market Revenue (US$ Mn) Comparison by Based On Application (2016-2032)
- Figure 117: Latin America Generative AI in Biology Market Revenue (US$ Mn) Comparison by Based On Technology (2016-2032)
- Figure 118: Latin America Generative AI in Biology Market Revenue (US$ Mn) Comparison by Based On End-User (2016-2032)
- Figure 119: Latin America Generative AI in Biology Market Y-o-Y Growth Rate Comparison by Country (2016-2032)
- Figure 120: Latin America Generative AI in Biology Market Y-o-Y Growth Rate Comparison by Based On Application (2016-2032)
- Figure 121: Latin America Generative AI in Biology Market Y-o-Y Growth Rate Comparison by Based On Technology (2016-2032)
- Figure 122: Latin America Generative AI in Biology Market Y-o-Y Growth Rate Comparison by Based On End-User (2016-2032)
- Figure 123: Latin America Generative AI in Biology Market Share Comparison by Country (2016-2032)
- Figure 124: Latin America Generative AI in Biology Market Share Comparison by Based On Application (2016-2032)
- Figure 125: Latin America Generative AI in Biology Market Share Comparison by Based On Technology (2016-2032)
- Figure 126: Latin America Generative AI in Biology Market Share Comparison by Based On End-User (2016-2032)
- Figure 127: Middle East & Africa Generative AI in Biology Market Revenue (US$ Mn) Market Share by Based On Application in 2022
- Figure 128: Middle East & Africa Generative AI in Biology Market Attractiveness Analysis by Based On Application , 2016-2032
- Figure 129: Middle East & Africa Generative AI in Biology Market Revenue (US$ Mn) Market Share by Based On Technologyin 2022
- Figure 130: Middle East & Africa Generative AI in Biology Market Attractiveness Analysis by Based On Technology, 2016-2032
- Figure 131: Middle East & Africa Generative AI in Biology Market Revenue (US$ Mn) Market Share by Based On End-Userin 2022
- Figure 132: Middle East & Africa Generative AI in Biology Market Attractiveness Analysis by Based On End-User, 2016-2032
- Figure 133: Middle East & Africa Generative AI in Biology Market Revenue (US$ Mn) Market Share by Country in 2022
- Figure 134: Middle East & Africa Generative AI in Biology Market Attractiveness Analysis by Country, 2016-2032
- Figure 135: Middle East & Africa Generative AI in Biology Market Revenue (US$ Mn) (2016-2032)
- Figure 136: Middle East & Africa Generative AI in Biology Market Revenue (US$ Mn) Comparison by Country (2016-2032)
- Figure 137: Middle East & Africa Generative AI in Biology Market Revenue (US$ Mn) Comparison by Based On Application (2016-2032)
- Figure 138: Middle East & Africa Generative AI in Biology Market Revenue (US$ Mn) Comparison by Based On Technology (2016-2032)
- Figure 139: Middle East & Africa Generative AI in Biology Market Revenue (US$ Mn) Comparison by Based On End-User (2016-2032)
- Figure 140: Middle East & Africa Generative AI in Biology Market Y-o-Y Growth Rate Comparison by Country (2016-2032)
- Figure 141: Middle East & Africa Generative AI in Biology Market Y-o-Y Growth Rate Comparison by Based On Application (2016-2032)
- Figure 142: Middle East & Africa Generative AI in Biology Market Y-o-Y Growth Rate Comparison by Based On Technology (2016-2032)
- Figure 143: Middle East & Africa Generative AI in Biology Market Y-o-Y Growth Rate Comparison by Based On End-User (2016-2032)
- Figure 144: Middle East & Africa Generative AI in Biology Market Share Comparison by Country (2016-2032)
- Figure 145: Middle East & Africa Generative AI in Biology Market Share Comparison by Based On Application (2016-2032)
- Figure 146: Middle East & Africa Generative AI in Biology Market Share Comparison by Based On Technology (2016-2032)
- Figure 147: Middle East & Africa Generative AI in Biology Market Share Comparison by Based On End-User (2016-2032)
List of Tables- Table 1: Global Generative AI in Biology Market Comparison by Based On Application (2016-2032)
- Table 2: Global Generative AI in Biology Market Comparison by Based On Technology (2016-2032)
- Table 3: Global Generative AI in Biology Market Comparison by Based On End-User (2016-2032)
- Table 4: Global Generative AI in Biology Market Revenue (US$ Mn) Comparison by Region (2016-2032)
- Table 5: Global Generative AI in Biology Market Revenue (US$ Mn) (2016-2032)
- Table 6: Global Generative AI in Biology Market Revenue (US$ Mn) Comparison by Region (2016-2032)
- Table 7: Global Generative AI in Biology Market Revenue (US$ Mn) Comparison by Based On Application (2016-2032)
- Table 8: Global Generative AI in Biology Market Revenue (US$ Mn) Comparison by Based On Technology (2016-2032)
- Table 9: Global Generative AI in Biology Market Revenue (US$ Mn) Comparison by Based On End-User (2016-2032)
- Table 10: Global Generative AI in Biology Market Y-o-Y Growth Rate Comparison by Region (2016-2032)
- Table 11: Global Generative AI in Biology Market Y-o-Y Growth Rate Comparison by Based On Application (2016-2032)
- Table 12: Global Generative AI in Biology Market Y-o-Y Growth Rate Comparison by Based On Technology (2016-2032)
- Table 13: Global Generative AI in Biology Market Y-o-Y Growth Rate Comparison by Based On End-User (2016-2032)
- Table 14: Global Generative AI in Biology Market Share Comparison by Region (2016-2032)
- Table 15: Global Generative AI in Biology Market Share Comparison by Based On Application (2016-2032)
- Table 16: Global Generative AI in Biology Market Share Comparison by Based On Technology (2016-2032)
- Table 17: Global Generative AI in Biology Market Share Comparison by Based On End-User (2016-2032)
- Table 18: North America Generative AI in Biology Market Comparison by Based On Technology (2016-2032)
- Table 19: North America Generative AI in Biology Market Comparison by Based On End-User (2016-2032)
- Table 20: North America Generative AI in Biology Market Revenue (US$ Mn) Comparison by Country (2016-2032)
- Table 21: North America Generative AI in Biology Market Revenue (US$ Mn) (2016-2032)
- Table 22: North America Generative AI in Biology Market Revenue (US$ Mn) Comparison by Country (2016-2032)
- Table 23: North America Generative AI in Biology Market Revenue (US$ Mn) Comparison by Based On Application (2016-2032)
- Table 24: North America Generative AI in Biology Market Revenue (US$ Mn) Comparison by Based On Technology (2016-2032)
- Table 25: North America Generative AI in Biology Market Revenue (US$ Mn) Comparison by Based On End-User (2016-2032)
- Table 26: North America Generative AI in Biology Market Y-o-Y Growth Rate Comparison by Country (2016-2032)
- Table 27: North America Generative AI in Biology Market Y-o-Y Growth Rate Comparison by Based On Application (2016-2032)
- Table 28: North America Generative AI in Biology Market Y-o-Y Growth Rate Comparison by Based On Technology (2016-2032)
- Table 29: North America Generative AI in Biology Market Y-o-Y Growth Rate Comparison by Based On End-User (2016-2032)
- Table 30: North America Generative AI in Biology Market Share Comparison by Country (2016-2032)
- Table 31: North America Generative AI in Biology Market Share Comparison by Based On Application (2016-2032)
- Table 32: North America Generative AI in Biology Market Share Comparison by Based On Technology (2016-2032)
- Table 33: North America Generative AI in Biology Market Share Comparison by Based On End-User (2016-2032)
- Table 34: Western Europe Generative AI in Biology Market Comparison by Based On Application (2016-2032)
- Table 35: Western Europe Generative AI in Biology Market Comparison by Based On Technology (2016-2032)
- Table 36: Western Europe Generative AI in Biology Market Comparison by Based On End-User (2016-2032)
- Table 37: Western Europe Generative AI in Biology Market Revenue (US$ Mn) Comparison by Country (2016-2032)
- Table 38: Western Europe Generative AI in Biology Market Revenue (US$ Mn) (2016-2032)
- Table 39: Western Europe Generative AI in Biology Market Revenue (US$ Mn) Comparison by Country (2016-2032)
- Table 40: Western Europe Generative AI in Biology Market Revenue (US$ Mn) Comparison by Based On Application (2016-2032)
- Table 41: Western Europe Generative AI in Biology Market Revenue (US$ Mn) Comparison by Based On Technology (2016-2032)
- Table 42: Western Europe Generative AI in Biology Market Revenue (US$ Mn) Comparison by Based On End-User (2016-2032)
- Table 43: Western Europe Generative AI in Biology Market Y-o-Y Growth Rate Comparison by Country (2016-2032)
- Table 44: Western Europe Generative AI in Biology Market Y-o-Y Growth Rate Comparison by Based On Application (2016-2032)
- Table 45: Western Europe Generative AI in Biology Market Y-o-Y Growth Rate Comparison by Based On Technology (2016-2032)
- Table 46: Western Europe Generative AI in Biology Market Y-o-Y Growth Rate Comparison by Based On End-User (2016-2032)
- Table 47: Western Europe Generative AI in Biology Market Share Comparison by Country (2016-2032)
- Table 48: Western Europe Generative AI in Biology Market Share Comparison by Based On Application (2016-2032)
- Table 49: Western Europe Generative AI in Biology Market Share Comparison by Based On Technology (2016-2032)
- Table 50: Western Europe Generative AI in Biology Market Share Comparison by Based On End-User (2016-2032)
- Table 51: Eastern Europe Generative AI in Biology Market Comparison by Based On Application (2016-2032)
- Table 52: Eastern Europe Generative AI in Biology Market Comparison by Based On Technology (2016-2032)
- Table 53: Eastern Europe Generative AI in Biology Market Comparison by Based On End-User (2016-2032)
- Table 54: Eastern Europe Generative AI in Biology Market Revenue (US$ Mn) Comparison by Country (2016-2032)
- Table 55: Eastern Europe Generative AI in Biology Market Revenue (US$ Mn) (2016-2032)
- Table 56: Eastern Europe Generative AI in Biology Market Revenue (US$ Mn) Comparison by Country (2016-2032)
- Table 57: Eastern Europe Generative AI in Biology Market Revenue (US$ Mn) Comparison by Based On Application (2016-2032)
- Table 58: Eastern Europe Generative AI in Biology Market Revenue (US$ Mn) Comparison by Based On Technology (2016-2032)
- Table 59: Eastern Europe Generative AI in Biology Market Revenue (US$ Mn) Comparison by Based On End-User (2016-2032)
- Table 60: Eastern Europe Generative AI in Biology Market Y-o-Y Growth Rate Comparison by Country (2016-2032)
- Table 61: Eastern Europe Generative AI in Biology Market Y-o-Y Growth Rate Comparison by Based On Application (2016-2032)
- Table 62: Eastern Europe Generative AI in Biology Market Y-o-Y Growth Rate Comparison by Based On Technology (2016-2032)
- Table 63: Eastern Europe Generative AI in Biology Market Y-o-Y Growth Rate Comparison by Based On End-User (2016-2032)
- Table 64: Eastern Europe Generative AI in Biology Market Share Comparison by Country (2016-2032)
- Table 65: Eastern Europe Generative AI in Biology Market Share Comparison by Based On Application (2016-2032)
- Table 66: Eastern Europe Generative AI in Biology Market Share Comparison by Based On Technology (2016-2032)
- Table 67: Eastern Europe Generative AI in Biology Market Share Comparison by Based On End-User (2016-2032)
- Table 68: APAC Generative AI in Biology Market Comparison by Based On Application (2016-2032)
- Table 69: APAC Generative AI in Biology Market Comparison by Based On Technology (2016-2032)
- Table 70: APAC Generative AI in Biology Market Comparison by Based On End-User (2016-2032)
- Table 71: APAC Generative AI in Biology Market Revenue (US$ Mn) Comparison by Country (2016-2032)
- Table 72: APAC Generative AI in Biology Market Revenue (US$ Mn) (2016-2032)
- Table 73: APAC Generative AI in Biology Market Revenue (US$ Mn) Comparison by Country (2016-2032)
- Table 74: APAC Generative AI in Biology Market Revenue (US$ Mn) Comparison by Based On Application (2016-2032)
- Table 75: APAC Generative AI in Biology Market Revenue (US$ Mn) Comparison by Based On Technology (2016-2032)
- Table 76: APAC Generative AI in Biology Market Revenue (US$ Mn) Comparison by Based On End-User (2016-2032)
- Table 77: APAC Generative AI in Biology Market Y-o-Y Growth Rate Comparison by Country (2016-2032)
- Table 78: APAC Generative AI in Biology Market Y-o-Y Growth Rate Comparison by Based On Application (2016-2032)
- Table 79: APAC Generative AI in Biology Market Y-o-Y Growth Rate Comparison by Based On Technology (2016-2032)
- Table 80: APAC Generative AI in Biology Market Y-o-Y Growth Rate Comparison by Based On End-User (2016-2032)
- Table 81: APAC Generative AI in Biology Market Share Comparison by Country (2016-2032)
- Table 82: APAC Generative AI in Biology Market Share Comparison by Based On Application (2016-2032)
- Table 83: APAC Generative AI in Biology Market Share Comparison by Based On Technology (2016-2032)
- Table 84: APAC Generative AI in Biology Market Share Comparison by Based On End-User (2016-2032)
- Table 85: Latin America Generative AI in Biology Market Comparison by Based On Application (2016-2032)
- Table 86: Latin America Generative AI in Biology Market Comparison by Based On Technology (2016-2032)
- Table 87: Latin America Generative AI in Biology Market Comparison by Based On End-User (2016-2032)
- Table 88: Latin America Generative AI in Biology Market Revenue (US$ Mn) Comparison by Country (2016-2032)
- Table 89: Latin America Generative AI in Biology Market Revenue (US$ Mn) (2016-2032)
- Table 90: Latin America Generative AI in Biology Market Revenue (US$ Mn) Comparison by Country (2016-2032)
- Table 91: Latin America Generative AI in Biology Market Revenue (US$ Mn) Comparison by Based On Application (2016-2032)
- Table 92: Latin America Generative AI in Biology Market Revenue (US$ Mn) Comparison by Based On Technology (2016-2032)
- Table 93: Latin America Generative AI in Biology Market Revenue (US$ Mn) Comparison by Based On End-User (2016-2032)
- Table 94: Latin America Generative AI in Biology Market Y-o-Y Growth Rate Comparison by Country (2016-2032)
- Table 95: Latin America Generative AI in Biology Market Y-o-Y Growth Rate Comparison by Based On Application (2016-2032)
- Table 96: Latin America Generative AI in Biology Market Y-o-Y Growth Rate Comparison by Based On Technology (2016-2032)
- Table 97: Latin America Generative AI in Biology Market Y-o-Y Growth Rate Comparison by Based On End-User (2016-2032)
- Table 98: Latin America Generative AI in Biology Market Share Comparison by Country (2016-2032)
- Table 99: Latin America Generative AI in Biology Market Share Comparison by Based On Application (2016-2032)
- Table 100: Latin America Generative AI in Biology Market Share Comparison by Based On Technology (2016-2032)
- Table 101: Latin America Generative AI in Biology Market Share Comparison by Based On End-User (2016-2032)
- Table 102: Middle East & Africa Generative AI in Biology Market Comparison by Based On Application (2016-2032)
- Table 103: Middle East & Africa Generative AI in Biology Market Comparison by Based On Technology (2016-2032)
- Table 104: Middle East & Africa Generative AI in Biology Market Comparison by Based On End-User (2016-2032)
- Table 105: Middle East & Africa Generative AI in Biology Market Revenue (US$ Mn) Comparison by Country (2016-2032)
- Table 106: Middle East & Africa Generative AI in Biology Market Revenue (US$ Mn) (2016-2032)
- Table 107: Middle East & Africa Generative AI in Biology Market Revenue (US$ Mn) Comparison by Country (2016-2032)
- Table 108: Middle East & Africa Generative AI in Biology Market Revenue (US$ Mn) Comparison by Based On Application (2016-2032)
- Table 109: Middle East & Africa Generative AI in Biology Market Revenue (US$ Mn) Comparison by Based On Technology (2016-2032)
- Table 110: Middle East & Africa Generative AI in Biology Market Revenue (US$ Mn) Comparison by Based On End-User (2016-2032)
- Table 111: Middle East & Africa Generative AI in Biology Market Y-o-Y Growth Rate Comparison by Country (2016-2032)
- Table 112: Middle East & Africa Generative AI in Biology Market Y-o-Y Growth Rate Comparison by Based On Application (2016-2032)
- Table 113: Middle East & Africa Generative AI in Biology Market Y-o-Y Growth Rate Comparison by Based On Technology (2016-2032)
- Table 114: Middle East & Africa Generative AI in Biology Market Y-o-Y Growth Rate Comparison by Based On End-User (2016-2032)
- Table 115: Middle East & Africa Generative AI in Biology Market Share Comparison by Country (2016-2032)
- Table 116: Middle East & Africa Generative AI in Biology Market Share Comparison by Based On Application (2016-2032)
- Table 117: Middle East & Africa Generative AI in Biology Market Share Comparison by Based On Technology (2016-2032)
- Table 118: Middle East & Africa Generative AI in Biology Market Share Comparison by Based On End-User (2016-2032)
- 1. Executive Summary
-
- NVIDIA Corporation
- IBM Corporation
- BenevolentAI
- DeepMind Technologies Limited
- Insilico Medicine
- Recursion Pharmaceuticals
- Zymergen
- Other Key Players
Our Clients


View Our Licence Options
