
Functional Protein Market By Type(Hydrolysates, Hydrolyzed Animal Protein), By Whey-based(Isolate, Concentrate), By Soy-based(Isolate, Concentrate), By Source(Plants, Animals), By Form(Liquid, Dry), By Application(Functional Food & Beverages, Dietary Supplements), By Region And Companies - Industry Segment Outlook, Market Assessment, Competition Scenario, Trends, And Forecast 2023-2032
-
3672
-
Jul 2023
-
164
-


-
This report was compiled by Shreyas Rokade Shreyas Rokade is a seasoned Research Analyst with CMFE, bringing extensive expertise in market research and consulting, with a strong background in Chemical Engineering. Correspondence Team Lead-CMFE Linkedin | Detailed Market research Methodology Our methodology involves a mix of primary research, including interviews with leading mental health experts, and secondary research from reputable medical journals and databases. View Detailed Methodology Page
-
Quick Navigation
Report Overview
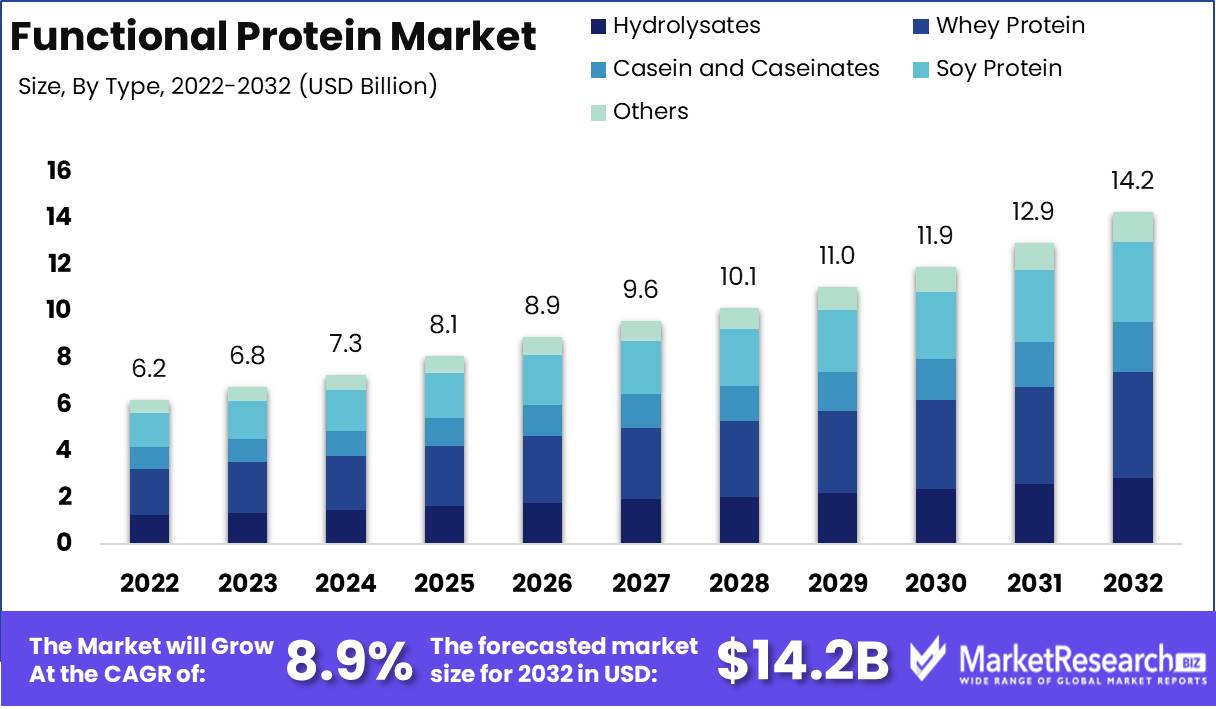
Functional Protein Market size is expected to be worth around USD 14.2 Bn by 2032 from USD 6.2 Bn in 2022, growing at a CAGR of 8.9% during the forecast period from 2023 to 2032.
Functional Protein are proteins that have been modified or engineered to provide improved functionality in a variety of applications. The objective of the development of Functional Protein is to improve a variety of properties, including stability, solubility, digestibility, and sensory qualities, among others. These proteins play an important function in numerous industries, including the food and beverage, pharmaceutical, cosmetic, and animal feed sectors.
The Functional Protein market is of utmost significance and provides numerous benefits to both consumers and enterprises. Functional Protein can provide consumers with health benefits such as improved digestion, enhanced muscle growth, increased energy levels, and a reduced risk of chronic diseases. Incorporating Functional Protein into their products allows businesses to offer added value to their customers and obtain a competitive advantage in the marketplace.
The development of plant-based proteins is a significant innovation in the Functional Protein market. Plant-based proteins have acquired immense popularity due to the increasing popularity of plant-based diets and the demand for sustainable and cruelty-free products. These proteins, derived from sources such as soy, peas, and hemp, provide a viable alternative to traditional animal-based proteins and cater to the increasing demand for vegetarian and vegan-friendly options.
The Functional Protein market has also seen significant investments and incorporation into numerous products and services. Diverse industries recognize the potential of Functional Protein and are investing significantly in research and development to create innovative products that satisfy consumer demands. In the food and beverage industry, for instance, Functional Protein are used to improve the sensory qualities of products, create meat substitutes, and increase the nutritional value of foods.
The market growth of Functional Protein can be attributed to the diversity of their applications. In addition to functional foods, dietary supplements, sports nutrition, pharmaceuticals, cosmetics, and animal feed, these proteins have applications in other industries. The increasing consumer awareness of health and wellness, along with the rising demand for functional and organic proteins, has propelled the growth of the Functional Protein market across these industries.
Driving factors
Enhancing Consumer Understanding of Nutrition and Health
With the advent of social media, simple access to information, and a greater emphasis on personal well-being, consumers are becoming more aware of the importance of nutrition to their overall health. This increased awareness has led to a shift in consumer behavior as individuals strive to make informed dietary choices. Functional Protein enable consumers to maximize their nutrition and meet their specific health goals, whether they are weight management, muscle development, or general vitality. Consequently, the demand for Functional Protein has skyrocketed, spawning a market that accommodates the diverse needs of health-conscious consumers.
Expansion of the Sports and Fitness Industry
The sports and fitness industry has experienced unprecedented growth in recent years. As more individuals prioritize physical activity and adopt fitness regimens, the demand for Functional Protein has increased exponentially. Athletes and fitness enthusiasts alike recognize the significance of protein for muscle recovery and growth, prompting them to supplement their workouts with Functional Protein of superior quality. The Functional Protein market has responded to this rising demand by developing innovative products, such as protein powders and energy bars, that cater to the specific needs of athletes. This market expansion has been fueled by the significant role Functional Protein play in optimizing athletic performance and facilitating post-exercise recovery.
Advancements in Food Science and Protein Research
Significant transformations have occurred in the food industry, with advancements in food science and protein research driving innovation in the Functional Protein market. Continuous research and development have led to the discovery and development of novel, multiFunctional Protein. With functional advancements now comprising a vast array of plant-based, animal-based, and alternative proteins, consumers now have more options. The ability of Functional Protein to provide specific health benefits, such as improved digestion, enhanced immune function, and weight management, has fueled their popularity among consumers. Manufacturers have taken advantage of these advancements by incorporating Functional Protein into a variety of food and beverage products, making them more accessible to consumers worldwide.
Growing demand for functional and clean-label ingredients
In addition to searching out products with functional protein content, consumers are becoming increasingly conscious of the ingredients in the foods and beverages they consume. This has increased the demand for minimally processed, artificial additive-free ingredients with clean labels. Functional Protein that meet these clean-label requirements are in high demand among health-conscious consumers. The market has responded by providing Functional Protein derived from natural sources, ensuring that they meet consumer demands for wholesome and clean nutritional alternatives. This shift towards clean-label components in Functional Protein has not only accommodated consumer preferences but also established quality- and transparency-focused brands as market leaders.
Restraining Factors
High production costs
The production of Functional Protein frequently entails costly, complex processes, such as recombinant DNA technology or fermentation. These costs are frequently passed on to consumers, making functional protein products more expensive than conventional alternatives. Particularly in price-sensitive regions or industries, high production costs can restrict market expansion.
Regulatory challenges
The Functional Protein market is subject to stringent regulatory requirements, particularly in the food and pharmaceutical industries. Obtaining regulatory approvals for new Functional Protein or applications can be an expensive and time-consuming endeavor. Strict regulations may discourage businesses from investing in research and development, resulting in a restricted selection of functional protein products.
Allergenicity and safety concerns
Certain Functional Protein, particularly those derived from common allergenic sources like milk, eggs, soy milk, or nuts, may pose allergenic hazards to certain individuals. Consumers and manufacturers may be reluctant to use functional protein products due to safety concerns regarding potential adverse reactions. To mitigate these concerns and establish market confidence, exhaustive safety assessments and allergenicity studies are necessary.
Type Analysis
The Whey based Segment dominates the Functional Protein market.
The Functional Protein market is a rapidly expanding industry in which numerous segments vie for dominance. In recent years, the whey-based market segment has acquired significant traction. Milk-derived whey protein has grown in popularity due to its numerous health benefits and versatile applications.
Rich in essential amino acids, whey protein is an excellent source of nutrition for those seeking to improve athletic performance, develop muscle, or simply maintain a healthy lifestyle. The high bioavailability of whey protein facilitates the body's absorption and utilization of amino acids, resulting in accelerated recovery and increased muscle growth.
Source Analysis
Animals dominate the Functional Protein market.
While whey protein has risen to prominence on the Functional Protein market, it is essential not to neglect the importance of animal-based proteins in this industry. Animal proteins, such as those found in meat, fish, and eggs, are renowned for their high quality and comprehensive amino acid profile.
The advantages of animal proteins over plant-based alternatives are numerous. First, they contain the correct proportions of all nine essential amino acids, rendering them superior in terms of protein quality. This ensures that individuals who consume animal-based proteins receive the full spectrum of essential nutrients for optimal health and performance.
Secondly, animal-based proteins are highly bioavailable, which means that they are readily ingested by the body and utilized effectively in a variety of physiological processes. Compared to plant-based proteins, this enables faster muscle recovery, enhanced muscle protein synthesis, and enhanced performance.
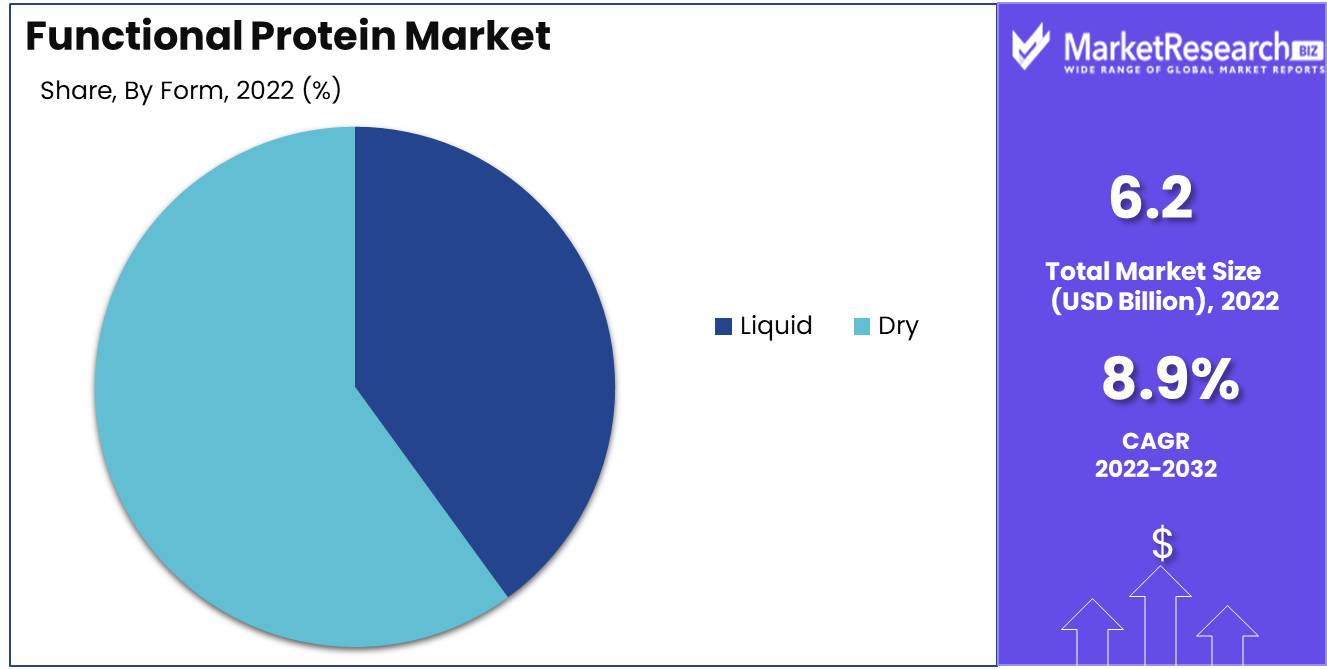
Form Analysis
Dry Segment dominates the Functional Protein marketplace.
The success and dominance of a protein in the Functional Protein market are significantly influenced by its form. The dried segment has emerged as the market leader, representing a significant portion of the market share.
Dry proteins, including powders and concentrates, have contributed to their dominance. First, their increased shelf life facilitates storage and transport, enabling manufacturers and distributors to reach a larger consumer base. This is especially important in emerging economies, where infrastructure and logistics may present difficulties.
Dry proteins are incredibly adaptable and can be readily incorporated into a vast array of products. They can be used as a constituent in functional foods, beverages, and supplements, providing consumers with a convenient and adaptable method of consuming protein. In addition, desiccated proteins can be reconstituted and used for a variety of purposes, such as the production of protein bars and meal replacements.
Key Market Segments
By Type
- Hydrolysates
- Whey Protein
- Casein and Caseinates
- Soy Protein
- Others
By Soy-based
- Isolate
- Concentrate
By Source
- Plants
- Animals
By Form
- Liquid
- Dry
By Application
- Functional Food & Beverages
- Dietary Supplements
- Animal Nutrition
Growth Opportunity
Creation of Functional Protein from Novel and Sustainable Sources
To remain competitive and meet rising consumer demands, the Functional Protein market must investigate novel methods of procuring proteins in an environmentally responsible manner. Traditional sources, such as dairy and soy, have dominated the market, but alternative sources, such as insect-based proteins, plant-based proteins, and even cultivated proteins, have enormous growth potential. Utilizing these sustainable and novel sources enables the Functional Protein market to cater to consumers seeking allergen-free, ethical, and environmentally favorable protein options.
Growth in Emerging Markets with Health-Conscious Customers
As global health consciousness increases, emerging markets present enormous growth opportunities for Functional Protein. As consumers in these markets become more health-conscious, the demand for protein-enriched functional foods and beverages increases. By delving into these markets through targeted marketing strategies, product customization, and local partnerships, the Functional Protein market can capture a substantial portion of the expanding consumer base.
Collaboration with Manufacturers and Retailers of Food and Beverage
Cooperation with food and beverage producers and retailers is an essential growth strategy for the Functional Protein market. The formation of strategic alliances enables the development of novel and innovative protein-enriched products and expands market penetration. By collaborating closely with manufacturers and retailers, the Functional Protein market can gain access to broader distribution networks and increase its visibility in order to effectively pique consumer interest.
Adoption of Protein Fortification in a Range of Food and Beverage Products
In recent years, protein fortification has acquired significant momentum, creating a prime growth opportunity for the Functional Protein market. The market can grow by investigating new applications outside of traditional sectors such as sports nutrition. By incorporating protein fortification into a variety of products, such as snacks, beverages, functional foods, and bakery items, the market will be able to cater to a greater number of consumers seeking protein-rich, convenient options throughout the day.
Latest Trends
The Development of Plant-Based and Pea Protein
In the dynamic world of nutrition, key market trends shape the Functional Protein market and determine consumer preferences. The growth of plant-based and pea protein has been nothing short of revolutionary among these trends. With growing concerns regarding health, sustainability, and animal welfare, an increasing number of individuals are embracing the power of these protein sources.
Plant-based proteins, derived from a wide range of plants such as soy, hemp, and rice, have garnered enormous popularity for their ability to offer an alternative to conventional animal-based proteins. Not only do they provide our bodies with essential amino acids, but they also offer a variety of additional health benefits. Plant-based proteins have attracted the attention of health-conscious consumers worldwide due to their weight management and chronic disease prevention benefits.
Collagen and Whey Protein Are Huge in the Beauty and Sports Nutrition Industries
While plant-based and pea protein dominates the market, collagen and whey protein remain popular choices in the beauty and sports nutrition industries. Collagen, the most ubiquitous protein in our bodies, is vital to the health and elasticity of our skin, hair, and nails. By incorporating collagen supplements or products containing collagen peptides into their routines, individuals hope to promote a youthful and vibrant complexion, strengthen their hair, and enhance their nail health.
On the other hand, whey protein, which is derived from milk during the cheese-making process, has been lauded as a complete protein for many years. Its ability to provide adequate amounts of all essential amino acids makes it particularly beneficial for athletes and fitness enthusiasts. In addition to aiding in muscle recovery and growth, whey protein also promotes satiety, which aids in weight management. Furthermore, whey protein has a high bioavailability, allowing for rapid absorption of nutrients by the body.
Proteins with Functional Roles
Beyond traditional protein sources, Functional Protein are acquiring traction and reshaping the beverage and snack industries. Functional Protein, carefully formulated to offer specific protein benefits, have paved the way for a new generation of functional beverages and snacks that go beyond fundamental nutrition.
Functional Protein, such as collagen peptides, probiotics, and fiber, are now available in a variety of formats, including protein bars, smoothies, and even beverages with added ingredients. These products not only provide the essential macronutrients necessary for a balanced diet but also offer additional functional benefits that are tailored to satisfy the specific needs of the consumer. Whether promoting gut health, facilitating digestion, or bolstering immune function, Functional Protein have become a driving force behind the innovation and growth of the functional food and beverage industry.
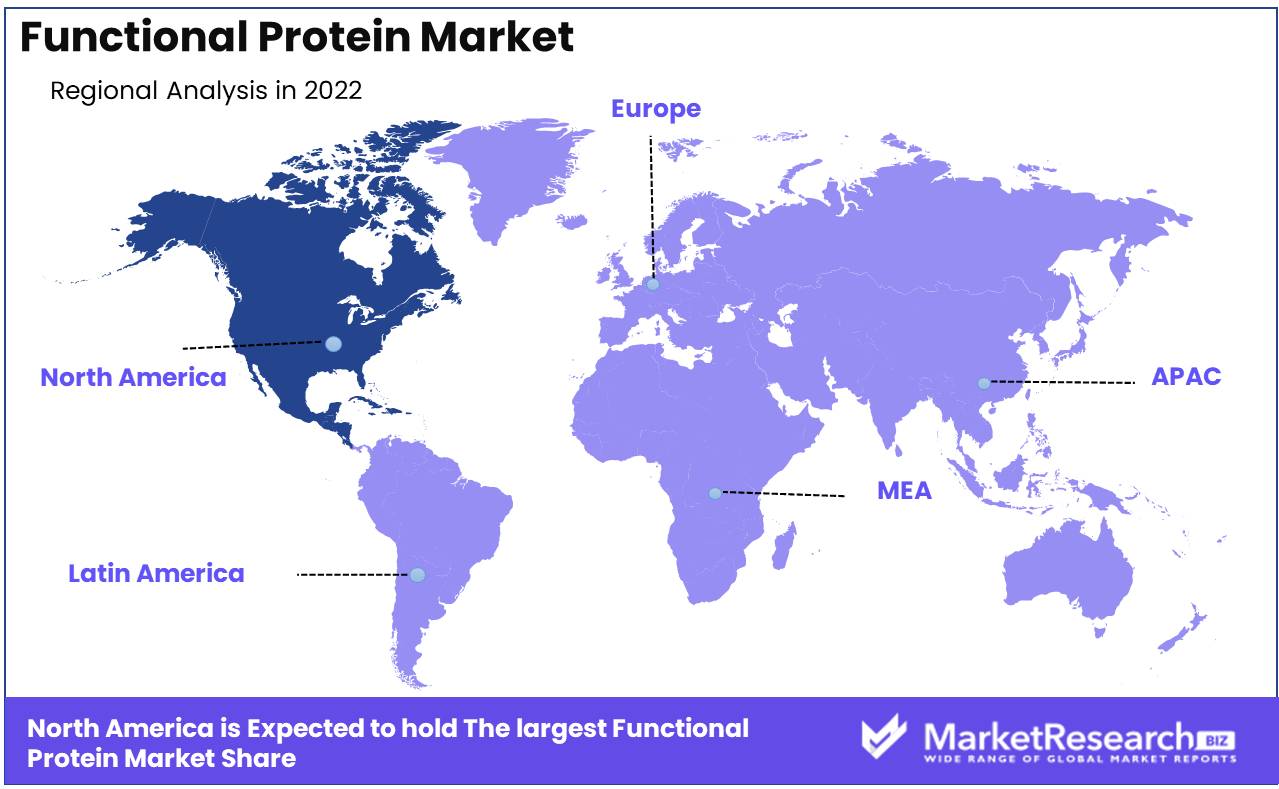
Regional Analysis
The Functional Protein Market is dominated by North America.
The dominance of North America in the Functional Protein market can be attributed to several important factors. First, the region has a robust food and beverage industry, which requires high-quality ingredients to meet the rising consumer demand for healthier and more functional products. Functional Protein, which are well-known for their health benefits and diverse applications, have gained immense popularity in this market, creating opportunities for businesses to innovate and diversify.
North America embraces innovative research and development practices, nurturing an environment conducive to the development of new products and technological advances in the Functional Protein industry. Companies in the region benefit from the presence of world-class research institutions, academic collaborations, and partnerships, which enable them to remain ahead of the curve and deliver products that are in line with changing consumer preferences and market trends.
The vast selection of Functional Protein available in North America contributes to its market dominance. From whey protein and casein to soy protein and collagen, the region provides a wide range of options to meet a variety of dietary and functional requirements. This extensive selection allows manufacturers and suppliers to meet the needs of a diverse consumer base, including athletes, health-conscious individuals, and those seeking solutions to specific health concerns.
Key Regions and Countries
North America
- US
- Canada
- Mexico
Western Europe
- Germany
- France
- The UK
- Spain
- Italy
- Portugal
- Ireland
- Austria
- Switzerland
- Benelux
- Nordic
- Rest of Western Europe
Eastern Europe
- Russia
- Poland
- The Czech Republic
- Greece
- Rest of Eastern Europe
APAC
- China
- Japan
- South Korea
- India
- Australia & New Zealand
- Indonesia
- Malaysia
- Philippines
- Singapore
- Thailand
- Vietnam
- Rest of APAC
Latin America
- Brazil
- Colombia
- Chile
- Argentina
- Costa Rica
- Rest of Latin America
Middle East & Africa
- Algeria
- Egypt
- Israel
- Kuwait
- Nigeria
- Saudi Arabia
- South Africa
- Turkey
- United Arab Emirates
- Rest of MEA
ADM is the world's leading producer of Functional Protein. ADM has established itself as a major participant in this market, thanks to its extensive selection of soy proteins, whey proteins, and plant-based proteins. The company concentrates on providing high-quality Functional Protein to diverse industries, including the food and beverage, pharmaceutical, and personal care sectors.
In addition to DowDuPont, DuPont is a major player in the Functional Protein market. The company is an industry leader in the production of soy proteins, which are extensively employed in applications such as meat substitutes, beverages, and infant formulas. DuPont's research and development expertise enables them to innovate and provide sustainable solutions to satisfy the growing demand for Functional Protein among consumers.
Kemin Industries Inc. is the world's foremost manufacturer of specialty ingredients, such as Functional Protein. Their team of scientists and researchers works tirelessly to create innovative and effective protein solutions for the animal feed, pet food, and human nutrition industries. Through their functional protein offerings, Kemin Industries, Inc. seeks to improve the health and well-being of both humans and animals.
Tate & Lyle, a multinational agribusiness headquartered in the United Kingdom, has made significant advances in the Functional Protein market. Tate & Lyle offers a variety of Functional Protein derived from diverse sources, such as corn, wheat, and dairy, with a focus on developing solutions that meet the evolving nutritional requirements of consumers. Their innovative product line serves a variety of industries, including food and beverage, confectionery, and pharmaceuticals.
Top Key Players in Functional Protein Market
- ADM
- DuPont.
- Kemin Industries Inc.
- Tate & Lyle
- Kerry Inc.
- DSM
- Cargill
- Incorporated
- BASF SE
- Ingredion
- Roquette Frères
- SunOpta
- Darling Ingredients.
- Omega Protein Corporation
- Dow
- Kemin Industries Inc.
- InVivo
- John Pointon & Sons Ltd.
- Glanbia Plc
- Herbalife International of America Inc.
- Amway India Enterprises Pvt. Ltd.
- Fonterra Co-operative Group Limited
Recent Development
- In 2023, DuPont, a company renowned for its cutting-edge innovations, made an exciting announcement in a significant step to meet evolving consumer expectations. The multinational conglomerate announced plans to introduce a series of innovative Functional Protein designed to improve nutrition.
- In 2022, DSM, a global powerhouse in health and nutrition, made an astounding move to keep up with the soaring demand for Functional Protein. The organization disclosed its ambitious expansion plans for the Functional Protein portfolio. The strategic initiative of DSM will introduce a variety of new products and services that appeal to the diverse preferences of consumers.
- In 2021, Roquette made ripples by introducing an innovative functional protein, demonstrating its commitment to sustainability. This protein with a concentration on sustainability aligns with Roquette's commitment to eco-friendly practices while still providing optimal nutritional value.
Report Scope
Report Features Description Market Value (2022) USD 6.2 Bn Forecast Revenue (2032) USD 14.2 Bn CAGR (2023-2032) 8.9% Base Year for Estimation 2022 Historic Period 2016-2022 Forecast Period 2023-2032 Report Coverage Revenue Forecast, Market Dynamics, COVID-19 Impact, Competitive Landscape, Recent Developments Segments Covered By Type(Hydrolysates, Hydrolyzed Animal Protein), By Whey-based(Isolate, Concentrate), By Soy-based(Isolate, Concentrate), By Source(Plants, Animals), By Form(Liquid, Dry), By Application(Functional Food & Beverages, Dietary Supplements) Regional Analysis North America – The US, Canada, & Mexico; Western Europe – Germany, France, The UK, Spain, Italy, Portugal, Ireland, Austria, Switzerland, Benelux, Nordic, & Rest of Western Europe; Eastern Europe – Russia, Poland, The Czech Republic, Greece, & Rest of Eastern Europe; APAC – China, Japan, South Korea, India, Australia & New Zealand, Indonesia, Malaysia, Philippines, Singapore, Thailand, Vietnam, & Rest of APAC; Latin America – Brazil, Colombia, Chile, Argentina, Costa Rica, & Rest of Latin America; Middle East & Africa – Algeria, Egypt, Israel, Kuwait, Nigeria, Saudi Arabia, South Africa, Turkey, United Arab Emirates, & Rest of MEA Competitive Landscape ADM, DuPont., Kemin Industries Inc., Tate & Lyle, Kerry Inc., DSM, Cargill, Incorporated, BASF SE, Ingredion, Roquette Frères, SunOpta, Darling Ingredients., Omega Protein Corporation, Dow, Kemin Industries Inc., InVivo, John Pointon & Sons Ltd., Glanbia Plc, Herbalife International of America Inc., Amway India Enterprises Pvt. Ltd. , Fonterra Co-operative Group Limited Customization Scope Customization for segments, region/country-level will be provided. Moreover, additional customization can be done based on the requirements. Purchase Options We have three licenses to opt for: Single User License, Multi-User License (Up to 5 Users), Corporate Use License (Unlimited User and Printable PDF) -
- 1. Executive Summary
- 1.1. Definition
- 1.2. Taxonomy
- 1.3. Research Scope
- 1.4. Key Analysis
- 1.5. Key Findings by Major Segments
- 1.6. Top strategies by Major Players
- 2. Global Functional Protein Market Overview
- 2.1. Functional Protein Market Dynamics
- 2.1.1. Drivers
- 2.1.2. Opportunities
- 2.1.3. Restraints
- 2.1.4. Challenges
- 2.2. Macro-economic Factors
- 2.3. Regulatory Framework
- 2.4. Market Investment Feasibility Index
- 2.5. PEST Analysis
- 2.6. PORTER’S Five Force Analysis
- 2.7. Drivers & Restraints Impact Analysis
- 2.8. Industry Chain Analysis
- 2.9. Cost Structure Analysis
- 2.10. Marketing Strategy
- 2.11. Russia-Ukraine War Impact Analysis
- 2.12. Opportunity Map Analysis
- 2.13. Market Competition Scenario Analysis
- 2.14. Product Life Cycle Analysis
- 2.15. Opportunity Orbits
- 2.16. Manufacturer Intensity Map
- 2.17. Major Companies sales by Value & Volume
- 2.1. Functional Protein Market Dynamics
- 3. Global Functional Protein Market Analysis, Opportunity and Forecast, 2016-2032
- 3.1. Global Functional Protein Market Analysis, 2016-2021
- 3.2. Global Functional Protein Market Opportunity and Forecast, 2023-2032
- 3.3. Global Functional Protein Market Analysis, Opportunity and Forecast, By By Type, 2016-2032
- 3.3.1. Global Functional Protein Market Analysis by By Type: Introduction
- 3.3.2. Market Size Absolute $ Opportunity Analysis and Forecast, By By Type, 2016-2032
- 3.3.3. Hydrolysates
- 3.3.4. Whey Protein
- 3.3.5. Casein and Caseinates
- 3.3.6. Soy Protein
- 3.3.7. Others
- 3.4. Global Functional Protein Market Analysis, Opportunity and Forecast, By By Soy-based, 2016-2032
- 3.4.1. Global Functional Protein Market Analysis by By Soy-based: Introduction
- 3.4.2. Market Size Absolute $ Opportunity Analysis and Forecast, By By Soy-based, 2016-2032
- 3.4.3. Isolate
- 3.4.4. Concentrate
- 3.5. Global Functional Protein Market Analysis, Opportunity and Forecast, By By Source, 2016-2032
- 3.5.1. Global Functional Protein Market Analysis by By Source: Introduction
- 3.5.2. Market Size Absolute $ Opportunity Analysis and Forecast, By By Source, 2016-2032
- 3.5.3. Plants
- 3.5.4. Animals
- 3.6. Global Functional Protein Market Analysis, Opportunity and Forecast, By By Form, 2016-2032
- 3.6.1. Global Functional Protein Market Analysis by By Form: Introduction
- 3.6.2. Market Size Absolute $ Opportunity Analysis and Forecast, By By Form, 2016-2032
- 3.6.3. Liquid
- 3.6.4. Dry
- 3.7. Global Functional Protein Market Analysis, Opportunity and Forecast, By By Application, 2016-2032
- 3.7.1. Global Functional Protein Market Analysis by By Application: Introduction
- 3.7.2. Market Size Absolute $ Opportunity Analysis and Forecast, By By Application, 2016-2032
- 3.7.3. Functional Food & Beverages
- 3.7.4. Dietary Supplements
- 3.7.5. Animal Nutrition
- 4. North America Functional Protein Market Analysis, Opportunity and Forecast, 2016-2032
- 4.1. North America Functional Protein Market Analysis, 2016-2021
- 4.2. North America Functional Protein Market Opportunity and Forecast, 2023-2032
- 4.3. North America Functional Protein Market Analysis, Opportunity and Forecast, By By Type, 2016-2032
- 4.3.1. North America Functional Protein Market Analysis by By Type: Introduction
- 4.3.2. Market Size Absolute $ Opportunity Analysis and Forecast, By By Type, 2016-2032
- 4.3.3. Hydrolysates
- 4.3.4. Whey Protein
- 4.3.5. Casein and Caseinates
- 4.3.6. Soy Protein
- 4.3.7. Others
- 4.4. North America Functional Protein Market Analysis, Opportunity and Forecast, By By Soy-based, 2016-2032
- 4.4.1. North America Functional Protein Market Analysis by By Soy-based: Introduction
- 4.4.2. Market Size Absolute $ Opportunity Analysis and Forecast, By By Soy-based, 2016-2032
- 4.4.3. Isolate
- 4.4.4. Concentrate
- 4.5. North America Functional Protein Market Analysis, Opportunity and Forecast, By By Source, 2016-2032
- 4.5.1. North America Functional Protein Market Analysis by By Source: Introduction
- 4.5.2. Market Size Absolute $ Opportunity Analysis and Forecast, By By Source, 2016-2032
- 4.5.3. Plants
- 4.5.4. Animals
- 4.6. North America Functional Protein Market Analysis, Opportunity and Forecast, By By Form, 2016-2032
- 4.6.1. North America Functional Protein Market Analysis by By Form: Introduction
- 4.6.2. Market Size Absolute $ Opportunity Analysis and Forecast, By By Form, 2016-2032
- 4.6.3. Liquid
- 4.6.4. Dry
- 4.7. North America Functional Protein Market Analysis, Opportunity and Forecast, By By Application, 2016-2032
- 4.7.1. North America Functional Protein Market Analysis by By Application: Introduction
- 4.7.2. Market Size Absolute $ Opportunity Analysis and Forecast, By By Application, 2016-2032
- 4.7.3. Functional Food & Beverages
- 4.7.4. Dietary Supplements
- 4.7.5. Animal Nutrition
- 4.8. North America Functional Protein Market Analysis, Opportunity and Forecast, By Country , 2016-2032
- 4.8.1. North America Functional Protein Market Analysis by Country : Introduction
- 4.8.2. Market Size Absolute $ Opportunity Analysis and Forecast, Country , 2016-2032
- 4.8.2.1. The US
- 4.8.2.2. Canada
- 4.8.2.3. Mexico
- 5. Western Europe Functional Protein Market Analysis, Opportunity and Forecast, 2016-2032
- 5.1. Western Europe Functional Protein Market Analysis, 2016-2021
- 5.2. Western Europe Functional Protein Market Opportunity and Forecast, 2023-2032
- 5.3. Western Europe Functional Protein Market Analysis, Opportunity and Forecast, By By Type, 2016-2032
- 5.3.1. Western Europe Functional Protein Market Analysis by By Type: Introduction
- 5.3.2. Market Size Absolute $ Opportunity Analysis and Forecast, By By Type, 2016-2032
- 5.3.3. Hydrolysates
- 5.3.4. Whey Protein
- 5.3.5. Casein and Caseinates
- 5.3.6. Soy Protein
- 5.3.7. Others
- 5.4. Western Europe Functional Protein Market Analysis, Opportunity and Forecast, By By Soy-based, 2016-2032
- 5.4.1. Western Europe Functional Protein Market Analysis by By Soy-based: Introduction
- 5.4.2. Market Size Absolute $ Opportunity Analysis and Forecast, By By Soy-based, 2016-2032
- 5.4.3. Isolate
- 5.4.4. Concentrate
- 5.5. Western Europe Functional Protein Market Analysis, Opportunity and Forecast, By By Source, 2016-2032
- 5.5.1. Western Europe Functional Protein Market Analysis by By Source: Introduction
- 5.5.2. Market Size Absolute $ Opportunity Analysis and Forecast, By By Source, 2016-2032
- 5.5.3. Plants
- 5.5.4. Animals
- 5.6. Western Europe Functional Protein Market Analysis, Opportunity and Forecast, By By Form, 2016-2032
- 5.6.1. Western Europe Functional Protein Market Analysis by By Form: Introduction
- 5.6.2. Market Size Absolute $ Opportunity Analysis and Forecast, By By Form, 2016-2032
- 5.6.3. Liquid
- 5.6.4. Dry
- 5.7. Western Europe Functional Protein Market Analysis, Opportunity and Forecast, By By Application, 2016-2032
- 5.7.1. Western Europe Functional Protein Market Analysis by By Application: Introduction
- 5.7.2. Market Size Absolute $ Opportunity Analysis and Forecast, By By Application, 2016-2032
- 5.7.3. Functional Food & Beverages
- 5.7.4. Dietary Supplements
- 5.7.5. Animal Nutrition
- 5.8. Western Europe Functional Protein Market Analysis, Opportunity and Forecast, By Country , 2016-2032
- 5.8.1. Western Europe Functional Protein Market Analysis by Country : Introduction
- 5.8.2. Market Size Absolute $ Opportunity Analysis and Forecast, Country , 2016-2032
- 5.8.2.1. Germany
- 5.8.2.2. France
- 5.8.2.3. The UK
- 5.8.2.4. Spain
- 5.8.2.5. Italy
- 5.8.2.6. Portugal
- 5.8.2.7. Ireland
- 5.8.2.8. Austria
- 5.8.2.9. Switzerland
- 5.8.2.10. Benelux
- 5.8.2.11. Nordic
- 5.8.2.12. Rest of Western Europe
- 6. Eastern Europe Functional Protein Market Analysis, Opportunity and Forecast, 2016-2032
- 6.1. Eastern Europe Functional Protein Market Analysis, 2016-2021
- 6.2. Eastern Europe Functional Protein Market Opportunity and Forecast, 2023-2032
- 6.3. Eastern Europe Functional Protein Market Analysis, Opportunity and Forecast, By By Type, 2016-2032
- 6.3.1. Eastern Europe Functional Protein Market Analysis by By Type: Introduction
- 6.3.2. Market Size Absolute $ Opportunity Analysis and Forecast, By By Type, 2016-2032
- 6.3.3. Hydrolysates
- 6.3.4. Whey Protein
- 6.3.5. Casein and Caseinates
- 6.3.6. Soy Protein
- 6.3.7. Others
- 6.4. Eastern Europe Functional Protein Market Analysis, Opportunity and Forecast, By By Soy-based, 2016-2032
- 6.4.1. Eastern Europe Functional Protein Market Analysis by By Soy-based: Introduction
- 6.4.2. Market Size Absolute $ Opportunity Analysis and Forecast, By By Soy-based, 2016-2032
- 6.4.3. Isolate
- 6.4.4. Concentrate
- 6.5. Eastern Europe Functional Protein Market Analysis, Opportunity and Forecast, By By Source, 2016-2032
- 6.5.1. Eastern Europe Functional Protein Market Analysis by By Source: Introduction
- 6.5.2. Market Size Absolute $ Opportunity Analysis and Forecast, By By Source, 2016-2032
- 6.5.3. Plants
- 6.5.4. Animals
- 6.6. Eastern Europe Functional Protein Market Analysis, Opportunity and Forecast, By By Form, 2016-2032
- 6.6.1. Eastern Europe Functional Protein Market Analysis by By Form: Introduction
- 6.6.2. Market Size Absolute $ Opportunity Analysis and Forecast, By By Form, 2016-2032
- 6.6.3. Liquid
- 6.6.4. Dry
- 6.7. Eastern Europe Functional Protein Market Analysis, Opportunity and Forecast, By By Application, 2016-2032
- 6.7.1. Eastern Europe Functional Protein Market Analysis by By Application: Introduction
- 6.7.2. Market Size Absolute $ Opportunity Analysis and Forecast, By By Application, 2016-2032
- 6.7.3. Functional Food & Beverages
- 6.7.4. Dietary Supplements
- 6.7.5. Animal Nutrition
- 6.8. Eastern Europe Functional Protein Market Analysis, Opportunity and Forecast, By Country , 2016-2032
- 6.8.1. Eastern Europe Functional Protein Market Analysis by Country : Introduction
- 6.8.2. Market Size Absolute $ Opportunity Analysis and Forecast, Country , 2016-2032
- 6.8.2.1. Russia
- 6.8.2.2. Poland
- 6.8.2.3. The Czech Republic
- 6.8.2.4. Greece
- 6.8.2.5. Rest of Eastern Europe
- 7. APAC Functional Protein Market Analysis, Opportunity and Forecast, 2016-2032
- 7.1. APAC Functional Protein Market Analysis, 2016-2021
- 7.2. APAC Functional Protein Market Opportunity and Forecast, 2023-2032
- 7.3. APAC Functional Protein Market Analysis, Opportunity and Forecast, By By Type, 2016-2032
- 7.3.1. APAC Functional Protein Market Analysis by By Type: Introduction
- 7.3.2. Market Size Absolute $ Opportunity Analysis and Forecast, By By Type, 2016-2032
- 7.3.3. Hydrolysates
- 7.3.4. Whey Protein
- 7.3.5. Casein and Caseinates
- 7.3.6. Soy Protein
- 7.3.7. Others
- 7.4. APAC Functional Protein Market Analysis, Opportunity and Forecast, By By Soy-based, 2016-2032
- 7.4.1. APAC Functional Protein Market Analysis by By Soy-based: Introduction
- 7.4.2. Market Size Absolute $ Opportunity Analysis and Forecast, By By Soy-based, 2016-2032
- 7.4.3. Isolate
- 7.4.4. Concentrate
- 7.5. APAC Functional Protein Market Analysis, Opportunity and Forecast, By By Source, 2016-2032
- 7.5.1. APAC Functional Protein Market Analysis by By Source: Introduction
- 7.5.2. Market Size Absolute $ Opportunity Analysis and Forecast, By By Source, 2016-2032
- 7.5.3. Plants
- 7.5.4. Animals
- 7.6. APAC Functional Protein Market Analysis, Opportunity and Forecast, By By Form, 2016-2032
- 7.6.1. APAC Functional Protein Market Analysis by By Form: Introduction
- 7.6.2. Market Size Absolute $ Opportunity Analysis and Forecast, By By Form, 2016-2032
- 7.6.3. Liquid
- 7.6.4. Dry
- 7.7. APAC Functional Protein Market Analysis, Opportunity and Forecast, By By Application, 2016-2032
- 7.7.1. APAC Functional Protein Market Analysis by By Application: Introduction
- 7.7.2. Market Size Absolute $ Opportunity Analysis and Forecast, By By Application, 2016-2032
- 7.7.3. Functional Food & Beverages
- 7.7.4. Dietary Supplements
- 7.7.5. Animal Nutrition
- 7.8. APAC Functional Protein Market Analysis, Opportunity and Forecast, By Country , 2016-2032
- 7.8.1. APAC Functional Protein Market Analysis by Country : Introduction
- 7.8.2. Market Size Absolute $ Opportunity Analysis and Forecast, Country , 2016-2032
- 7.8.2.1. China
- 7.8.2.2. Japan
- 7.8.2.3. South Korea
- 7.8.2.4. India
- 7.8.2.5. Australia & New Zeland
- 7.8.2.6. Indonesia
- 7.8.2.7. Malaysia
- 7.8.2.8. Philippines
- 7.8.2.9. Singapore
- 7.8.2.10. Thailand
- 7.8.2.11. Vietnam
- 7.8.2.12. Rest of APAC
- 8. Latin America Functional Protein Market Analysis, Opportunity and Forecast, 2016-2032
- 8.1. Latin America Functional Protein Market Analysis, 2016-2021
- 8.2. Latin America Functional Protein Market Opportunity and Forecast, 2023-2032
- 8.3. Latin America Functional Protein Market Analysis, Opportunity and Forecast, By By Type, 2016-2032
- 8.3.1. Latin America Functional Protein Market Analysis by By Type: Introduction
- 8.3.2. Market Size Absolute $ Opportunity Analysis and Forecast, By By Type, 2016-2032
- 8.3.3. Hydrolysates
- 8.3.4. Whey Protein
- 8.3.5. Casein and Caseinates
- 8.3.6. Soy Protein
- 8.3.7. Others
- 8.4. Latin America Functional Protein Market Analysis, Opportunity and Forecast, By By Soy-based, 2016-2032
- 8.4.1. Latin America Functional Protein Market Analysis by By Soy-based: Introduction
- 8.4.2. Market Size Absolute $ Opportunity Analysis and Forecast, By By Soy-based, 2016-2032
- 8.4.3. Isolate
- 8.4.4. Concentrate
- 8.5. Latin America Functional Protein Market Analysis, Opportunity and Forecast, By By Source, 2016-2032
- 8.5.1. Latin America Functional Protein Market Analysis by By Source: Introduction
- 8.5.2. Market Size Absolute $ Opportunity Analysis and Forecast, By By Source, 2016-2032
- 8.5.3. Plants
- 8.5.4. Animals
- 8.6. Latin America Functional Protein Market Analysis, Opportunity and Forecast, By By Form, 2016-2032
- 8.6.1. Latin America Functional Protein Market Analysis by By Form: Introduction
- 8.6.2. Market Size Absolute $ Opportunity Analysis and Forecast, By By Form, 2016-2032
- 8.6.3. Liquid
- 8.6.4. Dry
- 8.7. Latin America Functional Protein Market Analysis, Opportunity and Forecast, By By Application, 2016-2032
- 8.7.1. Latin America Functional Protein Market Analysis by By Application: Introduction
- 8.7.2. Market Size Absolute $ Opportunity Analysis and Forecast, By By Application, 2016-2032
- 8.7.3. Functional Food & Beverages
- 8.7.4. Dietary Supplements
- 8.7.5. Animal Nutrition
- 8.8. Latin America Functional Protein Market Analysis, Opportunity and Forecast, By Country , 2016-2032
- 8.8.1. Latin America Functional Protein Market Analysis by Country : Introduction
- 8.8.2. Market Size Absolute $ Opportunity Analysis and Forecast, Country , 2016-2032
- 8.8.2.1. Brazil
- 8.8.2.2. Colombia
- 8.8.2.3. Chile
- 8.8.2.4. Argentina
- 8.8.2.5. Costa Rica
- 8.8.2.6. Rest of Latin America
- 9. Middle East & Africa Functional Protein Market Analysis, Opportunity and Forecast, 2016-2032
- 9.1. Middle East & Africa Functional Protein Market Analysis, 2016-2021
- 9.2. Middle East & Africa Functional Protein Market Opportunity and Forecast, 2023-2032
- 9.3. Middle East & Africa Functional Protein Market Analysis, Opportunity and Forecast, By By Type, 2016-2032
- 9.3.1. Middle East & Africa Functional Protein Market Analysis by By Type: Introduction
- 9.3.2. Market Size Absolute $ Opportunity Analysis and Forecast, By By Type, 2016-2032
- 9.3.3. Hydrolysates
- 9.3.4. Whey Protein
- 9.3.5. Casein and Caseinates
- 9.3.6. Soy Protein
- 9.3.7. Others
- 9.4. Middle East & Africa Functional Protein Market Analysis, Opportunity and Forecast, By By Soy-based, 2016-2032
- 9.4.1. Middle East & Africa Functional Protein Market Analysis by By Soy-based: Introduction
- 9.4.2. Market Size Absolute $ Opportunity Analysis and Forecast, By By Soy-based, 2016-2032
- 9.4.3. Isolate
- 9.4.4. Concentrate
- 9.5. Middle East & Africa Functional Protein Market Analysis, Opportunity and Forecast, By By Source, 2016-2032
- 9.5.1. Middle East & Africa Functional Protein Market Analysis by By Source: Introduction
- 9.5.2. Market Size Absolute $ Opportunity Analysis and Forecast, By By Source, 2016-2032
- 9.5.3. Plants
- 9.5.4. Animals
- 9.6. Middle East & Africa Functional Protein Market Analysis, Opportunity and Forecast, By By Form, 2016-2032
- 9.6.1. Middle East & Africa Functional Protein Market Analysis by By Form: Introduction
- 9.6.2. Market Size Absolute $ Opportunity Analysis and Forecast, By By Form, 2016-2032
- 9.6.3. Liquid
- 9.6.4. Dry
- 9.7. Middle East & Africa Functional Protein Market Analysis, Opportunity and Forecast, By By Application, 2016-2032
- 9.7.1. Middle East & Africa Functional Protein Market Analysis by By Application: Introduction
- 9.7.2. Market Size Absolute $ Opportunity Analysis and Forecast, By By Application, 2016-2032
- 9.7.3. Functional Food & Beverages
- 9.7.4. Dietary Supplements
- 9.7.5. Animal Nutrition
- 9.8. Middle East & Africa Functional Protein Market Analysis, Opportunity and Forecast, By Country , 2016-2032
- 9.8.1. Middle East & Africa Functional Protein Market Analysis by Country : Introduction
- 9.8.2. Market Size Absolute $ Opportunity Analysis and Forecast, Country , 2016-2032
- 9.8.2.1. Algeria
- 9.8.2.2. Egypt
- 9.8.2.3. Israel
- 9.8.2.4. Kuwait
- 9.8.2.5. Nigeria
- 9.8.2.6. Saudi Arabia
- 9.8.2.7. South Africa
- 9.8.2.8. Turkey
- 9.8.2.9. The UAE
- 9.8.2.10. Rest of MEA
- 10. Global Functional Protein Market Analysis, Opportunity and Forecast, By Region , 2016-2032
- 10.1. Global Functional Protein Market Analysis by Region : Introduction
- 10.2. Market Size Absolute $ Opportunity Analysis and Forecast, By Region , 2016-2032
- 10.2.1. North America
- 10.2.2. Western Europe
- 10.2.3. Eastern Europe
- 10.2.4. APAC
- 10.2.5. Latin America
- 10.2.6. Middle East & Africa
- 11. Global Functional Protein Market Competitive Landscape, Market Share Analysis, and Company Profiles
- 11.1. Market Share Analysis
- 11.2. Company Profiles
- 11.3. Fonterra Co-Operative Group
- 11.3.1. Company Overview
- 11.3.2. Financial Highlights
- 11.3.3. Product Portfolio
- 11.3.4. SWOT Analysis
- 11.3.5. Key Strategies and Developments
- 11.4. Arla Foods AMBA
- 11.4.1. Company Overview
- 11.4.2. Financial Highlights
- 11.4.3. Product Portfolio
- 11.4.4. SWOT Analysis
- 11.4.5. Key Strategies and Developments
- 11.5. Kerry Group
- 11.5.1. Company Overview
- 11.5.2. Financial Highlights
- 11.5.3. Product Portfolio
- 11.5.4. SWOT Analysis
- 11.5.5. Key Strategies and Developments
- 11.6. Glanbia PLC
- 11.6.1. Company Overview
- 11.6.2. Financial Highlights
- 11.6.3. Product Portfolio
- 11.6.4. SWOT Analysis
- 11.6.5. Key Strategies and Developments
- 11.7. APC Inc.
- 11.7.1. Company Overview
- 11.7.2. Financial Highlights
- 11.7.3. Product Portfolio
- 11.7.4. SWOT Analysis
- 11.7.5. Key Strategies and Developments
- 11.8. Saputo Ingredients
- 11.8.1. Company Overview
- 11.8.2. Financial Highlights
- 11.8.3. Product Portfolio
- 11.8.4. SWOT Analysis
- 11.8.5. Key Strategies and Developments
- 11.9. Friesland Campina
- 11.9.1. Company Overview
- 11.9.2. Financial Highlights
- 11.9.3. Product Portfolio
- 11.9.4. SWOT Analysis
- 11.9.5. Key Strategies and Developments
- 11.10. Glanbia Plc
- 11.10.1. Company Overview
- 11.10.2. Financial Highlights
- 11.10.3. Product Portfolio
- 11.10.4. SWOT Analysis
- 11.10.5. Key Strategies and Developments
- 11.11. Herbalife International, Inc.
- 11.11.1. Company Overview
- 11.11.2. Financial Highlights
- 11.11.3. Product Portfolio
- 11.11.4. SWOT Analysis
- 11.11.5. Key Strategies and Developments
- 12. Assumptions and Acronyms
- 13. Research Methodology
- 14. Contact
- List of Figures
- Figure 1: Global Functional Protein Market Revenue (US$ Mn) Market Share by Type in 2022
- Figure 2: Global Functional Protein Market Attractiveness Analysis by Type, 2016-2032
- Figure 3: Global Functional Protein Market Revenue (US$ Mn) Market Share by Soy-basedin 2022
- Figure 4: Global Functional Protein Market Attractiveness Analysis by Soy-based, 2016-2032
- Figure 5: Global Functional Protein Market Revenue (US$ Mn) Market Share by Sourcein 2022
- Figure 6: Global Functional Protein Market Attractiveness Analysis by Source, 2016-2032
- Figure 7: Global Functional Protein Market Revenue (US$ Mn) Market Share by Formin 2022
- Figure 8: Global Functional Protein Market Attractiveness Analysis by Form, 2016-2032
- Figure 9: Global Functional Protein Market Revenue (US$ Mn) Market Share by Applicationin 2022
- Figure 10: Global Functional Protein Market Attractiveness Analysis by Application, 2016-2032
- Figure 11: Global Functional Protein Market Revenue (US$ Mn) Market Share by Region in 2022
- Figure 12: Global Functional Protein Market Attractiveness Analysis by Region, 2016-2032
- Figure 13: Global Functional Protein Market Revenue (US$ Mn) (2016-2032)
- Figure 14: Global Functional Protein Market Revenue (US$ Mn) Comparison by Region (2016-2032)
- Figure 15: Global Functional Protein Market Revenue (US$ Mn) Comparison by Type (2016-2032)
- Figure 16: Global Functional Protein Market Revenue (US$ Mn) Comparison by Soy-based (2016-2032)
- Figure 17: Global Functional Protein Market Revenue (US$ Mn) Comparison by Source (2016-2032)
- Figure 18: Global Functional Protein Market Revenue (US$ Mn) Comparison by Form (2016-2032)
- Figure 19: Global Functional Protein Market Revenue (US$ Mn) Comparison by Application (2016-2032)
- Figure 20: Global Functional Protein Market Y-o-Y Growth Rate Comparison by Region (2016-2032)
- Figure 21: Global Functional Protein Market Y-o-Y Growth Rate Comparison by Type (2016-2032)
- Figure 22: Global Functional Protein Market Y-o-Y Growth Rate Comparison by Soy-based (2016-2032)
- Figure 23: Global Functional Protein Market Y-o-Y Growth Rate Comparison by Source (2016-2032)
- Figure 24: Global Functional Protein Market Y-o-Y Growth Rate Comparison by Form (2016-2032)
- Figure 25: Global Functional Protein Market Y-o-Y Growth Rate Comparison by Application (2016-2032)
- Figure 26: Global Functional Protein Market Share Comparison by Region (2016-2032)
- Figure 27: Global Functional Protein Market Share Comparison by Type (2016-2032)
- Figure 28: Global Functional Protein Market Share Comparison by Soy-based (2016-2032)
- Figure 29: Global Functional Protein Market Share Comparison by Source (2016-2032)
- Figure 30: Global Functional Protein Market Share Comparison by Form (2016-2032)
- Figure 31: Global Functional Protein Market Share Comparison by Application (2016-2032)
- Figure 32: North America Functional Protein Market Revenue (US$ Mn) Market Share by Typein 2022
- Figure 33: North America Functional Protein Market Attractiveness Analysis by Type, 2016-2032
- Figure 34: North America Functional Protein Market Revenue (US$ Mn) Market Share by Soy-basedin 2022
- Figure 35: North America Functional Protein Market Attractiveness Analysis by Soy-based, 2016-2032
- Figure 36: North America Functional Protein Market Revenue (US$ Mn) Market Share by Sourcein 2022
- Figure 37: North America Functional Protein Market Attractiveness Analysis by Source, 2016-2032
- Figure 38: North America Functional Protein Market Revenue (US$ Mn) Market Share by Formin 2022
- Figure 39: North America Functional Protein Market Attractiveness Analysis by Form, 2016-2032
- Figure 40: North America Functional Protein Market Revenue (US$ Mn) Market Share by Applicationin 2022
- Figure 41: North America Functional Protein Market Attractiveness Analysis by Application, 2016-2032
- Figure 42: North America Functional Protein Market Revenue (US$ Mn) Market Share by Country in 2022
- Figure 43: North America Functional Protein Market Attractiveness Analysis by Country, 2016-2032
- Figure 44: North America Functional Protein Market Revenue (US$ Mn) (2016-2032)
- Figure 45: North America Functional Protein Market Revenue (US$ Mn) Comparison by Country (2016-2032)
- Figure 46: North America Functional Protein Market Revenue (US$ Mn) Comparison by Type (2016-2032)
- Figure 47: North America Functional Protein Market Revenue (US$ Mn) Comparison by Soy-based (2016-2032)
- Figure 48: North America Functional Protein Market Revenue (US$ Mn) Comparison by Source (2016-2032)
- Figure 49: North America Functional Protein Market Revenue (US$ Mn) Comparison by Form (2016-2032)
- Figure 50: North America Functional Protein Market Revenue (US$ Mn) Comparison by Application (2016-2032)
- Figure 51: North America Functional Protein Market Y-o-Y Growth Rate Comparison by Country (2016-2032)
- Figure 52: North America Functional Protein Market Y-o-Y Growth Rate Comparison by Type (2016-2032)
- Figure 53: North America Functional Protein Market Y-o-Y Growth Rate Comparison by Soy-based (2016-2032)
- Figure 54: North America Functional Protein Market Y-o-Y Growth Rate Comparison by Source (2016-2032)
- Figure 55: North America Functional Protein Market Y-o-Y Growth Rate Comparison by Form (2016-2032)
- Figure 56: North America Functional Protein Market Y-o-Y Growth Rate Comparison by Application (2016-2032)
- Figure 57: North America Functional Protein Market Share Comparison by Country (2016-2032)
- Figure 58: North America Functional Protein Market Share Comparison by Type (2016-2032)
- Figure 59: North America Functional Protein Market Share Comparison by Soy-based (2016-2032)
- Figure 60: North America Functional Protein Market Share Comparison by Source (2016-2032)
- Figure 61: North America Functional Protein Market Share Comparison by Form (2016-2032)
- Figure 62: North America Functional Protein Market Share Comparison by Application (2016-2032)
- Figure 63: Western Europe Functional Protein Market Revenue (US$ Mn) Market Share by Typein 2022
- Figure 64: Western Europe Functional Protein Market Attractiveness Analysis by Type, 2016-2032
- Figure 65: Western Europe Functional Protein Market Revenue (US$ Mn) Market Share by Soy-basedin 2022
- Figure 66: Western Europe Functional Protein Market Attractiveness Analysis by Soy-based, 2016-2032
- Figure 67: Western Europe Functional Protein Market Revenue (US$ Mn) Market Share by Sourcein 2022
- Figure 68: Western Europe Functional Protein Market Attractiveness Analysis by Source, 2016-2032
- Figure 69: Western Europe Functional Protein Market Revenue (US$ Mn) Market Share by Formin 2022
- Figure 70: Western Europe Functional Protein Market Attractiveness Analysis by Form, 2016-2032
- Figure 71: Western Europe Functional Protein Market Revenue (US$ Mn) Market Share by Applicationin 2022
- Figure 72: Western Europe Functional Protein Market Attractiveness Analysis by Application, 2016-2032
- Figure 73: Western Europe Functional Protein Market Revenue (US$ Mn) Market Share by Country in 2022
- Figure 74: Western Europe Functional Protein Market Attractiveness Analysis by Country, 2016-2032
- Figure 75: Western Europe Functional Protein Market Revenue (US$ Mn) (2016-2032)
- Figure 76: Western Europe Functional Protein Market Revenue (US$ Mn) Comparison by Country (2016-2032)
- Figure 77: Western Europe Functional Protein Market Revenue (US$ Mn) Comparison by Type (2016-2032)
- Figure 78: Western Europe Functional Protein Market Revenue (US$ Mn) Comparison by Soy-based (2016-2032)
- Figure 79: Western Europe Functional Protein Market Revenue (US$ Mn) Comparison by Source (2016-2032)
- Figure 80: Western Europe Functional Protein Market Revenue (US$ Mn) Comparison by Form (2016-2032)
- Figure 81: Western Europe Functional Protein Market Revenue (US$ Mn) Comparison by Application (2016-2032)
- Figure 82: Western Europe Functional Protein Market Y-o-Y Growth Rate Comparison by Country (2016-2032)
- Figure 83: Western Europe Functional Protein Market Y-o-Y Growth Rate Comparison by Type (2016-2032)
- Figure 84: Western Europe Functional Protein Market Y-o-Y Growth Rate Comparison by Soy-based (2016-2032)
- Figure 85: Western Europe Functional Protein Market Y-o-Y Growth Rate Comparison by Source (2016-2032)
- Figure 86: Western Europe Functional Protein Market Y-o-Y Growth Rate Comparison by Form (2016-2032)
- Figure 87: Western Europe Functional Protein Market Y-o-Y Growth Rate Comparison by Application (2016-2032)
- Figure 88: Western Europe Functional Protein Market Share Comparison by Country (2016-2032)
- Figure 89: Western Europe Functional Protein Market Share Comparison by Type (2016-2032)
- Figure 90: Western Europe Functional Protein Market Share Comparison by Soy-based (2016-2032)
- Figure 91: Western Europe Functional Protein Market Share Comparison by Source (2016-2032)
- Figure 92: Western Europe Functional Protein Market Share Comparison by Form (2016-2032)
- Figure 93: Western Europe Functional Protein Market Share Comparison by Application (2016-2032)
- Figure 94: Eastern Europe Functional Protein Market Revenue (US$ Mn) Market Share by Typein 2022
- Figure 95: Eastern Europe Functional Protein Market Attractiveness Analysis by Type, 2016-2032
- Figure 96: Eastern Europe Functional Protein Market Revenue (US$ Mn) Market Share by Soy-basedin 2022
- Figure 97: Eastern Europe Functional Protein Market Attractiveness Analysis by Soy-based, 2016-2032
- Figure 98: Eastern Europe Functional Protein Market Revenue (US$ Mn) Market Share by Sourcein 2022
- Figure 99: Eastern Europe Functional Protein Market Attractiveness Analysis by Source, 2016-2032
- Figure 100: Eastern Europe Functional Protein Market Revenue (US$ Mn) Market Share by Formin 2022
- Figure 101: Eastern Europe Functional Protein Market Attractiveness Analysis by Form, 2016-2032
- Figure 102: Eastern Europe Functional Protein Market Revenue (US$ Mn) Market Share by Applicationin 2022
- Figure 103: Eastern Europe Functional Protein Market Attractiveness Analysis by Application, 2016-2032
- Figure 104: Eastern Europe Functional Protein Market Revenue (US$ Mn) Market Share by Country in 2022
- Figure 105: Eastern Europe Functional Protein Market Attractiveness Analysis by Country, 2016-2032
- Figure 106: Eastern Europe Functional Protein Market Revenue (US$ Mn) (2016-2032)
- Figure 107: Eastern Europe Functional Protein Market Revenue (US$ Mn) Comparison by Country (2016-2032)
- Figure 108: Eastern Europe Functional Protein Market Revenue (US$ Mn) Comparison by Type (2016-2032)
- Figure 109: Eastern Europe Functional Protein Market Revenue (US$ Mn) Comparison by Soy-based (2016-2032)
- Figure 110: Eastern Europe Functional Protein Market Revenue (US$ Mn) Comparison by Source (2016-2032)
- Figure 111: Eastern Europe Functional Protein Market Revenue (US$ Mn) Comparison by Form (2016-2032)
- Figure 112: Eastern Europe Functional Protein Market Revenue (US$ Mn) Comparison by Application (2016-2032)
- Figure 113: Eastern Europe Functional Protein Market Y-o-Y Growth Rate Comparison by Country (2016-2032)
- Figure 114: Eastern Europe Functional Protein Market Y-o-Y Growth Rate Comparison by Type (2016-2032)
- Figure 115: Eastern Europe Functional Protein Market Y-o-Y Growth Rate Comparison by Soy-based (2016-2032)
- Figure 116: Eastern Europe Functional Protein Market Y-o-Y Growth Rate Comparison by Source (2016-2032)
- Figure 117: Eastern Europe Functional Protein Market Y-o-Y Growth Rate Comparison by Form (2016-2032)
- Figure 118: Eastern Europe Functional Protein Market Y-o-Y Growth Rate Comparison by Application (2016-2032)
- Figure 119: Eastern Europe Functional Protein Market Share Comparison by Country (2016-2032)
- Figure 120: Eastern Europe Functional Protein Market Share Comparison by Type (2016-2032)
- Figure 121: Eastern Europe Functional Protein Market Share Comparison by Soy-based (2016-2032)
- Figure 122: Eastern Europe Functional Protein Market Share Comparison by Source (2016-2032)
- Figure 123: Eastern Europe Functional Protein Market Share Comparison by Form (2016-2032)
- Figure 124: Eastern Europe Functional Protein Market Share Comparison by Application (2016-2032)
- Figure 125: APAC Functional Protein Market Revenue (US$ Mn) Market Share by Typein 2022
- Figure 126: APAC Functional Protein Market Attractiveness Analysis by Type, 2016-2032
- Figure 127: APAC Functional Protein Market Revenue (US$ Mn) Market Share by Soy-basedin 2022
- Figure 128: APAC Functional Protein Market Attractiveness Analysis by Soy-based, 2016-2032
- Figure 129: APAC Functional Protein Market Revenue (US$ Mn) Market Share by Sourcein 2022
- Figure 130: APAC Functional Protein Market Attractiveness Analysis by Source, 2016-2032
- Figure 131: APAC Functional Protein Market Revenue (US$ Mn) Market Share by Formin 2022
- Figure 132: APAC Functional Protein Market Attractiveness Analysis by Form, 2016-2032
- Figure 133: APAC Functional Protein Market Revenue (US$ Mn) Market Share by Applicationin 2022
- Figure 134: APAC Functional Protein Market Attractiveness Analysis by Application, 2016-2032
- Figure 135: APAC Functional Protein Market Revenue (US$ Mn) Market Share by Country in 2022
- Figure 136: APAC Functional Protein Market Attractiveness Analysis by Country, 2016-2032
- Figure 137: APAC Functional Protein Market Revenue (US$ Mn) (2016-2032)
- Figure 138: APAC Functional Protein Market Revenue (US$ Mn) Comparison by Country (2016-2032)
- Figure 139: APAC Functional Protein Market Revenue (US$ Mn) Comparison by Type (2016-2032)
- Figure 140: APAC Functional Protein Market Revenue (US$ Mn) Comparison by Soy-based (2016-2032)
- Figure 141: APAC Functional Protein Market Revenue (US$ Mn) Comparison by Source (2016-2032)
- Figure 142: APAC Functional Protein Market Revenue (US$ Mn) Comparison by Form (2016-2032)
- Figure 143: APAC Functional Protein Market Revenue (US$ Mn) Comparison by Application (2016-2032)
- Figure 144: APAC Functional Protein Market Y-o-Y Growth Rate Comparison by Country (2016-2032)
- Figure 145: APAC Functional Protein Market Y-o-Y Growth Rate Comparison by Type (2016-2032)
- Figure 146: APAC Functional Protein Market Y-o-Y Growth Rate Comparison by Soy-based (2016-2032)
- Figure 147: APAC Functional Protein Market Y-o-Y Growth Rate Comparison by Source (2016-2032)
- Figure 148: APAC Functional Protein Market Y-o-Y Growth Rate Comparison by Form (2016-2032)
- Figure 149: APAC Functional Protein Market Y-o-Y Growth Rate Comparison by Application (2016-2032)
- Figure 150: APAC Functional Protein Market Share Comparison by Country (2016-2032)
- Figure 151: APAC Functional Protein Market Share Comparison by Type (2016-2032)
- Figure 152: APAC Functional Protein Market Share Comparison by Soy-based (2016-2032)
- Figure 153: APAC Functional Protein Market Share Comparison by Source (2016-2032)
- Figure 154: APAC Functional Protein Market Share Comparison by Form (2016-2032)
- Figure 155: APAC Functional Protein Market Share Comparison by Application (2016-2032)
- Figure 156: Latin America Functional Protein Market Revenue (US$ Mn) Market Share by Typein 2022
- Figure 157: Latin America Functional Protein Market Attractiveness Analysis by Type, 2016-2032
- Figure 158: Latin America Functional Protein Market Revenue (US$ Mn) Market Share by Soy-basedin 2022
- Figure 159: Latin America Functional Protein Market Attractiveness Analysis by Soy-based, 2016-2032
- Figure 160: Latin America Functional Protein Market Revenue (US$ Mn) Market Share by Sourcein 2022
- Figure 161: Latin America Functional Protein Market Attractiveness Analysis by Source, 2016-2032
- Figure 162: Latin America Functional Protein Market Revenue (US$ Mn) Market Share by Formin 2022
- Figure 163: Latin America Functional Protein Market Attractiveness Analysis by Form, 2016-2032
- Figure 164: Latin America Functional Protein Market Revenue (US$ Mn) Market Share by Applicationin 2022
- Figure 165: Latin America Functional Protein Market Attractiveness Analysis by Application, 2016-2032
- Figure 166: Latin America Functional Protein Market Revenue (US$ Mn) Market Share by Country in 2022
- Figure 167: Latin America Functional Protein Market Attractiveness Analysis by Country, 2016-2032
- Figure 168: Latin America Functional Protein Market Revenue (US$ Mn) (2016-2032)
- Figure 169: Latin America Functional Protein Market Revenue (US$ Mn) Comparison by Country (2016-2032)
- Figure 170: Latin America Functional Protein Market Revenue (US$ Mn) Comparison by Type (2016-2032)
- Figure 171: Latin America Functional Protein Market Revenue (US$ Mn) Comparison by Soy-based (2016-2032)
- Figure 172: Latin America Functional Protein Market Revenue (US$ Mn) Comparison by Source (2016-2032)
- Figure 173: Latin America Functional Protein Market Revenue (US$ Mn) Comparison by Form (2016-2032)
- Figure 174: Latin America Functional Protein Market Revenue (US$ Mn) Comparison by Application (2016-2032)
- Figure 175: Latin America Functional Protein Market Y-o-Y Growth Rate Comparison by Country (2016-2032)
- Figure 176: Latin America Functional Protein Market Y-o-Y Growth Rate Comparison by Type (2016-2032)
- Figure 177: Latin America Functional Protein Market Y-o-Y Growth Rate Comparison by Soy-based (2016-2032)
- Figure 178: Latin America Functional Protein Market Y-o-Y Growth Rate Comparison by Source (2016-2032)
- Figure 179: Latin America Functional Protein Market Y-o-Y Growth Rate Comparison by Form (2016-2032)
- Figure 180: Latin America Functional Protein Market Y-o-Y Growth Rate Comparison by Application (2016-2032)
- Figure 181: Latin America Functional Protein Market Share Comparison by Country (2016-2032)
- Figure 182: Latin America Functional Protein Market Share Comparison by Type (2016-2032)
- Figure 183: Latin America Functional Protein Market Share Comparison by Soy-based (2016-2032)
- Figure 184: Latin America Functional Protein Market Share Comparison by Source (2016-2032)
- Figure 185: Latin America Functional Protein Market Share Comparison by Form (2016-2032)
- Figure 186: Latin America Functional Protein Market Share Comparison by Application (2016-2032)
- Figure 187: Middle East & Africa Functional Protein Market Revenue (US$ Mn) Market Share by Typein 2022
- Figure 188: Middle East & Africa Functional Protein Market Attractiveness Analysis by Type, 2016-2032
- Figure 189: Middle East & Africa Functional Protein Market Revenue (US$ Mn) Market Share by Soy-basedin 2022
- Figure 190: Middle East & Africa Functional Protein Market Attractiveness Analysis by Soy-based, 2016-2032
- Figure 191: Middle East & Africa Functional Protein Market Revenue (US$ Mn) Market Share by Sourcein 2022
- Figure 192: Middle East & Africa Functional Protein Market Attractiveness Analysis by Source, 2016-2032
- Figure 193: Middle East & Africa Functional Protein Market Revenue (US$ Mn) Market Share by Formin 2022
- Figure 194: Middle East & Africa Functional Protein Market Attractiveness Analysis by Form, 2016-2032
- Figure 195: Middle East & Africa Functional Protein Market Revenue (US$ Mn) Market Share by Applicationin 2022
- Figure 196: Middle East & Africa Functional Protein Market Attractiveness Analysis by Application, 2016-2032
- Figure 197: Middle East & Africa Functional Protein Market Revenue (US$ Mn) Market Share by Country in 2022
- Figure 198: Middle East & Africa Functional Protein Market Attractiveness Analysis by Country, 2016-2032
- Figure 199: Middle East & Africa Functional Protein Market Revenue (US$ Mn) (2016-2032)
- Figure 200: Middle East & Africa Functional Protein Market Revenue (US$ Mn) Comparison by Country (2016-2032)
- Figure 201: Middle East & Africa Functional Protein Market Revenue (US$ Mn) Comparison by Type (2016-2032)
- Figure 202: Middle East & Africa Functional Protein Market Revenue (US$ Mn) Comparison by Soy-based (2016-2032)
- Figure 203: Middle East & Africa Functional Protein Market Revenue (US$ Mn) Comparison by Source (2016-2032)
- Figure 204: Middle East & Africa Functional Protein Market Revenue (US$ Mn) Comparison by Form (2016-2032)
- Figure 205: Middle East & Africa Functional Protein Market Revenue (US$ Mn) Comparison by Application (2016-2032)
- Figure 206: Middle East & Africa Functional Protein Market Y-o-Y Growth Rate Comparison by Country (2016-2032)
- Figure 207: Middle East & Africa Functional Protein Market Y-o-Y Growth Rate Comparison by Type (2016-2032)
- Figure 208: Middle East & Africa Functional Protein Market Y-o-Y Growth Rate Comparison by Soy-based (2016-2032)
- Figure 209: Middle East & Africa Functional Protein Market Y-o-Y Growth Rate Comparison by Source (2016-2032)
- Figure 210: Middle East & Africa Functional Protein Market Y-o-Y Growth Rate Comparison by Form (2016-2032)
- Figure 211: Middle East & Africa Functional Protein Market Y-o-Y Growth Rate Comparison by Application (2016-2032)
- Figure 212: Middle East & Africa Functional Protein Market Share Comparison by Country (2016-2032)
- Figure 213: Middle East & Africa Functional Protein Market Share Comparison by Type (2016-2032)
- Figure 214: Middle East & Africa Functional Protein Market Share Comparison by Soy-based (2016-2032)
- Figure 215: Middle East & Africa Functional Protein Market Share Comparison by Source (2016-2032)
- Figure 216: Middle East & Africa Functional Protein Market Share Comparison by Form (2016-2032)
- Figure 217: Middle East & Africa Functional Protein Market Share Comparison by Application (2016-2032)
List of Tables
- Table 1: Global Functional Protein Market Comparison by Type (2016-2032)
- Table 2: Global Functional Protein Market Comparison by Soy-based (2016-2032)
- Table 3: Global Functional Protein Market Comparison by Source (2016-2032)
- Table 4: Global Functional Protein Market Comparison by Form (2016-2032)
- Table 5: Global Functional Protein Market Comparison by Application (2016-2032)
- Table 6: Global Functional Protein Market Revenue (US$ Mn) Comparison by Region (2016-2032)
- Table 7: Global Functional Protein Market Revenue (US$ Mn) (2016-2032)
- Table 8: Global Functional Protein Market Revenue (US$ Mn) Comparison by Region (2016-2032)
- Table 9: Global Functional Protein Market Revenue (US$ Mn) Comparison by Type (2016-2032)
- Table 10: Global Functional Protein Market Revenue (US$ Mn) Comparison by Soy-based (2016-2032)
- Table 11: Global Functional Protein Market Revenue (US$ Mn) Comparison by Source (2016-2032)
- Table 12: Global Functional Protein Market Revenue (US$ Mn) Comparison by Form (2016-2032)
- Table 13: Global Functional Protein Market Revenue (US$ Mn) Comparison by Application (2016-2032)
- Table 14: Global Functional Protein Market Y-o-Y Growth Rate Comparison by Region (2016-2032)
- Table 15: Global Functional Protein Market Y-o-Y Growth Rate Comparison by Type (2016-2032)
- Table 16: Global Functional Protein Market Y-o-Y Growth Rate Comparison by Soy-based (2016-2032)
- Table 17: Global Functional Protein Market Y-o-Y Growth Rate Comparison by Source (2016-2032)
- Table 18: Global Functional Protein Market Y-o-Y Growth Rate Comparison by Form (2016-2032)
- Table 19: Global Functional Protein Market Y-o-Y Growth Rate Comparison by Application (2016-2032)
- Table 20: Global Functional Protein Market Share Comparison by Region (2016-2032)
- Table 21: Global Functional Protein Market Share Comparison by Type (2016-2032)
- Table 22: Global Functional Protein Market Share Comparison by Soy-based (2016-2032)
- Table 23: Global Functional Protein Market Share Comparison by Source (2016-2032)
- Table 24: Global Functional Protein Market Share Comparison by Form (2016-2032)
- Table 25: Global Functional Protein Market Share Comparison by Application (2016-2032)
- Table 26: North America Functional Protein Market Comparison by Soy-based (2016-2032)
- Table 27: North America Functional Protein Market Comparison by Source (2016-2032)
- Table 28: North America Functional Protein Market Comparison by Form (2016-2032)
- Table 29: North America Functional Protein Market Comparison by Application (2016-2032)
- Table 30: North America Functional Protein Market Revenue (US$ Mn) Comparison by Country (2016-2032)
- Table 31: North America Functional Protein Market Revenue (US$ Mn) (2016-2032)
- Table 32: North America Functional Protein Market Revenue (US$ Mn) Comparison by Country (2016-2032)
- Table 33: North America Functional Protein Market Revenue (US$ Mn) Comparison by Type (2016-2032)
- Table 34: North America Functional Protein Market Revenue (US$ Mn) Comparison by Soy-based (2016-2032)
- Table 35: North America Functional Protein Market Revenue (US$ Mn) Comparison by Source (2016-2032)
- Table 36: North America Functional Protein Market Revenue (US$ Mn) Comparison by Form (2016-2032)
- Table 37: North America Functional Protein Market Revenue (US$ Mn) Comparison by Application (2016-2032)
- Table 38: North America Functional Protein Market Y-o-Y Growth Rate Comparison by Country (2016-2032)
- Table 39: North America Functional Protein Market Y-o-Y Growth Rate Comparison by Type (2016-2032)
- Table 40: North America Functional Protein Market Y-o-Y Growth Rate Comparison by Soy-based (2016-2032)
- Table 41: North America Functional Protein Market Y-o-Y Growth Rate Comparison by Source (2016-2032)
- Table 42: North America Functional Protein Market Y-o-Y Growth Rate Comparison by Form (2016-2032)
- Table 43: North America Functional Protein Market Y-o-Y Growth Rate Comparison by Application (2016-2032)
- Table 44: North America Functional Protein Market Share Comparison by Country (2016-2032)
- Table 45: North America Functional Protein Market Share Comparison by Type (2016-2032)
- Table 46: North America Functional Protein Market Share Comparison by Soy-based (2016-2032)
- Table 47: North America Functional Protein Market Share Comparison by Source (2016-2032)
- Table 48: North America Functional Protein Market Share Comparison by Form (2016-2032)
- Table 49: North America Functional Protein Market Share Comparison by Application (2016-2032)
- Table 50: Western Europe Functional Protein Market Comparison by Type (2016-2032)
- Table 51: Western Europe Functional Protein Market Comparison by Soy-based (2016-2032)
- Table 52: Western Europe Functional Protein Market Comparison by Source (2016-2032)
- Table 53: Western Europe Functional Protein Market Comparison by Form (2016-2032)
- Table 54: Western Europe Functional Protein Market Comparison by Application (2016-2032)
- Table 55: Western Europe Functional Protein Market Revenue (US$ Mn) Comparison by Country (2016-2032)
- Table 56: Western Europe Functional Protein Market Revenue (US$ Mn) (2016-2032)
- Table 57: Western Europe Functional Protein Market Revenue (US$ Mn) Comparison by Country (2016-2032)
- Table 58: Western Europe Functional Protein Market Revenue (US$ Mn) Comparison by Type (2016-2032)
- Table 59: Western Europe Functional Protein Market Revenue (US$ Mn) Comparison by Soy-based (2016-2032)
- Table 60: Western Europe Functional Protein Market Revenue (US$ Mn) Comparison by Source (2016-2032)
- Table 61: Western Europe Functional Protein Market Revenue (US$ Mn) Comparison by Form (2016-2032)
- Table 62: Western Europe Functional Protein Market Revenue (US$ Mn) Comparison by Application (2016-2032)
- Table 63: Western Europe Functional Protein Market Y-o-Y Growth Rate Comparison by Country (2016-2032)
- Table 64: Western Europe Functional Protein Market Y-o-Y Growth Rate Comparison by Type (2016-2032)
- Table 65: Western Europe Functional Protein Market Y-o-Y Growth Rate Comparison by Soy-based (2016-2032)
- Table 66: Western Europe Functional Protein Market Y-o-Y Growth Rate Comparison by Source (2016-2032)
- Table 67: Western Europe Functional Protein Market Y-o-Y Growth Rate Comparison by Form (2016-2032)
- Table 68: Western Europe Functional Protein Market Y-o-Y Growth Rate Comparison by Application (2016-2032)
- Table 69: Western Europe Functional Protein Market Share Comparison by Country (2016-2032)
- Table 70: Western Europe Functional Protein Market Share Comparison by Type (2016-2032)
- Table 71: Western Europe Functional Protein Market Share Comparison by Soy-based (2016-2032)
- Table 72: Western Europe Functional Protein Market Share Comparison by Source (2016-2032)
- Table 73: Western Europe Functional Protein Market Share Comparison by Form (2016-2032)
- Table 74: Western Europe Functional Protein Market Share Comparison by Application (2016-2032)
- Table 75: Eastern Europe Functional Protein Market Comparison by Type (2016-2032)
- Table 76: Eastern Europe Functional Protein Market Comparison by Soy-based (2016-2032)
- Table 77: Eastern Europe Functional Protein Market Comparison by Source (2016-2032)
- Table 78: Eastern Europe Functional Protein Market Comparison by Form (2016-2032)
- Table 79: Eastern Europe Functional Protein Market Comparison by Application (2016-2032)
- Table 80: Eastern Europe Functional Protein Market Revenue (US$ Mn) Comparison by Country (2016-2032)
- Table 81: Eastern Europe Functional Protein Market Revenue (US$ Mn) (2016-2032)
- Table 82: Eastern Europe Functional Protein Market Revenue (US$ Mn) Comparison by Country (2016-2032)
- Table 83: Eastern Europe Functional Protein Market Revenue (US$ Mn) Comparison by Type (2016-2032)
- Table 84: Eastern Europe Functional Protein Market Revenue (US$ Mn) Comparison by Soy-based (2016-2032)
- Table 85: Eastern Europe Functional Protein Market Revenue (US$ Mn) Comparison by Source (2016-2032)
- Table 86: Eastern Europe Functional Protein Market Revenue (US$ Mn) Comparison by Form (2016-2032)
- Table 87: Eastern Europe Functional Protein Market Revenue (US$ Mn) Comparison by Application (2016-2032)
- Table 88: Eastern Europe Functional Protein Market Y-o-Y Growth Rate Comparison by Country (2016-2032)
- Table 89: Eastern Europe Functional Protein Market Y-o-Y Growth Rate Comparison by Type (2016-2032)
- Table 90: Eastern Europe Functional Protein Market Y-o-Y Growth Rate Comparison by Soy-based (2016-2032)
- Table 91: Eastern Europe Functional Protein Market Y-o-Y Growth Rate Comparison by Source (2016-2032)
- Table 92: Eastern Europe Functional Protein Market Y-o-Y Growth Rate Comparison by Form (2016-2032)
- Table 93: Eastern Europe Functional Protein Market Y-o-Y Growth Rate Comparison by Application (2016-2032)
- Table 94: Eastern Europe Functional Protein Market Share Comparison by Country (2016-2032)
- Table 95: Eastern Europe Functional Protein Market Share Comparison by Type (2016-2032)
- Table 96: Eastern Europe Functional Protein Market Share Comparison by Soy-based (2016-2032)
- Table 97: Eastern Europe Functional Protein Market Share Comparison by Source (2016-2032)
- Table 98: Eastern Europe Functional Protein Market Share Comparison by Form (2016-2032)
- Table 99: Eastern Europe Functional Protein Market Share Comparison by Application (2016-2032)
- Table 100: APAC Functional Protein Market Comparison by Type (2016-2032)
- Table 101: APAC Functional Protein Market Comparison by Soy-based (2016-2032)
- Table 102: APAC Functional Protein Market Comparison by Source (2016-2032)
- Table 103: APAC Functional Protein Market Comparison by Form (2016-2032)
- Table 104: APAC Functional Protein Market Comparison by Application (2016-2032)
- Table 105: APAC Functional Protein Market Revenue (US$ Mn) Comparison by Country (2016-2032)
- Table 106: APAC Functional Protein Market Revenue (US$ Mn) (2016-2032)
- Table 107: APAC Functional Protein Market Revenue (US$ Mn) Comparison by Country (2016-2032)
- Table 108: APAC Functional Protein Market Revenue (US$ Mn) Comparison by Type (2016-2032)
- Table 109: APAC Functional Protein Market Revenue (US$ Mn) Comparison by Soy-based (2016-2032)
- Table 110: APAC Functional Protein Market Revenue (US$ Mn) Comparison by Source (2016-2032)
- Table 111: APAC Functional Protein Market Revenue (US$ Mn) Comparison by Form (2016-2032)
- Table 112: APAC Functional Protein Market Revenue (US$ Mn) Comparison by Application (2016-2032)
- Table 113: APAC Functional Protein Market Y-o-Y Growth Rate Comparison by Country (2016-2032)
- Table 114: APAC Functional Protein Market Y-o-Y Growth Rate Comparison by Type (2016-2032)
- Table 115: APAC Functional Protein Market Y-o-Y Growth Rate Comparison by Soy-based (2016-2032)
- Table 116: APAC Functional Protein Market Y-o-Y Growth Rate Comparison by Source (2016-2032)
- Table 117: APAC Functional Protein Market Y-o-Y Growth Rate Comparison by Form (2016-2032)
- Table 118: APAC Functional Protein Market Y-o-Y Growth Rate Comparison by Application (2016-2032)
- Table 119: APAC Functional Protein Market Share Comparison by Country (2016-2032)
- Table 120: APAC Functional Protein Market Share Comparison by Type (2016-2032)
- Table 121: APAC Functional Protein Market Share Comparison by Soy-based (2016-2032)
- Table 122: APAC Functional Protein Market Share Comparison by Source (2016-2032)
- Table 123: APAC Functional Protein Market Share Comparison by Form (2016-2032)
- Table 124: APAC Functional Protein Market Share Comparison by Application (2016-2032)
- Table 125: Latin America Functional Protein Market Comparison by Type (2016-2032)
- Table 126: Latin America Functional Protein Market Comparison by Soy-based (2016-2032)
- Table 127: Latin America Functional Protein Market Comparison by Source (2016-2032)
- Table 128: Latin America Functional Protein Market Comparison by Form (2016-2032)
- Table 129: Latin America Functional Protein Market Comparison by Application (2016-2032)
- Table 130: Latin America Functional Protein Market Revenue (US$ Mn) Comparison by Country (2016-2032)
- Table 131: Latin America Functional Protein Market Revenue (US$ Mn) (2016-2032)
- Table 132: Latin America Functional Protein Market Revenue (US$ Mn) Comparison by Country (2016-2032)
- Table 133: Latin America Functional Protein Market Revenue (US$ Mn) Comparison by Type (2016-2032)
- Table 134: Latin America Functional Protein Market Revenue (US$ Mn) Comparison by Soy-based (2016-2032)
- Table 135: Latin America Functional Protein Market Revenue (US$ Mn) Comparison by Source (2016-2032)
- Table 136: Latin America Functional Protein Market Revenue (US$ Mn) Comparison by Form (2016-2032)
- Table 137: Latin America Functional Protein Market Revenue (US$ Mn) Comparison by Application (2016-2032)
- Table 138: Latin America Functional Protein Market Y-o-Y Growth Rate Comparison by Country (2016-2032)
- Table 139: Latin America Functional Protein Market Y-o-Y Growth Rate Comparison by Type (2016-2032)
- Table 140: Latin America Functional Protein Market Y-o-Y Growth Rate Comparison by Soy-based (2016-2032)
- Table 141: Latin America Functional Protein Market Y-o-Y Growth Rate Comparison by Source (2016-2032)
- Table 142: Latin America Functional Protein Market Y-o-Y Growth Rate Comparison by Form (2016-2032)
- Table 143: Latin America Functional Protein Market Y-o-Y Growth Rate Comparison by Application (2016-2032)
- Table 144: Latin America Functional Protein Market Share Comparison by Country (2016-2032)
- Table 145: Latin America Functional Protein Market Share Comparison by Type (2016-2032)
- Table 146: Latin America Functional Protein Market Share Comparison by Soy-based (2016-2032)
- Table 147: Latin America Functional Protein Market Share Comparison by Source (2016-2032)
- Table 148: Latin America Functional Protein Market Share Comparison by Form (2016-2032)
- Table 149: Latin America Functional Protein Market Share Comparison by Application (2016-2032)
- Table 150: Middle East & Africa Functional Protein Market Comparison by Type (2016-2032)
- Table 151: Middle East & Africa Functional Protein Market Comparison by Soy-based (2016-2032)
- Table 152: Middle East & Africa Functional Protein Market Comparison by Source (2016-2032)
- Table 153: Middle East & Africa Functional Protein Market Comparison by Form (2016-2032)
- Table 154: Middle East & Africa Functional Protein Market Comparison by Application (2016-2032)
- Table 155: Middle East & Africa Functional Protein Market Revenue (US$ Mn) Comparison by Country (2016-2032)
- Table 156: Middle East & Africa Functional Protein Market Revenue (US$ Mn) (2016-2032)
- Table 157: Middle East & Africa Functional Protein Market Revenue (US$ Mn) Comparison by Country (2016-2032)
- Table 158: Middle East & Africa Functional Protein Market Revenue (US$ Mn) Comparison by Type (2016-2032)
- Table 159: Middle East & Africa Functional Protein Market Revenue (US$ Mn) Comparison by Soy-based (2016-2032)
- Table 160: Middle East & Africa Functional Protein Market Revenue (US$ Mn) Comparison by Source (2016-2032)
- Table 161: Middle East & Africa Functional Protein Market Revenue (US$ Mn) Comparison by Form (2016-2032)
- Table 162: Middle East & Africa Functional Protein Market Revenue (US$ Mn) Comparison by Application (2016-2032)
- Table 163: Middle East & Africa Functional Protein Market Y-o-Y Growth Rate Comparison by Country (2016-2032)
- Table 164: Middle East & Africa Functional Protein Market Y-o-Y Growth Rate Comparison by Type (2016-2032)
- Table 165: Middle East & Africa Functional Protein Market Y-o-Y Growth Rate Comparison by Soy-based (2016-2032)
- Table 166: Middle East & Africa Functional Protein Market Y-o-Y Growth Rate Comparison by Source (2016-2032)
- Table 167: Middle East & Africa Functional Protein Market Y-o-Y Growth Rate Comparison by Form (2016-2032)
- Table 168: Middle East & Africa Functional Protein Market Y-o-Y Growth Rate Comparison by Application (2016-2032)
- Table 169: Middle East & Africa Functional Protein Market Share Comparison by Country (2016-2032)
- Table 170: Middle East & Africa Functional Protein Market Share Comparison by Type (2016-2032)
- Table 171: Middle East & Africa Functional Protein Market Share Comparison by Soy-based (2016-2032)
- Table 172: Middle East & Africa Functional Protein Market Share Comparison by Source (2016-2032)
- Table 173: Middle East & Africa Functional Protein Market Share Comparison by Form (2016-2032)
- Table 174: Middle East & Africa Functional Protein Market Share Comparison by Application (2016-2032)
- 1. Executive Summary
-
- Fonterra Co-Operative Group
- Arla Foods AMBA
- Kerry Group
- Glanbia PLC
- APC Inc.
- Saputo Ingredients
- Friesland Campina
- Glanbia Plc
- Herbalife International, Inc.
Our Clients


View Our Licence Options
