Fermentation Chemicals Market By Product (Organic Acid, Enzymes, Alcohol, Others), By Application (Food and Beverages, Pharmaceuticals, Plastic and Fibers, Industrial, Others), By Form (Liquid and Powder), By Region And Companies - Industry Segment Outlook, Market Assessment, Competition Scenario, Trends, And Forecast 2024-2033
-
48155
-
June 2024
-
300
-


-
This report was compiled by Shreyas Rokade Shreyas Rokade is a seasoned Research Analyst with CMFE, bringing extensive expertise in market research and consulting, with a strong background in Chemical Engineering. Correspondence Team Lead-CMFE Linkedin | Detailed Market research Methodology Our methodology involves a mix of primary research, including interviews with leading mental health experts, and secondary research from reputable medical journals and databases. View Detailed Methodology Page
-
Quick Navigation
Report Overview
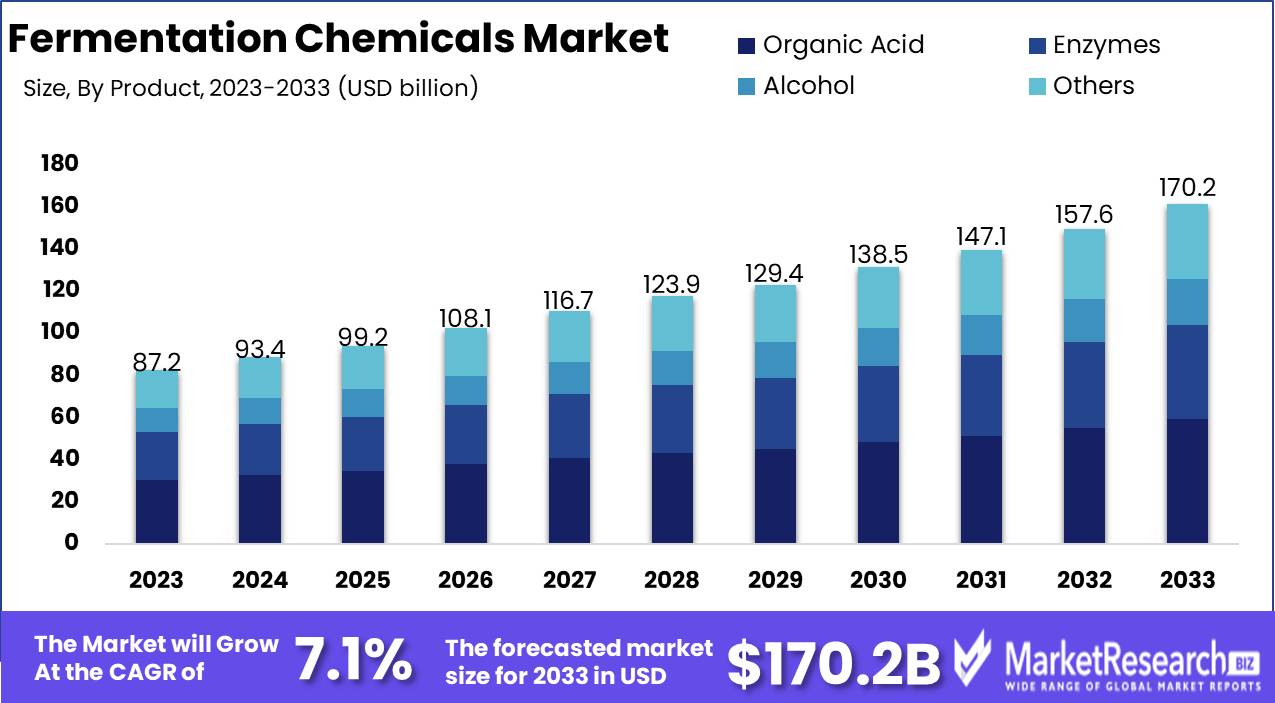
The Fermentation Chemicals Market was valued at USD 87.2 billion in 2023. It is expected to reach USD 170.2 billion by 2033, with a CAGR of 7.1% during the forecast period from 2024 to 2033.
The fermentation chemicals market encompasses the production and application of chemicals derived from fermentation processes, which utilize microorganisms to convert organic substrates into valuable products. Key chemicals include ethanol, acetic acid, citric acid, and lactic acid, which are integral in various industries such as pharmaceuticals, food and beverages, biofuels, and agriculture. The market is driven by growing demand for sustainable and bio-based chemicals, advancements in fermentation technology, and increasing application scope in emerging sectors. With a focus on enhancing production efficiency and environmental sustainability, this market is poised for significant growth, reflecting broader industrial trends towards greener solutions.
The fermentation chemicals market is poised for significant growth, driven by several key factors that align with broader industry and environmental trends. Notably, the rising demand for bio-based products is a primary catalyst. As environmental concerns escalate, both consumers and regulators are advocating for sustainable alternatives, pushing companies towards bio-based fermentation chemicals. This shift is underpinned by stringent regulations promoting eco-friendly solutions, thereby creating a fertile ground for market expansion.
Additionally, there is a marked increase in health awareness among consumers, fueling demand for natural and organic products, particularly in the food and pharmaceutical sectors. This trend is prompting manufacturers to innovate and diversify their product portfolios, leveraging fermentation processes to meet consumer preferences for healthier, more sustainable options.
However, the market is not without its challenges. High production costs associated with fermentation processes remain a significant barrier to growth. The capital-intensive nature of these processes, coupled with the complexity of scaling production, limits the ability of companies to achieve cost efficiency. This financial strain is particularly acute for smaller players and new entrants, who may struggle to compete with established firms with greater resources. Despite these challenges, the long-term outlook for the fermentation chemicals market remains positive. Continued advancements in technology and process optimization are expected to mitigate some cost-related issues, enhancing production efficiency and making bio-based products more accessible. In summary, while the fermentation chemicals market faces cost challenges, the overall trajectory is upward, driven by environmental imperatives and health-conscious consumer behavior.
Key Takeaways
- Market Growth: The Fermentation Chemicals Market was valued at USD 87.2 billion in 2023. It is expected to reach USD 170.2 billion by 2033, with a CAGR of 7.1% during the forecast period from 2024 to 2033.
- By Product: Organic Acid led the Fermentation Chemicals Market by Product.
- By Application: Food and Beverages dominated the Fermentation Chemicals Market applications.
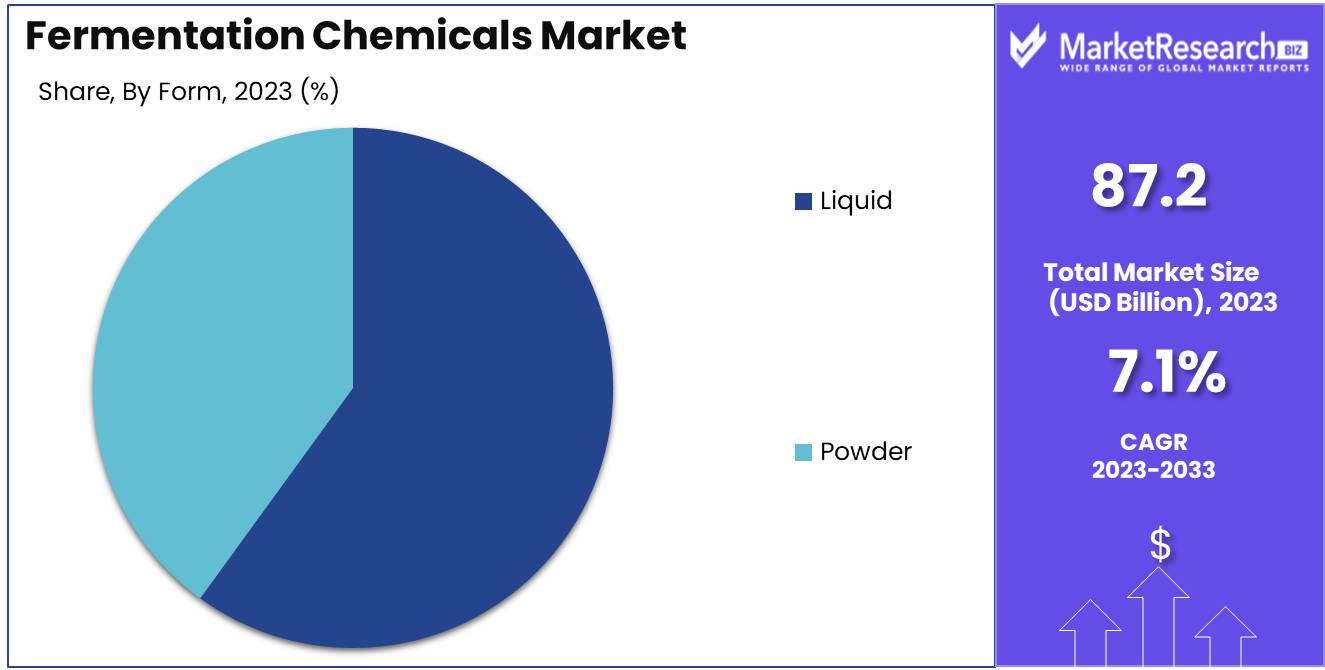
- By Form: Liquid form dominated, but Powder remains crucial for stability.
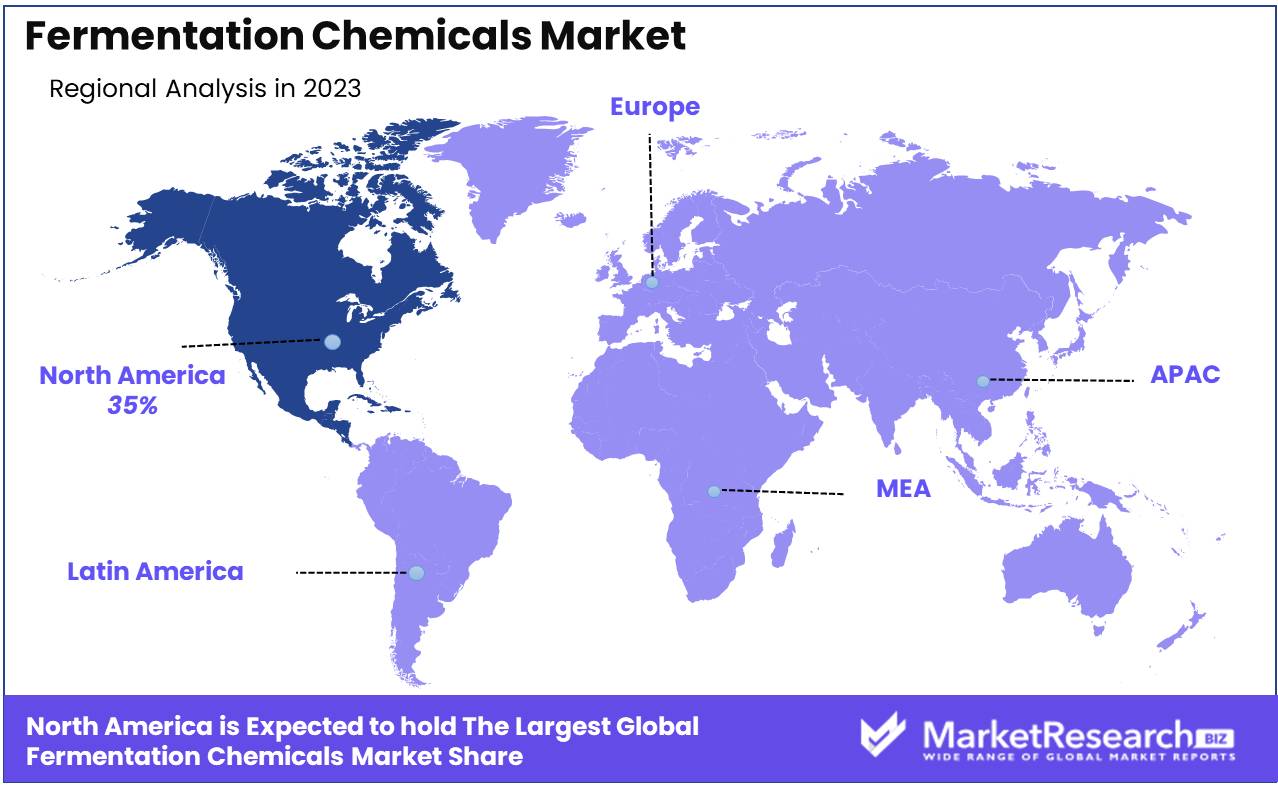
- Regional Dominance: North America dominates the global fermentation chemicals market share with 35%.
- Growth Opportunity: The global fermentation chemicals market is set to grow, driven by the expanding food and beverage industry and rising demand for fermentation-derived enzymes across various sectors.
Driving factors
Rising Industrial Applications Fuel Fermentation Chemicals Market
The increasing demand from the methanol and ethanol industries significantly propels the growth of the fermentation chemicals market. Methanol and ethanol are integral to numerous industrial applications, including biofuels, solvents, and chemical intermediates. As the global push for sustainable and renewable energy sources intensifies, ethanol, particularly as a biofuel, has seen a surge in demand. According to recent industry reports, the global ethanol market is projected to grow at a CAGR of 5.3% from 2020 to 2027. This growth trajectory directly influences the fermentation chemicals market, as ethanol production relies heavily on fermentation processes involving chemicals such as enzymes and yeast. The methanol industry similarly benefits from advancements in fermentation technology, further driving demand for high-quality fermentation chemicals. The convergence of these factors underscores the pivotal role of the methanol and ethanol industries in accelerating the market for fermentation chemicals.
Pharmaceutical Advancements Spur Fermentation Chemicals Demand
The pharmaceutical industry's escalating demand for fermentation chemicals is a crucial driver of market expansion. Fermentation processes are essential in the production of various pharmaceuticals, including antibiotics, vaccines, and biologics. Fermentation chemicals are indispensable in synthesizing active pharmaceutical ingredients (APIs) and in biopharmaceutical manufacturing, which involves the cultivation of microbial cells to produce therapeutic proteins. The rise in chronic diseases and the consequent need for innovative treatments further bolster the demand for fermentation chemicals. This robust growth in the pharmaceutical sector not only highlights the critical importance of fermentation chemicals but also signals sustained market expansion driven by pharmaceutical innovations and the increasing complexity of drug manufacturing processes.
Sustainability Trends Drive Bio-Based Fermentation Chemicals Market
The global shift towards bio-based products represents a transformative force in the fermentation chemicals market. As environmental concerns and sustainability goals become more prominent, industries are increasingly adopting bio-based alternatives to reduce their carbon footprint. Bio-based fermentation chemicals, derived from renewable resources, are gaining traction across various sectors, including agriculture, food and beverages, and personal care. The adoption of bio-based fermentation chemicals aligns with global sustainability trends, driven by consumer demand for eco-friendly products and stringent regulatory policies aimed at reducing reliance on fossil fuels. Companies investing in bio-based fermentation processes benefit from reduced environmental impact and enhanced market competitiveness. This paradigm shift not only fosters innovation in fermentation technology but also ensures long-term growth prospects for the fermentation chemicals market, anchored by sustainability imperatives.
Restraining Factors
Product Recovery Challenges: Hindering Efficiency and Profitability
The process of recovering fermentation chemicals, which involves the separation and purification of the desired product from the fermentation broth, poses significant technical and economic challenges. These recovery processes can be complex and costly, requiring advanced technologies and extensive energy input. As a result, the high costs associated with product recovery can erode profit margins, making fermentation-based production less economically viable compared to other methods.
For instance, the need for sophisticated equipment and high energy consumption can inflate operational expenses, which are ultimately passed on to consumers, making the end products more expensive. This price sensitivity can limit market expansion, as higher prices may reduce the competitiveness of fermentation chemicals in industries like food and beverages, pharmaceuticals, and biofuels.
Additionally, inefficiencies in recovery processes can lead to lower yields, further diminishing the cost-effectiveness of fermentation methods. When product recovery is suboptimal, the overall efficiency of the fermentation process is compromised, resulting in waste and increased production costs. This can discourage manufacturers from investing in fermentation technology, thereby restraining market growth.
Competition from Petrochemicals: A Threat to Market Penetration
The fermentation chemicals market faces significant competition from petrochemical-derived alternatives. Petrochemicals, often produced at larger scales and lower costs due to well-established and optimized industrial processes, can be more attractive to manufacturers. The economies of scale achieved in petrochemical production translate to lower prices, making these chemicals more appealing to cost-sensitive industries.
Moreover, the entrenched infrastructure for petrochemical production, including extensive distribution networks and established market presence, gives petrochemical products a competitive edge. The long-standing reliability and familiarity with petrochemical products can lead to resistance against switching to fermentation chemicals, especially in applications where cost considerations are paramount.
This competition is particularly evident in markets where price is a critical factor, such as in bulk chemicals for industrial use. While fermentation chemicals offer benefits such as sustainability and reduced environmental impact, these advantages may not always outweigh the cost benefits provided by petrochemicals. As a result, the market penetration of fermentation chemicals can be significantly hindered.
By Product Analysis
In 2023, Organic Acid led the Fermentation Chemicals Market by Product.
In 2023, Organic Acid held a dominant market position in the by-product segment of the Fermentation Chemicals Market. The robust demand for organic acids, particularly in food and beverage preservation, significantly contributed to this leadership. Organic acids, such as citric acid and lactic acid, are integral in enhancing the shelf-life and flavor of various consumables, driving their adoption. Moreover, their role in pharmaceuticals and personal care products, for pH adjustment and preservation, bolstered their market penetration.
Enzymes, another critical segment, saw substantial growth due to their essential application in biocatalysis, detergents, and biofuel production. The increasing inclination towards sustainable industrial processes has amplified enzyme utilization across sectors.
Alcohol, predominantly ethanol, maintained a significant market share due to its widespread use in fuel, beverages, and hand sanitizers. The ongoing biofuel initiatives and heightened hygiene standards post-pandemic have further propelled its demand.
The "Others" category, encompassing amino acids, antibiotics, and vitamins, also exhibited considerable market presence. These products are crucial in animal feed, medical treatments, and dietary supplements, underlining their indispensable role in diverse applications within the fermentation chemicals market.
By Application Analysis
In 2023, Food and Beverages dominated the Fermentation Chemicals Market applications.
In 2023, The Food and Beverages segment held a dominant market position in the By Application segment of the Fermentation Chemicals Market. This dominance is driven by the increasing demand for fermented products such as yogurt, cheese, and alcoholic beverages, which leverage fermentation chemicals for their production. The growing consumer preference for natural ingredients and probiotics has significantly bolstered the utilization of fermentation processes in food and beverage manufacturing.
The Pharmaceuticals segment also saw substantial growth, attributed to the rising application of fermentation chemicals in the production of antibiotics, insulin, and vaccines. As healthcare demands increase globally, the pharmaceutical industry's reliance on fermentation technologies continues to expand, ensuring high-quality and efficient drug production.
Plastic and Fibers emerged as a crucial segment, propelled by the shift towards sustainable and biodegradable materials. Fermentation chemicals play a key role in producing bioplastics and biofibers, aligning with the environmental goals of reducing plastic waste and lowering carbon footprints.
In the Industrial segment, fermentation chemicals are integral to biofuel production and waste treatment processes. The push for cleaner energy sources and effective waste management solutions has amplified the sector's reliance on these chemicals.
Lastly, the Others category, encompassing applications like textiles and animal feed, continues to grow steadily. Fermentation chemicals enhance the nutritional value of animal feed and improve the quality of textile products, further diversifying their application across various industries.
By Form Analysis
In 2023, Liquid form dominated, but Powder remains crucial for stability.
In 2023, The Liquid form held a dominant market position in the By Form segment of the Fermentation Chemicals Market. This supremacy can be attributed to the liquid form's superior ease of use, which facilitates more consistent mixing and application in various industrial processes, including food and beverage, pharmaceuticals, and biofuels. The liquid form's high solubility ensures efficient microbial activity, leading to enhanced fermentation efficiency and product yield. Additionally, the transportation and storage advantages of liquid fermentation chemicals, such as reduced risk of contamination and ease of handling, further bolster their market preference.
Conversely, the Powder form of fermentation chemicals, while slightly less dominant, remains integral due to its longer shelf life and stability under diverse environmental conditions. Powders are particularly favored in regions where logistical challenges are prevalent, as they are less prone to degradation and easier to store without special conditions. Their precise dosing capability also makes powders an ideal choice for applications requiring stringent control over fermentation processes. Despite the liquid form's dominance, the powder form continues to secure a significant market share by addressing specific industry needs and logistical considerations.
Key Market Segments
By Product
- Organic Acid
- Enzymes
- Alcohol
- Others
By Application
- Food and Beverages
- Pharmaceuticals
- Plastic and Fibers
- Industrial
- Others
By Form
- Liquid
- Powder
Growth Opportunity
Expanding Food and Beverage Industry
The global fermentation chemicals market is poised for significant growth in 2024, driven by robust expansion in the food and beverage industry. As consumers increasingly seek natural and sustainable food products, fermentation chemicals have become essential in the production of various foods and beverages. Fermentation-derived products such as organic acids, amino acids, and enzymes are integral in enhancing food quality, safety, and shelf-life. The growing demand for plant-based and functional foods, alongside the rising health consciousness among consumers, is amplifying the need for innovative fermentation solutions. Consequently, manufacturers are investing heavily in R&D to develop advanced fermentation processes, further propelling market growth.
Rising Popularity of Fermentation-Derived Enzymes
Fermentation-derived enzymes are gaining traction across multiple industries, including pharmaceuticals, textiles, and biofuels, in addition to food and beverages. These enzymes offer environmentally friendly and cost-effective solutions for various industrial processes. In the food industry, they are critical for processes like brewing, baking, and dairy production, where they help in improving texture, flavor, and nutritional content. The pharmaceutical industry leverages these enzymes for drug development and manufacturing, capitalizing on their precision and efficiency. The biofuels sector benefits from fermentation-derived enzymes' ability to convert biomass into renewable energy, aligning with global sustainability goals. This rising popularity underscores a substantial growth opportunity, with market players expanding their enzyme portfolios to cater to diverse applications.
Latest Trends
Increasing Adoption of Sustainable and Green Chemistry
The fermentation chemicals market is poised for significant transformation driven by the increasing adoption of sustainable and green chemistry. This trend is fueled by a growing awareness of environmental impacts and stringent regulations aimed at reducing carbon footprints. Companies are investing heavily in research and development to create bio-based fermentation chemicals, which offer an eco-friendly alternative to traditional petrochemical-based products. The push towards sustainability is also enhancing the appeal of fermentation chemicals in various industries, including pharmaceuticals, food and beverages, and biofuels. As businesses seek to align with global sustainability goals, the demand for green fermentation chemicals is expected to rise, driving market growth and fostering innovation.
Government Initiatives Promoting Domestic Manufacturing
Government initiatives aimed at bolstering domestic manufacturing capabilities are also playing a pivotal role in shaping the fermentation chemicals market. Countries worldwide are implementing policies to reduce reliance on imports and strengthen local production infrastructures. These initiatives include financial incentives, subsidies, and the development of specialized industrial zones. For instance, the United States and the European Union are investing in bio-manufacturing hubs to support the domestic production of fermentation chemicals. This not only enhances supply chain resilience but also creates opportunities for small and medium-sized enterprises to enter the market. Moreover, these government efforts are expected to lead to advancements in production technologies and a more competitive market landscape.
Regional Analysis
North America dominates the global fermentation chemicals market share with 35%.
The global fermentation chemicals market exhibits diverse growth patterns across various regions, driven by regional industrial capabilities, consumer demand, and technological advancements. North America dominates the market, accounting for approximately 35% of the global largest market share. This dominance is underpinned by the presence of major industry players, advanced biotechnological research, and significant investments in sustainable chemical processes. The United States leads this growth, propelled by high demand in pharmaceuticals, food and beverages, and biofuel sectors.
Europe follows closely, contributing around 30% to the global market, with Germany, France, and the UK at the forefront due to their strong industrial base and stringent environmental regulations promoting the use of bio-based chemicals. The region's focus on reducing carbon footprints and enhancing bio-economy further fuels market expansion.
In the Asia-Pacific region, rapid industrialization and urbanization, particularly in China and India, drive market growth, capturing roughly 25% of the global market. The burgeoning food and beverage industry, coupled with increasing pharmaceutical manufacturing, augments demand for fermentation chemicals.
The Middle East & Africa, though a smaller segment, is witnessing steady growth, spurred by rising investments in biotechnology and an expanding food processing industry. Latin America, with Brazil and Argentina as key players, is experiencing moderate growth, driven by the agricultural sector's demand for bio-based chemicals.
Key Regions and Countries
North America
- The US
- Canada
- Rest of North America
Europe
- Germany
- France
- The UK
- Spain
- Netherlands
- Russia
- Italy
- Rest of Europe
Asia-Pacific
- China
- Japan
- Singapore
- Thailand
- South Korea
- Vietnam
- India
- New Zealand
- Rest of Asia Pacific
Latin America
- Mexico
- Brazil
- Rest of Latin America
Middle East & Africa
- Saudi Arabia
- South Africa
- UAE
- Rest of the Middle East & Africa
Key Players Analysis
The global fermentation chemicals market in 2024 is poised for significant growth, driven by advancements in biotechnology and increasing demand across various sectors, including food and beverages, pharmaceuticals, and biofuels.
BASF SE is likely to leverage its strong position in the chemicals industry by focusing on sustainable production processes and innovative product offerings. Novozymes A/S, renowned for its enzymatic solutions, will continue to capitalize on its expertise in biotechnology, driving efficiency and sustainability in industrial processes. Dow Chemical Company, with its diversified portfolio, is expected to benefit from its integrated supply chain and emphasis on high-performance materials.
Evonik Industries AG and Ajinomoto Co. Inc. will play critical roles in the amino acids and specialty chemicals segments, respectively. Their focus on high-quality, application-specific products positions them well to cater to niche markets. Archer Daniels Midland Company and Cargill Incorporated, giants in the agricultural sector, will likely expand their influence in fermentation chemicals by integrating their robust supply chains and leveraging their extensive market reach.
DuPont de Nemours Inc. and Lonza Group AG, with their strong R&D capabilities, will continue to drive innovation in bio-based chemicals, catering to the growing demand for eco-friendly products. DSM and AB Enzymes GmbH will enhance their market positions by focusing on health and nutrition applications, aligning with global trends toward healthier lifestyles.
Emerging players like BioAmber Inc. and Lallemand Inc. will contribute to market diversity through their specialized products and innovative approaches. Overall, the competitive landscape will be characterized by strategic collaborations, technological advancements, and a strong emphasis on sustainability, driving the global fermentation chemicals market toward robust growth.
Market Key Players
- BASF SE
- Novozymes A/S
- Dow Chemical Company
- Evonik Industries AG
- Ajinomoto Co. Inc.
- Archer Daniels Midland Company
- Cargill Incorporated
- Hansen Holding A/S
- DuPont de Nemours Inc.
- Lonza Group AG
- DSM
- AB Enzymes GmbH
- BioAmber Inc.
- Lallemand Inc.
- Kyowa Hakko Bio Co. Ltd.
- Novamont S.p.A.
- Tereos SA
- Sumitomo Chemical Co. Ltd.
- Tate & Lyle PLC
- Amano Enzyme Inc.
- Others
Recent Development
- In May 2024, Cargill unveiled a major expansion of its fermentation facility in Blair, Nebraska, to meet the growing demand for bio-based chemicals. This $150 million investment highlights Cargill's strategic focus on scaling up production capabilities to support the increasing market need for sustainable chemical alternatives.
- In March 2024, BASF SE announced the launch of a new line of bio-based fermentation chemicals aimed at reducing carbon footprint and enhancing sustainability in various industrial processes. This initiative aligns with BASF’s commitment to sustainable solutions and innovation in chemical production.
- In January 2024, Novozymes, a leader in enzyme production, introduced a breakthrough fermentation technology designed to significantly increase yield and efficiency in biofuel production. This development is expected to lower production costs and boost the adoption of renewable energy sources.
Report Scope
Report Features Description Market Value (2023) USD 87.2 Billion Forecast Revenue (2033) USD 170.2 Billion CAGR (2024-2032) 7.1% Base Year for Estimation 2023 Historic Period 2016-2023 Forecast Period 2024-2033 Report Coverage Revenue Forecast, Market Dynamics, COVID-19 Impact, Competitive Landscape, Recent Developments Segments Covered By Product (Organic Acid, Enzymes, Alcohol, Others), By Application (Food and Beverages, Pharmaceuticals, Plastic and Fibers, Industrial, Others), By Form (Liquid and Powder) Regional Analysis North America - The US, Canada, Rest of North America, Europe - Germany, France, The UK, Spain, Italy, Russia, Netherlands, Rest of Europe, Asia-Pacific - China, Japan, South Korea, India, New Zealand, Singapore, Thailand, Vietnam, Rest of Asia Pacific, Latin America - Brazil, Mexico, Rest of Latin America, Middle East & Africa - South Africa, Saudi Arabia, UAE, Rest of Middle East & Africa Competitive Landscape BASF SE, Novozymes A/S, Dow Chemical Company, Evonik Industries AG, Ajinomoto Co. Inc., Archer Daniels Midland Company, Cargill Incorporated, Hansen Holding A/S, DuPont de Nemours Inc., Lonza Group AG, DSM, AB Enzymes GmbH, BioAmber Inc., Lallemand Inc., Kyowa Hakko Bio Co. Ltd., Novamont S.p.A., Tereos SA, Sumitomo Chemical Co. Ltd., Tate & Lyle PLC, Amano Enzyme Inc., Others Customization Scope Customization for segments, region/country-level will be provided. Moreover, additional customization can be done based on the requirements. Purchase Options We have three licenses to opt for Single User License, Multi-User License (Up to 5 Users), Corporate Use License (Unlimited User and Printable PDF) -
- 1. Executive Summary
- 1.1. Definition
- 1.2. Taxonomy
- 1.3. Research Scope
- 1.4. Key Analysis
- 1.5. Key Findings by Major Segments
- 1.6. Top strategies by Major Players
- 2. Global Fermentation Chemicals Market Overview
- 2.1. Fermentation Chemicals Market Dynamics
- 2.1.1. Drivers
- 2.1.2. Opportunities
- 2.1.3. Restraints
- 2.1.4. Challenges
- 2.2. Macro-economic Factors
- 2.3. Regulatory Framework
- 2.4. Market Investment Feasibility Index
- 2.5. PEST Analysis
- 2.6. PORTER’S Five Force Analysis
- 2.7. Drivers & Restraints Impact Analysis
- 2.8. Industry Chain Analysis
- 2.9. Cost Structure Analysis
- 2.10. Marketing Strategy
- 2.11. Russia-Ukraine War Impact Analysis
- 2.12. Opportunity Map Analysis
- 2.13. Market Competition Scenario Analysis
- 2.14. Product Life Cycle Analysis
- 2.15. Opportunity Orbits
- 2.16. Manufacturer Intensity Map
- 2.17. Major Companies sales by Value & Volume
- 2.1. Fermentation Chemicals Market Dynamics
- 3. Global Fermentation Chemicals Market Analysis, Opportunity and Forecast, 2016-2032
- 3.1. Global Fermentation Chemicals Market Analysis, 2016-2021
- 3.2. Global Fermentation Chemicals Market Opportunity and Forecast, 2023-2032
- 3.3. Global Fermentation Chemicals Market Analysis, Opportunity and Forecast, By Product, 2016-2032
- 3.3.1. Global Fermentation Chemicals Market Analysis by Product: Introduction
- 3.3.2. Market Size Absolute $ Opportunity Analysis and Forecast, By Product, 2016-2032
- 3.3.3. Organic Acid
- 3.3.4. Enzymes
- 3.3.5. Alcohol
- 3.3.6. Others
- 3.4. Global Fermentation Chemicals Market Analysis, Opportunity and Forecast, By Application, 2016-2032
- 3.4.1. Global Fermentation Chemicals Market Analysis by Application: Introduction
- 3.4.2. Market Size Absolute $ Opportunity Analysis and Forecast, By Application, 2016-2032
- 3.4.3. Food and Beverages
- 3.4.4. Pharmaceuticals
- 3.4.5. Plastic and Fibers
- 3.4.6. Industrial
- 3.4.7. Others
- 3.5. Global Fermentation Chemicals Market Analysis, Opportunity and Forecast, By Form, 2016-2032
- 3.5.1. Global Fermentation Chemicals Market Analysis by Form: Introduction
- 3.5.2. Market Size Absolute $ Opportunity Analysis and Forecast, By Form, 2016-2032
- 3.5.3. Liquid
- 3.5.4. Powder
- 4. North America Fermentation Chemicals Market Analysis, Opportunity and Forecast, 2016-2032
- 4.1. North America Fermentation Chemicals Market Analysis, 2016-2021
- 4.2. North America Fermentation Chemicals Market Opportunity and Forecast, 2023-2032
- 4.3. North America Fermentation Chemicals Market Analysis, Opportunity and Forecast, By Product, 2016-2032
- 4.3.1. North America Fermentation Chemicals Market Analysis by Product: Introduction
- 4.3.2. Market Size Absolute $ Opportunity Analysis and Forecast, By Product, 2016-2032
- 4.3.3. Organic Acid
- 4.3.4. Enzymes
- 4.3.5. Alcohol
- 4.3.6. Others
- 4.4. North America Fermentation Chemicals Market Analysis, Opportunity and Forecast, By Application, 2016-2032
- 4.4.1. North America Fermentation Chemicals Market Analysis by Application: Introduction
- 4.4.2. Market Size Absolute $ Opportunity Analysis and Forecast, By Application, 2016-2032
- 4.4.3. Food and Beverages
- 4.4.4. Pharmaceuticals
- 4.4.5. Plastic and Fibers
- 4.4.6. Industrial
- 4.4.7. Others
- 4.5. North America Fermentation Chemicals Market Analysis, Opportunity and Forecast, By Form, 2016-2032
- 4.5.1. North America Fermentation Chemicals Market Analysis by Form: Introduction
- 4.5.2. Market Size Absolute $ Opportunity Analysis and Forecast, By Form, 2016-2032
- 4.5.3. Liquid
- 4.5.4. Powder
- 4.6. North America Fermentation Chemicals Market Analysis, Opportunity and Forecast, By Country , 2016-2032
- 4.6.1. North America Fermentation Chemicals Market Analysis by Country : Introduction
- 4.6.2. Market Size Absolute $ Opportunity Analysis and Forecast, Country , 2016-2032
- 4.6.2.1. The US
- 4.6.2.2. Canada
- 4.6.2.3. Mexico
- 5. Western Europe Fermentation Chemicals Market Analysis, Opportunity and Forecast, 2016-2032
- 5.1. Western Europe Fermentation Chemicals Market Analysis, 2016-2021
- 5.2. Western Europe Fermentation Chemicals Market Opportunity and Forecast, 2023-2032
- 5.3. Western Europe Fermentation Chemicals Market Analysis, Opportunity and Forecast, By Product, 2016-2032
- 5.3.1. Western Europe Fermentation Chemicals Market Analysis by Product: Introduction
- 5.3.2. Market Size Absolute $ Opportunity Analysis and Forecast, By Product, 2016-2032
- 5.3.3. Organic Acid
- 5.3.4. Enzymes
- 5.3.5. Alcohol
- 5.3.6. Others
- 5.4. Western Europe Fermentation Chemicals Market Analysis, Opportunity and Forecast, By Application, 2016-2032
- 5.4.1. Western Europe Fermentation Chemicals Market Analysis by Application: Introduction
- 5.4.2. Market Size Absolute $ Opportunity Analysis and Forecast, By Application, 2016-2032
- 5.4.3. Food and Beverages
- 5.4.4. Pharmaceuticals
- 5.4.5. Plastic and Fibers
- 5.4.6. Industrial
- 5.4.7. Others
- 5.5. Western Europe Fermentation Chemicals Market Analysis, Opportunity and Forecast, By Form, 2016-2032
- 5.5.1. Western Europe Fermentation Chemicals Market Analysis by Form: Introduction
- 5.5.2. Market Size Absolute $ Opportunity Analysis and Forecast, By Form, 2016-2032
- 5.5.3. Liquid
- 5.5.4. Powder
- 5.6. Western Europe Fermentation Chemicals Market Analysis, Opportunity and Forecast, By Country , 2016-2032
- 5.6.1. Western Europe Fermentation Chemicals Market Analysis by Country : Introduction
- 5.6.2. Market Size Absolute $ Opportunity Analysis and Forecast, Country , 2016-2032
- 5.6.2.1. Germany
- 5.6.2.2. France
- 5.6.2.3. The UK
- 5.6.2.4. Spain
- 5.6.2.5. Italy
- 5.6.2.6. Portugal
- 5.6.2.7. Ireland
- 5.6.2.8. Austria
- 5.6.2.9. Switzerland
- 5.6.2.10. Benelux
- 5.6.2.11. Nordic
- 5.6.2.12. Rest of Western Europe
- 6. Eastern Europe Fermentation Chemicals Market Analysis, Opportunity and Forecast, 2016-2032
- 6.1. Eastern Europe Fermentation Chemicals Market Analysis, 2016-2021
- 6.2. Eastern Europe Fermentation Chemicals Market Opportunity and Forecast, 2023-2032
- 6.3. Eastern Europe Fermentation Chemicals Market Analysis, Opportunity and Forecast, By Product, 2016-2032
- 6.3.1. Eastern Europe Fermentation Chemicals Market Analysis by Product: Introduction
- 6.3.2. Market Size Absolute $ Opportunity Analysis and Forecast, By Product, 2016-2032
- 6.3.3. Organic Acid
- 6.3.4. Enzymes
- 6.3.5. Alcohol
- 6.3.6. Others
- 6.4. Eastern Europe Fermentation Chemicals Market Analysis, Opportunity and Forecast, By Application, 2016-2032
- 6.4.1. Eastern Europe Fermentation Chemicals Market Analysis by Application: Introduction
- 6.4.2. Market Size Absolute $ Opportunity Analysis and Forecast, By Application, 2016-2032
- 6.4.3. Food and Beverages
- 6.4.4. Pharmaceuticals
- 6.4.5. Plastic and Fibers
- 6.4.6. Industrial
- 6.4.7. Others
- 6.5. Eastern Europe Fermentation Chemicals Market Analysis, Opportunity and Forecast, By Form, 2016-2032
- 6.5.1. Eastern Europe Fermentation Chemicals Market Analysis by Form: Introduction
- 6.5.2. Market Size Absolute $ Opportunity Analysis and Forecast, By Form, 2016-2032
- 6.5.3. Liquid
- 6.5.4. Powder
- 6.6. Eastern Europe Fermentation Chemicals Market Analysis, Opportunity and Forecast, By Country , 2016-2032
- 6.6.1. Eastern Europe Fermentation Chemicals Market Analysis by Country : Introduction
- 6.6.2. Market Size Absolute $ Opportunity Analysis and Forecast, Country , 2016-2032
- 6.6.2.1. Russia
- 6.6.2.2. Poland
- 6.6.2.3. The Czech Republic
- 6.6.2.4. Greece
- 6.6.2.5. Rest of Eastern Europe
- 7. APAC Fermentation Chemicals Market Analysis, Opportunity and Forecast, 2016-2032
- 7.1. APAC Fermentation Chemicals Market Analysis, 2016-2021
- 7.2. APAC Fermentation Chemicals Market Opportunity and Forecast, 2023-2032
- 7.3. APAC Fermentation Chemicals Market Analysis, Opportunity and Forecast, By Product, 2016-2032
- 7.3.1. APAC Fermentation Chemicals Market Analysis by Product: Introduction
- 7.3.2. Market Size Absolute $ Opportunity Analysis and Forecast, By Product, 2016-2032
- 7.3.3. Organic Acid
- 7.3.4. Enzymes
- 7.3.5. Alcohol
- 7.3.6. Others
- 7.4. APAC Fermentation Chemicals Market Analysis, Opportunity and Forecast, By Application, 2016-2032
- 7.4.1. APAC Fermentation Chemicals Market Analysis by Application: Introduction
- 7.4.2. Market Size Absolute $ Opportunity Analysis and Forecast, By Application, 2016-2032
- 7.4.3. Food and Beverages
- 7.4.4. Pharmaceuticals
- 7.4.5. Plastic and Fibers
- 7.4.6. Industrial
- 7.4.7. Others
- 7.5. APAC Fermentation Chemicals Market Analysis, Opportunity and Forecast, By Form, 2016-2032
- 7.5.1. APAC Fermentation Chemicals Market Analysis by Form: Introduction
- 7.5.2. Market Size Absolute $ Opportunity Analysis and Forecast, By Form, 2016-2032
- 7.5.3. Liquid
- 7.5.4. Powder
- 7.6. APAC Fermentation Chemicals Market Analysis, Opportunity and Forecast, By Country , 2016-2032
- 7.6.1. APAC Fermentation Chemicals Market Analysis by Country : Introduction
- 7.6.2. Market Size Absolute $ Opportunity Analysis and Forecast, Country , 2016-2032
- 7.6.2.1. China
- 7.6.2.2. Japan
- 7.6.2.3. South Korea
- 7.6.2.4. India
- 7.6.2.5. Australia & New Zeland
- 7.6.2.6. Indonesia
- 7.6.2.7. Malaysia
- 7.6.2.8. Philippines
- 7.6.2.9. Singapore
- 7.6.2.10. Thailand
- 7.6.2.11. Vietnam
- 7.6.2.12. Rest of APAC
- 8. Latin America Fermentation Chemicals Market Analysis, Opportunity and Forecast, 2016-2032
- 8.1. Latin America Fermentation Chemicals Market Analysis, 2016-2021
- 8.2. Latin America Fermentation Chemicals Market Opportunity and Forecast, 2023-2032
- 8.3. Latin America Fermentation Chemicals Market Analysis, Opportunity and Forecast, By Product, 2016-2032
- 8.3.1. Latin America Fermentation Chemicals Market Analysis by Product: Introduction
- 8.3.2. Market Size Absolute $ Opportunity Analysis and Forecast, By Product, 2016-2032
- 8.3.3. Organic Acid
- 8.3.4. Enzymes
- 8.3.5. Alcohol
- 8.3.6. Others
- 8.4. Latin America Fermentation Chemicals Market Analysis, Opportunity and Forecast, By Application, 2016-2032
- 8.4.1. Latin America Fermentation Chemicals Market Analysis by Application: Introduction
- 8.4.2. Market Size Absolute $ Opportunity Analysis and Forecast, By Application, 2016-2032
- 8.4.3. Food and Beverages
- 8.4.4. Pharmaceuticals
- 8.4.5. Plastic and Fibers
- 8.4.6. Industrial
- 8.4.7. Others
- 8.5. Latin America Fermentation Chemicals Market Analysis, Opportunity and Forecast, By Form, 2016-2032
- 8.5.1. Latin America Fermentation Chemicals Market Analysis by Form: Introduction
- 8.5.2. Market Size Absolute $ Opportunity Analysis and Forecast, By Form, 2016-2032
- 8.5.3. Liquid
- 8.5.4. Powder
- 8.6. Latin America Fermentation Chemicals Market Analysis, Opportunity and Forecast, By Country , 2016-2032
- 8.6.1. Latin America Fermentation Chemicals Market Analysis by Country : Introduction
- 8.6.2. Market Size Absolute $ Opportunity Analysis and Forecast, Country , 2016-2032
- 8.6.2.1. Brazil
- 8.6.2.2. Colombia
- 8.6.2.3. Chile
- 8.6.2.4. Argentina
- 8.6.2.5. Costa Rica
- 8.6.2.6. Rest of Latin America
- 9. Middle East & Africa Fermentation Chemicals Market Analysis, Opportunity and Forecast, 2016-2032
- 9.1. Middle East & Africa Fermentation Chemicals Market Analysis, 2016-2021
- 9.2. Middle East & Africa Fermentation Chemicals Market Opportunity and Forecast, 2023-2032
- 9.3. Middle East & Africa Fermentation Chemicals Market Analysis, Opportunity and Forecast, By Product, 2016-2032
- 9.3.1. Middle East & Africa Fermentation Chemicals Market Analysis by Product: Introduction
- 9.3.2. Market Size Absolute $ Opportunity Analysis and Forecast, By Product, 2016-2032
- 9.3.3. Organic Acid
- 9.3.4. Enzymes
- 9.3.5. Alcohol
- 9.3.6. Others
- 9.4. Middle East & Africa Fermentation Chemicals Market Analysis, Opportunity and Forecast, By Application, 2016-2032
- 9.4.1. Middle East & Africa Fermentation Chemicals Market Analysis by Application: Introduction
- 9.4.2. Market Size Absolute $ Opportunity Analysis and Forecast, By Application, 2016-2032
- 9.4.3. Food and Beverages
- 9.4.4. Pharmaceuticals
- 9.4.5. Plastic and Fibers
- 9.4.6. Industrial
- 9.4.7. Others
- 9.5. Middle East & Africa Fermentation Chemicals Market Analysis, Opportunity and Forecast, By Form, 2016-2032
- 9.5.1. Middle East & Africa Fermentation Chemicals Market Analysis by Form: Introduction
- 9.5.2. Market Size Absolute $ Opportunity Analysis and Forecast, By Form, 2016-2032
- 9.5.3. Liquid
- 9.5.4. Powder
- 9.6. Middle East & Africa Fermentation Chemicals Market Analysis, Opportunity and Forecast, By Country , 2016-2032
- 9.6.1. Middle East & Africa Fermentation Chemicals Market Analysis by Country : Introduction
- 9.6.2. Market Size Absolute $ Opportunity Analysis and Forecast, Country , 2016-2032
- 9.6.2.1. Algeria
- 9.6.2.2. Egypt
- 9.6.2.3. Israel
- 9.6.2.4. Kuwait
- 9.6.2.5. Nigeria
- 9.6.2.6. Saudi Arabia
- 9.6.2.7. South Africa
- 9.6.2.8. Turkey
- 9.6.2.9. The UAE
- 9.6.2.10. Rest of MEA
- 10. Global Fermentation Chemicals Market Analysis, Opportunity and Forecast, By Region , 2016-2032
- 10.1. Global Fermentation Chemicals Market Analysis by Region : Introduction
- 10.2. Market Size Absolute $ Opportunity Analysis and Forecast, By Region , 2016-2032
- 10.2.1. North America
- 10.2.2. Western Europe
- 10.2.3. Eastern Europe
- 10.2.4. APAC
- 10.2.5. Latin America
- 10.2.6. Middle East & Africa
- 11. Global Fermentation Chemicals Market Competitive Landscape, Market Share Analysis, and Company Profiles
- 11.1. Market Share Analysis
- 11.2. Company Profiles
- 11.3. BASF SE
- 11.3.1. Company Overview
- 11.3.2. Financial Highlights
- 11.3.3. Product Portfolio
- 11.3.4. SWOT Analysis
- 11.3.5. Key Strategies and Developments
- 11.4. Novozymes A/S
- 11.4.1. Company Overview
- 11.4.2. Financial Highlights
- 11.4.3. Product Portfolio
- 11.4.4. SWOT Analysis
- 11.4.5. Key Strategies and Developments
- 11.5. Dow Chemical Company
- 11.5.1. Company Overview
- 11.5.2. Financial Highlights
- 11.5.3. Product Portfolio
- 11.5.4. SWOT Analysis
- 11.5.5. Key Strategies and Developments
- 11.6. Evonik Industries AG
- 11.6.1. Company Overview
- 11.6.2. Financial Highlights
- 11.6.3. Product Portfolio
- 11.6.4. SWOT Analysis
- 11.6.5. Key Strategies and Developments
- 11.7. Ajinomoto Co. Inc.
- 11.7.1. Company Overview
- 11.7.2. Financial Highlights
- 11.7.3. Product Portfolio
- 11.7.4. SWOT Analysis
- 11.7.5. Key Strategies and Developments
- 11.8. Archer Daniels Midland Company
- 11.8.1. Company Overview
- 11.8.2. Financial Highlights
- 11.8.3. Product Portfolio
- 11.8.4. SWOT Analysis
- 11.8.5. Key Strategies and Developments
- 11.9. Cargill Incorporated
- 11.9.1. Company Overview
- 11.9.2. Financial Highlights
- 11.9.3. Product Portfolio
- 11.9.4. SWOT Analysis
- 11.9.5. Key Strategies and Developments
- 11.10. Hansen Holding A/S
- 11.10.1. Company Overview
- 11.10.2. Financial Highlights
- 11.10.3. Product Portfolio
- 11.10.4. SWOT Analysis
- 11.10.5. Key Strategies and Developments
- 11.11. DuPont de Nemours Inc.
- 11.11.1. Company Overview
- 11.11.2. Financial Highlights
- 11.11.3. Product Portfolio
- 11.11.4. SWOT Analysis
- 11.11.5. Key Strategies and Developments
- 11.12. Lonza Group AG
- 11.12.1. Company Overview
- 11.12.2. Financial Highlights
- 11.12.3. Product Portfolio
- 11.12.4. SWOT Analysis
- 11.12.5. Key Strategies and Developments
- 11.13.1. Company Overview
- 11.13.2. Financial Highlights
- 11.13.3. Product Portfolio
- 11.13.4. SWOT Analysis
- 11.13.5. Key Strategies and Developments
- 11.14. DSM
- 11.14.1. Company Overview
- 11.14.2. Financial Highlights
- 11.14.3. Product Portfolio
- 11.14.4. SWOT Analysis
- 11.14.5. Key Strategies and Developments
- 11.15. BioAmber Inc.
- 11.15.1. Company Overview
- 11.15.2. Financial Highlights
- 11.15.3. Product Portfolio
- 11.15.4. SWOT Analysis
- 11.15.5. Key Strategies and Developments
- 11.16. Lallemand Inc.
- 11.16.1. Company Overview
- 11.16.2. Financial Highlights
- 11.16.3. Product Portfolio
- 11.16.4. SWOT Analysis
- 11.16.5. Key Strategies and Developments
- 11.17. Kyowa Hakko Bio Co. Ltd.
- 11.17.1. Company Overview
- 11.17.2. Financial Highlights
- 11.17.3. Product Portfolio
- 11.17.4. SWOT Analysis
- 11.17.5. Key Strategies and Developments
- 11.18. Novamont S.p.A.
- 11.18.1. Company Overview
- 11.18.2. Financial Highlights
- 11.18.3. Product Portfolio
- 11.18.4. SWOT Analysis
- 11.18.5. Key Strategies and Developments
- 11.19. Tereos SA
- 11.19.1. Company Overview
- 11.19.2. Financial Highlights
- 11.19.3. Product Portfolio
- 11.19.4. SWOT Analysis
- 11.19.5. Key Strategies and Developments
- 11.20. Sumitomo Chemical Co. Ltd.
- 11.20.1. Company Overview
- 11.20.2. Financial Highlights
- 11.20.3. Product Portfolio
- 11.20.4. SWOT Analysis
- 11.20.5. Key Strategies and Developments
- 11.21. Tate & Lyle PLC
- 11.21.1. Company Overview
- 11.21.2. Financial Highlights
- 11.21.3. Product Portfolio
- 11.21.4. SWOT Analysis
- 11.21.5. Key Strategies and Developments
- 11.22. Amano Enzyme Inc.
- 11.22.1. Company Overview
- 11.22.2. Financial Highlights
- 11.22.3. Product Portfolio
- 11.22.4. SWOT Analysis
- 11.22.5. Key Strategies and Developments
- 12. Assumptions and Acronyms
- 13. Research Methodology
- 14. Contact
"
- List of Figures
- "
- Figure 1: Global Fermentation Chemicals Market Revenue (US$ Mn) Market Share by Product in 2022
- Figure 2: Global Fermentation Chemicals Market Market Attractiveness Analysis by Product, 2016-2032
- Figure 3: Global Fermentation Chemicals Market Revenue (US$ Mn) Market Share by Applicationin 2022
- Figure 4: Global Fermentation Chemicals Market Market Attractiveness Analysis by Application, 2016-2032
- Figure 5: Global Fermentation Chemicals Market Revenue (US$ Mn) Market Share by Formin 2022
- Figure 6: Global Fermentation Chemicals Market Market Attractiveness Analysis by Form, 2016-2032
- Figure 7: Global Fermentation Chemicals Market Revenue (US$ Mn) Market Share by Region in 2022
- Figure 8: Global Fermentation Chemicals Market Market Attractiveness Analysis by Region, 2016-2032
- Figure 9: Global Fermentation Chemicals Market Market Revenue (US$ Mn) (2016-2032)
- Figure 10: Global Fermentation Chemicals Market Market Revenue (US$ Mn) Comparison by Region (2016-2032)
- Figure 11: Global Fermentation Chemicals Market Market Revenue (US$ Mn) Comparison by Product (2016-2032)
- Figure 12: Global Fermentation Chemicals Market Market Revenue (US$ Mn) Comparison by Application (2016-2032)
- Figure 13: Global Fermentation Chemicals Market Market Revenue (US$ Mn) Comparison by Form (2016-2032)
- Figure 14: Global Fermentation Chemicals Market Market Y-o-Y Growth Rate Comparison by Region (2016-2032)
- Figure 15: Global Fermentation Chemicals Market Market Y-o-Y Growth Rate Comparison by Product (2016-2032)
- Figure 16: Global Fermentation Chemicals Market Market Y-o-Y Growth Rate Comparison by Application (2016-2032)
- Figure 17: Global Fermentation Chemicals Market Market Y-o-Y Growth Rate Comparison by Form (2016-2032)
- Figure 18: Global Fermentation Chemicals Market Market Share Comparison by Region (2016-2032)
- Figure 19: Global Fermentation Chemicals Market Market Share Comparison by Product (2016-2032)
- Figure 20: Global Fermentation Chemicals Market Market Share Comparison by Application (2016-2032)
- Figure 21: Global Fermentation Chemicals Market Market Share Comparison by Form (2016-2032)
- Figure 22: North America Fermentation Chemicals Market Revenue (US$ Mn) Market Share by Productin 2022
- Figure 23: North America Fermentation Chemicals Market Market Attractiveness Analysis by Product, 2016-2032
- Figure 24: North America Fermentation Chemicals Market Revenue (US$ Mn) Market Share by Applicationin 2022
- Figure 25: North America Fermentation Chemicals Market Market Attractiveness Analysis by Application, 2016-2032
- Figure 26: North America Fermentation Chemicals Market Revenue (US$ Mn) Market Share by Formin 2022
- Figure 27: North America Fermentation Chemicals Market Market Attractiveness Analysis by Form, 2016-2032
- Figure 28: North America Fermentation Chemicals Market Revenue (US$ Mn) Market Share by Country in 2022
- Figure 29: North America Fermentation Chemicals Market Market Attractiveness Analysis by Country, 2016-2032
- Figure 30: North America Fermentation Chemicals Market Market Revenue (US$ Mn) (2016-2032)
- Figure 31: North America Fermentation Chemicals Market Market Revenue (US$ Mn) Comparison by Country (2016-2032)
- Figure 32: North America Fermentation Chemicals Market Market Revenue (US$ Mn) Comparison by Product (2016-2032)
- Figure 33: North America Fermentation Chemicals Market Market Revenue (US$ Mn) Comparison by Application (2016-2032)
- Figure 34: North America Fermentation Chemicals Market Market Revenue (US$ Mn) Comparison by Form (2016-2032)
- Figure 35: North America Fermentation Chemicals Market Market Y-o-Y Growth Rate Comparison by Country (2016-2032)
- Figure 36: North America Fermentation Chemicals Market Market Y-o-Y Growth Rate Comparison by Product (2016-2032)
- Figure 37: North America Fermentation Chemicals Market Market Y-o-Y Growth Rate Comparison by Application (2016-2032)
- Figure 38: North America Fermentation Chemicals Market Market Y-o-Y Growth Rate Comparison by Form (2016-2032)
- Figure 39: North America Fermentation Chemicals Market Market Share Comparison by Country (2016-2032)
- Figure 40: North America Fermentation Chemicals Market Market Share Comparison by Product (2016-2032)
- Figure 41: North America Fermentation Chemicals Market Market Share Comparison by Application (2016-2032)
- Figure 42: North America Fermentation Chemicals Market Market Share Comparison by Form (2016-2032)
- Figure 43: Western Europe Fermentation Chemicals Market Revenue (US$ Mn) Market Share by Productin 2022
- Figure 44: Western Europe Fermentation Chemicals Market Market Attractiveness Analysis by Product, 2016-2032
- Figure 45: Western Europe Fermentation Chemicals Market Revenue (US$ Mn) Market Share by Applicationin 2022
- Figure 46: Western Europe Fermentation Chemicals Market Market Attractiveness Analysis by Application, 2016-2032
- Figure 47: Western Europe Fermentation Chemicals Market Revenue (US$ Mn) Market Share by Formin 2022
- Figure 48: Western Europe Fermentation Chemicals Market Market Attractiveness Analysis by Form, 2016-2032
- Figure 49: Western Europe Fermentation Chemicals Market Revenue (US$ Mn) Market Share by Country in 2022
- Figure 50: Western Europe Fermentation Chemicals Market Market Attractiveness Analysis by Country, 2016-2032
- Figure 51: Western Europe Fermentation Chemicals Market Market Revenue (US$ Mn) (2016-2032)
- Figure 52: Western Europe Fermentation Chemicals Market Market Revenue (US$ Mn) Comparison by Country (2016-2032)
- Figure 53: Western Europe Fermentation Chemicals Market Market Revenue (US$ Mn) Comparison by Product (2016-2032)
- Figure 54: Western Europe Fermentation Chemicals Market Market Revenue (US$ Mn) Comparison by Application (2016-2032)
- Figure 55: Western Europe Fermentation Chemicals Market Market Revenue (US$ Mn) Comparison by Form (2016-2032)
- Figure 56: Western Europe Fermentation Chemicals Market Market Y-o-Y Growth Rate Comparison by Country (2016-2032)
- Figure 57: Western Europe Fermentation Chemicals Market Market Y-o-Y Growth Rate Comparison by Product (2016-2032)
- Figure 58: Western Europe Fermentation Chemicals Market Market Y-o-Y Growth Rate Comparison by Application (2016-2032)
- Figure 59: Western Europe Fermentation Chemicals Market Market Y-o-Y Growth Rate Comparison by Form (2016-2032)
- Figure 60: Western Europe Fermentation Chemicals Market Market Share Comparison by Country (2016-2032)
- Figure 61: Western Europe Fermentation Chemicals Market Market Share Comparison by Product (2016-2032)
- Figure 62: Western Europe Fermentation Chemicals Market Market Share Comparison by Application (2016-2032)
- Figure 63: Western Europe Fermentation Chemicals Market Market Share Comparison by Form (2016-2032)
- Figure 64: Eastern Europe Fermentation Chemicals Market Revenue (US$ Mn) Market Share by Productin 2022
- Figure 65: Eastern Europe Fermentation Chemicals Market Market Attractiveness Analysis by Product, 2016-2032
- Figure 66: Eastern Europe Fermentation Chemicals Market Revenue (US$ Mn) Market Share by Applicationin 2022
- Figure 67: Eastern Europe Fermentation Chemicals Market Market Attractiveness Analysis by Application, 2016-2032
- Figure 68: Eastern Europe Fermentation Chemicals Market Revenue (US$ Mn) Market Share by Formin 2022
- Figure 69: Eastern Europe Fermentation Chemicals Market Market Attractiveness Analysis by Form, 2016-2032
- Figure 70: Eastern Europe Fermentation Chemicals Market Revenue (US$ Mn) Market Share by Country in 2022
- Figure 71: Eastern Europe Fermentation Chemicals Market Market Attractiveness Analysis by Country, 2016-2032
- Figure 72: Eastern Europe Fermentation Chemicals Market Market Revenue (US$ Mn) (2016-2032)
- Figure 73: Eastern Europe Fermentation Chemicals Market Market Revenue (US$ Mn) Comparison by Country (2016-2032)
- Figure 74: Eastern Europe Fermentation Chemicals Market Market Revenue (US$ Mn) Comparison by Product (2016-2032)
- Figure 75: Eastern Europe Fermentation Chemicals Market Market Revenue (US$ Mn) Comparison by Application (2016-2032)
- Figure 76: Eastern Europe Fermentation Chemicals Market Market Revenue (US$ Mn) Comparison by Form (2016-2032)
- Figure 77: Eastern Europe Fermentation Chemicals Market Market Y-o-Y Growth Rate Comparison by Country (2016-2032)
- Figure 78: Eastern Europe Fermentation Chemicals Market Market Y-o-Y Growth Rate Comparison by Product (2016-2032)
- Figure 79: Eastern Europe Fermentation Chemicals Market Market Y-o-Y Growth Rate Comparison by Application (2016-2032)
- Figure 80: Eastern Europe Fermentation Chemicals Market Market Y-o-Y Growth Rate Comparison by Form (2016-2032)
- Figure 81: Eastern Europe Fermentation Chemicals Market Market Share Comparison by Country (2016-2032)
- Figure 82: Eastern Europe Fermentation Chemicals Market Market Share Comparison by Product (2016-2032)
- Figure 83: Eastern Europe Fermentation Chemicals Market Market Share Comparison by Application (2016-2032)
- Figure 84: Eastern Europe Fermentation Chemicals Market Market Share Comparison by Form (2016-2032)
- Figure 85: APAC Fermentation Chemicals Market Revenue (US$ Mn) Market Share by Productin 2022
- Figure 86: APAC Fermentation Chemicals Market Market Attractiveness Analysis by Product, 2016-2032
- Figure 87: APAC Fermentation Chemicals Market Revenue (US$ Mn) Market Share by Applicationin 2022
- Figure 88: APAC Fermentation Chemicals Market Market Attractiveness Analysis by Application, 2016-2032
- Figure 89: APAC Fermentation Chemicals Market Revenue (US$ Mn) Market Share by Formin 2022
- Figure 90: APAC Fermentation Chemicals Market Market Attractiveness Analysis by Form, 2016-2032
- Figure 91: APAC Fermentation Chemicals Market Revenue (US$ Mn) Market Share by Country in 2022
- Figure 92: APAC Fermentation Chemicals Market Market Attractiveness Analysis by Country, 2016-2032
- Figure 93: APAC Fermentation Chemicals Market Market Revenue (US$ Mn) (2016-2032)
- Figure 94: APAC Fermentation Chemicals Market Market Revenue (US$ Mn) Comparison by Country (2016-2032)
- Figure 95: APAC Fermentation Chemicals Market Market Revenue (US$ Mn) Comparison by Product (2016-2032)
- Figure 96: APAC Fermentation Chemicals Market Market Revenue (US$ Mn) Comparison by Application (2016-2032)
- Figure 97: APAC Fermentation Chemicals Market Market Revenue (US$ Mn) Comparison by Form (2016-2032)
- Figure 98: APAC Fermentation Chemicals Market Market Y-o-Y Growth Rate Comparison by Country (2016-2032)
- Figure 99: APAC Fermentation Chemicals Market Market Y-o-Y Growth Rate Comparison by Product (2016-2032)
- Figure 100: APAC Fermentation Chemicals Market Market Y-o-Y Growth Rate Comparison by Application (2016-2032)
- Figure 101: APAC Fermentation Chemicals Market Market Y-o-Y Growth Rate Comparison by Form (2016-2032)
- Figure 102: APAC Fermentation Chemicals Market Market Share Comparison by Country (2016-2032)
- Figure 103: APAC Fermentation Chemicals Market Market Share Comparison by Product (2016-2032)
- Figure 104: APAC Fermentation Chemicals Market Market Share Comparison by Application (2016-2032)
- Figure 105: APAC Fermentation Chemicals Market Market Share Comparison by Form (2016-2032)
- Figure 106: Latin America Fermentation Chemicals Market Revenue (US$ Mn) Market Share by Productin 2022
- Figure 107: Latin America Fermentation Chemicals Market Market Attractiveness Analysis by Product, 2016-2032
- Figure 108: Latin America Fermentation Chemicals Market Revenue (US$ Mn) Market Share by Applicationin 2022
- Figure 109: Latin America Fermentation Chemicals Market Market Attractiveness Analysis by Application, 2016-2032
- Figure 110: Latin America Fermentation Chemicals Market Revenue (US$ Mn) Market Share by Formin 2022
- Figure 111: Latin America Fermentation Chemicals Market Market Attractiveness Analysis by Form, 2016-2032
- Figure 112: Latin America Fermentation Chemicals Market Revenue (US$ Mn) Market Share by Country in 2022
- Figure 113: Latin America Fermentation Chemicals Market Market Attractiveness Analysis by Country, 2016-2032
- Figure 114: Latin America Fermentation Chemicals Market Market Revenue (US$ Mn) (2016-2032)
- Figure 115: Latin America Fermentation Chemicals Market Market Revenue (US$ Mn) Comparison by Country (2016-2032)
- Figure 116: Latin America Fermentation Chemicals Market Market Revenue (US$ Mn) Comparison by Product (2016-2032)
- Figure 117: Latin America Fermentation Chemicals Market Market Revenue (US$ Mn) Comparison by Application (2016-2032)
- Figure 118: Latin America Fermentation Chemicals Market Market Revenue (US$ Mn) Comparison by Form (2016-2032)
- Figure 119: Latin America Fermentation Chemicals Market Market Y-o-Y Growth Rate Comparison by Country (2016-2032)
- Figure 120: Latin America Fermentation Chemicals Market Market Y-o-Y Growth Rate Comparison by Product (2016-2032)
- Figure 121: Latin America Fermentation Chemicals Market Market Y-o-Y Growth Rate Comparison by Application (2016-2032)
- Figure 122: Latin America Fermentation Chemicals Market Market Y-o-Y Growth Rate Comparison by Form (2016-2032)
- Figure 123: Latin America Fermentation Chemicals Market Market Share Comparison by Country (2016-2032)
- Figure 124: Latin America Fermentation Chemicals Market Market Share Comparison by Product (2016-2032)
- Figure 125: Latin America Fermentation Chemicals Market Market Share Comparison by Application (2016-2032)
- Figure 126: Latin America Fermentation Chemicals Market Market Share Comparison by Form (2016-2032)
- Figure 127: Middle East & Africa Fermentation Chemicals Market Revenue (US$ Mn) Market Share by Productin 2022
- Figure 128: Middle East & Africa Fermentation Chemicals Market Market Attractiveness Analysis by Product, 2016-2032
- Figure 129: Middle East & Africa Fermentation Chemicals Market Revenue (US$ Mn) Market Share by Applicationin 2022
- Figure 130: Middle East & Africa Fermentation Chemicals Market Market Attractiveness Analysis by Application, 2016-2032
- Figure 131: Middle East & Africa Fermentation Chemicals Market Revenue (US$ Mn) Market Share by Formin 2022
- Figure 132: Middle East & Africa Fermentation Chemicals Market Market Attractiveness Analysis by Form, 2016-2032
- Figure 133: Middle East & Africa Fermentation Chemicals Market Revenue (US$ Mn) Market Share by Country in 2022
- Figure 134: Middle East & Africa Fermentation Chemicals Market Market Attractiveness Analysis by Country, 2016-2032
- Figure 135: Middle East & Africa Fermentation Chemicals Market Market Revenue (US$ Mn) (2016-2032)
- Figure 136: Middle East & Africa Fermentation Chemicals Market Market Revenue (US$ Mn) Comparison by Country (2016-2032)
- Figure 137: Middle East & Africa Fermentation Chemicals Market Market Revenue (US$ Mn) Comparison by Product (2016-2032)
- Figure 138: Middle East & Africa Fermentation Chemicals Market Market Revenue (US$ Mn) Comparison by Application (2016-2032)
- Figure 139: Middle East & Africa Fermentation Chemicals Market Market Revenue (US$ Mn) Comparison by Form (2016-2032)
- Figure 140: Middle East & Africa Fermentation Chemicals Market Market Y-o-Y Growth Rate Comparison by Country (2016-2032)
- Figure 141: Middle East & Africa Fermentation Chemicals Market Market Y-o-Y Growth Rate Comparison by Product (2016-2032)
- Figure 142: Middle East & Africa Fermentation Chemicals Market Market Y-o-Y Growth Rate Comparison by Application (2016-2032)
- Figure 143: Middle East & Africa Fermentation Chemicals Market Market Y-o-Y Growth Rate Comparison by Form (2016-2032)
- Figure 144: Middle East & Africa Fermentation Chemicals Market Market Share Comparison by Country (2016-2032)
- Figure 145: Middle East & Africa Fermentation Chemicals Market Market Share Comparison by Product (2016-2032)
- Figure 146: Middle East & Africa Fermentation Chemicals Market Market Share Comparison by Application (2016-2032)
- Figure 147: Middle East & Africa Fermentation Chemicals Market Market Share Comparison by Form (2016-2032)
"
- List of Tables
- "
- Table 1: Global Fermentation Chemicals Market Market Comparison by Product (2016-2032)
- Table 2: Global Fermentation Chemicals Market Market Comparison by Application (2016-2032)
- Table 3: Global Fermentation Chemicals Market Market Comparison by Form (2016-2032)
- Table 4: Global Fermentation Chemicals Market Revenue (US$ Mn) Comparison by Region (2016-2032)
- Table 5: Global Fermentation Chemicals Market Market Revenue (US$ Mn) (2016-2032)
- Table 6: Global Fermentation Chemicals Market Market Revenue (US$ Mn) Comparison by Region (2016-2032)
- Table 7: Global Fermentation Chemicals Market Market Revenue (US$ Mn) Comparison by Product (2016-2032)
- Table 8: Global Fermentation Chemicals Market Market Revenue (US$ Mn) Comparison by Application (2016-2032)
- Table 9: Global Fermentation Chemicals Market Market Revenue (US$ Mn) Comparison by Form (2016-2032)
- Table 10: Global Fermentation Chemicals Market Market Y-o-Y Growth Rate Comparison by Region (2016-2032)
- Table 11: Global Fermentation Chemicals Market Market Y-o-Y Growth Rate Comparison by Product (2016-2032)
- Table 12: Global Fermentation Chemicals Market Market Y-o-Y Growth Rate Comparison by Application (2016-2032)
- Table 13: Global Fermentation Chemicals Market Market Y-o-Y Growth Rate Comparison by Form (2016-2032)
- Table 14: Global Fermentation Chemicals Market Market Share Comparison by Region (2016-2032)
- Table 15: Global Fermentation Chemicals Market Market Share Comparison by Product (2016-2032)
- Table 16: Global Fermentation Chemicals Market Market Share Comparison by Application (2016-2032)
- Table 17: Global Fermentation Chemicals Market Market Share Comparison by Form (2016-2032)
- Table 18: North America Fermentation Chemicals Market Market Comparison by Application (2016-2032)
- Table 19: North America Fermentation Chemicals Market Market Comparison by Form (2016-2032)
- Table 20: North America Fermentation Chemicals Market Revenue (US$ Mn) Comparison by Country (2016-2032)
- Table 21: North America Fermentation Chemicals Market Market Revenue (US$ Mn) (2016-2032)
- Table 22: North America Fermentation Chemicals Market Market Revenue (US$ Mn) Comparison by Country (2016-2032)
- Table 23: North America Fermentation Chemicals Market Market Revenue (US$ Mn) Comparison by Product (2016-2032)
- Table 24: North America Fermentation Chemicals Market Market Revenue (US$ Mn) Comparison by Application (2016-2032)
- Table 25: North America Fermentation Chemicals Market Market Revenue (US$ Mn) Comparison by Form (2016-2032)
- Table 26: North America Fermentation Chemicals Market Market Y-o-Y Growth Rate Comparison by Country (2016-2032)
- Table 27: North America Fermentation Chemicals Market Market Y-o-Y Growth Rate Comparison by Product (2016-2032)
- Table 28: North America Fermentation Chemicals Market Market Y-o-Y Growth Rate Comparison by Application (2016-2032)
- Table 29: North America Fermentation Chemicals Market Market Y-o-Y Growth Rate Comparison by Form (2016-2032)
- Table 30: North America Fermentation Chemicals Market Market Share Comparison by Country (2016-2032)
- Table 31: North America Fermentation Chemicals Market Market Share Comparison by Product (2016-2032)
- Table 32: North America Fermentation Chemicals Market Market Share Comparison by Application (2016-2032)
- Table 33: North America Fermentation Chemicals Market Market Share Comparison by Form (2016-2032)
- Table 34: Western Europe Fermentation Chemicals Market Market Comparison by Product (2016-2032)
- Table 35: Western Europe Fermentation Chemicals Market Market Comparison by Application (2016-2032)
- Table 36: Western Europe Fermentation Chemicals Market Market Comparison by Form (2016-2032)
- Table 37: Western Europe Fermentation Chemicals Market Revenue (US$ Mn) Comparison by Country (2016-2032)
- Table 38: Western Europe Fermentation Chemicals Market Market Revenue (US$ Mn) (2016-2032)
- Table 39: Western Europe Fermentation Chemicals Market Market Revenue (US$ Mn) Comparison by Country (2016-2032)
- Table 40: Western Europe Fermentation Chemicals Market Market Revenue (US$ Mn) Comparison by Product (2016-2032)
- Table 41: Western Europe Fermentation Chemicals Market Market Revenue (US$ Mn) Comparison by Application (2016-2032)
- Table 42: Western Europe Fermentation Chemicals Market Market Revenue (US$ Mn) Comparison by Form (2016-2032)
- Table 43: Western Europe Fermentation Chemicals Market Market Y-o-Y Growth Rate Comparison by Country (2016-2032)
- Table 44: Western Europe Fermentation Chemicals Market Market Y-o-Y Growth Rate Comparison by Product (2016-2032)
- Table 45: Western Europe Fermentation Chemicals Market Market Y-o-Y Growth Rate Comparison by Application (2016-2032)
- Table 46: Western Europe Fermentation Chemicals Market Market Y-o-Y Growth Rate Comparison by Form (2016-2032)
- Table 47: Western Europe Fermentation Chemicals Market Market Share Comparison by Country (2016-2032)
- Table 48: Western Europe Fermentation Chemicals Market Market Share Comparison by Product (2016-2032)
- Table 49: Western Europe Fermentation Chemicals Market Market Share Comparison by Application (2016-2032)
- Table 50: Western Europe Fermentation Chemicals Market Market Share Comparison by Form (2016-2032)
- Table 51: Eastern Europe Fermentation Chemicals Market Market Comparison by Product (2016-2032)
- Table 52: Eastern Europe Fermentation Chemicals Market Market Comparison by Application (2016-2032)
- Table 53: Eastern Europe Fermentation Chemicals Market Market Comparison by Form (2016-2032)
- Table 54: Eastern Europe Fermentation Chemicals Market Revenue (US$ Mn) Comparison by Country (2016-2032)
- Table 55: Eastern Europe Fermentation Chemicals Market Market Revenue (US$ Mn) (2016-2032)
- Table 56: Eastern Europe Fermentation Chemicals Market Market Revenue (US$ Mn) Comparison by Country (2016-2032)
- Table 57: Eastern Europe Fermentation Chemicals Market Market Revenue (US$ Mn) Comparison by Product (2016-2032)
- Table 58: Eastern Europe Fermentation Chemicals Market Market Revenue (US$ Mn) Comparison by Application (2016-2032)
- Table 59: Eastern Europe Fermentation Chemicals Market Market Revenue (US$ Mn) Comparison by Form (2016-2032)
- Table 60: Eastern Europe Fermentation Chemicals Market Market Y-o-Y Growth Rate Comparison by Country (2016-2032)
- Table 61: Eastern Europe Fermentation Chemicals Market Market Y-o-Y Growth Rate Comparison by Product (2016-2032)
- Table 62: Eastern Europe Fermentation Chemicals Market Market Y-o-Y Growth Rate Comparison by Application (2016-2032)
- Table 63: Eastern Europe Fermentation Chemicals Market Market Y-o-Y Growth Rate Comparison by Form (2016-2032)
- Table 64: Eastern Europe Fermentation Chemicals Market Market Share Comparison by Country (2016-2032)
- Table 65: Eastern Europe Fermentation Chemicals Market Market Share Comparison by Product (2016-2032)
- Table 66: Eastern Europe Fermentation Chemicals Market Market Share Comparison by Application (2016-2032)
- Table 67: Eastern Europe Fermentation Chemicals Market Market Share Comparison by Form (2016-2032)
- Table 68: APAC Fermentation Chemicals Market Market Comparison by Product (2016-2032)
- Table 69: APAC Fermentation Chemicals Market Market Comparison by Application (2016-2032)
- Table 70: APAC Fermentation Chemicals Market Market Comparison by Form (2016-2032)
- Table 71: APAC Fermentation Chemicals Market Revenue (US$ Mn) Comparison by Country (2016-2032)
- Table 72: APAC Fermentation Chemicals Market Market Revenue (US$ Mn) (2016-2032)
- Table 73: APAC Fermentation Chemicals Market Market Revenue (US$ Mn) Comparison by Country (2016-2032)
- Table 74: APAC Fermentation Chemicals Market Market Revenue (US$ Mn) Comparison by Product (2016-2032)
- Table 75: APAC Fermentation Chemicals Market Market Revenue (US$ Mn) Comparison by Application (2016-2032)
- Table 76: APAC Fermentation Chemicals Market Market Revenue (US$ Mn) Comparison by Form (2016-2032)
- Table 77: APAC Fermentation Chemicals Market Market Y-o-Y Growth Rate Comparison by Country (2016-2032)
- Table 78: APAC Fermentation Chemicals Market Market Y-o-Y Growth Rate Comparison by Product (2016-2032)
- Table 79: APAC Fermentation Chemicals Market Market Y-o-Y Growth Rate Comparison by Application (2016-2032)
- Table 80: APAC Fermentation Chemicals Market Market Y-o-Y Growth Rate Comparison by Form (2016-2032)
- Table 81: APAC Fermentation Chemicals Market Market Share Comparison by Country (2016-2032)
- Table 82: APAC Fermentation Chemicals Market Market Share Comparison by Product (2016-2032)
- Table 83: APAC Fermentation Chemicals Market Market Share Comparison by Application (2016-2032)
- Table 84: APAC Fermentation Chemicals Market Market Share Comparison by Form (2016-2032)
- Table 85: Latin America Fermentation Chemicals Market Market Comparison by Product (2016-2032)
- Table 86: Latin America Fermentation Chemicals Market Market Comparison by Application (2016-2032)
- Table 87: Latin America Fermentation Chemicals Market Market Comparison by Form (2016-2032)
- Table 88: Latin America Fermentation Chemicals Market Revenue (US$ Mn) Comparison by Country (2016-2032)
- Table 89: Latin America Fermentation Chemicals Market Market Revenue (US$ Mn) (2016-2032)
- Table 90: Latin America Fermentation Chemicals Market Market Revenue (US$ Mn) Comparison by Country (2016-2032)
- Table 91: Latin America Fermentation Chemicals Market Market Revenue (US$ Mn) Comparison by Product (2016-2032)
- Table 92: Latin America Fermentation Chemicals Market Market Revenue (US$ Mn) Comparison by Application (2016-2032)
- Table 93: Latin America Fermentation Chemicals Market Market Revenue (US$ Mn) Comparison by Form (2016-2032)
- Table 94: Latin America Fermentation Chemicals Market Market Y-o-Y Growth Rate Comparison by Country (2016-2032)
- Table 95: Latin America Fermentation Chemicals Market Market Y-o-Y Growth Rate Comparison by Product (2016-2032)
- Table 96: Latin America Fermentation Chemicals Market Market Y-o-Y Growth Rate Comparison by Application (2016-2032)
- Table 97: Latin America Fermentation Chemicals Market Market Y-o-Y Growth Rate Comparison by Form (2016-2032)
- Table 98: Latin America Fermentation Chemicals Market Market Share Comparison by Country (2016-2032)
- Table 99: Latin America Fermentation Chemicals Market Market Share Comparison by Product (2016-2032)
- Table 100: Latin America Fermentation Chemicals Market Market Share Comparison by Application (2016-2032)
- Table 101: Latin America Fermentation Chemicals Market Market Share Comparison by Form (2016-2032)
- Table 102: Middle East & Africa Fermentation Chemicals Market Market Comparison by Product (2016-2032)
- Table 103: Middle East & Africa Fermentation Chemicals Market Market Comparison by Application (2016-2032)
- Table 104: Middle East & Africa Fermentation Chemicals Market Market Comparison by Form (2016-2032)
- Table 105: Middle East & Africa Fermentation Chemicals Market Revenue (US$ Mn) Comparison by Country (2016-2032)
- Table 106: Middle East & Africa Fermentation Chemicals Market Market Revenue (US$ Mn) (2016-2032)
- Table 107: Middle East & Africa Fermentation Chemicals Market Market Revenue (US$ Mn) Comparison by Country (2016-2032)
- Table 108: Middle East & Africa Fermentation Chemicals Market Market Revenue (US$ Mn) Comparison by Product (2016-2032)
- Table 109: Middle East & Africa Fermentation Chemicals Market Market Revenue (US$ Mn) Comparison by Application (2016-2032)
- Table 110: Middle East & Africa Fermentation Chemicals Market Market Revenue (US$ Mn) Comparison by Form (2016-2032)
- Table 111: Middle East & Africa Fermentation Chemicals Market Market Y-o-Y Growth Rate Comparison by Country (2016-2032)
- Table 112: Middle East & Africa Fermentation Chemicals Market Market Y-o-Y Growth Rate Comparison by Product (2016-2032)
- Table 113: Middle East & Africa Fermentation Chemicals Market Market Y-o-Y Growth Rate Comparison by Application (2016-2032)
- Table 114: Middle East & Africa Fermentation Chemicals Market Market Y-o-Y Growth Rate Comparison by Form (2016-2032)
- Table 115: Middle East & Africa Fermentation Chemicals Market Market Share Comparison by Country (2016-2032)
- Table 116: Middle East & Africa Fermentation Chemicals Market Market Share Comparison by Product (2016-2032)
- Table 117: Middle East & Africa Fermentation Chemicals Market Market Share Comparison by Application (2016-2032)
- Table 118: Middle East & Africa Fermentation Chemicals Market Market Share Comparison by Form (2016-2032)
- 1. Executive Summary
-
- BASF SE
- Novozymes A/S
- Dow Chemical Company
- Evonik Industries AG
- Ajinomoto Co. Inc.
- Archer Daniels Midland Company
- Cargill Incorporated
- Hansen Holding A/S
- DuPont de Nemours Inc.
- Lonza Group AG
- DSM
- AB Enzymes GmbH
- BioAmber Inc.
- Lallemand Inc.
- Kyowa Hakko Bio Co. Ltd.
- Novamont S.p.A.
- Tereos SA
- Sumitomo Chemical Co. Ltd.
- Tate & Lyle PLC
- Amano Enzyme Inc.
- Others
Our Clients


View Our Licence Options
