
Femtech Market Report By Application Type (Reproductive Health, Fertility Tracking and Optimization, Sexual Wellness, Pregnancy and Postpartum Care, Pelvic Health Solutions), By Technological Focus (Wearable Devices, Mobile Applications, Telemedicine and Telehealth), By Service, By End User, By Region and Companies - Industry Segment Outlook, Market Assessment, Competition Scenario, Trends and Forecast 2024-2033
-
43442
-
Feb 2024
-
134
-


-
This report was compiled by Correspondence Linkedin | Detailed Market research Methodology Our methodology involves a mix of primary research, including interviews with leading mental health experts, and secondary research from reputable medical journals and databases. View Detailed Methodology Page
-
Quick Navigation
Report Overview
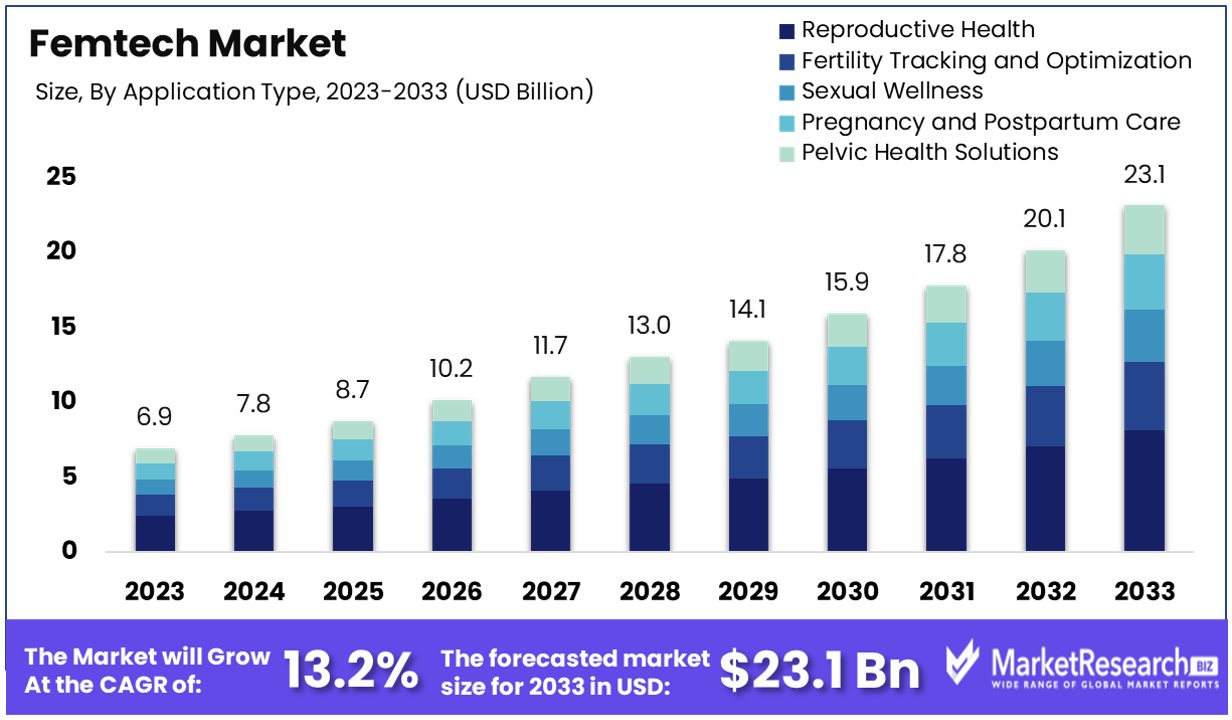
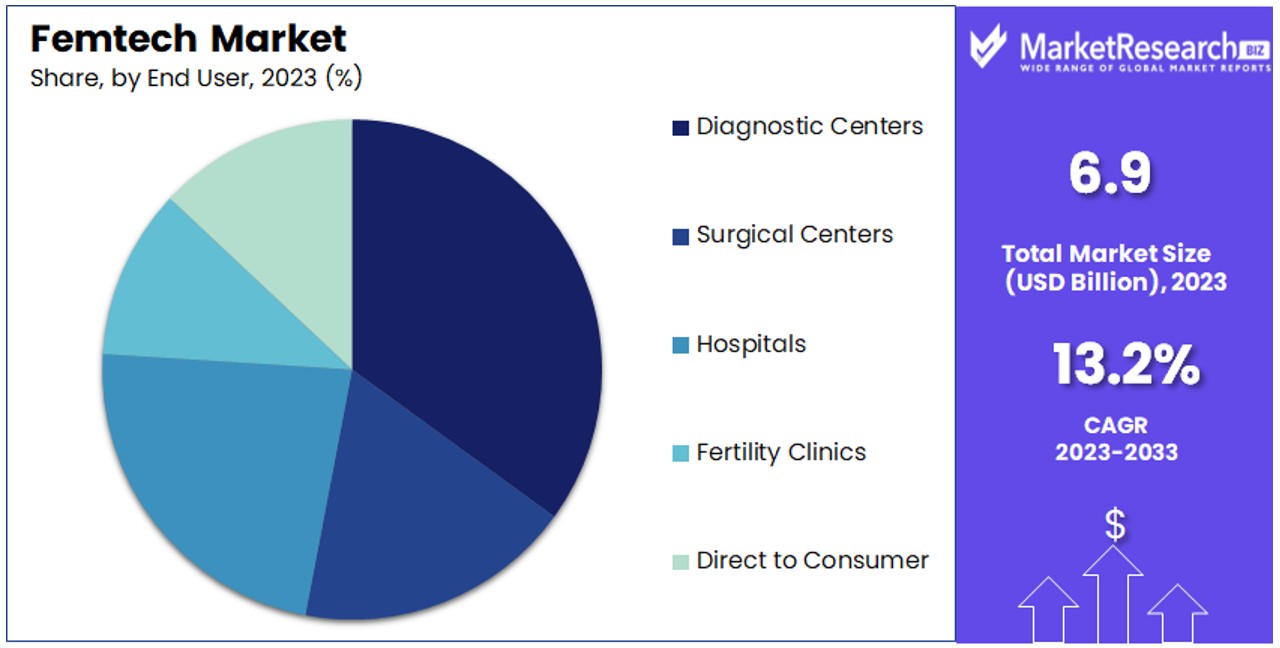
The Global Femtech Market size is expected to be worth around USD 23.1 Billion by 2033, from USD 6.9 Billion in 2023, growing at a CAGR of 13.20% during the forecast period from 2024 to 2033.
The Femtech Market refers to the burgeoning sector focused on women's health technologies and services. This market encompasses a wide range of products and solutions designed to address various aspects of female health, including reproductive health, menstrual cycle tracking, fertility solutions, pregnancy and nursing care, women's sexual wellness, and menopause.
With the advancement of technology, the Femtech industry has seen significant growth, driven by increasing awareness and demand for personalized healthcare solutions.
In the context of the evolving healthcare landscape, the Femtech Market emerges as a pivotal domain with substantial growth potential. This is underscored by a unique convergence of digital health technologies and healthcare needs specific to women.
Reports highlight a notable trend: women are 75% more likely than men to utilize digital healthcare tools, underscoring the significant demand and receptiveness within this demographic towards innovative health solutions. This inclination towards digital platforms positions the Femtech sector as a promising avenue for development and investment.
Moreover, an examination of health trends reveals a nuanced picture. The Centers for Disease Control and Prevention (CDC) reports a decline in women's mortality rates from critical diseases such as heart disease, lung cancer, and breast cancer, pointing towards advancements in healthcare interventions and awareness. Conversely, the increasing incidence of chlamydia and diabetes among women signals emerging health challenges that necessitate focused attention and innovation within the Femtech space.
Additionally, the CDC's findings that approximately 15.2% of women aged 18 and older report fair or poor health, coupled with high obesity (42.1%) and hypertension (45.7%) rates, further accentuates the imperative for targeted health solutions. The fertility domain also underscores the need for specialized focus, with about 10% of women aged 15–44 facing challenges in conceiving or sustaining pregnancy.
These data points collectively underscore the Femtech Market's strategic importance. They highlight not only the market's capacity for addressing specific health concerns through technology-driven solutions but also its role in enhancing overall healthcare accessibility and effectiveness for women.
Key Takeaways
- Market Growth: The Global Femtech Market is projected to reach USD 23.1 Billion by 2033, growing at a CAGR of 13.20% from USD 6.9 Billion in 2023.
- Application Focus: Reproductive Health dominates, alongside segments like Fertility Tracking, Sexual Wellness, Pregnancy Care, and Pelvic Health.
- Technology: Wearable Devices lead, followed by Mobile Apps and Telemedicine solutions.
- Services: Diagnostics are primary, with Monitoring and Therapeutic services also significant.
- End Users: Diagnostic Centers hold major share, followed by Surgical Centers, Hospitals, Fertility Clinics, and Direct-to-Consumer platforms.
- Regional Dynamics:
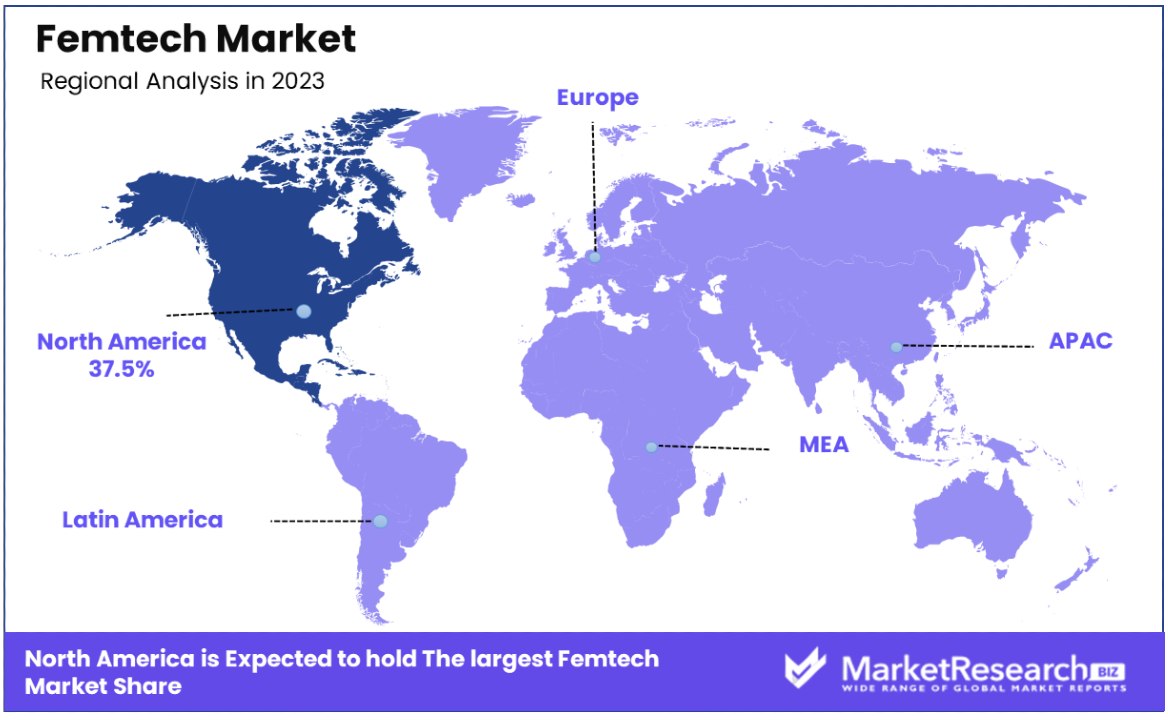
- North America: Commands 37.5% market share, driven by robust healthcare infrastructure and early tech adoption.
- Europe: Benefits from widespread healthcare access and government support.
- Asia Pacific: Emerges as the fastest-growing region, driven by digitalization and rising health awareness.
- Key Players: Leading companies include Flo Health, Apple, Clue, Elvie, and Google, alongside emerging players like iSono Health and Natural Cycles. Diverse offerings from apparel and lifestyle brands indicate a thriving market ecosystem.
Driving Factors
Rising Awareness and Demand Drives Market Growth
The increasing vocalization of women regarding health issues uniquely affecting them, such as menstrual health, fertility, and pregnancy care, serves as a primary catalyst for the Femtech Market's growth. This rising awareness and demand have paved the way for innovative products tailored to women's health needs.
Digital platforms and apps like Flo, which offer menstrual cycle tracking, exemplify how technology meets this demand by providing accessible and personalized health insights. This trend reflects a broader shift towards patient-centered healthcare, emphasizing the importance of understanding and addressing the specific health concerns of women.
Advancements in Wearables and Apps Fuel Innovation
The Femtech market is witnessing a surge in digital health technologies, particularly in the development of wearables and apps. The introduction of smart bras, smart tampons, and menstrual cups with Bluetooth connectivity represents a leap forward in personal health monitoring.
Moreover, the use of AI and data analytics in apps offers personalized insights, enhancing the user experience and efficacy of health management tools. For example, the advent of a radiant wristband that monitors vital signs during pregnancy illustrates how these advancements are directly contributing to improved health outcomes.
Investments and Funding Signal High Growth Potential
The Femtech sector's growth trajectory is significantly bolstered by increasing investments and funding from both venture capitalists and large corporations like Amazon and Google. The sector's ability to attract substantial financial backing is indicative of its high growth potential.
For instance, the Essence App's successful funding round of $600,000 to enhance female employee performance through hormonal cycle scheduling demonstrates investor confidence in Femtech's innovative solutions and market viability. This influx of capital not only enables the development and scaling of groundbreaking technologies but also signifies the market's maturity and readiness for further expansion.
Restraining Factors
High Cost Restrains Market Growth
The elevated pricing of Femtech devices and services significantly hampers market expansion, particularly in low and middle-income countries. Premium products, such as the Elvie breast pump which retails for $500, illustrate the financial barrier to entry for a vast segment of the potential user base.
This high cost limits accessibility and adoption, as the price point is beyond the reach of many who could benefit from these innovations. The affordability issue not only reduces the potential market size but also exacerbates the digital divide in healthcare access, hindering the universal adoption of Femtech solutions.
Data Privacy and Security Concerns Limit Adoption
Femtech apps and devices, by their nature, collect and store sensitive health data, making data privacy and security paramount concerns. These apprehensions about the potential for data misuse and breaches are significant obstacles to user adoption.
Without stringent, transparent data policies and robust encryption measures, companies struggle to build trust with their user base. The anxiety surrounding data privacy and security not only deters potential users but also invites regulatory scrutiny, posing a complex challenge for Femtech companies aiming to innovate while ensuring user data remains secure and confidential.
Reproductive Health Analysis
The Femtech Market, with its diverse range of applications aimed at enhancing women's health, positions Reproductive Health as its dominant segment. This preeminence is not accidental but a reflection of the critical importance and broad scope that reproductive health holds within women's healthcare. Addressing everything from menstrual health to sexually transmitted infections, this segment has seen significant growth, driven by increased awareness, technological advancements, and the growing demand for personalized healthcare solutions.
Reproductive Health's dominance is further solidified by the advent of innovative products like smart menstrual cups and fertility tracking devices, which not only offer convenience but also empower women with valuable insights into their health. The rise of this segment is indicative of a broader shift towards more open discussions and proactive approaches to women's health issues.
Complementing the Reproductive Health segment are Fertility Tracking and Optimization, Sexual Wellness, Pregnancy and Postpartum Care, and Pelvic Health Solutions. Each plays a vital role in the Femtech ecosystem, addressing specific aspects of women's health and contributing to the market's growth. Fertility Tracking and Optimization, for instance, caters to the increasing number of women seeking to understand and improve their fertility through technology.
Sexual Wellness focuses on products and services that enhance sexual health and wellbeing, reflecting a growing market segment as societal attitudes evolve. Pregnancy and Postpartum Care offer support during critical life stages, utilizing technology to monitor and manage health, while Pelvic Health Solutions address health conditions like incontinence and pelvic floor disorders, areas previously underserved by traditional healthcare models.
Wearable Devices Analysis
In the realm of technological focus within the Femtech Market, Wearable Devices emerge as the leading segment, reflecting the increasing consumer preference for health and wellness solutions that integrate seamlessly into daily life. This trend towards wearables, including fitness trackers, smartwatches, and specialized health monitoring devices, highlights a shift in how women manage their health, favoring real-time data and personalized insights.
The popularity of wearable devices is buoyed by advancements in sensor technology, which have made it possible to monitor a wide array of health metrics more accurately and non-invasively than ever before. This segment's growth is a testament to the value placed on convenience, immediacy, and the empowerment of women through technology to take control of their health.
Supporting the dominant Wearable Devices segment are Mobile Applications and Telemedicine and Telehealth services. Mobile Applications offer a broad platform for health management, from fertility tracking to mental health support, and have become integral to the Femtech ecosystem. Their accessibility and the personalized nature of the services they provide have made them indispensable to women seeking to manage various aspects of their health.
Telemedicine and Telehealth, on the other hand, represent a rapidly expanding segment, particularly in light of global health events that have accelerated the adoption of remote healthcare services. These services break down geographical and logistical barriers to healthcare access, making professional consultation and care more accessible than ever.
Diagnostics Analysis
In the Femtech market, Diagnostics emerges as a critical service segment, underpinned by the increasing demand for early detection and management of women's health issues. This segment encompasses a wide array of technologies and services aimed at diagnosing conditions related to fertility, menstrual health, cancers specific to women, and other gynecological issues.
The emphasis on diagnostics is driven by a growing awareness among women about the importance of early detection and preventive care, coupled with advancements in medical technology that enable more precise and less invasive diagnostic procedures. The availability of at-home diagnostic kits, for instance, reflects a significant shift towards empowering women with tools for self-monitoring and management of their health, fostering a proactive approach to healthcare.
While Diagnostics leads in terms of demand and innovation, the Monitoring and Therapeutic services play complementary roles in the Femtech market. Monitoring services, which include wearable devices and mobile apps for tracking various health parameters, support continuous management of conditions and wellness.
On the other hand, Therapeutic services offer treatments and interventions for diagnosed conditions, including both digital therapies and physical devices designed to address specific health issues. These segments, together with Diagnostics, form a comprehensive ecosystem that addresses the spectrum of women's health needs, from prevention and detection to management and treatment, driving the overall growth of the Femtech market.
Diagnostic Centers Analysis
Diagnostic Centers stand out as the dominant end-user segment within the Femtech market, primarily due to their central role in the early detection and diagnosis of women's health issues. These centers are equipped with specialized technologies and expertise to offer a wide range of diagnostic services, from routine screenings to more complex diagnostic tests.
The reliance on Diagnostic Centers is attributed to their accessibility and the trust they engender among patients seeking accurate and timely health assessments. This segment's growth is further bolstered by partnerships between Femtech companies and diagnostic centers, aimed at integrating innovative diagnostic tools and technologies to enhance the quality and efficiency of healthcare services.
Surgical Centers, Hospitals, Fertility Clinics, and Direct-to-Consumer channels also contribute to the Femtech market's diversity and growth. Surgical Centers and Hospitals provide critical care and treatment for more severe conditions diagnosed through Femtech solutions, ensuring a continuum of care. Fertility Clinics represent a specialized segment addressing the growing demand for fertility and reproductive health services, utilizing Femtech products for monitoring and treatment.
The Direct-to-Consumer model, meanwhile, highlights the shift towards personalized and accessible healthcare solutions, allowing consumers to directly engage with Femtech products and services. Each of these end-user segments complements the Diagnostic Centers by offering integrated care solutions and expanding the reach and impact of Femtech innovations across the healthcare landscape.
Key Market Segments
By Application Type
- Reproductive Health
- Fertility Tracking and Optimization
- Sexual Wellness
- Pregnancy and Postpartum Care
- Pelvic Health Solutions
By Technological Focus
- Wearable Devices
- Mobile Applications
- Telemedicine and Telehealth
By Service
- Diagnostics
- Monitoring
- Therapeutic
By End User
- Diagnostic Centers
- Surgical Centers
- Hospitals
- Fertility Clinics
- Direct to Consumer
Growth Opportunities
Unmet Needs for Menstrual Health and Comfort Offers Growth Opportunity
The demand for innovative products that address menstrual health and comfort highlights a significant growth opportunity within the Femtech Market. Products such as smart tampons, menstrual cups, and pain relief wearables are gaining popularity for their role in providing comfort and convenience during menstruation.
The Flex disc, a notable example, underscores the market's readiness for solutions that offer an improved menstrual experience. This segment's expansion is propelled by an increasing consumer preference for products that not only meet basic needs but also enhance quality of life.
Fertility and Contraceptive Innovations Offer Market Expansion
The advancements in fertility and contraceptive technologies present a notable opportunity for growth in the Femtech sector. Innovations such as at-home hormone testing kits and ovulation prediction tools are becoming increasingly adopted, reflecting a shift towards more personalized and accessible fertility solutions.
Additionally, the development of contraceptive wearables, like silicon rings, introduces a new dimension to reproductive health management, blending convenience with effectiveness. These innovations respond to a broader trend of individuals seeking greater control over their reproductive health, supported by technology that offers precise, user-friendly solutions.
Trending Factors
Rise of Wearables and Connected Devices Are Trending Factors
The surge in popularity of wearables and connected devices within the Femtech Market is a testament to the sector's innovative approach to women's health.
Smart bras, menstrual pain relief devices, and other wearables equipped with sensors and app connectivity are not just trends but pivotal advancements that offer personalized and real-time health tracking. This category's growth is fueled by the consumer's increasing desire for health management tools that are not only effective but also seamless to integrate into daily life.
Telehealth and Virtual Care Are Trending Factors
The expansion of telehealth and virtual care services tailored to women's health needs is reshaping the Femtech landscape. Emerging platforms like e-clinics and applications, such as Tia, which offer virtual gynecology visits, are setting new standards for accessibility and convenience in healthcare.
This trend reflects a broader societal shift towards digital solutions in response to the demand for more flexible and accessible healthcare options. By enabling remote consultations and care, telehealth services are breaking down traditional barriers to healthcare access, such as geographical limitations and time constraints, thereby widening the Femtech market's reach.
Shift Towards At-Home and Self-Care Are Trending Factors
The Femtech industry is witnessing a significant trend towards at-home testing, diagnosis, and self-care, particularly for conditions like PCOS and endometriosis. This shift is driven by a growing preference for convenience, privacy, and control over one's health journey.
The ability to conduct health assessments and monitor conditions from the comfort of one's home represents a critical development in healthcare accessibility and patient empowerment. This trend not only caters to the immediate needs of individuals seeking to manage their health independently but also aligns with broader health and wellness trends prioritizing preventive care and personalized health management.
Regional Analysis
North America Dominates with 37.5% Market Share
North America's commanding 37.5% share of the Femtech Market is a reflection of the region's robust healthcare infrastructure, high consumer spending power, and the early adoption of digital health solutions. Factors such as significant investments in health tech startups, a strong focus on women's health research, and supportive regulatory policies have propelled the market's growth.
The region's market dynamics are characterized by a highly engaged user base, with a preference for innovative and personalized healthcare solutions. This dominance is expected to continue, driven by ongoing technological advancements and the increasing prevalence of chronic diseases among women, further cementing North America's leadership position in the global Femtech landscape.
Europe's Strategic Market Position
Europe holds a strategic position in the Femtech Market, driven by widespread healthcare access, increasing digital health adoption, and supportive government initiatives promoting women's health. The region's emphasis on data protection and privacy, combined with a strong network of healthcare providers and tech companies, fosters a conducive environment for Femtech growth.
Asia Pacific The Fastest Growing With 29% Share
Asia Pacific's remarkable market share of 29% in the Femtech Market is attributed to its vast population, increasing internet penetration, and rising awareness of women's health issues. The region benefits from a booming digital health sector, fueled by government initiatives aimed at improving healthcare accessibility and the adoption of mobile technologies.
Middle East & Africa's Emerging Presence
The Middle East & Africa region is emerging as a significant player in the Femtech Market, albeit from a smaller base. Factors driving growth include increasing government initiatives towards healthcare infrastructure, a rising middle class, and growing awareness of women's health issues.
Latin America's Growing Market Potential
Latin America's Femtech Market is witnessing growth, driven by increased digital connectivity, a growing focus on women's health, and the expansion of healthcare services. The region is experiencing a rise in health tech startups and a growing interest in digital health solutions among its population.
Key Regions and Countries
- North America
- The US
- Canada
- Mexico
- Western Europe
- Germany
- France
- The UK
- Spain
- Italy
- Portugal
- Ireland
- Austria
- Switzerland
- Benelux
- Nordic
- Rest of Western Europe
- Eastern Europe
- Russia
- Poland
- The Czech Republic
- Greece
- Rest of Eastern Europe
- APAC
- China
- Japan
- South Korea
- India
- Australia & New Zealand
- Indonesia
- Malaysia
- Philippines
- Singapore
- Thailand
- Vietnam
- Rest of APAC
- Latin America
- Brazil
- Colombia
- Chile
- Argentina
- Costa Rica
- Rest of Latin America
- Middle East & Africa
- Algeria
- Egypt
- Israel
- Kuwait
- Nigeria
- Saudi Arabia
- South Africa
- Turkey
- United Arab Emirates
- Rest of MEA
Key Players Analysis
In the dynamic landscape of the Femtech Market, key players such as Flo Health, Inc, Apple, Inc, Clue by Biowink GmbH, Elvie, Google, Inc, and others are driving significant advancements and market shifts. Companies like Flo Health and Clue specialize in menstrual and reproductive health, leveraging data analytics to offer personalized insights, while tech giants Apple and Google integrate women's health features into broader health ecosystems, emphasizing the market's integration into everyday technology.
Elvie and HeraMED focus on innovative devices for pregnancy and postpartum care, showcasing the market's diversity in addressing various stages of women's health. Emerging players like iSono Health, Natural Cycles USA Corp, and Withings contribute to the market with niche offerings in breast health monitoring, fertility tracking, and holistic health monitoring, respectively.
The inclusion of apparel and lifestyle brands such as OYA Femtech Apparel, alongside specialized services from Gaia Fertility Limited, Evvy, and Babyscripts, highlights the market's expansion beyond traditional healthcare products into lifestyle and continuous care models. The strategic positioning of these companies, from tech innovators to specialized healthcare solution providers, underscores the Femtech Market's multifaceted approach to addressing women's health, indicating a robust ecosystem ripe for continued growth and innovation.
Market Key Players
- Flo Health, Inc
- Apple, Inc
- Clue by Biowink GmbH
- Elvie
- Google, Inc
- HeraMED
- iSono Health
- Natural Cycles USA Corp
- Withings
- OYA Femtech Apparel
- Gaia Fertility Limited
- Evvy
- Babyscripts
Recent Developments
- Emagine Solutions Technology, a US-based healthtech startup focused on improving the U.S. maternal health system through remote patient monitoring, received a $1 million small business grant from the National Science Foundation (NSF)
- In Feb 2024, The Mindset app, known specifically for its Clementine service, has launched a "transformational" therapy program aimed at supporting women's mental wellbeing by combining cognitive behavioral therapy, positive psychology, neuro-linguistic programming (NLP), and hypnotherapy.
- The Menopause Hub, Ireland's first dedicated menopause clinic, is launching an app to assist in tracking and monitoring menopause symptoms to aid researchers in developing new treatments. The app, set to launch in March 2024, will provide information on hormonal changes during menopause
Report Scope
Report Features Description Market Value (2023) USD 6.9 Billion Forecast Revenue (2033) USD 23.1 Billion CAGR (2024-2033) 13.20% Base Year for Estimation 2023 Historic Period 2018-2023 Forecast Period 2024-2033 Report Coverage Revenue Forecast, Market Dynamics, Competitive Landscape, Recent Developments Segments Covered By Application Type (Reproductive Health, Fertility Tracking and Optimization, Sexual Wellness, Pregnancy and Postpartum Care, Pelvic Health Solutions), By Technological Focus (Wearable Devices, Mobile Applications, Telemedicine and Telehealth), By Service (Diagnostics, Monitoring, Therapeutic), By End User (Diagnostic Centers, Surgical Centers, Hospitals, Fertility Clinics, Direct to Consumer) Regional Analysis North America - The US, Canada, & Mexico; Western Europe - Germany, France, The UK, Spain, Italy, Portugal, Ireland, Austria, Switzerland, Benelux, Nordic, & Rest of Western Europe; Eastern Europe - Russia, Poland, The Czech Republic, Greece, & Rest of Eastern Europe; APAC - China, Japan, South Korea, India, Australia & New Zealand, Indonesia, Malaysia, Philippines, Singapore, Thailand, Vietnam, & Rest of APAC; Latin America - Brazil, Colombia, Chile, Argentina, Costa Rica, & Rest of Latin America; Middle East & Africa - Algeria, Egypt, Israel, Kuwait, Nigeria, Saudi Arabia, South Africa, Turkey, United Arab Emirates, & Rest of MEA Competitive Landscape Flo Health, Inc, Apple, Inc, Clue by Biowink GmbH, Elvie, Google, Inc, HeraMED, iSono Health, Natural Cycles USA Corp, Withings, OYA Femtech Apparel, Gaia Fertility Limited, Evvy, Babyscripts Customization Scope Customization for segments, region/country-level will be provided. Moreover, additional customization can be done based on the requirements. Purchase Options We have three licenses to opt for: Single User License, Multi-User License (Up to 5 Users), Corporate Use License (Unlimited User and Printable PDF) -
- 1. Executive Summary
- 1.1. Definition
- 1.2. Taxonomy
- 1.3. Research Scope
- 1.4. Key Analysis
- 1.5. Key Findings by Major Segments
- 1.6. Top strategies by Major Players
- 2. Global Femtech Market Overview
- 2.1. Femtech Market Dynamics
- 2.1.1. Drivers
- 2.1.2. Opportunities
- 2.1.3. Restraints
- 2.1.4. Challenges
- 2.2. Macro-economic Factors
- 2.3. Regulatory Framework
- 2.4. Market Investment Feasibility Index
- 2.5. PEST Analysis
- 2.6. PORTER’S Five Force Analysis
- 2.7. Drivers & Restraints Impact Analysis
- 2.8. Industry Chain Analysis
- 2.9. Cost Structure Analysis
- 2.10. Marketing Strategy
- 2.11. Russia-Ukraine War Impact Analysis
- 2.12. Opportunity Map Analysis
- 2.13. Market Competition Scenario Analysis
- 2.14. Product Life Cycle Analysis
- 2.15. Opportunity Orbits
- 2.16. Manufacturer Intensity Map
- 2.17. Major Companies sales by Value & Volume
- 2.1. Femtech Market Dynamics
- 3. Global Femtech Market Analysis, Opportunity and Forecast, 2016-2032
- 3.1. Global Femtech Market Analysis, 2016-2021
- 3.2. Global Femtech Market Opportunity and Forecast, 2023-2032
- 3.3. Global Femtech Market Analysis, Opportunity and Forecast, By By Application Type , 2016-2032
- 3.3.1. Global Femtech Market Analysis By Application Type : Introduction
- 3.3.2. Market Size Absolute $ Opportunity Analysis and Forecast, By By Application Type , 2016-2032
- 3.3.3. Reproductive Health
- 3.3.4. Fertility Tracking and Optimization
- 3.3.5. Sexual Wellness
- 3.3.6. Pregnancy and Postpartum Care
- 3.3.7. Pelvic Health Solutions
- 3.4. Global Femtech Market Analysis, Opportunity and Forecast, By By Technological Focus , 2016-2032
- 3.4.1. Global Femtech Market Analysis By Technological Focus : Introduction
- 3.4.2. Market Size Absolute $ Opportunity Analysis and Forecast, By By Technological Focus , 2016-2032
- 3.4.3. Wearable Devices
- 3.4.4. Mobile Applications
- 3.4.5. Telemedicine and Telehealth
- 3.5. Global Femtech Market Analysis, Opportunity and Forecast, By By Service, 2016-2032
- 3.5.1. Global Femtech Market Analysis By Service: Introduction
- 3.5.2. Market Size Absolute $ Opportunity Analysis and Forecast, By By Service, 2016-2032
- 3.5.3. Diagnostics
- 3.5.4. Monitoring
- 3.5.5. Therapeutic
- 3.6. Global Femtech Market Analysis, Opportunity and Forecast, By By End User, 2016-2032
- 3.6.1. Global Femtech Market Analysis By End User: Introduction
- 3.6.2. Market Size Absolute $ Opportunity Analysis and Forecast, By By End User, 2016-2032
- 3.6.3. Diagnostic Centers
- 3.6.4. Surgical Centers
- 3.6.5. Hospitals
- 3.6.6. Fertility Clinics
- 3.6.7. Direct to Consumer
- 4. North America Femtech Market Analysis, Opportunity and Forecast, 2016-2032
- 4.1. North America Femtech Market Analysis, 2016-2021
- 4.2. North America Femtech Market Opportunity and Forecast, 2023-2032
- 4.3. North America Femtech Market Analysis, Opportunity and Forecast, By By Application Type , 2016-2032
- 4.3.1. North America Femtech Market Analysis By Application Type : Introduction
- 4.3.2. Market Size Absolute $ Opportunity Analysis and Forecast, By By Application Type , 2016-2032
- 4.3.3. Reproductive Health
- 4.3.4. Fertility Tracking and Optimization
- 4.3.5. Sexual Wellness
- 4.3.6. Pregnancy and Postpartum Care
- 4.3.7. Pelvic Health Solutions
- 4.4. North America Femtech Market Analysis, Opportunity and Forecast, By By Technological Focus , 2016-2032
- 4.4.1. North America Femtech Market Analysis By Technological Focus : Introduction
- 4.4.2. Market Size Absolute $ Opportunity Analysis and Forecast, By By Technological Focus , 2016-2032
- 4.4.3. Wearable Devices
- 4.4.4. Mobile Applications
- 4.4.5. Telemedicine and Telehealth
- 4.5. North America Femtech Market Analysis, Opportunity and Forecast, By By Service, 2016-2032
- 4.5.1. North America Femtech Market Analysis By Service: Introduction
- 4.5.2. Market Size Absolute $ Opportunity Analysis and Forecast, By By Service, 2016-2032
- 4.5.3. Diagnostics
- 4.5.4. Monitoring
- 4.5.5. Therapeutic
- 4.6. North America Femtech Market Analysis, Opportunity and Forecast, By By End User, 2016-2032
- 4.6.1. North America Femtech Market Analysis By End User: Introduction
- 4.6.2. Market Size Absolute $ Opportunity Analysis and Forecast, By By End User, 2016-2032
- 4.6.3. Diagnostic Centers
- 4.6.4. Surgical Centers
- 4.6.5. Hospitals
- 4.6.6. Fertility Clinics
- 4.6.7. Direct to Consumer
- 4.7. North America Femtech Market Analysis, Opportunity and Forecast, By Country , 2016-2032
- 4.7.1. North America Femtech Market Analysis by Country : Introduction
- 4.7.2. Market Size Absolute $ Opportunity Analysis and Forecast, Country , 2016-2032
- 4.7.2.1. The US
- 4.7.2.2. Canada
- 4.7.2.3. Mexico
- 5. Western Europe Femtech Market Analysis, Opportunity and Forecast, 2016-2032
- 5.1. Western Europe Femtech Market Analysis, 2016-2021
- 5.2. Western Europe Femtech Market Opportunity and Forecast, 2023-2032
- 5.3. Western Europe Femtech Market Analysis, Opportunity and Forecast, By By Application Type , 2016-2032
- 5.3.1. Western Europe Femtech Market Analysis By Application Type : Introduction
- 5.3.2. Market Size Absolute $ Opportunity Analysis and Forecast, By By Application Type , 2016-2032
- 5.3.3. Reproductive Health
- 5.3.4. Fertility Tracking and Optimization
- 5.3.5. Sexual Wellness
- 5.3.6. Pregnancy and Postpartum Care
- 5.3.7. Pelvic Health Solutions
- 5.4. Western Europe Femtech Market Analysis, Opportunity and Forecast, By By Technological Focus , 2016-2032
- 5.4.1. Western Europe Femtech Market Analysis By Technological Focus : Introduction
- 5.4.2. Market Size Absolute $ Opportunity Analysis and Forecast, By By Technological Focus , 2016-2032
- 5.4.3. Wearable Devices
- 5.4.4. Mobile Applications
- 5.4.5. Telemedicine and Telehealth
- 5.5. Western Europe Femtech Market Analysis, Opportunity and Forecast, By By Service, 2016-2032
- 5.5.1. Western Europe Femtech Market Analysis By Service: Introduction
- 5.5.2. Market Size Absolute $ Opportunity Analysis and Forecast, By By Service, 2016-2032
- 5.5.3. Diagnostics
- 5.5.4. Monitoring
- 5.5.5. Therapeutic
- 5.6. Western Europe Femtech Market Analysis, Opportunity and Forecast, By By End User, 2016-2032
- 5.6.1. Western Europe Femtech Market Analysis By End User: Introduction
- 5.6.2. Market Size Absolute $ Opportunity Analysis and Forecast, By By End User, 2016-2032
- 5.6.3. Diagnostic Centers
- 5.6.4. Surgical Centers
- 5.6.5. Hospitals
- 5.6.6. Fertility Clinics
- 5.6.7. Direct to Consumer
- 5.7. Western Europe Femtech Market Analysis, Opportunity and Forecast, By Country , 2016-2032
- 5.7.1. Western Europe Femtech Market Analysis by Country : Introduction
- 5.7.2. Market Size Absolute $ Opportunity Analysis and Forecast, Country , 2016-2032
- 5.7.2.1. Germany
- 5.7.2.2. France
- 5.7.2.3. The UK
- 5.7.2.4. Spain
- 5.7.2.5. Italy
- 5.7.2.6. Portugal
- 5.7.2.7. Ireland
- 5.7.2.8. Austria
- 5.7.2.9. Switzerland
- 5.7.2.10. Benelux
- 5.7.2.11. Nordic
- 5.7.2.12. Rest of Western Europe
- 6. Eastern Europe Femtech Market Analysis, Opportunity and Forecast, 2016-2032
- 6.1. Eastern Europe Femtech Market Analysis, 2016-2021
- 6.2. Eastern Europe Femtech Market Opportunity and Forecast, 2023-2032
- 6.3. Eastern Europe Femtech Market Analysis, Opportunity and Forecast, By By Application Type , 2016-2032
- 6.3.1. Eastern Europe Femtech Market Analysis By Application Type : Introduction
- 6.3.2. Market Size Absolute $ Opportunity Analysis and Forecast, By By Application Type , 2016-2032
- 6.3.3. Reproductive Health
- 6.3.4. Fertility Tracking and Optimization
- 6.3.5. Sexual Wellness
- 6.3.6. Pregnancy and Postpartum Care
- 6.3.7. Pelvic Health Solutions
- 6.4. Eastern Europe Femtech Market Analysis, Opportunity and Forecast, By By Technological Focus , 2016-2032
- 6.4.1. Eastern Europe Femtech Market Analysis By Technological Focus : Introduction
- 6.4.2. Market Size Absolute $ Opportunity Analysis and Forecast, By By Technological Focus , 2016-2032
- 6.4.3. Wearable Devices
- 6.4.4. Mobile Applications
- 6.4.5. Telemedicine and Telehealth
- 6.5. Eastern Europe Femtech Market Analysis, Opportunity and Forecast, By By Service, 2016-2032
- 6.5.1. Eastern Europe Femtech Market Analysis By Service: Introduction
- 6.5.2. Market Size Absolute $ Opportunity Analysis and Forecast, By By Service, 2016-2032
- 6.5.3. Diagnostics
- 6.5.4. Monitoring
- 6.5.5. Therapeutic
- 6.6. Eastern Europe Femtech Market Analysis, Opportunity and Forecast, By By End User, 2016-2032
- 6.6.1. Eastern Europe Femtech Market Analysis By End User: Introduction
- 6.6.2. Market Size Absolute $ Opportunity Analysis and Forecast, By By End User, 2016-2032
- 6.6.3. Diagnostic Centers
- 6.6.4. Surgical Centers
- 6.6.5. Hospitals
- 6.6.6. Fertility Clinics
- 6.6.7. Direct to Consumer
- 6.7. Eastern Europe Femtech Market Analysis, Opportunity and Forecast, By Country , 2016-2032
- 6.7.1. Eastern Europe Femtech Market Analysis by Country : Introduction
- 6.7.2. Market Size Absolute $ Opportunity Analysis and Forecast, Country , 2016-2032
- 6.7.2.1. Russia
- 6.7.2.2. Poland
- 6.7.2.3. The Czech Republic
- 6.7.2.4. Greece
- 6.7.2.5. Rest of Eastern Europe
- 7. APAC Femtech Market Analysis, Opportunity and Forecast, 2016-2032
- 7.1. APAC Femtech Market Analysis, 2016-2021
- 7.2. APAC Femtech Market Opportunity and Forecast, 2023-2032
- 7.3. APAC Femtech Market Analysis, Opportunity and Forecast, By By Application Type , 2016-2032
- 7.3.1. APAC Femtech Market Analysis By Application Type : Introduction
- 7.3.2. Market Size Absolute $ Opportunity Analysis and Forecast, By By Application Type , 2016-2032
- 7.3.3. Reproductive Health
- 7.3.4. Fertility Tracking and Optimization
- 7.3.5. Sexual Wellness
- 7.3.6. Pregnancy and Postpartum Care
- 7.3.7. Pelvic Health Solutions
- 7.4. APAC Femtech Market Analysis, Opportunity and Forecast, By By Technological Focus , 2016-2032
- 7.4.1. APAC Femtech Market Analysis By Technological Focus : Introduction
- 7.4.2. Market Size Absolute $ Opportunity Analysis and Forecast, By By Technological Focus , 2016-2032
- 7.4.3. Wearable Devices
- 7.4.4. Mobile Applications
- 7.4.5. Telemedicine and Telehealth
- 7.5. APAC Femtech Market Analysis, Opportunity and Forecast, By By Service, 2016-2032
- 7.5.1. APAC Femtech Market Analysis By Service: Introduction
- 7.5.2. Market Size Absolute $ Opportunity Analysis and Forecast, By By Service, 2016-2032
- 7.5.3. Diagnostics
- 7.5.4. Monitoring
- 7.5.5. Therapeutic
- 7.6. APAC Femtech Market Analysis, Opportunity and Forecast, By By End User, 2016-2032
- 7.6.1. APAC Femtech Market Analysis By End User: Introduction
- 7.6.2. Market Size Absolute $ Opportunity Analysis and Forecast, By By End User, 2016-2032
- 7.6.3. Diagnostic Centers
- 7.6.4. Surgical Centers
- 7.6.5. Hospitals
- 7.6.6. Fertility Clinics
- 7.6.7. Direct to Consumer
- 7.7. APAC Femtech Market Analysis, Opportunity and Forecast, By Country , 2016-2032
- 7.7.1. APAC Femtech Market Analysis by Country : Introduction
- 7.7.2. Market Size Absolute $ Opportunity Analysis and Forecast, Country , 2016-2032
- 7.7.2.1. China
- 7.7.2.2. Japan
- 7.7.2.3. South Korea
- 7.7.2.4. India
- 7.7.2.5. Australia & New Zeland
- 7.7.2.6. Indonesia
- 7.7.2.7. Malaysia
- 7.7.2.8. Philippines
- 7.7.2.9. Singapore
- 7.7.2.10. Thailand
- 7.7.2.11. Vietnam
- 7.7.2.12. Rest of APAC
- 8. Latin America Femtech Market Analysis, Opportunity and Forecast, 2016-2032
- 8.1. Latin America Femtech Market Analysis, 2016-2021
- 8.2. Latin America Femtech Market Opportunity and Forecast, 2023-2032
- 8.3. Latin America Femtech Market Analysis, Opportunity and Forecast, By By Application Type , 2016-2032
- 8.3.1. Latin America Femtech Market Analysis By Application Type : Introduction
- 8.3.2. Market Size Absolute $ Opportunity Analysis and Forecast, By By Application Type , 2016-2032
- 8.3.3. Reproductive Health
- 8.3.4. Fertility Tracking and Optimization
- 8.3.5. Sexual Wellness
- 8.3.6. Pregnancy and Postpartum Care
- 8.3.7. Pelvic Health Solutions
- 8.4. Latin America Femtech Market Analysis, Opportunity and Forecast, By By Technological Focus , 2016-2032
- 8.4.1. Latin America Femtech Market Analysis By Technological Focus : Introduction
- 8.4.2. Market Size Absolute $ Opportunity Analysis and Forecast, By By Technological Focus , 2016-2032
- 8.4.3. Wearable Devices
- 8.4.4. Mobile Applications
- 8.4.5. Telemedicine and Telehealth
- 8.5. Latin America Femtech Market Analysis, Opportunity and Forecast, By By Service, 2016-2032
- 8.5.1. Latin America Femtech Market Analysis By Service: Introduction
- 8.5.2. Market Size Absolute $ Opportunity Analysis and Forecast, By By Service, 2016-2032
- 8.5.3. Diagnostics
- 8.5.4. Monitoring
- 8.5.5. Therapeutic
- 8.6. Latin America Femtech Market Analysis, Opportunity and Forecast, By By End User, 2016-2032
- 8.6.1. Latin America Femtech Market Analysis By End User: Introduction
- 8.6.2. Market Size Absolute $ Opportunity Analysis and Forecast, By By End User, 2016-2032
- 8.6.3. Diagnostic Centers
- 8.6.4. Surgical Centers
- 8.6.5. Hospitals
- 8.6.6. Fertility Clinics
- 8.6.7. Direct to Consumer
- 8.7. Latin America Femtech Market Analysis, Opportunity and Forecast, By Country , 2016-2032
- 8.7.1. Latin America Femtech Market Analysis by Country : Introduction
- 8.7.2. Market Size Absolute $ Opportunity Analysis and Forecast, Country , 2016-2032
- 8.7.2.1. Brazil
- 8.7.2.2. Colombia
- 8.7.2.3. Chile
- 8.7.2.4. Argentina
- 8.7.2.5. Costa Rica
- 8.7.2.6. Rest of Latin America
- 9. Middle East & Africa Femtech Market Analysis, Opportunity and Forecast, 2016-2032
- 9.1. Middle East & Africa Femtech Market Analysis, 2016-2021
- 9.2. Middle East & Africa Femtech Market Opportunity and Forecast, 2023-2032
- 9.3. Middle East & Africa Femtech Market Analysis, Opportunity and Forecast, By By Application Type , 2016-2032
- 9.3.1. Middle East & Africa Femtech Market Analysis By Application Type : Introduction
- 9.3.2. Market Size Absolute $ Opportunity Analysis and Forecast, By By Application Type , 2016-2032
- 9.3.3. Reproductive Health
- 9.3.4. Fertility Tracking and Optimization
- 9.3.5. Sexual Wellness
- 9.3.6. Pregnancy and Postpartum Care
- 9.3.7. Pelvic Health Solutions
- 9.4. Middle East & Africa Femtech Market Analysis, Opportunity and Forecast, By By Technological Focus , 2016-2032
- 9.4.1. Middle East & Africa Femtech Market Analysis By Technological Focus : Introduction
- 9.4.2. Market Size Absolute $ Opportunity Analysis and Forecast, By By Technological Focus , 2016-2032
- 9.4.3. Wearable Devices
- 9.4.4. Mobile Applications
- 9.4.5. Telemedicine and Telehealth
- 9.5. Middle East & Africa Femtech Market Analysis, Opportunity and Forecast, By By Service, 2016-2032
- 9.5.1. Middle East & Africa Femtech Market Analysis By Service: Introduction
- 9.5.2. Market Size Absolute $ Opportunity Analysis and Forecast, By By Service, 2016-2032
- 9.5.3. Diagnostics
- 9.5.4. Monitoring
- 9.5.5. Therapeutic
- 9.6. Middle East & Africa Femtech Market Analysis, Opportunity and Forecast, By By End User, 2016-2032
- 9.6.1. Middle East & Africa Femtech Market Analysis By End User: Introduction
- 9.6.2. Market Size Absolute $ Opportunity Analysis and Forecast, By By End User, 2016-2032
- 9.6.3. Diagnostic Centers
- 9.6.4. Surgical Centers
- 9.6.5. Hospitals
- 9.6.6. Fertility Clinics
- 9.6.7. Direct to Consumer
- 9.7. Middle East & Africa Femtech Market Analysis, Opportunity and Forecast, By Country , 2016-2032
- 9.7.1. Middle East & Africa Femtech Market Analysis by Country : Introduction
- 9.7.2. Market Size Absolute $ Opportunity Analysis and Forecast, Country , 2016-2032
- 9.7.2.1. Algeria
- 9.7.2.2. Egypt
- 9.7.2.3. Israel
- 9.7.2.4. Kuwait
- 9.7.2.5. Nigeria
- 9.7.2.6. Saudi Arabia
- 9.7.2.7. South Africa
- 9.7.2.8. Turkey
- 9.7.2.9. The UAE
- 9.7.2.10. Rest of MEA
- 10. Global Femtech Market Analysis, Opportunity and Forecast, By Region , 2016-2032
- 10.1. Global Femtech Market Analysis by Region : Introduction
- 10.2. Market Size Absolute $ Opportunity Analysis and Forecast, By Region , 2016-2032
- 10.2.1. North America
- 10.2.2. Western Europe
- 10.2.3. Eastern Europe
- 10.2.4. APAC
- 10.2.5. Latin America
- 10.2.6. Middle East & Africa
- 11. Global Femtech Market Competitive Landscape, Market Share Analysis, and Company Profiles
- 11.1. Market Share Analysis
- 11.2. Company Profiles
- 11.3. Flo Health, Inc
- 11.3.1. Company Overview
- 11.3.2. Financial Highlights
- 11.3.3. Product Portfolio
- 11.3.4. SWOT Analysis
- 11.3.5. Key Strategies and Developments
- 11.4. Apple, Inc
- 11.4.1. Company Overview
- 11.4.2. Financial Highlights
- 11.4.3. Product Portfolio
- 11.4.4. SWOT Analysis
- 11.4.5. Key Strategies and Developments
- 11.5. Clue by Biowink GmbH
- 11.5.1. Company Overview
- 11.5.2. Financial Highlights
- 11.5.3. Product Portfolio
- 11.5.4. SWOT Analysis
- 11.5.5. Key Strategies and Developments
- 11.6. Elvie
- 11.6.1. Company Overview
- 11.6.2. Financial Highlights
- 11.6.3. Product Portfolio
- 11.6.4. SWOT Analysis
- 11.6.5. Key Strategies and Developments
- 11.7. Google, Inc
- 11.7.1. Company Overview
- 11.7.2. Financial Highlights
- 11.7.3. Product Portfolio
- 11.7.4. SWOT Analysis
- 11.7.5. Key Strategies and Developments
- 11.8. HeraMED
- 11.8.1. Company Overview
- 11.8.2. Financial Highlights
- 11.8.3. Product Portfolio
- 11.8.4. SWOT Analysis
- 11.8.5. Key Strategies and Developments
- 11.9. iSono Health
- 11.9.1. Company Overview
- 11.9.2. Financial Highlights
- 11.9.3. Product Portfolio
- 11.9.4. SWOT Analysis
- 11.9.5. Key Strategies and Developments
- 11.10. Natural Cycles USA Corp
- 11.10.1. Company Overview
- 11.10.2. Financial Highlights
- 11.10.3. Product Portfolio
- 11.10.4. SWOT Analysis
- 11.10.5. Key Strategies and Developments
- 11.11. Withings
- 11.11.1. Company Overview
- 11.11.2. Financial Highlights
- 11.11.3. Product Portfolio
- 11.11.4. SWOT Analysis
- 11.11.5. Key Strategies and Developments
- 11.12. OYA Femtech Apparel
- 11.12.1. Company Overview
- 11.12.2. Financial Highlights
- 11.12.3. Product Portfolio
- 11.12.4. SWOT Analysis
- 11.12.5. Key Strategies and Developments
- 11.13.1. Company Overview
- 11.13.2. Financial Highlights
- 11.13.3. Product Portfolio
- 11.13.4. SWOT Analysis
- 11.13.5. Key Strategies and Developments
- 11.14. Gaia Fertility Limited
- 11.14.1. Company Overview
- 11.14.2. Financial Highlights
- 11.14.3. Product Portfolio
- 11.14.4. SWOT Analysis
- 11.14.5. Key Strategies and Developments
- 11.15. Babyscripts
- 11.15.1. Company Overview
- 11.15.2. Financial Highlights
- 11.15.3. Product Portfolio
- 11.15.4. SWOT Analysis
- 11.15.5. Key Strategies and Developments
- 12. Assumptions and Acronyms
- 13. Research Methodology
- 14. Contact
- List of Figures
- Figure 1: Global Femtech Market Revenue (US$ Mn) Market Share By Application Type in 2022
- Figure 2: Global Femtech Market Attractiveness Analysis By Application Type , 2016-2032
- Figure 3: Global Femtech Market Revenue (US$ Mn) Market Share By Technological Focus in 2022
- Figure 4: Global Femtech Market Attractiveness Analysis By Technological Focus , 2016-2032
- Figure 5: Global Femtech Market Revenue (US$ Mn) Market Share By Servicein 2022
- Figure 6: Global Femtech Market Attractiveness Analysis By Service, 2016-2032
- Figure 7: Global Femtech Market Revenue (US$ Mn) Market Share By End Userin 2022
- Figure 8: Global Femtech Market Attractiveness Analysis By End User, 2016-2032
- Figure 9: Global Femtech Market Revenue (US$ Mn) Market Share by Region in 2022
- Figure 10: Global Femtech Market Attractiveness Analysis by Region, 2016-2032
- Figure 11: Global Femtech Market Revenue (US$ Mn) (2016-2032)
- Figure 12: Global Femtech Market Revenue (US$ Mn) Comparison by Region (2016-2032)
- Figure 13: Global Femtech Market Revenue (US$ Mn) Comparison By Application Type (2016-2032)
- Figure 14: Global Femtech Market Revenue (US$ Mn) Comparison By Technological Focus (2016-2032)
- Figure 15: Global Femtech Market Revenue (US$ Mn) Comparison By Service (2016-2032)
- Figure 16: Global Femtech Market Revenue (US$ Mn) Comparison By End User (2016-2032)
- Figure 17: Global Femtech Market Y-o-Y Growth Rate Comparison by Region (2016-2032)
- Figure 18: Global Femtech Market Y-o-Y Growth Rate Comparison By Application Type (2016-2032)
- Figure 19: Global Femtech Market Y-o-Y Growth Rate Comparison By Technological Focus (2016-2032)
- Figure 20: Global Femtech Market Y-o-Y Growth Rate Comparison By Service (2016-2032)
- Figure 21: Global Femtech Market Y-o-Y Growth Rate Comparison By End User (2016-2032)
- Figure 22: Global Femtech Market Share Comparison by Region (2016-2032)
- Figure 23: Global Femtech Market Share Comparison By Application Type (2016-2032)
- Figure 24: Global Femtech Market Share Comparison By Technological Focus (2016-2032)
- Figure 25: Global Femtech Market Share Comparison By Service (2016-2032)
- Figure 26: Global Femtech Market Share Comparison By End User (2016-2032)
- Figure 27: North America Femtech Market Revenue (US$ Mn) Market Share By Application Type in 2022
- Figure 28: North America Femtech Market Attractiveness Analysis By Application Type , 2016-2032
- Figure 29: North America Femtech Market Revenue (US$ Mn) Market Share By Technological Focus in 2022
- Figure 30: North America Femtech Market Attractiveness Analysis By Technological Focus , 2016-2032
- Figure 31: North America Femtech Market Revenue (US$ Mn) Market Share By Servicein 2022
- Figure 32: North America Femtech Market Attractiveness Analysis By Service, 2016-2032
- Figure 33: North America Femtech Market Revenue (US$ Mn) Market Share By End Userin 2022
- Figure 34: North America Femtech Market Attractiveness Analysis By End User, 2016-2032
- Figure 35: North America Femtech Market Revenue (US$ Mn) Market Share by Country in 2022
- Figure 36: North America Femtech Market Attractiveness Analysis by Country, 2016-2032
- Figure 37: North America Femtech Market Revenue (US$ Mn) (2016-2032)
- Figure 38: North America Femtech Market Revenue (US$ Mn) Comparison by Country (2016-2032)
- Figure 39: North America Femtech Market Revenue (US$ Mn) Comparison By Application Type (2016-2032)
- Figure 40: North America Femtech Market Revenue (US$ Mn) Comparison By Technological Focus (2016-2032)
- Figure 41: North America Femtech Market Revenue (US$ Mn) Comparison By Service (2016-2032)
- Figure 42: North America Femtech Market Revenue (US$ Mn) Comparison By End User (2016-2032)
- Figure 43: North America Femtech Market Y-o-Y Growth Rate Comparison by Country (2016-2032)
- Figure 44: North America Femtech Market Y-o-Y Growth Rate Comparison By Application Type (2016-2032)
- Figure 45: North America Femtech Market Y-o-Y Growth Rate Comparison By Technological Focus (2016-2032)
- Figure 46: North America Femtech Market Y-o-Y Growth Rate Comparison By Service (2016-2032)
- Figure 47: North America Femtech Market Y-o-Y Growth Rate Comparison By End User (2016-2032)
- Figure 48: North America Femtech Market Share Comparison by Country (2016-2032)
- Figure 49: North America Femtech Market Share Comparison By Application Type (2016-2032)
- Figure 50: North America Femtech Market Share Comparison By Technological Focus (2016-2032)
- Figure 51: North America Femtech Market Share Comparison By Service (2016-2032)
- Figure 52: North America Femtech Market Share Comparison By End User (2016-2032)
- Figure 53: Western Europe Femtech Market Revenue (US$ Mn) Market Share By Application Type in 2022
- Figure 54: Western Europe Femtech Market Attractiveness Analysis By Application Type , 2016-2032
- Figure 55: Western Europe Femtech Market Revenue (US$ Mn) Market Share By Technological Focus in 2022
- Figure 56: Western Europe Femtech Market Attractiveness Analysis By Technological Focus , 2016-2032
- Figure 57: Western Europe Femtech Market Revenue (US$ Mn) Market Share By Servicein 2022
- Figure 58: Western Europe Femtech Market Attractiveness Analysis By Service, 2016-2032
- Figure 59: Western Europe Femtech Market Revenue (US$ Mn) Market Share By End Userin 2022
- Figure 60: Western Europe Femtech Market Attractiveness Analysis By End User, 2016-2032
- Figure 61: Western Europe Femtech Market Revenue (US$ Mn) Market Share by Country in 2022
- Figure 62: Western Europe Femtech Market Attractiveness Analysis by Country, 2016-2032
- Figure 63: Western Europe Femtech Market Revenue (US$ Mn) (2016-2032)
- Figure 64: Western Europe Femtech Market Revenue (US$ Mn) Comparison by Country (2016-2032)
- Figure 65: Western Europe Femtech Market Revenue (US$ Mn) Comparison By Application Type (2016-2032)
- Figure 66: Western Europe Femtech Market Revenue (US$ Mn) Comparison By Technological Focus (2016-2032)
- Figure 67: Western Europe Femtech Market Revenue (US$ Mn) Comparison By Service (2016-2032)
- Figure 68: Western Europe Femtech Market Revenue (US$ Mn) Comparison By End User (2016-2032)
- Figure 69: Western Europe Femtech Market Y-o-Y Growth Rate Comparison by Country (2016-2032)
- Figure 70: Western Europe Femtech Market Y-o-Y Growth Rate Comparison By Application Type (2016-2032)
- Figure 71: Western Europe Femtech Market Y-o-Y Growth Rate Comparison By Technological Focus (2016-2032)
- Figure 72: Western Europe Femtech Market Y-o-Y Growth Rate Comparison By Service (2016-2032)
- Figure 73: Western Europe Femtech Market Y-o-Y Growth Rate Comparison By End User (2016-2032)
- Figure 74: Western Europe Femtech Market Share Comparison by Country (2016-2032)
- Figure 75: Western Europe Femtech Market Share Comparison By Application Type (2016-2032)
- Figure 76: Western Europe Femtech Market Share Comparison By Technological Focus (2016-2032)
- Figure 77: Western Europe Femtech Market Share Comparison By Service (2016-2032)
- Figure 78: Western Europe Femtech Market Share Comparison By End User (2016-2032)
- Figure 79: Eastern Europe Femtech Market Revenue (US$ Mn) Market Share By Application Type in 2022
- Figure 80: Eastern Europe Femtech Market Attractiveness Analysis By Application Type , 2016-2032
- Figure 81: Eastern Europe Femtech Market Revenue (US$ Mn) Market Share By Technological Focus in 2022
- Figure 82: Eastern Europe Femtech Market Attractiveness Analysis By Technological Focus , 2016-2032
- Figure 83: Eastern Europe Femtech Market Revenue (US$ Mn) Market Share By Servicein 2022
- Figure 84: Eastern Europe Femtech Market Attractiveness Analysis By Service, 2016-2032
- Figure 85: Eastern Europe Femtech Market Revenue (US$ Mn) Market Share By End Userin 2022
- Figure 86: Eastern Europe Femtech Market Attractiveness Analysis By End User, 2016-2032
- Figure 87: Eastern Europe Femtech Market Revenue (US$ Mn) Market Share by Country in 2022
- Figure 88: Eastern Europe Femtech Market Attractiveness Analysis by Country, 2016-2032
- Figure 89: Eastern Europe Femtech Market Revenue (US$ Mn) (2016-2032)
- Figure 90: Eastern Europe Femtech Market Revenue (US$ Mn) Comparison by Country (2016-2032)
- Figure 91: Eastern Europe Femtech Market Revenue (US$ Mn) Comparison By Application Type (2016-2032)
- Figure 92: Eastern Europe Femtech Market Revenue (US$ Mn) Comparison By Technological Focus (2016-2032)
- Figure 93: Eastern Europe Femtech Market Revenue (US$ Mn) Comparison By Service (2016-2032)
- Figure 94: Eastern Europe Femtech Market Revenue (US$ Mn) Comparison By End User (2016-2032)
- Figure 95: Eastern Europe Femtech Market Y-o-Y Growth Rate Comparison by Country (2016-2032)
- Figure 96: Eastern Europe Femtech Market Y-o-Y Growth Rate Comparison By Application Type (2016-2032)
- Figure 97: Eastern Europe Femtech Market Y-o-Y Growth Rate Comparison By Technological Focus (2016-2032)
- Figure 98: Eastern Europe Femtech Market Y-o-Y Growth Rate Comparison By Service (2016-2032)
- Figure 99: Eastern Europe Femtech Market Y-o-Y Growth Rate Comparison By End User (2016-2032)
- Figure 100: Eastern Europe Femtech Market Share Comparison by Country (2016-2032)
- Figure 101: Eastern Europe Femtech Market Share Comparison By Application Type (2016-2032)
- Figure 102: Eastern Europe Femtech Market Share Comparison By Technological Focus (2016-2032)
- Figure 103: Eastern Europe Femtech Market Share Comparison By Service (2016-2032)
- Figure 104: Eastern Europe Femtech Market Share Comparison By End User (2016-2032)
- Figure 105: APAC Femtech Market Revenue (US$ Mn) Market Share By Application Type in 2022
- Figure 106: APAC Femtech Market Attractiveness Analysis By Application Type , 2016-2032
- Figure 107: APAC Femtech Market Revenue (US$ Mn) Market Share By Technological Focus in 2022
- Figure 108: APAC Femtech Market Attractiveness Analysis By Technological Focus , 2016-2032
- Figure 109: APAC Femtech Market Revenue (US$ Mn) Market Share By Servicein 2022
- Figure 110: APAC Femtech Market Attractiveness Analysis By Service, 2016-2032
- Figure 111: APAC Femtech Market Revenue (US$ Mn) Market Share By End Userin 2022
- Figure 112: APAC Femtech Market Attractiveness Analysis By End User, 2016-2032
- Figure 113: APAC Femtech Market Revenue (US$ Mn) Market Share by Country in 2022
- Figure 114: APAC Femtech Market Attractiveness Analysis by Country, 2016-2032
- Figure 115: APAC Femtech Market Revenue (US$ Mn) (2016-2032)
- Figure 116: APAC Femtech Market Revenue (US$ Mn) Comparison by Country (2016-2032)
- Figure 117: APAC Femtech Market Revenue (US$ Mn) Comparison By Application Type (2016-2032)
- Figure 118: APAC Femtech Market Revenue (US$ Mn) Comparison By Technological Focus (2016-2032)
- Figure 119: APAC Femtech Market Revenue (US$ Mn) Comparison By Service (2016-2032)
- Figure 120: APAC Femtech Market Revenue (US$ Mn) Comparison By End User (2016-2032)
- Figure 121: APAC Femtech Market Y-o-Y Growth Rate Comparison by Country (2016-2032)
- Figure 122: APAC Femtech Market Y-o-Y Growth Rate Comparison By Application Type (2016-2032)
- Figure 123: APAC Femtech Market Y-o-Y Growth Rate Comparison By Technological Focus (2016-2032)
- Figure 124: APAC Femtech Market Y-o-Y Growth Rate Comparison By Service (2016-2032)
- Figure 125: APAC Femtech Market Y-o-Y Growth Rate Comparison By End User (2016-2032)
- Figure 126: APAC Femtech Market Share Comparison by Country (2016-2032)
- Figure 127: APAC Femtech Market Share Comparison By Application Type (2016-2032)
- Figure 128: APAC Femtech Market Share Comparison By Technological Focus (2016-2032)
- Figure 129: APAC Femtech Market Share Comparison By Service (2016-2032)
- Figure 130: APAC Femtech Market Share Comparison By End User (2016-2032)
- Figure 131: Latin America Femtech Market Revenue (US$ Mn) Market Share By Application Type in 2022
- Figure 132: Latin America Femtech Market Attractiveness Analysis By Application Type , 2016-2032
- Figure 133: Latin America Femtech Market Revenue (US$ Mn) Market Share By Technological Focus in 2022
- Figure 134: Latin America Femtech Market Attractiveness Analysis By Technological Focus , 2016-2032
- Figure 135: Latin America Femtech Market Revenue (US$ Mn) Market Share By Servicein 2022
- Figure 136: Latin America Femtech Market Attractiveness Analysis By Service, 2016-2032
- Figure 137: Latin America Femtech Market Revenue (US$ Mn) Market Share By End Userin 2022
- Figure 138: Latin America Femtech Market Attractiveness Analysis By End User, 2016-2032
- Figure 139: Latin America Femtech Market Revenue (US$ Mn) Market Share by Country in 2022
- Figure 140: Latin America Femtech Market Attractiveness Analysis by Country, 2016-2032
- Figure 141: Latin America Femtech Market Revenue (US$ Mn) (2016-2032)
- Figure 142: Latin America Femtech Market Revenue (US$ Mn) Comparison by Country (2016-2032)
- Figure 143: Latin America Femtech Market Revenue (US$ Mn) Comparison By Application Type (2016-2032)
- Figure 144: Latin America Femtech Market Revenue (US$ Mn) Comparison By Technological Focus (2016-2032)
- Figure 145: Latin America Femtech Market Revenue (US$ Mn) Comparison By Service (2016-2032)
- Figure 146: Latin America Femtech Market Revenue (US$ Mn) Comparison By End User (2016-2032)
- Figure 147: Latin America Femtech Market Y-o-Y Growth Rate Comparison by Country (2016-2032)
- Figure 148: Latin America Femtech Market Y-o-Y Growth Rate Comparison By Application Type (2016-2032)
- Figure 149: Latin America Femtech Market Y-o-Y Growth Rate Comparison By Technological Focus (2016-2032)
- Figure 150: Latin America Femtech Market Y-o-Y Growth Rate Comparison By Service (2016-2032)
- Figure 151: Latin America Femtech Market Y-o-Y Growth Rate Comparison By End User (2016-2032)
- Figure 152: Latin America Femtech Market Share Comparison by Country (2016-2032)
- Figure 153: Latin America Femtech Market Share Comparison By Application Type (2016-2032)
- Figure 154: Latin America Femtech Market Share Comparison By Technological Focus (2016-2032)
- Figure 155: Latin America Femtech Market Share Comparison By Service (2016-2032)
- Figure 156: Latin America Femtech Market Share Comparison By End User (2016-2032)
- Figure 157: Middle East & Africa Femtech Market Revenue (US$ Mn) Market Share By Application Type in 2022
- Figure 158: Middle East & Africa Femtech Market Attractiveness Analysis By Application Type , 2016-2032
- Figure 159: Middle East & Africa Femtech Market Revenue (US$ Mn) Market Share By Technological Focus in 2022
- Figure 160: Middle East & Africa Femtech Market Attractiveness Analysis By Technological Focus , 2016-2032
- Figure 161: Middle East & Africa Femtech Market Revenue (US$ Mn) Market Share By Servicein 2022
- Figure 162: Middle East & Africa Femtech Market Attractiveness Analysis By Service, 2016-2032
- Figure 163: Middle East & Africa Femtech Market Revenue (US$ Mn) Market Share By End Userin 2022
- Figure 164: Middle East & Africa Femtech Market Attractiveness Analysis By End User, 2016-2032
- Figure 165: Middle East & Africa Femtech Market Revenue (US$ Mn) Market Share by Country in 2022
- Figure 166: Middle East & Africa Femtech Market Attractiveness Analysis by Country, 2016-2032
- Figure 167: Middle East & Africa Femtech Market Revenue (US$ Mn) (2016-2032)
- Figure 168: Middle East & Africa Femtech Market Revenue (US$ Mn) Comparison by Country (2016-2032)
- Figure 169: Middle East & Africa Femtech Market Revenue (US$ Mn) Comparison By Application Type (2016-2032)
- Figure 170: Middle East & Africa Femtech Market Revenue (US$ Mn) Comparison By Technological Focus (2016-2032)
- Figure 171: Middle East & Africa Femtech Market Revenue (US$ Mn) Comparison By Service (2016-2032)
- Figure 172: Middle East & Africa Femtech Market Revenue (US$ Mn) Comparison By End User (2016-2032)
- Figure 173: Middle East & Africa Femtech Market Y-o-Y Growth Rate Comparison by Country (2016-2032)
- Figure 174: Middle East & Africa Femtech Market Y-o-Y Growth Rate Comparison By Application Type (2016-2032)
- Figure 175: Middle East & Africa Femtech Market Y-o-Y Growth Rate Comparison By Technological Focus (2016-2032)
- Figure 176: Middle East & Africa Femtech Market Y-o-Y Growth Rate Comparison By Service (2016-2032)
- Figure 177: Middle East & Africa Femtech Market Y-o-Y Growth Rate Comparison By End User (2016-2032)
- Figure 178: Middle East & Africa Femtech Market Share Comparison by Country (2016-2032)
- Figure 179: Middle East & Africa Femtech Market Share Comparison By Application Type (2016-2032)
- Figure 180: Middle East & Africa Femtech Market Share Comparison By Technological Focus (2016-2032)
- Figure 181: Middle East & Africa Femtech Market Share Comparison By Service (2016-2032)
- Figure 182: Middle East & Africa Femtech Market Share Comparison By End User (2016-2032)
- List of Tables
- Table 1: Global Femtech Market Comparison By Application Type (2016-2032)
- Table 2: Global Femtech Market Comparison By Technological Focus (2016-2032)
- Table 3: Global Femtech Market Comparison By Service (2016-2032)
- Table 4: Global Femtech Market Comparison By End User (2016-2032)
- Table 5: Global Femtech Market Revenue (US$ Mn) Comparison by Region (2016-2032)
- Table 6: Global Femtech Market Revenue (US$ Mn) (2016-2032)
- Table 7: Global Femtech Market Revenue (US$ Mn) Comparison by Region (2016-2032)
- Table 8: Global Femtech Market Revenue (US$ Mn) Comparison By Application Type (2016-2032)
- Table 9: Global Femtech Market Revenue (US$ Mn) Comparison By Technological Focus (2016-2032)
- Table 10: Global Femtech Market Revenue (US$ Mn) Comparison By Service (2016-2032)
- Table 11: Global Femtech Market Revenue (US$ Mn) Comparison By End User (2016-2032)
- Table 12: Global Femtech Market Y-o-Y Growth Rate Comparison by Region (2016-2032)
- Table 13: Global Femtech Market Y-o-Y Growth Rate Comparison By Application Type (2016-2032)
- Table 14: Global Femtech Market Y-o-Y Growth Rate Comparison By Technological Focus (2016-2032)
- Table 15: Global Femtech Market Y-o-Y Growth Rate Comparison By Service (2016-2032)
- Table 16: Global Femtech Market Y-o-Y Growth Rate Comparison By End User (2016-2032)
- Table 17: Global Femtech Market Share Comparison by Region (2016-2032)
- Table 18: Global Femtech Market Share Comparison By Application Type (2016-2032)
- Table 19: Global Femtech Market Share Comparison By Technological Focus (2016-2032)
- Table 20: Global Femtech Market Share Comparison By Service (2016-2032)
- Table 21: Global Femtech Market Share Comparison By End User (2016-2032)
- Table 22: North America Femtech Market Comparison By Technological Focus (2016-2032)
- Table 23: North America Femtech Market Comparison By Service (2016-2032)
- Table 24: North America Femtech Market Comparison By End User (2016-2032)
- Table 25: North America Femtech Market Revenue (US$ Mn) Comparison by Country (2016-2032)
- Table 26: North America Femtech Market Revenue (US$ Mn) (2016-2032)
- Table 27: North America Femtech Market Revenue (US$ Mn) Comparison by Country (2016-2032)
- Table 28: North America Femtech Market Revenue (US$ Mn) Comparison By Application Type (2016-2032)
- Table 29: North America Femtech Market Revenue (US$ Mn) Comparison By Technological Focus (2016-2032)
- Table 30: North America Femtech Market Revenue (US$ Mn) Comparison By Service (2016-2032)
- Table 31: North America Femtech Market Revenue (US$ Mn) Comparison By End User (2016-2032)
- Table 32: North America Femtech Market Y-o-Y Growth Rate Comparison by Country (2016-2032)
- Table 33: North America Femtech Market Y-o-Y Growth Rate Comparison By Application Type (2016-2032)
- Table 34: North America Femtech Market Y-o-Y Growth Rate Comparison By Technological Focus (2016-2032)
- Table 35: North America Femtech Market Y-o-Y Growth Rate Comparison By Service (2016-2032)
- Table 36: North America Femtech Market Y-o-Y Growth Rate Comparison By End User (2016-2032)
- Table 37: North America Femtech Market Share Comparison by Country (2016-2032)
- Table 38: North America Femtech Market Share Comparison By Application Type (2016-2032)
- Table 39: North America Femtech Market Share Comparison By Technological Focus (2016-2032)
- Table 40: North America Femtech Market Share Comparison By Service (2016-2032)
- Table 41: North America Femtech Market Share Comparison By End User (2016-2032)
- Table 42: Western Europe Femtech Market Comparison By Application Type (2016-2032)
- Table 43: Western Europe Femtech Market Comparison By Technological Focus (2016-2032)
- Table 44: Western Europe Femtech Market Comparison By Service (2016-2032)
- Table 45: Western Europe Femtech Market Comparison By End User (2016-2032)
- Table 46: Western Europe Femtech Market Revenue (US$ Mn) Comparison by Country (2016-2032)
- Table 47: Western Europe Femtech Market Revenue (US$ Mn) (2016-2032)
- Table 48: Western Europe Femtech Market Revenue (US$ Mn) Comparison by Country (2016-2032)
- Table 49: Western Europe Femtech Market Revenue (US$ Mn) Comparison By Application Type (2016-2032)
- Table 50: Western Europe Femtech Market Revenue (US$ Mn) Comparison By Technological Focus (2016-2032)
- Table 51: Western Europe Femtech Market Revenue (US$ Mn) Comparison By Service (2016-2032)
- Table 52: Western Europe Femtech Market Revenue (US$ Mn) Comparison By End User (2016-2032)
- Table 53: Western Europe Femtech Market Y-o-Y Growth Rate Comparison by Country (2016-2032)
- Table 54: Western Europe Femtech Market Y-o-Y Growth Rate Comparison By Application Type (2016-2032)
- Table 55: Western Europe Femtech Market Y-o-Y Growth Rate Comparison By Technological Focus (2016-2032)
- Table 56: Western Europe Femtech Market Y-o-Y Growth Rate Comparison By Service (2016-2032)
- Table 57: Western Europe Femtech Market Y-o-Y Growth Rate Comparison By End User (2016-2032)
- Table 58: Western Europe Femtech Market Share Comparison by Country (2016-2032)
- Table 59: Western Europe Femtech Market Share Comparison By Application Type (2016-2032)
- Table 60: Western Europe Femtech Market Share Comparison By Technological Focus (2016-2032)
- Table 61: Western Europe Femtech Market Share Comparison By Service (2016-2032)
- Table 62: Western Europe Femtech Market Share Comparison By End User (2016-2032)
- Table 63: Eastern Europe Femtech Market Comparison By Application Type (2016-2032)
- Table 64: Eastern Europe Femtech Market Comparison By Technological Focus (2016-2032)
- Table 65: Eastern Europe Femtech Market Comparison By Service (2016-2032)
- Table 66: Eastern Europe Femtech Market Comparison By End User (2016-2032)
- Table 67: Eastern Europe Femtech Market Revenue (US$ Mn) Comparison by Country (2016-2032)
- Table 68: Eastern Europe Femtech Market Revenue (US$ Mn) (2016-2032)
- Table 69: Eastern Europe Femtech Market Revenue (US$ Mn) Comparison by Country (2016-2032)
- Table 70: Eastern Europe Femtech Market Revenue (US$ Mn) Comparison By Application Type (2016-2032)
- Table 71: Eastern Europe Femtech Market Revenue (US$ Mn) Comparison By Technological Focus (2016-2032)
- Table 72: Eastern Europe Femtech Market Revenue (US$ Mn) Comparison By Service (2016-2032)
- Table 73: Eastern Europe Femtech Market Revenue (US$ Mn) Comparison By End User (2016-2032)
- Table 74: Eastern Europe Femtech Market Y-o-Y Growth Rate Comparison by Country (2016-2032)
- Table 75: Eastern Europe Femtech Market Y-o-Y Growth Rate Comparison By Application Type (2016-2032)
- Table 76: Eastern Europe Femtech Market Y-o-Y Growth Rate Comparison By Technological Focus (2016-2032)
- Table 77: Eastern Europe Femtech Market Y-o-Y Growth Rate Comparison By Service (2016-2032)
- Table 78: Eastern Europe Femtech Market Y-o-Y Growth Rate Comparison By End User (2016-2032)
- Table 79: Eastern Europe Femtech Market Share Comparison by Country (2016-2032)
- Table 80: Eastern Europe Femtech Market Share Comparison By Application Type (2016-2032)
- Table 81: Eastern Europe Femtech Market Share Comparison By Technological Focus (2016-2032)
- Table 82: Eastern Europe Femtech Market Share Comparison By Service (2016-2032)
- Table 83: Eastern Europe Femtech Market Share Comparison By End User (2016-2032)
- Table 84: APAC Femtech Market Comparison By Application Type (2016-2032)
- Table 85: APAC Femtech Market Comparison By Technological Focus (2016-2032)
- Table 86: APAC Femtech Market Comparison By Service (2016-2032)
- Table 87: APAC Femtech Market Comparison By End User (2016-2032)
- Table 88: APAC Femtech Market Revenue (US$ Mn) Comparison by Country (2016-2032)
- Table 89: APAC Femtech Market Revenue (US$ Mn) (2016-2032)
- Table 90: APAC Femtech Market Revenue (US$ Mn) Comparison by Country (2016-2032)
- Table 91: APAC Femtech Market Revenue (US$ Mn) Comparison By Application Type (2016-2032)
- Table 92: APAC Femtech Market Revenue (US$ Mn) Comparison By Technological Focus (2016-2032)
- Table 93: APAC Femtech Market Revenue (US$ Mn) Comparison By Service (2016-2032)
- Table 94: APAC Femtech Market Revenue (US$ Mn) Comparison By End User (2016-2032)
- Table 95: APAC Femtech Market Y-o-Y Growth Rate Comparison by Country (2016-2032)
- Table 96: APAC Femtech Market Y-o-Y Growth Rate Comparison By Application Type (2016-2032)
- Table 97: APAC Femtech Market Y-o-Y Growth Rate Comparison By Technological Focus (2016-2032)
- Table 98: APAC Femtech Market Y-o-Y Growth Rate Comparison By Service (2016-2032)
- Table 99: APAC Femtech Market Y-o-Y Growth Rate Comparison By End User (2016-2032)
- Table 100: APAC Femtech Market Share Comparison by Country (2016-2032)
- Table 101: APAC Femtech Market Share Comparison By Application Type (2016-2032)
- Table 102: APAC Femtech Market Share Comparison By Technological Focus (2016-2032)
- Table 103: APAC Femtech Market Share Comparison By Service (2016-2032)
- Table 104: APAC Femtech Market Share Comparison By End User (2016-2032)
- Table 105: Latin America Femtech Market Comparison By Application Type (2016-2032)
- Table 106: Latin America Femtech Market Comparison By Technological Focus (2016-2032)
- Table 107: Latin America Femtech Market Comparison By Service (2016-2032)
- Table 108: Latin America Femtech Market Comparison By End User (2016-2032)
- Table 109: Latin America Femtech Market Revenue (US$ Mn) Comparison by Country (2016-2032)
- Table 110: Latin America Femtech Market Revenue (US$ Mn) (2016-2032)
- Table 111: Latin America Femtech Market Revenue (US$ Mn) Comparison by Country (2016-2032)
- Table 112: Latin America Femtech Market Revenue (US$ Mn) Comparison By Application Type (2016-2032)
- Table 113: Latin America Femtech Market Revenue (US$ Mn) Comparison By Technological Focus (2016-2032)
- Table 114: Latin America Femtech Market Revenue (US$ Mn) Comparison By Service (2016-2032)
- Table 115: Latin America Femtech Market Revenue (US$ Mn) Comparison By End User (2016-2032)
- Table 116: Latin America Femtech Market Y-o-Y Growth Rate Comparison by Country (2016-2032)
- Table 117: Latin America Femtech Market Y-o-Y Growth Rate Comparison By Application Type (2016-2032)
- Table 118: Latin America Femtech Market Y-o-Y Growth Rate Comparison By Technological Focus (2016-2032)
- Table 119: Latin America Femtech Market Y-o-Y Growth Rate Comparison By Service (2016-2032)
- Table 120: Latin America Femtech Market Y-o-Y Growth Rate Comparison By End User (2016-2032)
- Table 121: Latin America Femtech Market Share Comparison by Country (2016-2032)
- Table 122: Latin America Femtech Market Share Comparison By Application Type (2016-2032)
- Table 123: Latin America Femtech Market Share Comparison By Technological Focus (2016-2032)
- Table 124: Latin America Femtech Market Share Comparison By Service (2016-2032)
- Table 125: Latin America Femtech Market Share Comparison By End User (2016-2032)
- Table 126: Middle East & Africa Femtech Market Comparison By Application Type (2016-2032)
- Table 127: Middle East & Africa Femtech Market Comparison By Technological Focus (2016-2032)
- Table 128: Middle East & Africa Femtech Market Comparison By Service (2016-2032)
- Table 129: Middle East & Africa Femtech Market Comparison By End User (2016-2032)
- Table 130: Middle East & Africa Femtech Market Revenue (US$ Mn) Comparison by Country (2016-2032)
- Table 131: Middle East & Africa Femtech Market Revenue (US$ Mn) (2016-2032)
- Table 132: Middle East & Africa Femtech Market Revenue (US$ Mn) Comparison by Country (2016-2032)
- Table 133: Middle East & Africa Femtech Market Revenue (US$ Mn) Comparison By Application Type (2016-2032)
- Table 134: Middle East & Africa Femtech Market Revenue (US$ Mn) Comparison By Technological Focus (2016-2032)
- Table 135: Middle East & Africa Femtech Market Revenue (US$ Mn) Comparison By Service (2016-2032)
- Table 136: Middle East & Africa Femtech Market Revenue (US$ Mn) Comparison By End User (2016-2032)
- Table 137: Middle East & Africa Femtech Market Y-o-Y Growth Rate Comparison by Country (2016-2032)
- Table 138: Middle East & Africa Femtech Market Y-o-Y Growth Rate Comparison By Application Type (2016-2032)
- Table 139: Middle East & Africa Femtech Market Y-o-Y Growth Rate Comparison By Technological Focus (2016-2032)
- Table 140: Middle East & Africa Femtech Market Y-o-Y Growth Rate Comparison By Service (2016-2032)
- Table 141: Middle East & Africa Femtech Market Y-o-Y Growth Rate Comparison By End User (2016-2032)
- Table 142: Middle East & Africa Femtech Market Share Comparison by Country (2016-2032)
- Table 143: Middle East & Africa Femtech Market Share Comparison By Application Type (2016-2032)
- Table 144: Middle East & Africa Femtech Market Share Comparison By Technological Focus (2016-2032)
- Table 145: Middle East & Africa Femtech Market Share Comparison By Service (2016-2032)
- Table 146: Middle East & Africa Femtech Market Share Comparison By End User (2016-2032)
- 1. Executive Summary
-
- Flo Health, Inc
- Apple, Inc
- Clue by Biowink GmbH
- Elvie
- Google, Inc
- HeraMED
- iSono Health
- Natural Cycles USA Corp
- Withings
- OYA Femtech Apparel
- Gaia Fertility Limited
- Evvy
- Babyscripts
Our Clients


View Our Licence Options
