
Female Infertility Drugs Market Report By Type (Gonadotropins, Aromatase Inhibitors, Selective Estrogen Receptor Modulators (SERMs), Dopamine Agonists, Clomiphene Citrate, Others), By Route of Administration (Oral, Injectable, Transdermal, Intrauterine, Others), By Treatment Setting (Fertility Clinics, Hospitals, Specialty Clinics, Home-based Treatment), By Region and Companies - Industry Segment Outlook, Market Assessment, Competition Scenario, Trends and Forecast 2024-2033
-
45325
-
May 2024
-
290
-


-
This report was compiled by Trishita Deb Trishita Deb is an experienced market research and consulting professional with over 7 years of expertise across healthcare, consumer goods, and materials, contributing to over 400 healthcare-related reports. Correspondence Team Lead- Healthcare Linkedin | Detailed Market research Methodology Our methodology involves a mix of primary research, including interviews with leading mental health experts, and secondary research from reputable medical journals and databases. View Detailed Methodology Page
-
Quick Navigation
Report Overview
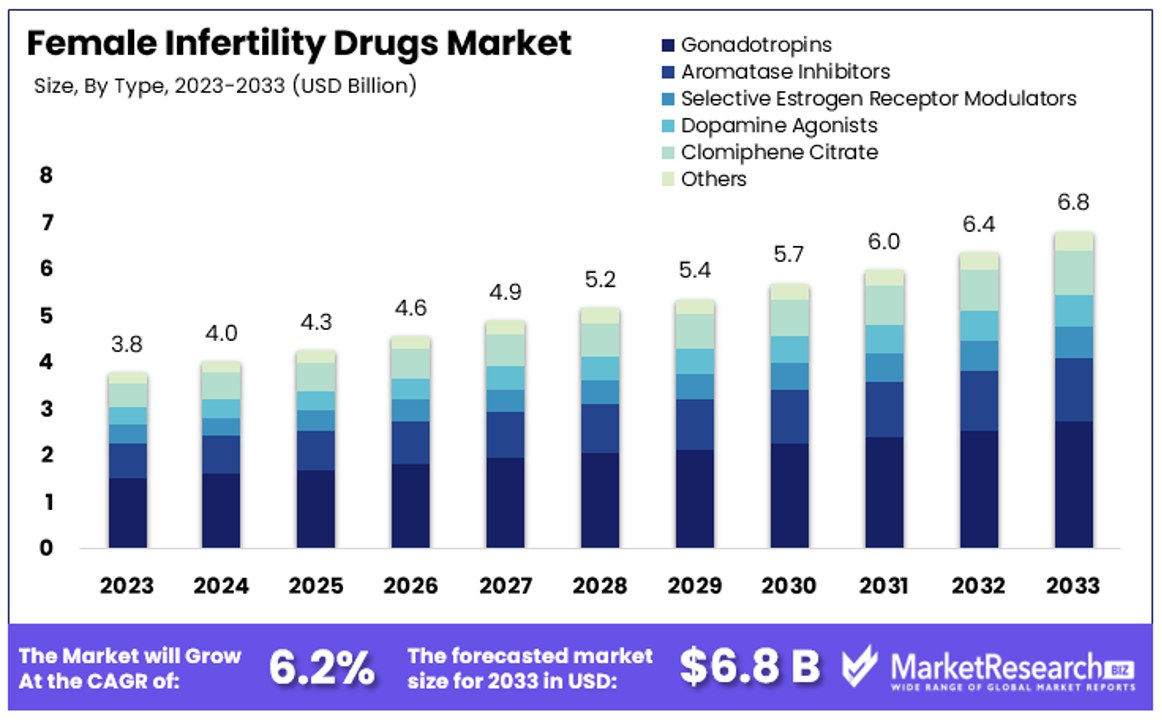
The Global Female Infertility Drugs Market size is expected to be worth around USD 6.8 Billion by 2033, from USD 3.8 Billion in 2023, growing at a CAGR of 6.2% during the forecast period from 2024 to 2033.
The Female Infertility Drugs Market encompasses a range of pharmaceutical products aimed at addressing issues related to infertility in women. These drugs are designed to enhance reproductive health by improving hormonal balances, stimulating ovulation, and supporting other facets of the female reproductive system.
As fertility challenges become more recognized globally, the demand for these medications is increasing, making this market critical for pharmaceutical companies and healthcare providers.
The Female Infertility Drugs Market is experiencing significant growth, driven by increasing awareness and diagnostic rates of infertility issues among women globally. According to the World Health Organization (WHO), female factors alone account for 37% of infertility cases in couples, with both male and female causes identified in 35% of couples. This highlights a substantial market need for effective treatments, underpinning the demand for infertility drugs.
Age remains a critical factor influencing infertility rates, with women aged 15 to 34 experiencing infertility rates between 7.3% and 9.1%. This rate escalates dramatically as women age, reaching 25% among those aged 35 to 39, and surging to 30% in women aged 40 to 44. These statistics emphasize the urgency and demand for fertility treatments among older women, a demographic that continues to seek assistance at a higher rate due to trends towards later childbearing.
Additionally, endometriosis, which affects 10% to 15% of women of reproductive age, is also a significant driver of the market. The condition not only complicates conception but also represents a recurrent issue that often requires ongoing treatment, further fueling the demand for specialized pharmaceutical solutions.
The market for female infertility drugs presents robust growth opportunities. Pharmaceutical companies are thus incentivized to innovate and expand their product offerings to address the nuanced needs of this diverse patient demographic. This market segment, crucial for healthcare providers and investors, offers substantial prospects for development in therapies that could improve outcomes for millions of women worldwide, positioning it as a key area of focus in the pharmaceutical industry.
Key Takeaways
- Market Value: The Global Female Infertility Drugs Market is projected to witness significant growth, reaching a substantial value by 2033, from USD 3.8 billion in 2023, with a CAGR of 6.2% during the forecast period from 2024 to 2033.
- Type Analysis: Gonadotropins lead with a dominant share of 40% due to their efficacy in stimulating ovulation, essential for assisted reproductive technologies such as IVF. Other segments include Aromatase Inhibitors, SERMs, Dopamine Agonists, and Clomiphene Citrate, each offering alternative treatment options to address diverse patient needs.
- Route of Administration Analysis: Injectables dominate the segment, offering precise and controlled delivery of medication crucial for treatments like Gonadotropins. Other routes include oral, transdermal, and intrauterine, catering to different patient preferences and medical requirements.
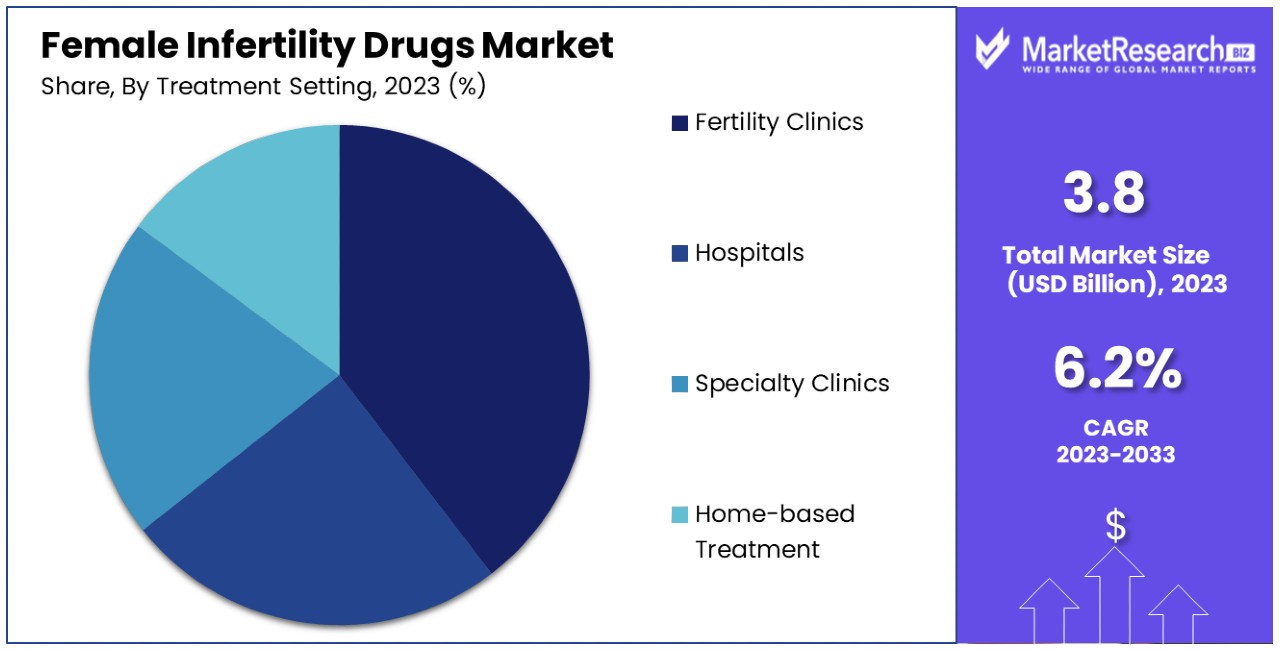
- Treatment Setting Analysis: Fertility clinics dominate the market due to specialized care and advanced treatment technologies, enhancing success rates. Other settings include hospitals, specialty clinics, and home-based treatments, providing options for patients at different levels of care and complexity.
- North America: Dominates with a 40% market share, reflecting advanced healthcare infrastructure and significant investments in fertility treatments.
- Europe: Holds approximately 30% of the market share, supported by favorable healthcare policies and high awareness about fertility treatments.
- Analyst Viewpoint: The dominance of Gonadotropins underscores the importance of stimulating ovulation in female infertility treatment, highlighting the significance of assisted reproductive technologies in addressing infertility. Fertility clinics play a crucial role in providing specialized care and advanced treatment options, contributing to higher success rates and patient satisfaction.
Driving Factors
Increasing Prevalence of Infertility Among Women Drives Market Growth
The growing incidence of infertility among women significantly propels the Female Infertility Drugs Market. Current data from the Centers for Disease Control and Prevention (CDC) indicates that approximately 12% of women aged 15 to 44 in the United States face challenges in conceiving or sustaining a pregnancy.
Factors contributing to this rise include delayed childbearing as women pursue educational and career goals, lifestyle-related health issues such as obesity, and the increasing prevalence of conditions like polycystic ovary syndrome (PCOS). These trends necessitate effective treatment solutions, thereby boosting the demand for infertility drugs. As fertility challenges become more prevalent, the urgency for advanced therapeutic options escalates, ensuring sustained growth in the demand for these pharmaceuticals.
Technological Advancements in Assisted Reproductive Technologies (ART) Drives Market Growth
Technological advancements in assisted reproductive technologies (ART) like in vitro fertilization (IVF) and intracytoplasmic sperm injection (ICSI) have revolutionized the Female Infertility Drugs Market. Innovations in these areas have improved the success rates of fertility treatments, thereby increasing the reliance on and demand for supporting drugs.
Notably, the development of advanced ovulation-inducing medications such as Gonal-f (follitropin alfa) and Ovidrel (choriogonadotropin alfa) has enhanced ovarian stimulation and fertilization outcomes. These technological enhancements not only support direct treatment success but also bolster confidence in fertility treatment efficacy, further driving market growth as more couples opt for these advanced treatment options.
Increasing Awareness and Acceptance of Fertility Treatments Drives Market Growth
The rising awareness and acceptance of fertility treatments have significantly impacted the Female Infertility Drugs Market. Societal shifts towards more positive views on fertility issues have reduced stigma and increased public discourse about treatment options. This cultural change, coupled with expanded insurance coverage in many countries, has made fertility treatments more accessible and appealing to a broader demographic.
As a result, there is a marked increase in the number of couples seeking medical interventions for infertility, which directly boosts the demand for infertility drugs. The enhanced accessibility and acceptance create a supportive environment for market growth, as more individuals are willing to explore and invest in available fertility solutions.
Restraining Factors
High Cost of Fertility Treatments Restrains Market Growth
The substantial cost of fertility treatments, including medications, continues to act as a significant barrier in the Female Infertility Drugs Market. For many couples, the financial burden is considerable, with a single IVF cycle costing between $10,000 and $15,000 in the United States.
This high expense makes fertility treatments inaccessible for a significant portion of the population, particularly those without adequate insurance coverage or in lower income brackets. As a result, the high costs directly limit market growth by reducing the overall number of individuals who can afford these treatments, despite growing demands and advancements in fertility technologies.
Potential Side Effects and Health Risks Restrains Market Growth
The side effects and health risks associated with female infertility drugs, especially those used for ovarian stimulation, present significant challenges to market expansion. Drugs that induce ovulation can lead to complications such as ovarian hyperstimulation syndrome (OHSS), which can be severe and sometimes life-threatening.
Additionally, mood swings and the increased likelihood of multiple pregnancies are concerns that might deter patients from opting for these treatments. The fear of adverse effects and the potential long-term health implications can discourage some women from using these drugs, thereby restraining the market's growth. This concern is heightened by the increasing consumer awareness and sensitivity towards health impacts of medical treatments.
Type Analysis
Gonadotropins dominate with 40% due to their efficacy in stimulating ovulation.
The Female Infertility Drugs Market by type is significantly led by Gonadotropins, which hold a dominant share of 40%. This category includes drugs that are pivotal in stimulating ovulation, making them essential for assisted reproductive technologies such as IVF. The efficacy of Gonadotropins in enhancing fertility rates has cemented their position as a primary choice for treatment, driving their high adoption rate.
Other segments within this market include Aromatase Inhibitors, Selective Estrogen Receptor Modulators (SERMs), Dopamine Agonists, Clomiphene Citrate, and others. Aromatase Inhibitors are utilized to improve hormone levels and enhance fertility, while SERMs are used to correct hormonal imbalances. Dopamine Agonists address specific conditions like hyperprolactinemia, which can affect reproductive functions. Clomiphene Citrate, another crucial drug, is often the first line of treatment for inducing ovulation but has a lower market share compared to Gonadotropins due to its varying success rates and side effects. These remaining segments, while not as dominant, play crucial roles in offering alternative and supplementary treatment options, contributing to the market's depth and addressing diverse patient needs.
Route of Administration Analysis
Injectables dominate with significant usage due to their direct and controlled delivery of medication.
In the route of administration segment of the Female Infertility Drugs Market, injectables lead prominently. This dominance is attributed to the precise control these formulations offer in the delivery of drugs, crucial for treatments like Gonadotropins where dosage accuracy is vital for effectiveness. The direct administration into the body ensures maximum bioavailability and faster onset of action, which is critical in timed fertility treatments.
Other routes of administration include oral, transdermal, intrauterine, and others. Oral medications are widely used due to their ease of administration but often face limitations in terms of bioavailability and the potential for systemic side effects. Transdermal and intrauterine routes offer alternatives that can provide sustained release of medication but are less commonly used due to the specific and limited types of drugs suitable for these methods. Each of these routes contributes to the market by catering to different patient preferences and medical requirements, enhancing the overall market structure by providing varied treatment modalities.
Treatment Setting Analysis
Fertility clinics dominate due to specialized care and advanced treatment technologies.
The treatment setting segment is predominantly led by fertility clinics. These clinics specialize in treating infertility and are equipped with advanced technologies and specialized staff, making them the preferred choice for patients seeking comprehensive fertility treatments. The focused care and expertise available at fertility clinics enhance the success rates of infertility treatments, thereby attracting a larger patient base.
Other settings include hospitals, specialty clinics, and home-based treatments. Hospitals are critical for providing treatments that require more extensive medical interventions and are typically utilized for more complex cases. Specialty clinics offer focused care but on a smaller scale compared to fertility clinics, while home-based treatments are gaining traction with the availability of drugs that can be safely administered at home, such as oral medications and some injectables. However, the lack of advanced monitoring and technological support at home limits the effectiveness of more complex treatments. Together, these varied treatment settings ensure that patients have access to infertility treatments at different levels of care and complexity, accommodating a wide range of medical needs and personal circumstances.
Key Market Segments
By Type
- Gonadotropins
- Aromatase Inhibitors
- Selective Estrogen Receptor Modulators (SERMs)
- Dopamine Agonists
- Clomiphene Citrate
- Others
By Route of Administration
- Oral
- Injectable
- Transdermal
- Intrauterine
- Others
By Treatment Setting
- Fertility Clinics
- Hospitals
- Specialty Clinics
- Home-based Treatment
Growth Opportunities
Expansion into Emerging Markets Offers Growth Opportunity
The expansion into emerging markets such as India, China, and Brazil presents significant growth opportunities for the Female Infertility Drugs Market. These regions are characterized by large populations, increasing disposable incomes, and a growing awareness of fertility issues and treatments.
This growth is fueled by factors such as rising urbanization, the trend of delayed parenthood, and increasing economic prosperity which enables greater spending on healthcare services. As these markets continue to develop, the demand for infertility treatments is likely to increase, providing a lucrative expansion opportunity for market players who can navigate the unique cultural, economic, and regulatory landscapes of these diverse regions.
Development of Personalized and Targeted Therapies Offers Growth Opportunity
The development of personalized and targeted therapies marks a profound growth opportunity within the Female Infertility Drugs Market. Advances in understanding the genetic and molecular bases of infertility are paving the way for more precise and effective treatments. Companies are now focusing on creating therapies that are tailored to individual genetic profiles and specific infertility causes, enhancing treatment efficacy and reducing potential side effects.
For instance, Ferring Pharmaceuticals is investing in the development of treatments personalized to a woman's unique hormonal and genetic conditions. This shift towards personalized medicine not only promises higher success rates in treatment but also positions the market to cater to increasingly health-conscious consumers who value customized healthcare solutions. This approach is expected to attract a larger patient base and drive market growth through improved patient outcomes and satisfaction.
Trending Factors
Adoption of Fertility Tourism Are Trending Factors
The adoption of fertility tourism has emerged as a trending factor in the Female Infertility Drugs Market, driven by the appeal of lower treatment costs, access to advanced medical technologies, and less restrictive regulatory environments abroad. Countries like Thailand, India, and Mexico are becoming popular destinations for such services, attracting couples from high-cost regions such as the U.S. and Europe.
This trend not only opens new markets for local fertility clinics and pharmaceutical companies but also stimulates global competition and collaboration in the fertility sector. The economic advantages combined with high-quality treatments available in these countries are encouraging more individuals to consider cross-border options for fertility treatments, expanding the market reach and driving innovation across different geographic regions.
Integration of Digital Technologies Are Trending Factors
The integration of digital technologies into fertility care represents another significant trending factor in the Female Infertility Drugs Market. Technologies like telemedicine, mobile apps, and artificial intelligence (AI) are transforming how fertility treatments are managed and delivered. These innovations enable enhanced patient engagement through personalized treatment plans and improved medication adherence.
Companies such as Ava Science and Ovaterra are at the forefront, developing AI-powered devices and apps that assist in monitoring fertility cycles and optimizing treatment timing. This digital shift not only makes fertility care more accessible and convenient but also helps in collecting vast amounts of data for improving treatment outcomes and patient experiences. As digital integration continues to deepen, it is setting new standards for efficiency and patient-centered care in the fertility industry, marking a clear trend towards technology-driven healthcare solutions.
Regional Analysis
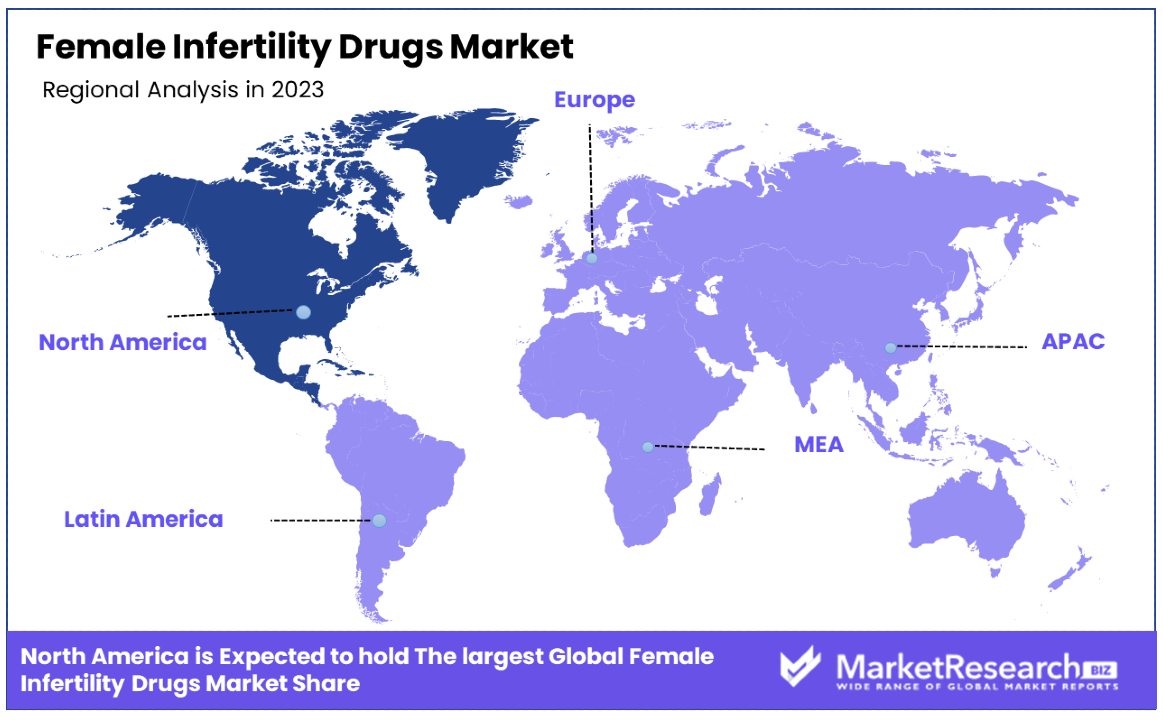
North America Dominates with 40% Market Share
North America holds a dominant 40% share of the Female Infertility Drugs Market, primarily driven by advanced healthcare infrastructure, high healthcare spending, and widespread acceptance of advanced medical treatments. The region benefits from the presence of major pharmaceutical companies and cutting-edge fertility clinics that invest heavily in research and development. Additionally, awareness and openness regarding infertility issues are comparatively high, leading to early and increased utilization of fertility treatments.
The market dynamics in North America are influenced by regulatory support for drug approvals and a strong emphasis on reproductive health. Insurance coverage for infertility treatments is more comprehensive in this region compared to others, which further boosts access to these drugs. The high prevalence of infertility-related conditions, coupled with lifestyle factors such as delayed parenthood, also plays a crucial role in sustaining demand within the market.
North America is expected to maintain its leadership in the Female Infertility Drugs Market due to ongoing innovations in drug development and a robust healthcare sector. Emerging trends such as personalized medicine and digital health interventions for fertility management are likely to reinforce the region's market position by enhancing treatment effectiveness and patient satisfaction.
Regional Market Share and Growth Rates:
- Europe: Holds approximately 30% of the market share, supported by favorable healthcare policies and high awareness about fertility treatments.
- Asia Pacific: Fastest-growing with an expected growth rate of around 10% CAGR, driven by increasing disposable incomes and expanding healthcare infrastructure.
- Middle East & Africa: Smaller market share at around 10%, but gradually increasing due to improving healthcare systems and growing awareness.
- Latin America: Approximately 10% market share, with growth influenced by improving healthcare access and regional economic development.
Key Regions and Countries
- North America
- The US
- Canada
- Mexico
- Western Europe
- Germany
- France
- The UK
- Spain
- Italy
- Portugal
- Ireland
- Austria
- Switzerland
- Benelux
- Nordic
- Rest of Western Europe
- Eastern Europe
- Russia
- Poland
- The Czech Republic
- Greece
- Rest of Eastern Europe
- APAC
- China
- Japan
- South Korea
- India
- Australia & New Zealand
- Indonesia
- Malaysia
- Philippines
- Singapore
- Thailand
- Vietnam
- Rest of APAC
- Latin America
- Brazil
- Colombia
- Chile
- Argentina
- Costa Rica
- Rest of Latin America
- Middle East & Africa
- Algeria
- Egypt
- Israel
- Kuwait
- Nigeria
- Saudi Arabia
- South Africa
- Turkey
- United Arab Emirates
- Rest of MEA
Key Players Analysis
In the Female Infertility Drugs Market, companies like Merck & Co., Inc., Novartis AG, and Ferring B.V. play crucial roles in shaping market dynamics through their robust drug portfolios and extensive R&D initiatives. These companies are strategically positioned, focusing on innovative treatments that address a broad spectrum of infertility issues. Sanofi S.A. and Bayer AG are key players whose market influence is bolstered by their long-standing global presence and strong brand reputations, which enhance their credibility and patient trust.
Additionally, newer entrants like Organon Group of Companies and Berlex Laboratories Inc. are making significant impacts by focusing on niche segments and advanced therapeutic solutions. Companies such as Eli Lilly and Co., and Pfizer Inc. leverage their vast resources to foster market development and increase accessibility to infertility treatments across diverse geographical regions. Collectively, these companies drive forward the global agenda on female infertility by enhancing drug efficacy and patient outcomes, positioning them as leaders in this critical healthcare field.
Market Key Players
- Abbott Duphaston
- Sanofi S.A.
- Merck & Co., Inc.
- Novartis AG
- Ferring B.V.
- Berlex Laboratories Inc.
- Eli Lilly and Co.
- Serono Inc.
- Novogyne Pharmaceuticals
- Pfizer, Inc.
- Ferring Pharmaceuticals Inc
- Pfizer Inc.
- Merck KGaA
- Novartis International AG
- Bayer AG
- Organon Group of Companies
Recent Developments
- On April 2024, Gameto, a female-led biotechnology company, partnered with Stacey Bendet to launch the "Your Eggsperience Matters" campaign during National Infertility Awareness Week, aiming to raise awareness and funds for RESOLVE.
- On April 2024, Perelel collaborated with Whitney Port to introduce the 'Fertility, Unfiltered' series, shedding light on infertility and loss, and supporting women's journeys to motherhood. The series aims to normalize conversations around these challenges and provide support to all women.
- On February 2024, Lupin launched Ganirelix Acetate Injection in the US to inhibit premature luteinizing hormone surges in women undergoing fertility treatment. This injection is recommended to prevent ovulation in women during controlled ovarian hyperstimulation.
Report Scope
Report Features Description Market Value (2023) USD 3.8 Billion Forecast Revenue (2033) USD 6.8 Billion CAGR (2024-2033) 6.2% Base Year for Estimation 2023 Historic Period 2018-2023 Forecast Period 2024-2033 Report Coverage Revenue Forecast, Market Dynamics, Competitive Landscape, Recent Developments Segments Covered By Type (Gonadotropins, Aromatase Inhibitors, Selective Estrogen Receptor Modulators (SERMs), Dopamine Agonists, Clomiphene Citrate, Others), By Route of Administration (Oral, Injectable, Transdermal, Intrauterine, Others), By Treatment Setting (Fertility Clinics, Hospitals, Specialty Clinics, Home-based Treatment) Regional Analysis North America - The US, Canada, & Mexico; Western Europe - Germany, France, The UK, Spain, Italy, Portugal, Ireland, Austria, Switzerland, Benelux, Nordic, & Rest of Western Europe; Eastern Europe - Russia, Poland, The Czech Republic, Greece, & Rest of Eastern Europe; APAC - China, Japan, South Korea, India, Australia & New Zealand, Indonesia, Malaysia, Philippines, Singapore, Thailand, Vietnam, & Rest of APAC; Latin America - Brazil, Colombia, Chile, Argentina, Costa Rica, & Rest of Latin America; Middle East & Africa - Algeria, Egypt, Israel, Kuwait, Nigeria, Saudi Arabia, South Africa, Turkey, United Arab Emirates, & Rest of MEA Competitive Landscape Abbott Duphaston, Sanofi S.A., Merck & Co., Inc., Novartis AG, Ferring B.V., Berlex Laboratories Inc., Eli Lilly and Co., Serono Inc., Novogyne Pharmaceuticals, Pfizer, Inc., Ferring Pharmaceuticals Inc., Pfizer Inc., Merck KGaA, Novartis International AG, Bayer AG, Organon Group of Companies Customization Scope Customization for segments, region/country-level will be provided. Moreover, additional customization can be done based on the requirements. Purchase Options We have three licenses to opt for: Single User License, Multi-User License (Up to 5 Users), Corporate Use License (Unlimited User and Printable PDF) -
- 1. Executive Summary
- 1.1. Definition
- 1.2. Taxonomy
- 1.3. Research Scope
- 1.4. Key Analysis
- 1.5. Key Findings by Major Segments
- 1.6. Top strategies by Major Players
- 2. Global Female Infertility Drugs Market Overview
- 2.1. Female Infertility Drugs Market Dynamics
- 2.1.1. Drivers
- 2.1.2. Opportunities
- 2.1.3. Restraints
- 2.1.4. Challenges
- 2.2. Macro-economic Factors
- 2.3. Regulatory Framework
- 2.4. Market Investment Feasibility Index
- 2.5. PEST Analysis
- 2.6. PORTER’S Five Force Analysis
- 2.7. Drivers & Restraints Impact Analysis
- 2.8. Industry Chain Analysis
- 2.9. Cost Structure Analysis
- 2.10. Marketing Strategy
- 2.11. Russia-Ukraine War Impact Analysis
- 2.12. Opportunity Map Analysis
- 2.13. Market Competition Scenario Analysis
- 2.14. Product Life Cycle Analysis
- 2.15. Opportunity Orbits
- 2.16. Manufacturer Intensity Map
- 2.17. Major Companies sales by Value & Volume
- 2.1. Female Infertility Drugs Market Dynamics
- 3. Global Female Infertility Drugs Market Analysis, Opportunity and Forecast, 2016-2032
- 3.1. Global Female Infertility Drugs Market Analysis, 2016-2021
- 3.2. Global Female Infertility Drugs Market Opportunity and Forecast, 2023-2032
- 3.3. Global Female Infertility Drugs Market Analysis, Opportunity and Forecast, By Type, 2016-2032
- 3.3.1. Global Female Infertility Drugs Market Analysis by Type: Introduction
- 3.3.2. Market Size Absolute $ Opportunity Analysis and Forecast, By Type, 2016-2032
- 3.3.3. Gonadotropins
- 3.3.4. Aromatase Inhibitors
- 3.3.5. Selective Estrogen Receptor Modulators (SERMs)
- 3.3.6. Dopamine Agonists
- 3.3.7. Clomiphene Citrate
- 3.3.8. Others
- 3.4. Global Female Infertility Drugs Market Analysis, Opportunity and Forecast, By Route of Administration, 2016-2032
- 3.4.1. Global Female Infertility Drugs Market Analysis by Route of Administration: Introduction
- 3.4.2. Market Size Absolute $ Opportunity Analysis and Forecast, By Route of Administration, 2016-2032
- 3.4.3. Oral
- 3.4.4. Injectable
- 3.4.5. Transdermal
- 3.4.6. Intrauterine
- 3.4.7. Others
- 3.5. Global Female Infertility Drugs Market Analysis, Opportunity and Forecast, By Treatment Setting, 2016-2032
- 3.5.1. Global Female Infertility Drugs Market Analysis by Treatment Setting: Introduction
- 3.5.2. Market Size Absolute $ Opportunity Analysis and Forecast, By Treatment Setting, 2016-2032
- 3.5.3. Fertility Clinics
- 3.5.4. Hospitals
- 3.5.5. Specialty Clinics
- 3.5.6. Home-based Treatment
- 4. North America Female Infertility Drugs Market Analysis, Opportunity and Forecast, 2016-2032
- 4.1. North America Female Infertility Drugs Market Analysis, 2016-2021
- 4.2. North America Female Infertility Drugs Market Opportunity and Forecast, 2023-2032
- 4.3. North America Female Infertility Drugs Market Analysis, Opportunity and Forecast, By Type, 2016-2032
- 4.3.1. North America Female Infertility Drugs Market Analysis by Type: Introduction
- 4.3.2. Market Size Absolute $ Opportunity Analysis and Forecast, By Type, 2016-2032
- 4.3.3. Gonadotropins
- 4.3.4. Aromatase Inhibitors
- 4.3.5. Selective Estrogen Receptor Modulators (SERMs)
- 4.3.6. Dopamine Agonists
- 4.3.7. Clomiphene Citrate
- 4.3.8. Others
- 4.4. North America Female Infertility Drugs Market Analysis, Opportunity and Forecast, By Route of Administration, 2016-2032
- 4.4.1. North America Female Infertility Drugs Market Analysis by Route of Administration: Introduction
- 4.4.2. Market Size Absolute $ Opportunity Analysis and Forecast, By Route of Administration, 2016-2032
- 4.4.3. Oral
- 4.4.4. Injectable
- 4.4.5. Transdermal
- 4.4.6. Intrauterine
- 4.4.7. Others
- 4.5. North America Female Infertility Drugs Market Analysis, Opportunity and Forecast, By Treatment Setting, 2016-2032
- 4.5.1. North America Female Infertility Drugs Market Analysis by Treatment Setting: Introduction
- 4.5.2. Market Size Absolute $ Opportunity Analysis and Forecast, By Treatment Setting, 2016-2032
- 4.5.3. Fertility Clinics
- 4.5.4. Hospitals
- 4.5.5. Specialty Clinics
- 4.5.6. Home-based Treatment
- 4.6. North America Female Infertility Drugs Market Analysis, Opportunity and Forecast, By Country , 2016-2032
- 4.6.1. North America Female Infertility Drugs Market Analysis by Country : Introduction
- 4.6.2. Market Size Absolute $ Opportunity Analysis and Forecast, Country , 2016-2032
- 4.6.2.1. The US
- 4.6.2.2. Canada
- 4.6.2.3. Mexico
- 5. Western Europe Female Infertility Drugs Market Analysis, Opportunity and Forecast, 2016-2032
- 5.1. Western Europe Female Infertility Drugs Market Analysis, 2016-2021
- 5.2. Western Europe Female Infertility Drugs Market Opportunity and Forecast, 2023-2032
- 5.3. Western Europe Female Infertility Drugs Market Analysis, Opportunity and Forecast, By Type, 2016-2032
- 5.3.1. Western Europe Female Infertility Drugs Market Analysis by Type: Introduction
- 5.3.2. Market Size Absolute $ Opportunity Analysis and Forecast, By Type, 2016-2032
- 5.3.3. Gonadotropins
- 5.3.4. Aromatase Inhibitors
- 5.3.5. Selective Estrogen Receptor Modulators (SERMs)
- 5.3.6. Dopamine Agonists
- 5.3.7. Clomiphene Citrate
- 5.3.8. Others
- 5.4. Western Europe Female Infertility Drugs Market Analysis, Opportunity and Forecast, By Route of Administration, 2016-2032
- 5.4.1. Western Europe Female Infertility Drugs Market Analysis by Route of Administration: Introduction
- 5.4.2. Market Size Absolute $ Opportunity Analysis and Forecast, By Route of Administration, 2016-2032
- 5.4.3. Oral
- 5.4.4. Injectable
- 5.4.5. Transdermal
- 5.4.6. Intrauterine
- 5.4.7. Others
- 5.5. Western Europe Female Infertility Drugs Market Analysis, Opportunity and Forecast, By Treatment Setting, 2016-2032
- 5.5.1. Western Europe Female Infertility Drugs Market Analysis by Treatment Setting: Introduction
- 5.5.2. Market Size Absolute $ Opportunity Analysis and Forecast, By Treatment Setting, 2016-2032
- 5.5.3. Fertility Clinics
- 5.5.4. Hospitals
- 5.5.5. Specialty Clinics
- 5.5.6. Home-based Treatment
- 5.6. Western Europe Female Infertility Drugs Market Analysis, Opportunity and Forecast, By Country , 2016-2032
- 5.6.1. Western Europe Female Infertility Drugs Market Analysis by Country : Introduction
- 5.6.2. Market Size Absolute $ Opportunity Analysis and Forecast, Country , 2016-2032
- 5.6.2.1. Germany
- 5.6.2.2. France
- 5.6.2.3. The UK
- 5.6.2.4. Spain
- 5.6.2.5. Italy
- 5.6.2.6. Portugal
- 5.6.2.7. Ireland
- 5.6.2.8. Austria
- 5.6.2.9. Switzerland
- 5.6.2.10. Benelux
- 5.6.2.11. Nordic
- 5.6.2.12. Rest of Western Europe
- 6. Eastern Europe Female Infertility Drugs Market Analysis, Opportunity and Forecast, 2016-2032
- 6.1. Eastern Europe Female Infertility Drugs Market Analysis, 2016-2021
- 6.2. Eastern Europe Female Infertility Drugs Market Opportunity and Forecast, 2023-2032
- 6.3. Eastern Europe Female Infertility Drugs Market Analysis, Opportunity and Forecast, By Type, 2016-2032
- 6.3.1. Eastern Europe Female Infertility Drugs Market Analysis by Type: Introduction
- 6.3.2. Market Size Absolute $ Opportunity Analysis and Forecast, By Type, 2016-2032
- 6.3.3. Gonadotropins
- 6.3.4. Aromatase Inhibitors
- 6.3.5. Selective Estrogen Receptor Modulators (SERMs)
- 6.3.6. Dopamine Agonists
- 6.3.7. Clomiphene Citrate
- 6.3.8. Others
- 6.4. Eastern Europe Female Infertility Drugs Market Analysis, Opportunity and Forecast, By Route of Administration, 2016-2032
- 6.4.1. Eastern Europe Female Infertility Drugs Market Analysis by Route of Administration: Introduction
- 6.4.2. Market Size Absolute $ Opportunity Analysis and Forecast, By Route of Administration, 2016-2032
- 6.4.3. Oral
- 6.4.4. Injectable
- 6.4.5. Transdermal
- 6.4.6. Intrauterine
- 6.4.7. Others
- 6.5. Eastern Europe Female Infertility Drugs Market Analysis, Opportunity and Forecast, By Treatment Setting, 2016-2032
- 6.5.1. Eastern Europe Female Infertility Drugs Market Analysis by Treatment Setting: Introduction
- 6.5.2. Market Size Absolute $ Opportunity Analysis and Forecast, By Treatment Setting, 2016-2032
- 6.5.3. Fertility Clinics
- 6.5.4. Hospitals
- 6.5.5. Specialty Clinics
- 6.5.6. Home-based Treatment
- 6.6. Eastern Europe Female Infertility Drugs Market Analysis, Opportunity and Forecast, By Country , 2016-2032
- 6.6.1. Eastern Europe Female Infertility Drugs Market Analysis by Country : Introduction
- 6.6.2. Market Size Absolute $ Opportunity Analysis and Forecast, Country , 2016-2032
- 6.6.2.1. Russia
- 6.6.2.2. Poland
- 6.6.2.3. The Czech Republic
- 6.6.2.4. Greece
- 6.6.2.5. Rest of Eastern Europe
- 7. APAC Female Infertility Drugs Market Analysis, Opportunity and Forecast, 2016-2032
- 7.1. APAC Female Infertility Drugs Market Analysis, 2016-2021
- 7.2. APAC Female Infertility Drugs Market Opportunity and Forecast, 2023-2032
- 7.3. APAC Female Infertility Drugs Market Analysis, Opportunity and Forecast, By Type, 2016-2032
- 7.3.1. APAC Female Infertility Drugs Market Analysis by Type: Introduction
- 7.3.2. Market Size Absolute $ Opportunity Analysis and Forecast, By Type, 2016-2032
- 7.3.3. Gonadotropins
- 7.3.4. Aromatase Inhibitors
- 7.3.5. Selective Estrogen Receptor Modulators (SERMs)
- 7.3.6. Dopamine Agonists
- 7.3.7. Clomiphene Citrate
- 7.3.8. Others
- 7.4. APAC Female Infertility Drugs Market Analysis, Opportunity and Forecast, By Route of Administration, 2016-2032
- 7.4.1. APAC Female Infertility Drugs Market Analysis by Route of Administration: Introduction
- 7.4.2. Market Size Absolute $ Opportunity Analysis and Forecast, By Route of Administration, 2016-2032
- 7.4.3. Oral
- 7.4.4. Injectable
- 7.4.5. Transdermal
- 7.4.6. Intrauterine
- 7.4.7. Others
- 7.5. APAC Female Infertility Drugs Market Analysis, Opportunity and Forecast, By Treatment Setting, 2016-2032
- 7.5.1. APAC Female Infertility Drugs Market Analysis by Treatment Setting: Introduction
- 7.5.2. Market Size Absolute $ Opportunity Analysis and Forecast, By Treatment Setting, 2016-2032
- 7.5.3. Fertility Clinics
- 7.5.4. Hospitals
- 7.5.5. Specialty Clinics
- 7.5.6. Home-based Treatment
- 7.6. APAC Female Infertility Drugs Market Analysis, Opportunity and Forecast, By Country , 2016-2032
- 7.6.1. APAC Female Infertility Drugs Market Analysis by Country : Introduction
- 7.6.2. Market Size Absolute $ Opportunity Analysis and Forecast, Country , 2016-2032
- 7.6.2.1. China
- 7.6.2.2. Japan
- 7.6.2.3. South Korea
- 7.6.2.4. India
- 7.6.2.5. Australia & New Zeland
- 7.6.2.6. Indonesia
- 7.6.2.7. Malaysia
- 7.6.2.8. Philippines
- 7.6.2.9. Singapore
- 7.6.2.10. Thailand
- 7.6.2.11. Vietnam
- 7.6.2.12. Rest of APAC
- 8. Latin America Female Infertility Drugs Market Analysis, Opportunity and Forecast, 2016-2032
- 8.1. Latin America Female Infertility Drugs Market Analysis, 2016-2021
- 8.2. Latin America Female Infertility Drugs Market Opportunity and Forecast, 2023-2032
- 8.3. Latin America Female Infertility Drugs Market Analysis, Opportunity and Forecast, By Type, 2016-2032
- 8.3.1. Latin America Female Infertility Drugs Market Analysis by Type: Introduction
- 8.3.2. Market Size Absolute $ Opportunity Analysis and Forecast, By Type, 2016-2032
- 8.3.3. Gonadotropins
- 8.3.4. Aromatase Inhibitors
- 8.3.5. Selective Estrogen Receptor Modulators (SERMs)
- 8.3.6. Dopamine Agonists
- 8.3.7. Clomiphene Citrate
- 8.3.8. Others
- 8.4. Latin America Female Infertility Drugs Market Analysis, Opportunity and Forecast, By Route of Administration, 2016-2032
- 8.4.1. Latin America Female Infertility Drugs Market Analysis by Route of Administration: Introduction
- 8.4.2. Market Size Absolute $ Opportunity Analysis and Forecast, By Route of Administration, 2016-2032
- 8.4.3. Oral
- 8.4.4. Injectable
- 8.4.5. Transdermal
- 8.4.6. Intrauterine
- 8.4.7. Others
- 8.5. Latin America Female Infertility Drugs Market Analysis, Opportunity and Forecast, By Treatment Setting, 2016-2032
- 8.5.1. Latin America Female Infertility Drugs Market Analysis by Treatment Setting: Introduction
- 8.5.2. Market Size Absolute $ Opportunity Analysis and Forecast, By Treatment Setting, 2016-2032
- 8.5.3. Fertility Clinics
- 8.5.4. Hospitals
- 8.5.5. Specialty Clinics
- 8.5.6. Home-based Treatment
- 8.6. Latin America Female Infertility Drugs Market Analysis, Opportunity and Forecast, By Country , 2016-2032
- 8.6.1. Latin America Female Infertility Drugs Market Analysis by Country : Introduction
- 8.6.2. Market Size Absolute $ Opportunity Analysis and Forecast, Country , 2016-2032
- 8.6.2.1. Brazil
- 8.6.2.2. Colombia
- 8.6.2.3. Chile
- 8.6.2.4. Argentina
- 8.6.2.5. Costa Rica
- 8.6.2.6. Rest of Latin America
- 9. Middle East & Africa Female Infertility Drugs Market Analysis, Opportunity and Forecast, 2016-2032
- 9.1. Middle East & Africa Female Infertility Drugs Market Analysis, 2016-2021
- 9.2. Middle East & Africa Female Infertility Drugs Market Opportunity and Forecast, 2023-2032
- 9.3. Middle East & Africa Female Infertility Drugs Market Analysis, Opportunity and Forecast, By Type, 2016-2032
- 9.3.1. Middle East & Africa Female Infertility Drugs Market Analysis by Type: Introduction
- 9.3.2. Market Size Absolute $ Opportunity Analysis and Forecast, By Type, 2016-2032
- 9.3.3. Gonadotropins
- 9.3.4. Aromatase Inhibitors
- 9.3.5. Selective Estrogen Receptor Modulators (SERMs)
- 9.3.6. Dopamine Agonists
- 9.3.7. Clomiphene Citrate
- 9.3.8. Others
- 9.4. Middle East & Africa Female Infertility Drugs Market Analysis, Opportunity and Forecast, By Route of Administration, 2016-2032
- 9.4.1. Middle East & Africa Female Infertility Drugs Market Analysis by Route of Administration: Introduction
- 9.4.2. Market Size Absolute $ Opportunity Analysis and Forecast, By Route of Administration, 2016-2032
- 9.4.3. Oral
- 9.4.4. Injectable
- 9.4.5. Transdermal
- 9.4.6. Intrauterine
- 9.4.7. Others
- 9.5. Middle East & Africa Female Infertility Drugs Market Analysis, Opportunity and Forecast, By Treatment Setting, 2016-2032
- 9.5.1. Middle East & Africa Female Infertility Drugs Market Analysis by Treatment Setting: Introduction
- 9.5.2. Market Size Absolute $ Opportunity Analysis and Forecast, By Treatment Setting, 2016-2032
- 9.5.3. Fertility Clinics
- 9.5.4. Hospitals
- 9.5.5. Specialty Clinics
- 9.5.6. Home-based Treatment
- 9.6. Middle East & Africa Female Infertility Drugs Market Analysis, Opportunity and Forecast, By Country , 2016-2032
- 9.6.1. Middle East & Africa Female Infertility Drugs Market Analysis by Country : Introduction
- 9.6.2. Market Size Absolute $ Opportunity Analysis and Forecast, Country , 2016-2032
- 9.6.2.1. Algeria
- 9.6.2.2. Egypt
- 9.6.2.3. Israel
- 9.6.2.4. Kuwait
- 9.6.2.5. Nigeria
- 9.6.2.6. Saudi Arabia
- 9.6.2.7. South Africa
- 9.6.2.8. Turkey
- 9.6.2.9. The UAE
- 9.6.2.10. Rest of MEA
- 10. Global Female Infertility Drugs Market Analysis, Opportunity and Forecast, By Region , 2016-2032
- 10.1. Global Female Infertility Drugs Market Analysis by Region : Introduction
- 10.2. Market Size Absolute $ Opportunity Analysis and Forecast, By Region , 2016-2032
- 10.2.1. North America
- 10.2.2. Western Europe
- 10.2.3. Eastern Europe
- 10.2.4. APAC
- 10.2.5. Latin America
- 10.2.6. Middle East & Africa
- 11. Global Female Infertility Drugs Market Competitive Landscape, Market Share Analysis, and Company Profiles
- 11.1. Market Share Analysis
- 11.2. Company Profiles
- 11.3. Abbott Duphaston
- 11.3.1. Company Overview
- 11.3.2. Financial Highlights
- 11.3.3. Product Portfolio
- 11.3.4. SWOT Analysis
- 11.3.5. Key Strategies and Developments
- 11.4. Sanofi S.A.
- 11.4.1. Company Overview
- 11.4.2. Financial Highlights
- 11.4.3. Product Portfolio
- 11.4.4. SWOT Analysis
- 11.4.5. Key Strategies and Developments
- 11.5. Merck & Co., Inc.
- 11.5.1. Company Overview
- 11.5.2. Financial Highlights
- 11.5.3. Product Portfolio
- 11.5.4. SWOT Analysis
- 11.5.5. Key Strategies and Developments
- 11.6. Novartis AG
- 11.6.1. Company Overview
- 11.6.2. Financial Highlights
- 11.6.3. Product Portfolio
- 11.6.4. SWOT Analysis
- 11.6.5. Key Strategies and Developments
- 11.7. Ferring B.V.
- 11.7.1. Company Overview
- 11.7.2. Financial Highlights
- 11.7.3. Product Portfolio
- 11.7.4. SWOT Analysis
- 11.7.5. Key Strategies and Developments
- 11.8. Berlex Laboratories Inc.
- 11.8.1. Company Overview
- 11.8.2. Financial Highlights
- 11.8.3. Product Portfolio
- 11.8.4. SWOT Analysis
- 11.8.5. Key Strategies and Developments
- 11.9. Eli Lilly and Co.
- 11.9.1. Company Overview
- 11.9.2. Financial Highlights
- 11.9.3. Product Portfolio
- 11.9.4. SWOT Analysis
- 11.9.5. Key Strategies and Developments
- 11.10. Serono Inc.
- 11.10.1. Company Overview
- 11.10.2. Financial Highlights
- 11.10.3. Product Portfolio
- 11.10.4. SWOT Analysis
- 11.10.5. Key Strategies and Developments
- 11.11. Novogyne Pharmaceuticals
- 11.11.1. Company Overview
- 11.11.2. Financial Highlights
- 11.11.3. Product Portfolio
- 11.11.4. SWOT Analysis
- 11.11.5. Key Strategies and Developments
- 11.12. Pfizer, Inc.
- 11.12.1. Company Overview
- 11.12.2. Financial Highlights
- 11.12.3. Product Portfolio
- 11.12.4. SWOT Analysis
- 11.12.5. Key Strategies and Developments
- 11.13.1. Company Overview
- 11.13.2. Financial Highlights
- 11.13.3. Product Portfolio
- 11.13.4. SWOT Analysis
- 11.13.5. Key Strategies and Developments
- 11.14. Ferring Pharmaceuticals Inc
- 11.14.1. Company Overview
- 11.14.2. Financial Highlights
- 11.14.3. Product Portfolio
- 11.14.4. SWOT Analysis
- 11.14.5. Key Strategies and Developments
- 11.15. Merck KGaA
- 11.15.1. Company Overview
- 11.15.2. Financial Highlights
- 11.15.3. Product Portfolio
- 11.15.4. SWOT Analysis
- 11.15.5. Key Strategies and Developments
- 11.16. Novartis International AG
- 11.16.1. Company Overview
- 11.16.2. Financial Highlights
- 11.16.3. Product Portfolio
- 11.16.4. SWOT Analysis
- 11.16.5. Key Strategies and Developments
- 11.17. Bayer AG
- 11.17.1. Company Overview
- 11.17.2. Financial Highlights
- 11.17.3. Product Portfolio
- 11.17.4. SWOT Analysis
- 11.17.5. Key Strategies and Developments
- 11.18. Organon Group of Companies
- 11.18.1. Company Overview
- 11.18.2. Financial Highlights
- 11.18.3. Product Portfolio
- 11.18.4. SWOT Analysis
- 11.18.5. Key Strategies and Developments
- 12. Assumptions and Acronyms
- 13. Research Methodology
- 14. Contact
- List of Figures
- Figure 1: Global Female Infertility Drugs Market Revenue (US$ Mn) Market Share by Type in 2022
- Figure 2: Global Female Infertility Drugs Market Attractiveness Analysis by Type, 2016-2032
- Figure 3: Global Female Infertility Drugs Market Revenue (US$ Mn) Market Share by Route of Administrationin 2022
- Figure 4: Global Female Infertility Drugs Market Attractiveness Analysis by Route of Administration, 2016-2032
- Figure 5: Global Female Infertility Drugs Market Revenue (US$ Mn) Market Share by Treatment Settingin 2022
- Figure 6: Global Female Infertility Drugs Market Attractiveness Analysis by Treatment Setting, 2016-2032
- Figure 7: Global Female Infertility Drugs Market Revenue (US$ Mn) Market Share by Region in 2022
- Figure 8: Global Female Infertility Drugs Market Attractiveness Analysis by Region, 2016-2032
- Figure 9: Global Female Infertility Drugs Market Revenue (US$ Mn) (2016-2032)
- Figure 10: Global Female Infertility Drugs Market Revenue (US$ Mn) Comparison by Region (2016-2032)
- Figure 11: Global Female Infertility Drugs Market Revenue (US$ Mn) Comparison by Type (2016-2032)
- Figure 12: Global Female Infertility Drugs Market Revenue (US$ Mn) Comparison by Route of Administration (2016-2032)
- Figure 13: Global Female Infertility Drugs Market Revenue (US$ Mn) Comparison by Treatment Setting (2016-2032)
- Figure 14: Global Female Infertility Drugs Market Y-o-Y Growth Rate Comparison by Region (2016-2032)
- Figure 15: Global Female Infertility Drugs Market Y-o-Y Growth Rate Comparison by Type (2016-2032)
- Figure 16: Global Female Infertility Drugs Market Y-o-Y Growth Rate Comparison by Route of Administration (2016-2032)
- Figure 17: Global Female Infertility Drugs Market Y-o-Y Growth Rate Comparison by Treatment Setting (2016-2032)
- Figure 18: Global Female Infertility Drugs Market Share Comparison by Region (2016-2032)
- Figure 19: Global Female Infertility Drugs Market Share Comparison by Type (2016-2032)
- Figure 20: Global Female Infertility Drugs Market Share Comparison by Route of Administration (2016-2032)
- Figure 21: Global Female Infertility Drugs Market Share Comparison by Treatment Setting (2016-2032)
- Figure 22: North America Female Infertility Drugs Market Revenue (US$ Mn) Market Share by Typein 2022
- Figure 23: North America Female Infertility Drugs Market Attractiveness Analysis by Type, 2016-2032
- Figure 24: North America Female Infertility Drugs Market Revenue (US$ Mn) Market Share by Route of Administrationin 2022
- Figure 25: North America Female Infertility Drugs Market Attractiveness Analysis by Route of Administration, 2016-2032
- Figure 26: North America Female Infertility Drugs Market Revenue (US$ Mn) Market Share by Treatment Settingin 2022
- Figure 27: North America Female Infertility Drugs Market Attractiveness Analysis by Treatment Setting, 2016-2032
- Figure 28: North America Female Infertility Drugs Market Revenue (US$ Mn) Market Share by Country in 2022
- Figure 29: North America Female Infertility Drugs Market Attractiveness Analysis by Country, 2016-2032
- Figure 30: North America Female Infertility Drugs Market Revenue (US$ Mn) (2016-2032)
- Figure 31: North America Female Infertility Drugs Market Revenue (US$ Mn) Comparison by Country (2016-2032)
- Figure 32: North America Female Infertility Drugs Market Revenue (US$ Mn) Comparison by Type (2016-2032)
- Figure 33: North America Female Infertility Drugs Market Revenue (US$ Mn) Comparison by Route of Administration (2016-2032)
- Figure 34: North America Female Infertility Drugs Market Revenue (US$ Mn) Comparison by Treatment Setting (2016-2032)
- Figure 35: North America Female Infertility Drugs Market Y-o-Y Growth Rate Comparison by Country (2016-2032)
- Figure 36: North America Female Infertility Drugs Market Y-o-Y Growth Rate Comparison by Type (2016-2032)
- Figure 37: North America Female Infertility Drugs Market Y-o-Y Growth Rate Comparison by Route of Administration (2016-2032)
- Figure 38: North America Female Infertility Drugs Market Y-o-Y Growth Rate Comparison by Treatment Setting (2016-2032)
- Figure 39: North America Female Infertility Drugs Market Share Comparison by Country (2016-2032)
- Figure 40: North America Female Infertility Drugs Market Share Comparison by Type (2016-2032)
- Figure 41: North America Female Infertility Drugs Market Share Comparison by Route of Administration (2016-2032)
- Figure 42: North America Female Infertility Drugs Market Share Comparison by Treatment Setting (2016-2032)
- Figure 43: Western Europe Female Infertility Drugs Market Revenue (US$ Mn) Market Share by Typein 2022
- Figure 44: Western Europe Female Infertility Drugs Market Attractiveness Analysis by Type, 2016-2032
- Figure 45: Western Europe Female Infertility Drugs Market Revenue (US$ Mn) Market Share by Route of Administrationin 2022
- Figure 46: Western Europe Female Infertility Drugs Market Attractiveness Analysis by Route of Administration, 2016-2032
- Figure 47: Western Europe Female Infertility Drugs Market Revenue (US$ Mn) Market Share by Treatment Settingin 2022
- Figure 48: Western Europe Female Infertility Drugs Market Attractiveness Analysis by Treatment Setting, 2016-2032
- Figure 49: Western Europe Female Infertility Drugs Market Revenue (US$ Mn) Market Share by Country in 2022
- Figure 50: Western Europe Female Infertility Drugs Market Attractiveness Analysis by Country, 2016-2032
- Figure 51: Western Europe Female Infertility Drugs Market Revenue (US$ Mn) (2016-2032)
- Figure 52: Western Europe Female Infertility Drugs Market Revenue (US$ Mn) Comparison by Country (2016-2032)
- Figure 53: Western Europe Female Infertility Drugs Market Revenue (US$ Mn) Comparison by Type (2016-2032)
- Figure 54: Western Europe Female Infertility Drugs Market Revenue (US$ Mn) Comparison by Route of Administration (2016-2032)
- Figure 55: Western Europe Female Infertility Drugs Market Revenue (US$ Mn) Comparison by Treatment Setting (2016-2032)
- Figure 56: Western Europe Female Infertility Drugs Market Y-o-Y Growth Rate Comparison by Country (2016-2032)
- Figure 57: Western Europe Female Infertility Drugs Market Y-o-Y Growth Rate Comparison by Type (2016-2032)
- Figure 58: Western Europe Female Infertility Drugs Market Y-o-Y Growth Rate Comparison by Route of Administration (2016-2032)
- Figure 59: Western Europe Female Infertility Drugs Market Y-o-Y Growth Rate Comparison by Treatment Setting (2016-2032)
- Figure 60: Western Europe Female Infertility Drugs Market Share Comparison by Country (2016-2032)
- Figure 61: Western Europe Female Infertility Drugs Market Share Comparison by Type (2016-2032)
- Figure 62: Western Europe Female Infertility Drugs Market Share Comparison by Route of Administration (2016-2032)
- Figure 63: Western Europe Female Infertility Drugs Market Share Comparison by Treatment Setting (2016-2032)
- Figure 64: Eastern Europe Female Infertility Drugs Market Revenue (US$ Mn) Market Share by Typein 2022
- Figure 65: Eastern Europe Female Infertility Drugs Market Attractiveness Analysis by Type, 2016-2032
- Figure 66: Eastern Europe Female Infertility Drugs Market Revenue (US$ Mn) Market Share by Route of Administrationin 2022
- Figure 67: Eastern Europe Female Infertility Drugs Market Attractiveness Analysis by Route of Administration, 2016-2032
- Figure 68: Eastern Europe Female Infertility Drugs Market Revenue (US$ Mn) Market Share by Treatment Settingin 2022
- Figure 69: Eastern Europe Female Infertility Drugs Market Attractiveness Analysis by Treatment Setting, 2016-2032
- Figure 70: Eastern Europe Female Infertility Drugs Market Revenue (US$ Mn) Market Share by Country in 2022
- Figure 71: Eastern Europe Female Infertility Drugs Market Attractiveness Analysis by Country, 2016-2032
- Figure 72: Eastern Europe Female Infertility Drugs Market Revenue (US$ Mn) (2016-2032)
- Figure 73: Eastern Europe Female Infertility Drugs Market Revenue (US$ Mn) Comparison by Country (2016-2032)
- Figure 74: Eastern Europe Female Infertility Drugs Market Revenue (US$ Mn) Comparison by Type (2016-2032)
- Figure 75: Eastern Europe Female Infertility Drugs Market Revenue (US$ Mn) Comparison by Route of Administration (2016-2032)
- Figure 76: Eastern Europe Female Infertility Drugs Market Revenue (US$ Mn) Comparison by Treatment Setting (2016-2032)
- Figure 77: Eastern Europe Female Infertility Drugs Market Y-o-Y Growth Rate Comparison by Country (2016-2032)
- Figure 78: Eastern Europe Female Infertility Drugs Market Y-o-Y Growth Rate Comparison by Type (2016-2032)
- Figure 79: Eastern Europe Female Infertility Drugs Market Y-o-Y Growth Rate Comparison by Route of Administration (2016-2032)
- Figure 80: Eastern Europe Female Infertility Drugs Market Y-o-Y Growth Rate Comparison by Treatment Setting (2016-2032)
- Figure 81: Eastern Europe Female Infertility Drugs Market Share Comparison by Country (2016-2032)
- Figure 82: Eastern Europe Female Infertility Drugs Market Share Comparison by Type (2016-2032)
- Figure 83: Eastern Europe Female Infertility Drugs Market Share Comparison by Route of Administration (2016-2032)
- Figure 84: Eastern Europe Female Infertility Drugs Market Share Comparison by Treatment Setting (2016-2032)
- Figure 85: APAC Female Infertility Drugs Market Revenue (US$ Mn) Market Share by Typein 2022
- Figure 86: APAC Female Infertility Drugs Market Attractiveness Analysis by Type, 2016-2032
- Figure 87: APAC Female Infertility Drugs Market Revenue (US$ Mn) Market Share by Route of Administrationin 2022
- Figure 88: APAC Female Infertility Drugs Market Attractiveness Analysis by Route of Administration, 2016-2032
- Figure 89: APAC Female Infertility Drugs Market Revenue (US$ Mn) Market Share by Treatment Settingin 2022
- Figure 90: APAC Female Infertility Drugs Market Attractiveness Analysis by Treatment Setting, 2016-2032
- Figure 91: APAC Female Infertility Drugs Market Revenue (US$ Mn) Market Share by Country in 2022
- Figure 92: APAC Female Infertility Drugs Market Attractiveness Analysis by Country, 2016-2032
- Figure 93: APAC Female Infertility Drugs Market Revenue (US$ Mn) (2016-2032)
- Figure 94: APAC Female Infertility Drugs Market Revenue (US$ Mn) Comparison by Country (2016-2032)
- Figure 95: APAC Female Infertility Drugs Market Revenue (US$ Mn) Comparison by Type (2016-2032)
- Figure 96: APAC Female Infertility Drugs Market Revenue (US$ Mn) Comparison by Route of Administration (2016-2032)
- Figure 97: APAC Female Infertility Drugs Market Revenue (US$ Mn) Comparison by Treatment Setting (2016-2032)
- Figure 98: APAC Female Infertility Drugs Market Y-o-Y Growth Rate Comparison by Country (2016-2032)
- Figure 99: APAC Female Infertility Drugs Market Y-o-Y Growth Rate Comparison by Type (2016-2032)
- Figure 100: APAC Female Infertility Drugs Market Y-o-Y Growth Rate Comparison by Route of Administration (2016-2032)
- Figure 101: APAC Female Infertility Drugs Market Y-o-Y Growth Rate Comparison by Treatment Setting (2016-2032)
- Figure 102: APAC Female Infertility Drugs Market Share Comparison by Country (2016-2032)
- Figure 103: APAC Female Infertility Drugs Market Share Comparison by Type (2016-2032)
- Figure 104: APAC Female Infertility Drugs Market Share Comparison by Route of Administration (2016-2032)
- Figure 105: APAC Female Infertility Drugs Market Share Comparison by Treatment Setting (2016-2032)
- Figure 106: Latin America Female Infertility Drugs Market Revenue (US$ Mn) Market Share by Typein 2022
- Figure 107: Latin America Female Infertility Drugs Market Attractiveness Analysis by Type, 2016-2032
- Figure 108: Latin America Female Infertility Drugs Market Revenue (US$ Mn) Market Share by Route of Administrationin 2022
- Figure 109: Latin America Female Infertility Drugs Market Attractiveness Analysis by Route of Administration, 2016-2032
- Figure 110: Latin America Female Infertility Drugs Market Revenue (US$ Mn) Market Share by Treatment Settingin 2022
- Figure 111: Latin America Female Infertility Drugs Market Attractiveness Analysis by Treatment Setting, 2016-2032
- Figure 112: Latin America Female Infertility Drugs Market Revenue (US$ Mn) Market Share by Country in 2022
- Figure 113: Latin America Female Infertility Drugs Market Attractiveness Analysis by Country, 2016-2032
- Figure 114: Latin America Female Infertility Drugs Market Revenue (US$ Mn) (2016-2032)
- Figure 115: Latin America Female Infertility Drugs Market Revenue (US$ Mn) Comparison by Country (2016-2032)
- Figure 116: Latin America Female Infertility Drugs Market Revenue (US$ Mn) Comparison by Type (2016-2032)
- Figure 117: Latin America Female Infertility Drugs Market Revenue (US$ Mn) Comparison by Route of Administration (2016-2032)
- Figure 118: Latin America Female Infertility Drugs Market Revenue (US$ Mn) Comparison by Treatment Setting (2016-2032)
- Figure 119: Latin America Female Infertility Drugs Market Y-o-Y Growth Rate Comparison by Country (2016-2032)
- Figure 120: Latin America Female Infertility Drugs Market Y-o-Y Growth Rate Comparison by Type (2016-2032)
- Figure 121: Latin America Female Infertility Drugs Market Y-o-Y Growth Rate Comparison by Route of Administration (2016-2032)
- Figure 122: Latin America Female Infertility Drugs Market Y-o-Y Growth Rate Comparison by Treatment Setting (2016-2032)
- Figure 123: Latin America Female Infertility Drugs Market Share Comparison by Country (2016-2032)
- Figure 124: Latin America Female Infertility Drugs Market Share Comparison by Type (2016-2032)
- Figure 125: Latin America Female Infertility Drugs Market Share Comparison by Route of Administration (2016-2032)
- Figure 126: Latin America Female Infertility Drugs Market Share Comparison by Treatment Setting (2016-2032)
- Figure 127: Middle East & Africa Female Infertility Drugs Market Revenue (US$ Mn) Market Share by Typein 2022
- Figure 128: Middle East & Africa Female Infertility Drugs Market Attractiveness Analysis by Type, 2016-2032
- Figure 129: Middle East & Africa Female Infertility Drugs Market Revenue (US$ Mn) Market Share by Route of Administrationin 2022
- Figure 130: Middle East & Africa Female Infertility Drugs Market Attractiveness Analysis by Route of Administration, 2016-2032
- Figure 131: Middle East & Africa Female Infertility Drugs Market Revenue (US$ Mn) Market Share by Treatment Settingin 2022
- Figure 132: Middle East & Africa Female Infertility Drugs Market Attractiveness Analysis by Treatment Setting, 2016-2032
- Figure 133: Middle East & Africa Female Infertility Drugs Market Revenue (US$ Mn) Market Share by Country in 2022
- Figure 134: Middle East & Africa Female Infertility Drugs Market Attractiveness Analysis by Country, 2016-2032
- Figure 135: Middle East & Africa Female Infertility Drugs Market Revenue (US$ Mn) (2016-2032)
- Figure 136: Middle East & Africa Female Infertility Drugs Market Revenue (US$ Mn) Comparison by Country (2016-2032)
- Figure 137: Middle East & Africa Female Infertility Drugs Market Revenue (US$ Mn) Comparison by Type (2016-2032)
- Figure 138: Middle East & Africa Female Infertility Drugs Market Revenue (US$ Mn) Comparison by Route of Administration (2016-2032)
- Figure 139: Middle East & Africa Female Infertility Drugs Market Revenue (US$ Mn) Comparison by Treatment Setting (2016-2032)
- Figure 140: Middle East & Africa Female Infertility Drugs Market Y-o-Y Growth Rate Comparison by Country (2016-2032)
- Figure 141: Middle East & Africa Female Infertility Drugs Market Y-o-Y Growth Rate Comparison by Type (2016-2032)
- Figure 142: Middle East & Africa Female Infertility Drugs Market Y-o-Y Growth Rate Comparison by Route of Administration (2016-2032)
- Figure 143: Middle East & Africa Female Infertility Drugs Market Y-o-Y Growth Rate Comparison by Treatment Setting (2016-2032)
- Figure 144: Middle East & Africa Female Infertility Drugs Market Share Comparison by Country (2016-2032)
- Figure 145: Middle East & Africa Female Infertility Drugs Market Share Comparison by Type (2016-2032)
- Figure 146: Middle East & Africa Female Infertility Drugs Market Share Comparison by Route of Administration (2016-2032)
- Figure 147: Middle East & Africa Female Infertility Drugs Market Share Comparison by Treatment Setting (2016-2032)
- List of Tables
- Table 1: Global Female Infertility Drugs Market Comparison by Type (2016-2032)
- Table 2: Global Female Infertility Drugs Market Comparison by Route of Administration (2016-2032)
- Table 3: Global Female Infertility Drugs Market Comparison by Treatment Setting (2016-2032)
- Table 4: Global Female Infertility Drugs Market Revenue (US$ Mn) Comparison by Region (2016-2032)
- Table 5: Global Female Infertility Drugs Market Revenue (US$ Mn) (2016-2032)
- Table 6: Global Female Infertility Drugs Market Revenue (US$ Mn) Comparison by Region (2016-2032)
- Table 7: Global Female Infertility Drugs Market Revenue (US$ Mn) Comparison by Type (2016-2032)
- Table 8: Global Female Infertility Drugs Market Revenue (US$ Mn) Comparison by Route of Administration (2016-2032)
- Table 9: Global Female Infertility Drugs Market Revenue (US$ Mn) Comparison by Treatment Setting (2016-2032)
- Table 10: Global Female Infertility Drugs Market Y-o-Y Growth Rate Comparison by Region (2016-2032)
- Table 11: Global Female Infertility Drugs Market Y-o-Y Growth Rate Comparison by Type (2016-2032)
- Table 12: Global Female Infertility Drugs Market Y-o-Y Growth Rate Comparison by Route of Administration (2016-2032)
- Table 13: Global Female Infertility Drugs Market Y-o-Y Growth Rate Comparison by Treatment Setting (2016-2032)
- Table 14: Global Female Infertility Drugs Market Share Comparison by Region (2016-2032)
- Table 15: Global Female Infertility Drugs Market Share Comparison by Type (2016-2032)
- Table 16: Global Female Infertility Drugs Market Share Comparison by Route of Administration (2016-2032)
- Table 17: Global Female Infertility Drugs Market Share Comparison by Treatment Setting (2016-2032)
- Table 18: North America Female Infertility Drugs Market Comparison by Route of Administration (2016-2032)
- Table 19: North America Female Infertility Drugs Market Comparison by Treatment Setting (2016-2032)
- Table 20: North America Female Infertility Drugs Market Revenue (US$ Mn) Comparison by Country (2016-2032)
- Table 21: North America Female Infertility Drugs Market Revenue (US$ Mn) (2016-2032)
- Table 22: North America Female Infertility Drugs Market Revenue (US$ Mn) Comparison by Country (2016-2032)
- Table 23: North America Female Infertility Drugs Market Revenue (US$ Mn) Comparison by Type (2016-2032)
- Table 24: North America Female Infertility Drugs Market Revenue (US$ Mn) Comparison by Route of Administration (2016-2032)
- Table 25: North America Female Infertility Drugs Market Revenue (US$ Mn) Comparison by Treatment Setting (2016-2032)
- Table 26: North America Female Infertility Drugs Market Y-o-Y Growth Rate Comparison by Country (2016-2032)
- Table 27: North America Female Infertility Drugs Market Y-o-Y Growth Rate Comparison by Type (2016-2032)
- Table 28: North America Female Infertility Drugs Market Y-o-Y Growth Rate Comparison by Route of Administration (2016-2032)
- Table 29: North America Female Infertility Drugs Market Y-o-Y Growth Rate Comparison by Treatment Setting (2016-2032)
- Table 30: North America Female Infertility Drugs Market Share Comparison by Country (2016-2032)
- Table 31: North America Female Infertility Drugs Market Share Comparison by Type (2016-2032)
- Table 32: North America Female Infertility Drugs Market Share Comparison by Route of Administration (2016-2032)
- Table 33: North America Female Infertility Drugs Market Share Comparison by Treatment Setting (2016-2032)
- Table 34: Western Europe Female Infertility Drugs Market Comparison by Type (2016-2032)
- Table 35: Western Europe Female Infertility Drugs Market Comparison by Route of Administration (2016-2032)
- Table 36: Western Europe Female Infertility Drugs Market Comparison by Treatment Setting (2016-2032)
- Table 37: Western Europe Female Infertility Drugs Market Revenue (US$ Mn) Comparison by Country (2016-2032)
- Table 38: Western Europe Female Infertility Drugs Market Revenue (US$ Mn) (2016-2032)
- Table 39: Western Europe Female Infertility Drugs Market Revenue (US$ Mn) Comparison by Country (2016-2032)
- Table 40: Western Europe Female Infertility Drugs Market Revenue (US$ Mn) Comparison by Type (2016-2032)
- Table 41: Western Europe Female Infertility Drugs Market Revenue (US$ Mn) Comparison by Route of Administration (2016-2032)
- Table 42: Western Europe Female Infertility Drugs Market Revenue (US$ Mn) Comparison by Treatment Setting (2016-2032)
- Table 43: Western Europe Female Infertility Drugs Market Y-o-Y Growth Rate Comparison by Country (2016-2032)
- Table 44: Western Europe Female Infertility Drugs Market Y-o-Y Growth Rate Comparison by Type (2016-2032)
- Table 45: Western Europe Female Infertility Drugs Market Y-o-Y Growth Rate Comparison by Route of Administration (2016-2032)
- Table 46: Western Europe Female Infertility Drugs Market Y-o-Y Growth Rate Comparison by Treatment Setting (2016-2032)
- Table 47: Western Europe Female Infertility Drugs Market Share Comparison by Country (2016-2032)
- Table 48: Western Europe Female Infertility Drugs Market Share Comparison by Type (2016-2032)
- Table 49: Western Europe Female Infertility Drugs Market Share Comparison by Route of Administration (2016-2032)
- Table 50: Western Europe Female Infertility Drugs Market Share Comparison by Treatment Setting (2016-2032)
- Table 51: Eastern Europe Female Infertility Drugs Market Comparison by Type (2016-2032)
- Table 52: Eastern Europe Female Infertility Drugs Market Comparison by Route of Administration (2016-2032)
- Table 53: Eastern Europe Female Infertility Drugs Market Comparison by Treatment Setting (2016-2032)
- Table 54: Eastern Europe Female Infertility Drugs Market Revenue (US$ Mn) Comparison by Country (2016-2032)
- Table 55: Eastern Europe Female Infertility Drugs Market Revenue (US$ Mn) (2016-2032)
- Table 56: Eastern Europe Female Infertility Drugs Market Revenue (US$ Mn) Comparison by Country (2016-2032)
- Table 57: Eastern Europe Female Infertility Drugs Market Revenue (US$ Mn) Comparison by Type (2016-2032)
- Table 58: Eastern Europe Female Infertility Drugs Market Revenue (US$ Mn) Comparison by Route of Administration (2016-2032)
- Table 59: Eastern Europe Female Infertility Drugs Market Revenue (US$ Mn) Comparison by Treatment Setting (2016-2032)
- Table 60: Eastern Europe Female Infertility Drugs Market Y-o-Y Growth Rate Comparison by Country (2016-2032)
- Table 61: Eastern Europe Female Infertility Drugs Market Y-o-Y Growth Rate Comparison by Type (2016-2032)
- Table 62: Eastern Europe Female Infertility Drugs Market Y-o-Y Growth Rate Comparison by Route of Administration (2016-2032)
- Table 63: Eastern Europe Female Infertility Drugs Market Y-o-Y Growth Rate Comparison by Treatment Setting (2016-2032)
- Table 64: Eastern Europe Female Infertility Drugs Market Share Comparison by Country (2016-2032)
- Table 65: Eastern Europe Female Infertility Drugs Market Share Comparison by Type (2016-2032)
- Table 66: Eastern Europe Female Infertility Drugs Market Share Comparison by Route of Administration (2016-2032)
- Table 67: Eastern Europe Female Infertility Drugs Market Share Comparison by Treatment Setting (2016-2032)
- Table 68: APAC Female Infertility Drugs Market Comparison by Type (2016-2032)
- Table 69: APAC Female Infertility Drugs Market Comparison by Route of Administration (2016-2032)
- Table 70: APAC Female Infertility Drugs Market Comparison by Treatment Setting (2016-2032)
- Table 71: APAC Female Infertility Drugs Market Revenue (US$ Mn) Comparison by Country (2016-2032)
- Table 72: APAC Female Infertility Drugs Market Revenue (US$ Mn) (2016-2032)
- Table 73: APAC Female Infertility Drugs Market Revenue (US$ Mn) Comparison by Country (2016-2032)
- Table 74: APAC Female Infertility Drugs Market Revenue (US$ Mn) Comparison by Type (2016-2032)
- Table 75: APAC Female Infertility Drugs Market Revenue (US$ Mn) Comparison by Route of Administration (2016-2032)
- Table 76: APAC Female Infertility Drugs Market Revenue (US$ Mn) Comparison by Treatment Setting (2016-2032)
- Table 77: APAC Female Infertility Drugs Market Y-o-Y Growth Rate Comparison by Country (2016-2032)
- Table 78: APAC Female Infertility Drugs Market Y-o-Y Growth Rate Comparison by Type (2016-2032)
- Table 79: APAC Female Infertility Drugs Market Y-o-Y Growth Rate Comparison by Route of Administration (2016-2032)
- Table 80: APAC Female Infertility Drugs Market Y-o-Y Growth Rate Comparison by Treatment Setting (2016-2032)
- Table 81: APAC Female Infertility Drugs Market Share Comparison by Country (2016-2032)
- Table 82: APAC Female Infertility Drugs Market Share Comparison by Type (2016-2032)
- Table 83: APAC Female Infertility Drugs Market Share Comparison by Route of Administration (2016-2032)
- Table 84: APAC Female Infertility Drugs Market Share Comparison by Treatment Setting (2016-2032)
- Table 85: Latin America Female Infertility Drugs Market Comparison by Type (2016-2032)
- Table 86: Latin America Female Infertility Drugs Market Comparison by Route of Administration (2016-2032)
- Table 87: Latin America Female Infertility Drugs Market Comparison by Treatment Setting (2016-2032)
- Table 88: Latin America Female Infertility Drugs Market Revenue (US$ Mn) Comparison by Country (2016-2032)
- Table 89: Latin America Female Infertility Drugs Market Revenue (US$ Mn) (2016-2032)
- Table 90: Latin America Female Infertility Drugs Market Revenue (US$ Mn) Comparison by Country (2016-2032)
- Table 91: Latin America Female Infertility Drugs Market Revenue (US$ Mn) Comparison by Type (2016-2032)
- Table 92: Latin America Female Infertility Drugs Market Revenue (US$ Mn) Comparison by Route of Administration (2016-2032)
- Table 93: Latin America Female Infertility Drugs Market Revenue (US$ Mn) Comparison by Treatment Setting (2016-2032)
- Table 94: Latin America Female Infertility Drugs Market Y-o-Y Growth Rate Comparison by Country (2016-2032)
- Table 95: Latin America Female Infertility Drugs Market Y-o-Y Growth Rate Comparison by Type (2016-2032)
- Table 96: Latin America Female Infertility Drugs Market Y-o-Y Growth Rate Comparison by Route of Administration (2016-2032)
- Table 97: Latin America Female Infertility Drugs Market Y-o-Y Growth Rate Comparison by Treatment Setting (2016-2032)
- Table 98: Latin America Female Infertility Drugs Market Share Comparison by Country (2016-2032)
- Table 99: Latin America Female Infertility Drugs Market Share Comparison by Type (2016-2032)
- Table 100: Latin America Female Infertility Drugs Market Share Comparison by Route of Administration (2016-2032)
- Table 101: Latin America Female Infertility Drugs Market Share Comparison by Treatment Setting (2016-2032)
- Table 102: Middle East & Africa Female Infertility Drugs Market Comparison by Type (2016-2032)
- Table 103: Middle East & Africa Female Infertility Drugs Market Comparison by Route of Administration (2016-2032)
- Table 104: Middle East & Africa Female Infertility Drugs Market Comparison by Treatment Setting (2016-2032)
- Table 105: Middle East & Africa Female Infertility Drugs Market Revenue (US$ Mn) Comparison by Country (2016-2032)
- Table 106: Middle East & Africa Female Infertility Drugs Market Revenue (US$ Mn) (2016-2032)
- Table 107: Middle East & Africa Female Infertility Drugs Market Revenue (US$ Mn) Comparison by Country (2016-2032)
- Table 108: Middle East & Africa Female Infertility Drugs Market Revenue (US$ Mn) Comparison by Type (2016-2032)
- Table 109: Middle East & Africa Female Infertility Drugs Market Revenue (US$ Mn) Comparison by Route of Administration (2016-2032)
- Table 110: Middle East & Africa Female Infertility Drugs Market Revenue (US$ Mn) Comparison by Treatment Setting (2016-2032)
- Table 111: Middle East & Africa Female Infertility Drugs Market Y-o-Y Growth Rate Comparison by Country (2016-2032)
- Table 112: Middle East & Africa Female Infertility Drugs Market Y-o-Y Growth Rate Comparison by Type (2016-2032)
- Table 113: Middle East & Africa Female Infertility Drugs Market Y-o-Y Growth Rate Comparison by Route of Administration (2016-2032)
- Table 114: Middle East & Africa Female Infertility Drugs Market Y-o-Y Growth Rate Comparison by Treatment Setting (2016-2032)
- Table 115: Middle East & Africa Female Infertility Drugs Market Share Comparison by Country (2016-2032)
- Table 116: Middle East & Africa Female Infertility Drugs Market Share Comparison by Type (2016-2032)
- Table 117: Middle East & Africa Female Infertility Drugs Market Share Comparison by Route of Administration (2016-2032)
- Table 118: Middle East & Africa Female Infertility Drugs Market Share Comparison by Treatment Setting (2016-2032)
- 1. Executive Summary
-
- Abbott Duphaston
- Sanofi S.A.
- Merck & Co., Inc.
- Novartis AG
- Ferring B.V.
- Berlex Laboratories Inc.
- Eli Lilly and Co.
- Serono Inc.
- Novogyne Pharmaceuticals
- Pfizer, Inc.
- Ferring Pharmaceuticals Inc
- Pfizer Inc.
- Merck KGaA
- Novartis International AG
- Bayer AG
- Organon Group of Companies
Our Clients


View Our Licence Options
