
Extended Reality (XR) Market by Component(Hardware, Software, Service), By Type (Virtual Reality, Augmented Reality, Mixed Reality) By End-User (Gaming, Retail and Other), By Region And Companies - Industry Segment Outlook, Market Assessment, Competition Scenario, Trends, And Forecast Period 2024-2033
-
51279
-
Sept 2024
-
235
-


-
This report was compiled by Vishwa Gaul Vishwa is an experienced market research and consulting professional with over 8 years of expertise in the ICT industry, contributing to over 700 reports across telecommunications, software, hardware, and digital solutions. Correspondence Team Lead- ICT Linkedin | Detailed Market research Methodology Our methodology involves a mix of primary research, including interviews with leading mental health experts, and secondary research from reputable medical journals and databases. View Detailed Methodology Page
-
Quick Navigation
- Report Overview
- Key Takeaways
- Driving Factors
- Restraining Factors
- By Component Analysis
- Software Segment Dominates Extended Reality (XR) Market with Over 45% Largest Share in 2023
- By Type Analysis
- By End-User Analysis
- Key Market Segments
- Growth Opportunity
- Increased Adoption in Education and Training
- Latest Trends
- Regional Analysis
- Key Players Analysis
- Recent Developments
- Report Scope
Report Overview
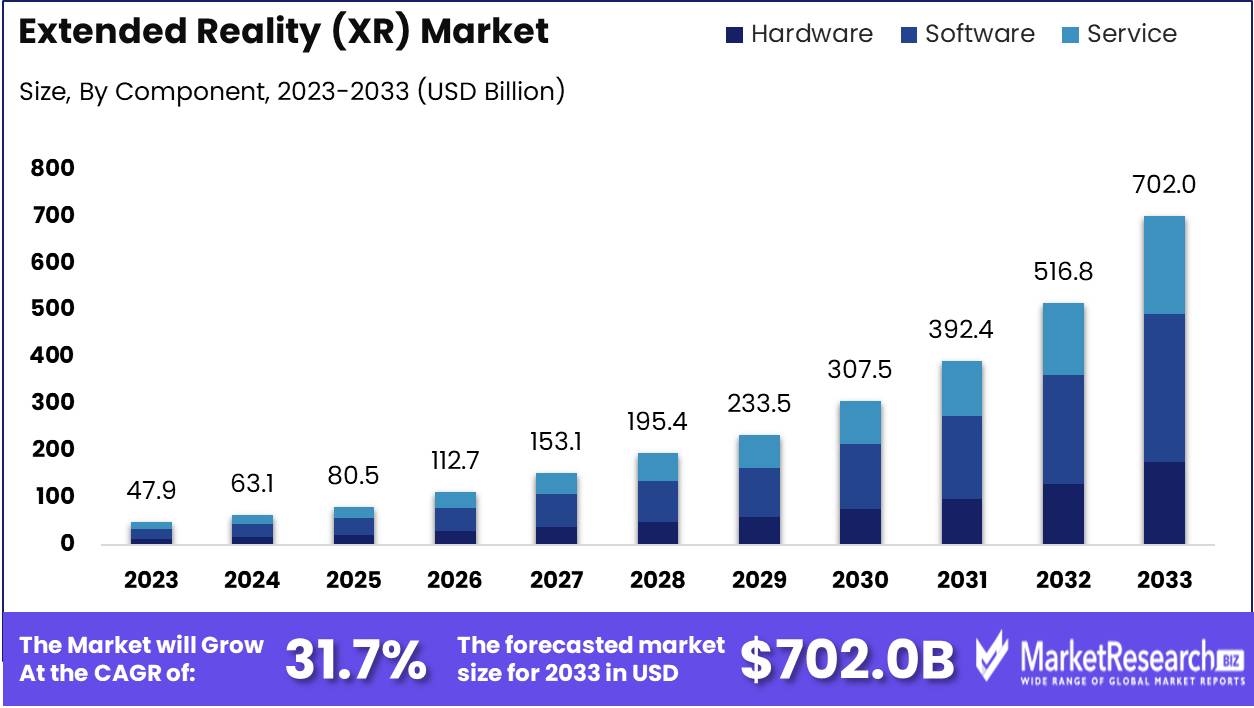
The Extended Reality (XR) Market size was valued at USD 47.9 Billion in 2023. It is expected to reach USD 702.0 Billion by 2033, with a Compound annual growth rate (CAGR) of 31.7% during the forecast period from 2024 to 2033.
The Extended Reality (XR) Market encompasses technologies that merge digital and physical environments to create immersive user experiences. This market includes virtual reality (VR), augmented reality (AR), and mixed reality (MR) technologies, each enabling interactive real-time applications across various industries. XR's applications are broad, ranging from advanced gaming and entertainment to practical training simulations in healthcare, military, and engineering. As digital transformation accelerates, XR is becoming critical for enhancing customer engagement, streamlining operations, and creating innovative solutions that blend the real with the virtual, thereby driving substantial growth in the tech sector
The Extended Reality market is poised for significant growth, driven by rapid advancements in hardware, software, and network technologies. XR, encompassing augmented reality (AR), virtual reality (VR), and mixed reality (MR), is increasingly seen as a transformative tool across industries, from gaming and entertainment to enterprise and healthcare. The collaboration between major technology players such as Qualcomm, Google, and Samsung on the Snapdragon XR2+ Gen 2 chipset, launched in early 2024, marks a pivotal moment for the sector. This chipset enhances visual fidelity and performance, particularly in AR and VR devices, while targeting enterprise applications. Such innovations are expected to drive XR adoption in both gaming and workplace settings.
Additionally, partnerships like that of OnePlus and Qualcomm in 2023, which introduced Snapdragon Spaces XR features to mobile devices, further expand XR’s potential in the consumer market. Companies such as Meta and Sphere continue to advance XR with strategic innovations—Meta’s AR smart glasses and Quest VR headset pricing strategy aim to broaden consumer access, while Sphere’s immersive cooperation software sets new benchmarks for enterprise collaboration.
In parallel, Accenture’s investment in VR digital therapeutics reflects XR’s potential beyond entertainment, with applications in health and wellness gaining traction. Educational initiatives, like the XR4ED project by CYENS, further illustrate XR's broadening scope. The integration of 5G technology enhances the ecosystem, providing the necessary infrastructure for seamless, high-definition experiences, making XR solutions more effective in sectors such as healthcare, education, and industrial applications. As demand for immersive experiences rises, XR stands at the intersection of technological advancement and industry transformation.
Key Takeaways
- Market Growth : The Extended Reality Market Size was valued at USD 47.9 billion in 2023 and is projected to grow at a compound annual growth rate (CAGR) of 31.7%, reaching USD 702.0 billion by 2033.
- Technological Advancements: The integration of 5G networks and advancements in immersive software, like those from Meta, Sphere, and Accenture, are enhancing the performance and adoption of XR technologies.
- Enterprise and Consumer Adoption: Accelerating demand in sectors such as gaming, education, healthcare, and industrial applications is driving market expansion, with enterprises adopting XR solutions for workplace productivity and training.
- Analyst Viewpoint: The Extended Reality (XR) market is poised for exponential growth, driven by advancements in technologies like 5G, and increasing integration across various sectors including gaming, healthcare, and education.
- By Component: The Software segment dominates the Extended Reality (XR) market with over 45% of the market share in 2023.
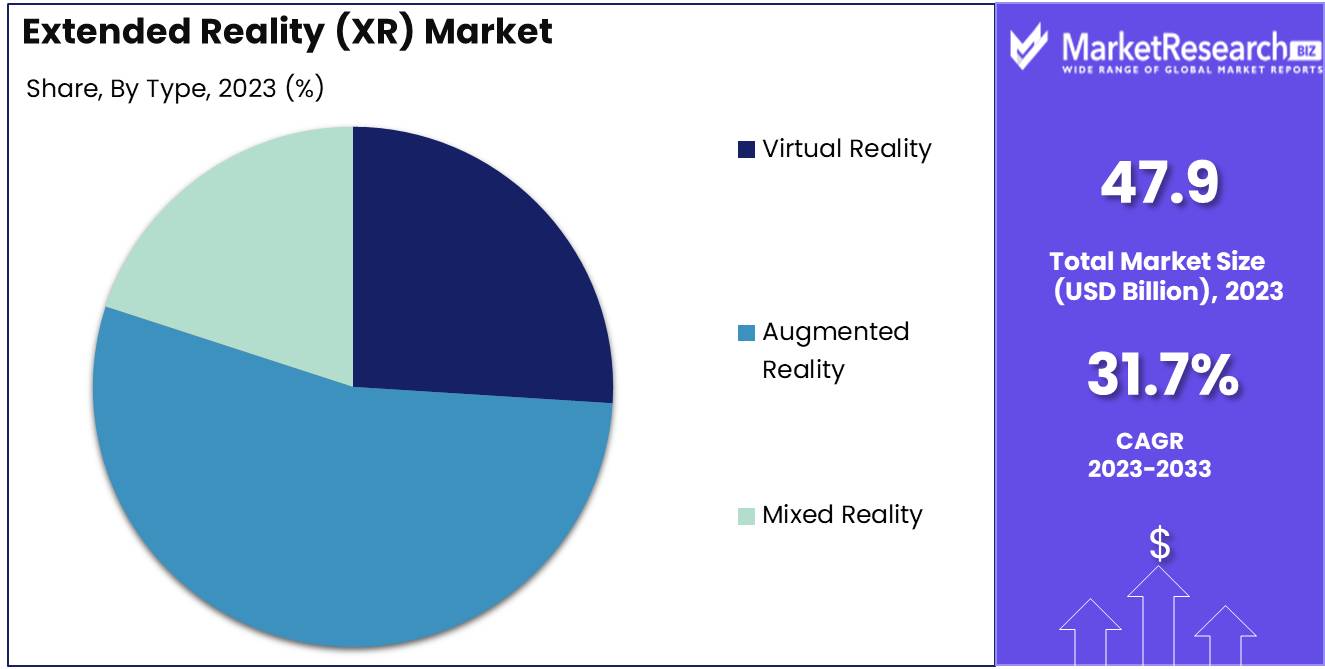
- By Type: Augmented Reality (AR) leads the Extended Reality (XR) market types with over 54.0% market share in 2023.
- By End-User: Gaming emerges as the leading end-user segment, commanding a 47.0% share of the XR market in 2023.
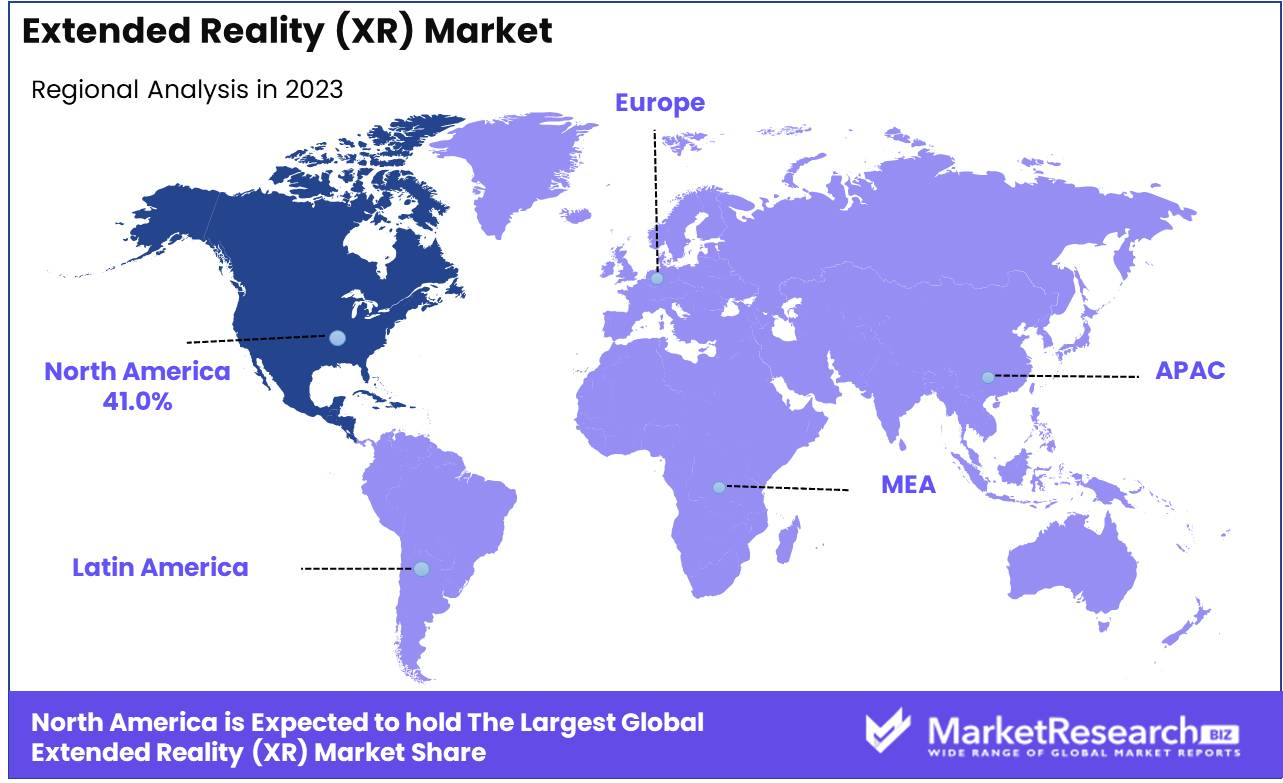
- Regional Growth: North America holds the largest revenue share in the global extended reality market, accounting for 41.0% in 2023.
- Growth Opportunity: The surge in consumer interest in VR for gaming and entertainment significantly accelerates XR market growth.
- Restraining Factor: High costs and complex hardware development are major barriers to the wider adoption of XR technologies, impacting market expansion and innovation.
Driving Factors
Rising Demand for VR Devices for Gaming and Entertainment
The surge in consumer interest in virtual reality (VR) devices, particularly for gaming and entertainment, plays a pivotal role in accelerating the growth of the Extended Reality (XR) market. Gaming has emerged as a dominant sector, with the global VR gaming market projected to exceed $92 billion by 2027, according to industry forecasts. This growth is driven by the immersive experience VR offers, providing users with a level of engagement and interactivity far beyond traditional platforms. Popular VR devices, such as the Oculus Quest 2 and Sony PlayStation VR, have seen substantial sales growth, as demand for realistic and engaging gaming environments continues to rise.
Beyond gaming, VR is gaining traction in entertainment, especially in areas like virtual concerts, theme parks, and cinematic experiences. Major entertainment companies are investing in XR technologies to enhance audience engagement, creating new revenue streams. These advancements not only increase demand for VR devices but also position XR as an essential technology for the future of interactive content. This demand drives manufacturers to innovate and reduce the costs of VR headsets, making them more accessible to a broader consumer base, thus propelling the XR market’s expansion.
Advancement of 5G Technology
The advancement of 5G technology is another critical enabler of XR market growth, facilitating the real-time, low-latency experiences necessary for immersive applications. 5G networks offer faster speeds and higher bandwidth than their predecessors, which are essential for seamless XR applications like augmented reality (AR), virtual reality (VR), and mixed reality (MR). The global rollout of 5G infrastructure is expected to play a crucial role in the XR market's growth, with the number of 5G subscriptions expected to reach 4.6 billion by 2028.
5G technology supports the high data transfer rates required for cloud-based XR experiences, where content and computations are hosted remotely, reducing the hardware load on devices. This enables lighter, more affordable, and portable XR devices. For industries such as healthcare, education, and retail, 5G unlocks new possibilities, including real-time AR-guided surgeries, immersive virtual learning, and enhanced customer experiences in digital commerce. By providing a backbone that can handle the immense data requirements of XR technologies, 5G amplifies the capacity for innovation within the market, leading to broader adoption and continuous growth.
Restraining Factors
High Costs of Implementation
The high costs associated with the implementation of Extended Reality (XR) technologies represent a significant restraining factor in the market's growth trajectory. These costs stem from both the initial investment in technology and the ongoing expenses related to software development, system integration, and maintenance. High implementation costs can deter small to medium enterprises (SMEs) and startups from adopting XR solutions, which in turn limits market expansion to larger, more financially robust entities.
The financial burden of XR implementation is compounded by the need for specialized hardware and software that are often costly to develop and purchase. This factor not only restricts the accessibility of XR technologies but also impacts the rate of innovation within the market. Companies may be less inclined to invest in advanced XR technologies if the return on investment (ROI) is not immediately apparent or if it poses substantial financial risks.
Hardware Development Challenges
Hardware development challenges are closely intertwined with the high costs of implementation, serving as another critical restraining factor for the XR market. Developing cutting-edge XR hardware, such as headsets, wearable devices, and motion tracking technology, requires significant investment in research and development (R&D). These challenges are exacerbated by the rapid pace of technological advancement, which demands continuous updates and iterations of hardware to keep up with market expectations and competitive pressures.
The complexity of creating user-friendly, lightweight, and powerful XR hardware further escalates the costs and extends the development timelines, thereby slowing market growth. Moreover, hardware limitations often restrict the scope of possible XR applications, affecting user experience and adoption rates. For instance, issues such as limited battery life, cumbersome user interfaces, and poor ergonomic design can detract from user satisfaction and limit practical use cases.
By Component Analysis
In 2023, Software held a dominant market position in the "By Component" segment of the Extended Reality (XR) market, capturing over 45% of the total market share. The hardware and services segments followed, with software emerging as the critical enabler of XR applications across various industries. This strong performance is driven by the increasing demand for immersive experiences in sectors such as gaming, healthcare, and education, where software acts as the foundational layer, enabling advanced functionalities like spatial computing, real-time processing, and 3D modeling. The rapid advancements in AI and machine learning have further enhanced XR software's capabilities, making it indispensable for delivering seamless, interactive, and scalable solutions.
Meanwhile, the hardware segment accounted for a significant share, driven by the growing adoption of headsets, sensors, and other input devices required for XR experiences. However, hardware’s growth is expected to moderate as it matures and the focus shifts to enhancing the user experience through software innovation. The services segment, while still developing, is gaining momentum as businesses seek custom solutions and support for XR integration. As enterprises increasingly embrace XR for training, collaboration, and customer engagement, the service component is poised for significant growth, further reinforcing the holistic nature of the XR ecosystem.
By Type Analysis
Augmented Reality Dominates the Extended Reality (XR) Market with Over 54.0% Largest Market Share in 2023
In 2023, Augmented Reality (AR) held a dominant market position in the "By Type" segment of the Extended Reality (XR) market, capturing more than 54.0% of the market share. AR's significant lead in this segment can be attributed to its widespread adoption across various industries, including retail, healthcare, and manufacturing. The technology’s ability to overlay digital content in real-world environments has proven particularly valuable for applications such as remote assistance, interactive customer experiences, and advanced training programs.
Virtual Reality (VR) and Mixed Reality (MR), while also experiencing growth, trailed AR in market share. VR accounted for approximately 28.5% of the segment, driven largely by its prominence in gaming, entertainment, and immersive simulation training. Mixed Reality (MR), the convergence of both AR and VR, held a smaller share at around 17.5%, but is anticipated to gain momentum as industries increasingly invest in more advanced, integrated XR solutions for real-time collaboration and productivity enhancement.
Overall, AR's versatility and lower barriers to entry compared to VR and MR have positioned it as the leading XR technology in 2023. However, with ongoing technological advancements, particularly in the hardware and software ecosystems of VR and MR, the competitive dynamics within the XR market could shift in the coming years.
By End-User Analysis
Gaming Dominates the Extended Reality (XR) Market with a 47.0% Market Share in
In 2023, the gaming industry emerged as the dominant force within the End-User segment of the Extended Reality (XR) market, capturing over 47.0% of the total market share. This substantial presence highlights the crucial role the gaming industry plays in driving the adoption and growth of XR technologies. The inherently immersive nature of gaming aligns seamlessly with XR's capabilities, offering users an interactive and engaging experience through virtual reality (VR), augmented reality (AR), and mixed reality (MR). With ongoing advancements in graphics processing, user interfaces, and 5G technology, the gaming industry continues to capitalize on XR’s potential, further expanding its market influence.
Beyond the gaming industry, other segments such as Retail, Healthcare, Manufacturing, the entertainment sector, Education, Aerospace and Defense, and various other industries have been incorporating XR at a slower pace. These sectors are progressively acknowledging the benefits XR offers for training, simulation, and customer engagement, though their combined market share remains smaller compared to the gaming industry. Nevertheless, sectors like Healthcare and Manufacturing are projected to witness significant growth in XR adoption as technological barriers decrease and use cases, particularly in medical training and industrial design, broaden.
Looking ahead, the XR market's expansion across sectors beyond the gaming industry and entertainment sector is expected to accelerate as the technology matures and becomes more affordable. However, the gaming industry is anticipated to maintain its leading position in the near term, driven by sustained demand for immersive experiences and continuous innovations in hardware and software designed to enhance user engagement.
Key Market Segments
By Component
- Hardware
- Software
- Service
By Type
- Virtual Reality
- Augmented Reality
- Mixed Reality
By End-User
- Gaming
- Retail
- Healthcare
- Manufacturing
Media and Entertainment - Education
- Aerospace and Defense
- Other
Growth Opportunity
Increased Adoption in Education and Training
One of the most promising areas for XR is education and training. The immersive nature of XR technologies, including Virtual Reality (VR) and Augmented Reality (AR), offers students and professionals enhanced engagement and practical, hands-on learning environments. From medical simulations to corporate training, XR reduces the cost and complexity of delivering real-world scenarios in a controlled, repeatable manner. Companies like Meta and Microsoft are already deploying these solutions, anticipating that the market for XR in education alone could surpass $20 billion by 2025.
Growing Demand for Immersive Experiences
Consumer demand for more immersive experiences is another key driver of XR market growth. With advancements in hardware and software, immersive content is becoming increasingly accessible, particularly in the entertainment and gaming sectors. Moreover, XR is being used to enhance customer experiences in retail, tourism, and real estate, where virtual walkthroughs and interactive content are gaining traction. This growing demand underscores a significant opportunity for brands and developers to create unique, immersive digital experiences that can differentiate their offerings.
Latest Trends
Advancements in AR and VR
In 2024, AR and VR technologies are expected to see breakthroughs in both hardware and software. Lighter, more affordable headsets and advancements in display technologies, such as micro-LED and OLED, will improve user comfort and visual quality. Simultaneously, software enhancements will offer more intuitive and engaging experiences, particularly in education, training, and enterprise applications. These advancements will broaden XR’s appeal to both consumers and businesses.
Immersive Content Development
As XR hardware becomes more accessible, content creation will be a crucial differentiator. The demand for immersive and interactive content will rise, particularly in entertainment, marketing, and education. Tools that simplify the creation of 3D and interactive experiences will empower developers and drive innovation, enhancing the overall XR ecosystem.
Regional Analysis
The Extended Reality (XR) market is experiencing substantial growth across various regions, driven by advancements in immersive technologies and increasing adoption across industries such as entertainment, healthcare, education, and manufacturing.
In North America, the region leads the global XR market, accounting for a dominant 41.0% of the largest revenue share. This is primarily due to the early adoption of XR technologies, significant investments in R&D, and strong presence of key players such as Google, Microsoft, and Facebook. The U.S. is the major contributor, followed by Canada, with a well-established tech ecosystem and growing demand for XR in entertainment, healthcare, and industrial applications.
Europe is another significant market, supported by rising governmental initiatives promoting digital transformation, particularly in countries like Germany, France, and the UK. Germany, with its robust automotive and manufacturing industries, has integrated XR for enhanced design, training, and operational efficiency. The UK, being a hub for gaming and creative industries, is seeing rapid XR adoption in entertainment and education sectors. The rest of Europe, including countries like Spain, Italy, and the Netherlands, is also witnessing increased XR deployments.
In the Asia-Pacific region, China and Japan are the largest contributors to XR growth, driven by high consumer demand for immersive entertainment experiences and significant government support for technology innovation. China, in particular, benefits from its advanced manufacturing sector and vast consumer base, making it a key market for XR hardware and applications. Other countries, including South Korea, India, and Singapore, are rapidly integrating XR into their digital economies, driven by increasing industrial automation and digital entertainment consumption.
Latin America is seeing moderate growth, with Brazil and Mexico leading the adoption of XR technologies, particularly in entertainment and education. Economic development and improving digital infrastructure are supporting XR’s gradual uptake, with applications in training and virtual tourism becoming more prevalent.
The Middle East & Africa (MEA) region is an emerging market for XR, with countries like Saudi Arabia, the UAE, and South Africa spearheading adoption. In these regions, XR is being integrated into sectors like construction, oil and gas, and retail to improve operational efficiencies and customer experiences. However, challenges such as lower technological infrastructure in some parts of the region limit wider XR adoption.
Overall, North America remains the dominant region, while Asia-Pacific and Europe represent rapidly growing markets, driven by technological advancements and increasing industry-specific applications of XR.
Key Regions and Countries
North America
- The US
- Canada
- Rest of North America
Europe
- Germany
- France
- The UK
- Spain
- Netherlands
- Russia
- Italy
- Rest of Europe
Asia-Pacific
- China
- Japan
- Singapore
- Thailand
- South Korea
- Vietnam
- India
- New Zealand
- Rest of Asia Pacific
Latin America
- Mexico
- Brazil
- Rest of Latin America
Middle East & Africa
- Saudi Arabia
- South Africa
- UAE
- Rest of Middle East & Africa
Key Players Analysis
The global Extended Reality (XR) market in 2024 is marked by rapid technological advancements and an evolving competitive landscape. Key players are driving innovation across hardware, software, and services, positioning themselves to capitalize on the growing demand for immersive experiences across industries.
HTC Corporation, known for its pioneering VR headsets, continues to lead with high-performance devices targeting both consumers and enterprises. Qualcomm Technologies Inc., leveraging its strength in semiconductor technologies, provides critical XR chipsets, enabling seamless integration of virtual and augmented reality in mobile devices.
Samsung Electronics Co., Ltd. is strategically focused on AR/VR hardware, combining its dominance in display technology with 5G integration to create immersive XR experiences. Microsoft Corporation remains a dominant player with its HoloLens platform, particularly in enterprise solutions for sectors like healthcare and manufacturing.
Consulting firms such as Accenture PLC and Tata Elxsi Limited are integral to XR adoption, offering custom solutions that bridge the gap between emerging technologies and business needs. SoftServe Inc. and Softweb Solutions Inc. (a subsidiary of Avnet Inc.) similarly focus on developing bespoke XR applications tailored to specific industries.
Companies like Intel Corporation and SphereGen Technologies LLC are key in providing the computing power required for XR applications, while Northern Digital Inc. and Varjo Technologies Oy focus on precision tracking and high-fidelity displays.
Xiaomi Corporation and Talespin Reality Labs Inc. add a competitive edge in affordable devices and immersive training platforms, respectively, underscoring the diversity of approaches within the XR space. The collective innovation of these players will drive the XR market’s growth in 2024 and beyond.
Market Key Players
- HTC Corporation
- Qualcomm Technologies Inc.
- Samsung Electronics Co., Ltd
- Accenture PLC
- SoftServe Inc.
- Intel Corporation
- SphereGen Technologies LLC
- Northern Digital Inc.
- Microsoft Corporation
- Softweb Solutions Inc. (Avnet Inc.)
- Tata Elxsi Limited
- Xiaomi Corporation
- Varjo Technologies Oy
- Talespin Reality Labs Inc
- Other
Recent Developments
- In 2024, Qualcomm, Google, and Samsung collaborated to launch the Snapdragon XR2+ Gen 2 chipset. This advanced chipset is designed to enhance visual fidelity and performance in augmented reality (AR), virtual reality (VR), and mixed reality (MR) devices, with a particular focus on enterprise applications. The Snapdragon XR2+ Gen 2 is poised to accelerate the adoption of extended reality (XR) technologies in both gaming and workplace environments.
- In 2023, OnePlus partnered with Qualcomm to integrate Snapdragon Spaces XR features into its devices, offering enhanced mobile XR experiences. This collaboration aims to bring more immersive and interactive extended reality capabilities to the mobile ecosystem.
- In 2023, Sphere: formerly known as holo|one, launched new software that enhances immersive collaboration through XR technologies. This innovative platform integrates advanced translation capabilities, setting a new benchmark for XR-enabled cooperative environments. The release of this software highlights Sphere's leadership in pushing the boundaries of immersive, real-time collaboration.
Report Scope
Report Features Description Market Value (2023) USD 47.9 Bn Forecast Revenue (2033) USD 702.0 Bn CAGR (2024-2032) 31.7% Base Year for Estimation 2023 Historic Period 2016-2023 Forecast Period 2024-2033 Report Coverage Revenue Forecast, Market Dynamics, COVID-19 Impact, Competitive Landscape, Recent Developments Segments Covered By Component(Hardware, Software, Service), By Type (Virtual Reality, Augmented Reality, Mixed Reality) By End-User (Gaming, Retail, Healthcare, Manufacturing, Media and Entertainment, Education, Aerospace and Defense, Other End-Users) Regional Analysis North America - The US, Canada, Rest of North America, Europe - Germany, France, The UK, Spain, Italy, Russia, Netherlands, Rest of Europe, Asia-Pacific - China, Japan, South Korea, India, New Zealand, Singapore, Thailand, Vietnam, Rest of Asia Pacific, Latin America - Brazil, Mexico, Rest of Latin America, Middle East & Africa - South Africa, Saudi Arabia, UAE, Rest of Middle East & Africa Competitive Landscape HTC Corporation, Qualcomm Technologies Inc., Samsung Electronics Co., Ltd, Accenture PLC, SoftServe Inc., Intel Corporation, SphereGen Technologies LLC, Northern Digital Inc., Microsoft Corporation, Softweb Solutions Inc. (Avnet Inc.), Tata Elxsi Limited, Xiaomi Corporation, Varjo Technologies Oy, Talespin Reality Labs Inc, Other Customization Scope Customization for segments, region/country-level will be provided. Moreover, additional customization can be done based on the requirements. Purchase Options We have three licenses to opt for Single User License, Multi-User License (Up to 5 Users), Corporate Use License (Unlimited User and Printable PDF) -
- 1. Executive Summary
- 1.1. Definition
- 1.2. Taxonomy
- 1.3. Research Scope
- 1.4. Key Analysis
- 1.5. Key Findings by Major Segments
- 1.6. Top strategies by Major Players
- 2. Global Extended Reality (XR) Market Overview
- 2.1. Extended Reality (XR) Market Dynamics
- 2.1.1. Drivers
- 2.1.2. Opportunities
- 2.1.3. Restraints
- 2.1.4. Challenges
- 2.2. Macro-economic Factors
- 2.3. Regulatory Framework
- 2.4. Market Investment Feasibility Index
- 2.5. PEST Analysis
- 2.6. PORTER’S Five Force Analysis
- 2.7. Drivers & Restraints Impact Analysis
- 2.8. Industry Chain Analysis
- 2.9. Cost Structure Analysis
- 2.10. Marketing Strategy
- 2.11. Russia-Ukraine War Impact Analysis
- 2.12. Opportunity Map Analysis
- 2.13. Market Competition Scenario Analysis
- 2.14. Product Life Cycle Analysis
- 2.15. Opportunity Orbits
- 2.16. Manufacturer Intensity Map
- 2.17. Major Companies sales by Value & Volume
- 2.1. Extended Reality (XR) Market Dynamics
- 3. Global Extended Reality (XR) Market Analysis, Opportunity and Forecast, 2016-2032
- 3.1. Global Extended Reality (XR) Market Analysis, 2016-2021
- 3.2. Global Extended Reality (XR) Market Opportunity and Forecast, 2023-2032
- 3.3. Global Extended Reality (XR) Market Analysis, Opportunity and Forecast, By By Component, 2016-2032
- 3.3.1. Global Extended Reality (XR) Market Analysis by By Component: Introduction
- 3.3.2. Market Size Absolute $ Opportunity Analysis and Forecast, By By Component, 2016-2032
- 3.3.3. Hardware
- 3.3.4. Software
- 3.3.5. Service
- 3.4. Global Extended Reality (XR) Market Analysis, Opportunity and Forecast, By By Type, 2016-2032
- 3.4.1. Global Extended Reality (XR) Market Analysis by By Type: Introduction
- 3.4.2. Market Size Absolute $ Opportunity Analysis and Forecast, By By Type, 2016-2032
- 3.4.3. Virtual Reality
- 3.4.4. Augmented Reality
- 3.4.5. Mixed Reality
- 3.5. Global Extended Reality (XR) Market Analysis, Opportunity and Forecast, By By End-User, 2016-2032
- 3.5.1. Global Extended Reality (XR) Market Analysis by By End-User: Introduction
- 3.5.2. Market Size Absolute $ Opportunity Analysis and Forecast, By By End-User, 2016-2032
- 3.5.3. Gaming
- 3.5.4. Retail
- 3.5.5. Healthcare
- 3.5.6. Manufacturing
- 3.5.7. Media and Entertainment
- 3.5.8. Education
- 3.5.9. Aerospace and Defense
- 3.5.10. Other
- 4. North America Extended Reality (XR) Market Analysis, Opportunity and Forecast, 2016-2032
- 4.1. North America Extended Reality (XR) Market Analysis, 2016-2021
- 4.2. North America Extended Reality (XR) Market Opportunity and Forecast, 2023-2032
- 4.3. North America Extended Reality (XR) Market Analysis, Opportunity and Forecast, By By Component, 2016-2032
- 4.3.1. North America Extended Reality (XR) Market Analysis by By Component: Introduction
- 4.3.2. Market Size Absolute $ Opportunity Analysis and Forecast, By By Component, 2016-2032
- 4.3.3. Hardware
- 4.3.4. Software
- 4.3.5. Service
- 4.4. North America Extended Reality (XR) Market Analysis, Opportunity and Forecast, By By Type, 2016-2032
- 4.4.1. North America Extended Reality (XR) Market Analysis by By Type: Introduction
- 4.4.2. Market Size Absolute $ Opportunity Analysis and Forecast, By By Type, 2016-2032
- 4.4.3. Virtual Reality
- 4.4.4. Augmented Reality
- 4.4.5. Mixed Reality
- 4.5. North America Extended Reality (XR) Market Analysis, Opportunity and Forecast, By By End-User, 2016-2032
- 4.5.1. North America Extended Reality (XR) Market Analysis by By End-User: Introduction
- 4.5.2. Market Size Absolute $ Opportunity Analysis and Forecast, By By End-User, 2016-2032
- 4.5.3. Gaming
- 4.5.4. Retail
- 4.5.5. Healthcare
- 4.5.6. Manufacturing
- 4.5.7. Media and Entertainment
- 4.5.8. Education
- 4.5.9. Aerospace and Defense
- 4.5.10. Other
- 4.6. North America Extended Reality (XR) Market Analysis, Opportunity and Forecast, By Country , 2016-2032
- 4.6.1. North America Extended Reality (XR) Market Analysis by Country : Introduction
- 4.6.2. Market Size Absolute $ Opportunity Analysis and Forecast, Country , 2016-2032
- 4.6.2.1. The US
- 4.6.2.2. Canada
- 4.6.2.3. Mexico
- 5. Western Europe Extended Reality (XR) Market Analysis, Opportunity and Forecast, 2016-2032
- 5.1. Western Europe Extended Reality (XR) Market Analysis, 2016-2021
- 5.2. Western Europe Extended Reality (XR) Market Opportunity and Forecast, 2023-2032
- 5.3. Western Europe Extended Reality (XR) Market Analysis, Opportunity and Forecast, By By Component, 2016-2032
- 5.3.1. Western Europe Extended Reality (XR) Market Analysis by By Component: Introduction
- 5.3.2. Market Size Absolute $ Opportunity Analysis and Forecast, By By Component, 2016-2032
- 5.3.3. Hardware
- 5.3.4. Software
- 5.3.5. Service
- 5.4. Western Europe Extended Reality (XR) Market Analysis, Opportunity and Forecast, By By Type, 2016-2032
- 5.4.1. Western Europe Extended Reality (XR) Market Analysis by By Type: Introduction
- 5.4.2. Market Size Absolute $ Opportunity Analysis and Forecast, By By Type, 2016-2032
- 5.4.3. Virtual Reality
- 5.4.4. Augmented Reality
- 5.4.5. Mixed Reality
- 5.5. Western Europe Extended Reality (XR) Market Analysis, Opportunity and Forecast, By By End-User, 2016-2032
- 5.5.1. Western Europe Extended Reality (XR) Market Analysis by By End-User: Introduction
- 5.5.2. Market Size Absolute $ Opportunity Analysis and Forecast, By By End-User, 2016-2032
- 5.5.3. Gaming
- 5.5.4. Retail
- 5.5.5. Healthcare
- 5.5.6. Manufacturing
- 5.5.7. Media and Entertainment
- 5.5.8. Education
- 5.5.9. Aerospace and Defense
- 5.5.10. Other
- 5.6. Western Europe Extended Reality (XR) Market Analysis, Opportunity and Forecast, By Country , 2016-2032
- 5.6.1. Western Europe Extended Reality (XR) Market Analysis by Country : Introduction
- 5.6.2. Market Size Absolute $ Opportunity Analysis and Forecast, Country , 2016-2032
- 5.6.2.1. Germany
- 5.6.2.2. France
- 5.6.2.3. The UK
- 5.6.2.4. Spain
- 5.6.2.5. Italy
- 5.6.2.6. Portugal
- 5.6.2.7. Ireland
- 5.6.2.8. Austria
- 5.6.2.9. Switzerland
- 5.6.2.10. Benelux
- 5.6.2.11. Nordic
- 5.6.2.12. Rest of Western Europe
- 6. Eastern Europe Extended Reality (XR) Market Analysis, Opportunity and Forecast, 2016-2032
- 6.1. Eastern Europe Extended Reality (XR) Market Analysis, 2016-2021
- 6.2. Eastern Europe Extended Reality (XR) Market Opportunity and Forecast, 2023-2032
- 6.3. Eastern Europe Extended Reality (XR) Market Analysis, Opportunity and Forecast, By By Component, 2016-2032
- 6.3.1. Eastern Europe Extended Reality (XR) Market Analysis by By Component: Introduction
- 6.3.2. Market Size Absolute $ Opportunity Analysis and Forecast, By By Component, 2016-2032
- 6.3.3. Hardware
- 6.3.4. Software
- 6.3.5. Service
- 6.4. Eastern Europe Extended Reality (XR) Market Analysis, Opportunity and Forecast, By By Type, 2016-2032
- 6.4.1. Eastern Europe Extended Reality (XR) Market Analysis by By Type: Introduction
- 6.4.2. Market Size Absolute $ Opportunity Analysis and Forecast, By By Type, 2016-2032
- 6.4.3. Virtual Reality
- 6.4.4. Augmented Reality
- 6.4.5. Mixed Reality
- 6.5. Eastern Europe Extended Reality (XR) Market Analysis, Opportunity and Forecast, By By End-User, 2016-2032
- 6.5.1. Eastern Europe Extended Reality (XR) Market Analysis by By End-User: Introduction
- 6.5.2. Market Size Absolute $ Opportunity Analysis and Forecast, By By End-User, 2016-2032
- 6.5.3. Gaming
- 6.5.4. Retail
- 6.5.5. Healthcare
- 6.5.6. Manufacturing
- 6.5.7. Media and Entertainment
- 6.5.8. Education
- 6.5.9. Aerospace and Defense
- 6.5.10. Other
- 6.6. Eastern Europe Extended Reality (XR) Market Analysis, Opportunity and Forecast, By Country , 2016-2032
- 6.6.1. Eastern Europe Extended Reality (XR) Market Analysis by Country : Introduction
- 6.6.2. Market Size Absolute $ Opportunity Analysis and Forecast, Country , 2016-2032
- 6.6.2.1. Russia
- 6.6.2.2. Poland
- 6.6.2.3. The Czech Republic
- 6.6.2.4. Greece
- 6.6.2.5. Rest of Eastern Europe
- 7. APAC Extended Reality (XR) Market Analysis, Opportunity and Forecast, 2016-2032
- 7.1. APAC Extended Reality (XR) Market Analysis, 2016-2021
- 7.2. APAC Extended Reality (XR) Market Opportunity and Forecast, 2023-2032
- 7.3. APAC Extended Reality (XR) Market Analysis, Opportunity and Forecast, By By Component, 2016-2032
- 7.3.1. APAC Extended Reality (XR) Market Analysis by By Component: Introduction
- 7.3.2. Market Size Absolute $ Opportunity Analysis and Forecast, By By Component, 2016-2032
- 7.3.3. Hardware
- 7.3.4. Software
- 7.3.5. Service
- 7.4. APAC Extended Reality (XR) Market Analysis, Opportunity and Forecast, By By Type, 2016-2032
- 7.4.1. APAC Extended Reality (XR) Market Analysis by By Type: Introduction
- 7.4.2. Market Size Absolute $ Opportunity Analysis and Forecast, By By Type, 2016-2032
- 7.4.3. Virtual Reality
- 7.4.4. Augmented Reality
- 7.4.5. Mixed Reality
- 7.5. APAC Extended Reality (XR) Market Analysis, Opportunity and Forecast, By By End-User, 2016-2032
- 7.5.1. APAC Extended Reality (XR) Market Analysis by By End-User: Introduction
- 7.5.2. Market Size Absolute $ Opportunity Analysis and Forecast, By By End-User, 2016-2032
- 7.5.3. Gaming
- 7.5.4. Retail
- 7.5.5. Healthcare
- 7.5.6. Manufacturing
- 7.5.7. Media and Entertainment
- 7.5.8. Education
- 7.5.9. Aerospace and Defense
- 7.5.10. Other
- 7.6. APAC Extended Reality (XR) Market Analysis, Opportunity and Forecast, By Country , 2016-2032
- 7.6.1. APAC Extended Reality (XR) Market Analysis by Country : Introduction
- 7.6.2. Market Size Absolute $ Opportunity Analysis and Forecast, Country , 2016-2032
- 7.6.2.1. China
- 7.6.2.2. Japan
- 7.6.2.3. South Korea
- 7.6.2.4. India
- 7.6.2.5. Australia & New Zeland
- 7.6.2.6. Indonesia
- 7.6.2.7. Malaysia
- 7.6.2.8. Philippines
- 7.6.2.9. Singapore
- 7.6.2.10. Thailand
- 7.6.2.11. Vietnam
- 7.6.2.12. Rest of APAC
- 8. Latin America Extended Reality (XR) Market Analysis, Opportunity and Forecast, 2016-2032
- 8.1. Latin America Extended Reality (XR) Market Analysis, 2016-2021
- 8.2. Latin America Extended Reality (XR) Market Opportunity and Forecast, 2023-2032
- 8.3. Latin America Extended Reality (XR) Market Analysis, Opportunity and Forecast, By By Component, 2016-2032
- 8.3.1. Latin America Extended Reality (XR) Market Analysis by By Component: Introduction
- 8.3.2. Market Size Absolute $ Opportunity Analysis and Forecast, By By Component, 2016-2032
- 8.3.3. Hardware
- 8.3.4. Software
- 8.3.5. Service
- 8.4. Latin America Extended Reality (XR) Market Analysis, Opportunity and Forecast, By By Type, 2016-2032
- 8.4.1. Latin America Extended Reality (XR) Market Analysis by By Type: Introduction
- 8.4.2. Market Size Absolute $ Opportunity Analysis and Forecast, By By Type, 2016-2032
- 8.4.3. Virtual Reality
- 8.4.4. Augmented Reality
- 8.4.5. Mixed Reality
- 8.5. Latin America Extended Reality (XR) Market Analysis, Opportunity and Forecast, By By End-User, 2016-2032
- 8.5.1. Latin America Extended Reality (XR) Market Analysis by By End-User: Introduction
- 8.5.2. Market Size Absolute $ Opportunity Analysis and Forecast, By By End-User, 2016-2032
- 8.5.3. Gaming
- 8.5.4. Retail
- 8.5.5. Healthcare
- 8.5.6. Manufacturing
- 8.5.7. Media and Entertainment
- 8.5.8. Education
- 8.5.9. Aerospace and Defense
- 8.5.10. Other
- 8.6. Latin America Extended Reality (XR) Market Analysis, Opportunity and Forecast, By Country , 2016-2032
- 8.6.1. Latin America Extended Reality (XR) Market Analysis by Country : Introduction
- 8.6.2. Market Size Absolute $ Opportunity Analysis and Forecast, Country , 2016-2032
- 8.6.2.1. Brazil
- 8.6.2.2. Colombia
- 8.6.2.3. Chile
- 8.6.2.4. Argentina
- 8.6.2.5. Costa Rica
- 8.6.2.6. Rest of Latin America
- 9. Middle East & Africa Extended Reality (XR) Market Analysis, Opportunity and Forecast, 2016-2032
- 9.1. Middle East & Africa Extended Reality (XR) Market Analysis, 2016-2021
- 9.2. Middle East & Africa Extended Reality (XR) Market Opportunity and Forecast, 2023-2032
- 9.3. Middle East & Africa Extended Reality (XR) Market Analysis, Opportunity and Forecast, By By Component, 2016-2032
- 9.3.1. Middle East & Africa Extended Reality (XR) Market Analysis by By Component: Introduction
- 9.3.2. Market Size Absolute $ Opportunity Analysis and Forecast, By By Component, 2016-2032
- 9.3.3. Hardware
- 9.3.4. Software
- 9.3.5. Service
- 9.4. Middle East & Africa Extended Reality (XR) Market Analysis, Opportunity and Forecast, By By Type, 2016-2032
- 9.4.1. Middle East & Africa Extended Reality (XR) Market Analysis by By Type: Introduction
- 9.4.2. Market Size Absolute $ Opportunity Analysis and Forecast, By By Type, 2016-2032
- 9.4.3. Virtual Reality
- 9.4.4. Augmented Reality
- 9.4.5. Mixed Reality
- 9.5. Middle East & Africa Extended Reality (XR) Market Analysis, Opportunity and Forecast, By By End-User, 2016-2032
- 9.5.1. Middle East & Africa Extended Reality (XR) Market Analysis by By End-User: Introduction
- 9.5.2. Market Size Absolute $ Opportunity Analysis and Forecast, By By End-User, 2016-2032
- 9.5.3. Gaming
- 9.5.4. Retail
- 9.5.5. Healthcare
- 9.5.6. Manufacturing
- 9.5.7. Media and Entertainment
- 9.5.8. Education
- 9.5.9. Aerospace and Defense
- 9.5.10. Other
- 9.6. Middle East & Africa Extended Reality (XR) Market Analysis, Opportunity and Forecast, By Country , 2016-2032
- 9.6.1. Middle East & Africa Extended Reality (XR) Market Analysis by Country : Introduction
- 9.6.2. Market Size Absolute $ Opportunity Analysis and Forecast, Country , 2016-2032
- 9.6.2.1. Algeria
- 9.6.2.2. Egypt
- 9.6.2.3. Israel
- 9.6.2.4. Kuwait
- 9.6.2.5. Nigeria
- 9.6.2.6. Saudi Arabia
- 9.6.2.7. South Africa
- 9.6.2.8. Turkey
- 9.6.2.9. The UAE
- 9.6.2.10. Rest of MEA
- 10. Global Extended Reality (XR) Market Analysis, Opportunity and Forecast, By Region , 2016-2032
- 10.1. Global Extended Reality (XR) Market Analysis by Region : Introduction
- 10.2. Market Size Absolute $ Opportunity Analysis and Forecast, By Region , 2016-2032
- 10.2.1. North America
- 10.2.2. Western Europe
- 10.2.3. Eastern Europe
- 10.2.4. APAC
- 10.2.5. Latin America
- 10.2.6. Middle East & Africa
- 11. Global Extended Reality (XR) Market Competitive Landscape, Market Share Analysis, and Company Profiles
- 11.1. Market Share Analysis
- 11.2. Company Profiles
- 11.3. HTC Corporation
- 11.3.1. Company Overview
- 11.3.2. Financial Highlights
- 11.3.3. Product Portfolio
- 11.3.4. SWOT Analysis
- 11.3.5. Key Strategies and Developments
- 11.4. Qualcomm Technologies Inc.
- 11.4.1. Company Overview
- 11.4.2. Financial Highlights
- 11.4.3. Product Portfolio
- 11.4.4. SWOT Analysis
- 11.4.5. Key Strategies and Developments
- 11.5. Samsung Electronics Co., Ltd
- 11.5.1. Company Overview
- 11.5.2. Financial Highlights
- 11.5.3. Product Portfolio
- 11.5.4. SWOT Analysis
- 11.5.5. Key Strategies and Developments
- 11.6. Accenture PLC
- 11.6.1. Company Overview
- 11.6.2. Financial Highlights
- 11.6.3. Product Portfolio
- 11.6.4. SWOT Analysis
- 11.6.5. Key Strategies and Developments
- 11.7. SoftServe Inc.
- 11.7.1. Company Overview
- 11.7.2. Financial Highlights
- 11.7.3. Product Portfolio
- 11.7.4. SWOT Analysis
- 11.7.5. Key Strategies and Developments
- 11.8. Intel Corporation
- 11.8.1. Company Overview
- 11.8.2. Financial Highlights
- 11.8.3. Product Portfolio
- 11.8.4. SWOT Analysis
- 11.8.5. Key Strategies and Developments
- 11.9. SphereGen Technologies LLC
- 11.9.1. Company Overview
- 11.9.2. Financial Highlights
- 11.9.3. Product Portfolio
- 11.9.4. SWOT Analysis
- 11.9.5. Key Strategies and Developments
- 11.10. Northern Digital Inc.
- 11.10.1. Company Overview
- 11.10.2. Financial Highlights
- 11.10.3. Product Portfolio
- 11.10.4. SWOT Analysis
- 11.10.5. Key Strategies and Developments
- 11.11. Microsoft Corporation
- 11.11.1. Company Overview
- 11.11.2. Financial Highlights
- 11.11.3. Product Portfolio
- 11.11.4. SWOT Analysis
- 11.11.5. Key Strategies and Developments
- 11.12. Softweb Solutions Inc. (Avnet Inc.)
- 11.12.1. Company Overview
- 11.12.2. Financial Highlights
- 11.12.3. Product Portfolio
- 11.12.4. SWOT Analysis
- 11.12.5. Key Strategies and Developments
- 11.13.1. Company Overview
- 11.13.2. Financial Highlights
- 11.13.3. Product Portfolio
- 11.13.4. SWOT Analysis
- 11.13.5. Key Strategies and Developments
- 11.14. Tata Elxsi Limited
- 11.14.1. Company Overview
- 11.14.2. Financial Highlights
- 11.14.3. Product Portfolio
- 11.14.4. SWOT Analysis
- 11.14.5. Key Strategies and Developments
- 11.15. Varjo Technologies Oy
- 11.15.1. Company Overview
- 11.15.2. Financial Highlights
- 11.15.3. Product Portfolio
- 11.15.4. SWOT Analysis
- 11.15.5. Key Strategies and Developments
- 11.16. Talespin Reality Labs Inc
- 11.16.1. Company Overview
- 11.16.2. Financial Highlights
- 11.16.3. Product Portfolio
- 11.16.4. SWOT Analysis
- 11.16.5. Key Strategies and Developments
- 11.17. Other
- 11.17.1. Company Overview
- 11.17.2. Financial Highlights
- 11.17.3. Product Portfolio
- 11.17.4. SWOT Analysis
- 11.17.5. Key Strategies and Developments
- 12. Assumptions and Acronyms
- 13. Research Methodology
- 14. Contact
- List of Figures
- Figure 1: Global Extended Reality (XR) Market Revenue (US$ Mn) Market Share by By Component in 2022
- Figure 2: Global Extended Reality (XR) Market Market Attractiveness Analysis by By Component, 2016-2032
- Figure 3: Global Extended Reality (XR) Market Revenue (US$ Mn) Market Share by By Typein 2022
- Figure 4: Global Extended Reality (XR) Market Market Attractiveness Analysis by By Type, 2016-2032
- Figure 5: Global Extended Reality (XR) Market Revenue (US$ Mn) Market Share by By End-Userin 2022
- Figure 6: Global Extended Reality (XR) Market Market Attractiveness Analysis by By End-User, 2016-2032
- Figure 7: Global Extended Reality (XR) Market Revenue (US$ Mn) Market Share by Region in 2022
- Figure 8: Global Extended Reality (XR) Market Market Attractiveness Analysis by Region, 2016-2032
- Figure 9: Global Extended Reality (XR) Market Market Revenue (US$ Mn) (2016-2032)
- Figure 10: Global Extended Reality (XR) Market Market Revenue (US$ Mn) Comparison by Region (2016-2032)
- Figure 11: Global Extended Reality (XR) Market Market Revenue (US$ Mn) Comparison by By Component (2016-2032)
- Figure 12: Global Extended Reality (XR) Market Market Revenue (US$ Mn) Comparison by By Type (2016-2032)
- Figure 13: Global Extended Reality (XR) Market Market Revenue (US$ Mn) Comparison by By End-User (2016-2032)
- Figure 14: Global Extended Reality (XR) Market Market Y-o-Y Growth Rate Comparison by Region (2016-2032)
- Figure 15: Global Extended Reality (XR) Market Market Y-o-Y Growth Rate Comparison by By Component (2016-2032)
- Figure 16: Global Extended Reality (XR) Market Market Y-o-Y Growth Rate Comparison by By Type (2016-2032)
- Figure 17: Global Extended Reality (XR) Market Market Y-o-Y Growth Rate Comparison by By End-User (2016-2032)
- Figure 18: Global Extended Reality (XR) Market Market Share Comparison by Region (2016-2032)
- Figure 19: Global Extended Reality (XR) Market Market Share Comparison by By Component (2016-2032)
- Figure 20: Global Extended Reality (XR) Market Market Share Comparison by By Type (2016-2032)
- Figure 21: Global Extended Reality (XR) Market Market Share Comparison by By End-User (2016-2032)
- Figure 22: North America Extended Reality (XR) Market Revenue (US$ Mn) Market Share by By Componentin 2022
- Figure 23: North America Extended Reality (XR) Market Market Attractiveness Analysis by By Component, 2016-2032
- Figure 24: North America Extended Reality (XR) Market Revenue (US$ Mn) Market Share by By Typein 2022
- Figure 25: North America Extended Reality (XR) Market Market Attractiveness Analysis by By Type, 2016-2032
- Figure 26: North America Extended Reality (XR) Market Revenue (US$ Mn) Market Share by By End-Userin 2022
- Figure 27: North America Extended Reality (XR) Market Market Attractiveness Analysis by By End-User, 2016-2032
- Figure 28: North America Extended Reality (XR) Market Revenue (US$ Mn) Market Share by Country in 2022
- Figure 29: North America Extended Reality (XR) Market Market Attractiveness Analysis by Country, 2016-2032
- Figure 30: North America Extended Reality (XR) Market Market Revenue (US$ Mn) (2016-2032)
- Figure 31: North America Extended Reality (XR) Market Market Revenue (US$ Mn) Comparison by Country (2016-2032)
- Figure 32: North America Extended Reality (XR) Market Market Revenue (US$ Mn) Comparison by By Component (2016-2032)
- Figure 33: North America Extended Reality (XR) Market Market Revenue (US$ Mn) Comparison by By Type (2016-2032)
- Figure 34: North America Extended Reality (XR) Market Market Revenue (US$ Mn) Comparison by By End-User (2016-2032)
- Figure 35: North America Extended Reality (XR) Market Market Y-o-Y Growth Rate Comparison by Country (2016-2032)
- Figure 36: North America Extended Reality (XR) Market Market Y-o-Y Growth Rate Comparison by By Component (2016-2032)
- Figure 37: North America Extended Reality (XR) Market Market Y-o-Y Growth Rate Comparison by By Type (2016-2032)
- Figure 38: North America Extended Reality (XR) Market Market Y-o-Y Growth Rate Comparison by By End-User (2016-2032)
- Figure 39: North America Extended Reality (XR) Market Market Share Comparison by Country (2016-2032)
- Figure 40: North America Extended Reality (XR) Market Market Share Comparison by By Component (2016-2032)
- Figure 41: North America Extended Reality (XR) Market Market Share Comparison by By Type (2016-2032)
- Figure 42: North America Extended Reality (XR) Market Market Share Comparison by By End-User (2016-2032)
- Figure 43: Western Europe Extended Reality (XR) Market Revenue (US$ Mn) Market Share by By Componentin 2022
- Figure 44: Western Europe Extended Reality (XR) Market Market Attractiveness Analysis by By Component, 2016-2032
- Figure 45: Western Europe Extended Reality (XR) Market Revenue (US$ Mn) Market Share by By Typein 2022
- Figure 46: Western Europe Extended Reality (XR) Market Market Attractiveness Analysis by By Type, 2016-2032
- Figure 47: Western Europe Extended Reality (XR) Market Revenue (US$ Mn) Market Share by By End-Userin 2022
- Figure 48: Western Europe Extended Reality (XR) Market Market Attractiveness Analysis by By End-User, 2016-2032
- Figure 49: Western Europe Extended Reality (XR) Market Revenue (US$ Mn) Market Share by Country in 2022
- Figure 50: Western Europe Extended Reality (XR) Market Market Attractiveness Analysis by Country, 2016-2032
- Figure 51: Western Europe Extended Reality (XR) Market Market Revenue (US$ Mn) (2016-2032)
- Figure 52: Western Europe Extended Reality (XR) Market Market Revenue (US$ Mn) Comparison by Country (2016-2032)
- Figure 53: Western Europe Extended Reality (XR) Market Market Revenue (US$ Mn) Comparison by By Component (2016-2032)
- Figure 54: Western Europe Extended Reality (XR) Market Market Revenue (US$ Mn) Comparison by By Type (2016-2032)
- Figure 55: Western Europe Extended Reality (XR) Market Market Revenue (US$ Mn) Comparison by By End-User (2016-2032)
- Figure 56: Western Europe Extended Reality (XR) Market Market Y-o-Y Growth Rate Comparison by Country (2016-2032)
- Figure 57: Western Europe Extended Reality (XR) Market Market Y-o-Y Growth Rate Comparison by By Component (2016-2032)
- Figure 58: Western Europe Extended Reality (XR) Market Market Y-o-Y Growth Rate Comparison by By Type (2016-2032)
- Figure 59: Western Europe Extended Reality (XR) Market Market Y-o-Y Growth Rate Comparison by By End-User (2016-2032)
- Figure 60: Western Europe Extended Reality (XR) Market Market Share Comparison by Country (2016-2032)
- Figure 61: Western Europe Extended Reality (XR) Market Market Share Comparison by By Component (2016-2032)
- Figure 62: Western Europe Extended Reality (XR) Market Market Share Comparison by By Type (2016-2032)
- Figure 63: Western Europe Extended Reality (XR) Market Market Share Comparison by By End-User (2016-2032)
- Figure 64: Eastern Europe Extended Reality (XR) Market Revenue (US$ Mn) Market Share by By Componentin 2022
- Figure 65: Eastern Europe Extended Reality (XR) Market Market Attractiveness Analysis by By Component, 2016-2032
- Figure 66: Eastern Europe Extended Reality (XR) Market Revenue (US$ Mn) Market Share by By Typein 2022
- Figure 67: Eastern Europe Extended Reality (XR) Market Market Attractiveness Analysis by By Type, 2016-2032
- Figure 68: Eastern Europe Extended Reality (XR) Market Revenue (US$ Mn) Market Share by By End-Userin 2022
- Figure 69: Eastern Europe Extended Reality (XR) Market Market Attractiveness Analysis by By End-User, 2016-2032
- Figure 70: Eastern Europe Extended Reality (XR) Market Revenue (US$ Mn) Market Share by Country in 2022
- Figure 71: Eastern Europe Extended Reality (XR) Market Market Attractiveness Analysis by Country, 2016-2032
- Figure 72: Eastern Europe Extended Reality (XR) Market Market Revenue (US$ Mn) (2016-2032)
- Figure 73: Eastern Europe Extended Reality (XR) Market Market Revenue (US$ Mn) Comparison by Country (2016-2032)
- Figure 74: Eastern Europe Extended Reality (XR) Market Market Revenue (US$ Mn) Comparison by By Component (2016-2032)
- Figure 75: Eastern Europe Extended Reality (XR) Market Market Revenue (US$ Mn) Comparison by By Type (2016-2032)
- Figure 76: Eastern Europe Extended Reality (XR) Market Market Revenue (US$ Mn) Comparison by By End-User (2016-2032)
- Figure 77: Eastern Europe Extended Reality (XR) Market Market Y-o-Y Growth Rate Comparison by Country (2016-2032)
- Figure 78: Eastern Europe Extended Reality (XR) Market Market Y-o-Y Growth Rate Comparison by By Component (2016-2032)
- Figure 79: Eastern Europe Extended Reality (XR) Market Market Y-o-Y Growth Rate Comparison by By Type (2016-2032)
- Figure 80: Eastern Europe Extended Reality (XR) Market Market Y-o-Y Growth Rate Comparison by By End-User (2016-2032)
- Figure 81: Eastern Europe Extended Reality (XR) Market Market Share Comparison by Country (2016-2032)
- Figure 82: Eastern Europe Extended Reality (XR) Market Market Share Comparison by By Component (2016-2032)
- Figure 83: Eastern Europe Extended Reality (XR) Market Market Share Comparison by By Type (2016-2032)
- Figure 84: Eastern Europe Extended Reality (XR) Market Market Share Comparison by By End-User (2016-2032)
- Figure 85: APAC Extended Reality (XR) Market Revenue (US$ Mn) Market Share by By Componentin 2022
- Figure 86: APAC Extended Reality (XR) Market Market Attractiveness Analysis by By Component, 2016-2032
- Figure 87: APAC Extended Reality (XR) Market Revenue (US$ Mn) Market Share by By Typein 2022
- Figure 88: APAC Extended Reality (XR) Market Market Attractiveness Analysis by By Type, 2016-2032
- Figure 89: APAC Extended Reality (XR) Market Revenue (US$ Mn) Market Share by By End-Userin 2022
- Figure 90: APAC Extended Reality (XR) Market Market Attractiveness Analysis by By End-User, 2016-2032
- Figure 91: APAC Extended Reality (XR) Market Revenue (US$ Mn) Market Share by Country in 2022
- Figure 92: APAC Extended Reality (XR) Market Market Attractiveness Analysis by Country, 2016-2032
- Figure 93: APAC Extended Reality (XR) Market Market Revenue (US$ Mn) (2016-2032)
- Figure 94: APAC Extended Reality (XR) Market Market Revenue (US$ Mn) Comparison by Country (2016-2032)
- Figure 95: APAC Extended Reality (XR) Market Market Revenue (US$ Mn) Comparison by By Component (2016-2032)
- Figure 96: APAC Extended Reality (XR) Market Market Revenue (US$ Mn) Comparison by By Type (2016-2032)
- Figure 97: APAC Extended Reality (XR) Market Market Revenue (US$ Mn) Comparison by By End-User (2016-2032)
- Figure 98: APAC Extended Reality (XR) Market Market Y-o-Y Growth Rate Comparison by Country (2016-2032)
- Figure 99: APAC Extended Reality (XR) Market Market Y-o-Y Growth Rate Comparison by By Component (2016-2032)
- Figure 100: APAC Extended Reality (XR) Market Market Y-o-Y Growth Rate Comparison by By Type (2016-2032)
- Figure 101: APAC Extended Reality (XR) Market Market Y-o-Y Growth Rate Comparison by By End-User (2016-2032)
- Figure 102: APAC Extended Reality (XR) Market Market Share Comparison by Country (2016-2032)
- Figure 103: APAC Extended Reality (XR) Market Market Share Comparison by By Component (2016-2032)
- Figure 104: APAC Extended Reality (XR) Market Market Share Comparison by By Type (2016-2032)
- Figure 105: APAC Extended Reality (XR) Market Market Share Comparison by By End-User (2016-2032)
- Figure 106: Latin America Extended Reality (XR) Market Revenue (US$ Mn) Market Share by By Componentin 2022
- Figure 107: Latin America Extended Reality (XR) Market Market Attractiveness Analysis by By Component, 2016-2032
- Figure 108: Latin America Extended Reality (XR) Market Revenue (US$ Mn) Market Share by By Typein 2022
- Figure 109: Latin America Extended Reality (XR) Market Market Attractiveness Analysis by By Type, 2016-2032
- Figure 110: Latin America Extended Reality (XR) Market Revenue (US$ Mn) Market Share by By End-Userin 2022
- Figure 111: Latin America Extended Reality (XR) Market Market Attractiveness Analysis by By End-User, 2016-2032
- Figure 112: Latin America Extended Reality (XR) Market Revenue (US$ Mn) Market Share by Country in 2022
- Figure 113: Latin America Extended Reality (XR) Market Market Attractiveness Analysis by Country, 2016-2032
- Figure 114: Latin America Extended Reality (XR) Market Market Revenue (US$ Mn) (2016-2032)
- Figure 115: Latin America Extended Reality (XR) Market Market Revenue (US$ Mn) Comparison by Country (2016-2032)
- Figure 116: Latin America Extended Reality (XR) Market Market Revenue (US$ Mn) Comparison by By Component (2016-2032)
- Figure 117: Latin America Extended Reality (XR) Market Market Revenue (US$ Mn) Comparison by By Type (2016-2032)
- Figure 118: Latin America Extended Reality (XR) Market Market Revenue (US$ Mn) Comparison by By End-User (2016-2032)
- Figure 119: Latin America Extended Reality (XR) Market Market Y-o-Y Growth Rate Comparison by Country (2016-2032)
- Figure 120: Latin America Extended Reality (XR) Market Market Y-o-Y Growth Rate Comparison by By Component (2016-2032)
- Figure 121: Latin America Extended Reality (XR) Market Market Y-o-Y Growth Rate Comparison by By Type (2016-2032)
- Figure 122: Latin America Extended Reality (XR) Market Market Y-o-Y Growth Rate Comparison by By End-User (2016-2032)
- Figure 123: Latin America Extended Reality (XR) Market Market Share Comparison by Country (2016-2032)
- Figure 124: Latin America Extended Reality (XR) Market Market Share Comparison by By Component (2016-2032)
- Figure 125: Latin America Extended Reality (XR) Market Market Share Comparison by By Type (2016-2032)
- Figure 126: Latin America Extended Reality (XR) Market Market Share Comparison by By End-User (2016-2032)
- Figure 127: Middle East & Africa Extended Reality (XR) Market Revenue (US$ Mn) Market Share by By Componentin 2022
- Figure 128: Middle East & Africa Extended Reality (XR) Market Market Attractiveness Analysis by By Component, 2016-2032
- Figure 129: Middle East & Africa Extended Reality (XR) Market Revenue (US$ Mn) Market Share by By Typein 2022
- Figure 130: Middle East & Africa Extended Reality (XR) Market Market Attractiveness Analysis by By Type, 2016-2032
- Figure 131: Middle East & Africa Extended Reality (XR) Market Revenue (US$ Mn) Market Share by By End-Userin 2022
- Figure 132: Middle East & Africa Extended Reality (XR) Market Market Attractiveness Analysis by By End-User, 2016-2032
- Figure 133: Middle East & Africa Extended Reality (XR) Market Revenue (US$ Mn) Market Share by Country in 2022
- Figure 134: Middle East & Africa Extended Reality (XR) Market Market Attractiveness Analysis by Country, 2016-2032
- Figure 135: Middle East & Africa Extended Reality (XR) Market Market Revenue (US$ Mn) (2016-2032)
- Figure 136: Middle East & Africa Extended Reality (XR) Market Market Revenue (US$ Mn) Comparison by Country (2016-2032)
- Figure 137: Middle East & Africa Extended Reality (XR) Market Market Revenue (US$ Mn) Comparison by By Component (2016-2032)
- Figure 138: Middle East & Africa Extended Reality (XR) Market Market Revenue (US$ Mn) Comparison by By Type (2016-2032)
- Figure 139: Middle East & Africa Extended Reality (XR) Market Market Revenue (US$ Mn) Comparison by By End-User (2016-2032)
- Figure 140: Middle East & Africa Extended Reality (XR) Market Market Y-o-Y Growth Rate Comparison by Country (2016-2032)
- Figure 141: Middle East & Africa Extended Reality (XR) Market Market Y-o-Y Growth Rate Comparison by By Component (2016-2032)
- Figure 142: Middle East & Africa Extended Reality (XR) Market Market Y-o-Y Growth Rate Comparison by By Type (2016-2032)
- Figure 143: Middle East & Africa Extended Reality (XR) Market Market Y-o-Y Growth Rate Comparison by By End-User (2016-2032)
- Figure 144: Middle East & Africa Extended Reality (XR) Market Market Share Comparison by Country (2016-2032)
- Figure 145: Middle East & Africa Extended Reality (XR) Market Market Share Comparison by By Component (2016-2032)
- Figure 146: Middle East & Africa Extended Reality (XR) Market Market Share Comparison by By Type (2016-2032)
- Figure 147: Middle East & Africa Extended Reality (XR) Market Market Share Comparison by By End-User (2016-2032)
List of Tables
- Table 1: Global Extended Reality (XR) Market Market Comparison by By Component (2016-2032)
- Table 2: Global Extended Reality (XR) Market Market Comparison by By Type (2016-2032)
- Table 3: Global Extended Reality (XR) Market Market Comparison by By End-User (2016-2032)
- Table 4: Global Extended Reality (XR) Market Revenue (US$ Mn) Comparison by Region (2016-2032)
- Table 5: Global Extended Reality (XR) Market Market Revenue (US$ Mn) (2016-2032)
- Table 6: Global Extended Reality (XR) Market Market Revenue (US$ Mn) Comparison by Region (2016-2032)
- Table 7: Global Extended Reality (XR) Market Market Revenue (US$ Mn) Comparison by By Component (2016-2032)
- Table 8: Global Extended Reality (XR) Market Market Revenue (US$ Mn) Comparison by By Type (2016-2032)
- Table 9: Global Extended Reality (XR) Market Market Revenue (US$ Mn) Comparison by By End-User (2016-2032)
- Table 10: Global Extended Reality (XR) Market Market Y-o-Y Growth Rate Comparison by Region (2016-2032)
- Table 11: Global Extended Reality (XR) Market Market Y-o-Y Growth Rate Comparison by By Component (2016-2032)
- Table 12: Global Extended Reality (XR) Market Market Y-o-Y Growth Rate Comparison by By Type (2016-2032)
- Table 13: Global Extended Reality (XR) Market Market Y-o-Y Growth Rate Comparison by By End-User (2016-2032)
- Table 14: Global Extended Reality (XR) Market Market Share Comparison by Region (2016-2032)
- Table 15: Global Extended Reality (XR) Market Market Share Comparison by By Component (2016-2032)
- Table 16: Global Extended Reality (XR) Market Market Share Comparison by By Type (2016-2032)
- Table 17: Global Extended Reality (XR) Market Market Share Comparison by By End-User (2016-2032)
- Table 18: North America Extended Reality (XR) Market Market Comparison by By Type (2016-2032)
- Table 19: North America Extended Reality (XR) Market Market Comparison by By End-User (2016-2032)
- Table 20: North America Extended Reality (XR) Market Revenue (US$ Mn) Comparison by Country (2016-2032)
- Table 21: North America Extended Reality (XR) Market Market Revenue (US$ Mn) (2016-2032)
- Table 22: North America Extended Reality (XR) Market Market Revenue (US$ Mn) Comparison by Country (2016-2032)
- Table 23: North America Extended Reality (XR) Market Market Revenue (US$ Mn) Comparison by By Component (2016-2032)
- Table 24: North America Extended Reality (XR) Market Market Revenue (US$ Mn) Comparison by By Type (2016-2032)
- Table 25: North America Extended Reality (XR) Market Market Revenue (US$ Mn) Comparison by By End-User (2016-2032)
- Table 26: North America Extended Reality (XR) Market Market Y-o-Y Growth Rate Comparison by Country (2016-2032)
- Table 27: North America Extended Reality (XR) Market Market Y-o-Y Growth Rate Comparison by By Component (2016-2032)
- Table 28: North America Extended Reality (XR) Market Market Y-o-Y Growth Rate Comparison by By Type (2016-2032)
- Table 29: North America Extended Reality (XR) Market Market Y-o-Y Growth Rate Comparison by By End-User (2016-2032)
- Table 30: North America Extended Reality (XR) Market Market Share Comparison by Country (2016-2032)
- Table 31: North America Extended Reality (XR) Market Market Share Comparison by By Component (2016-2032)
- Table 32: North America Extended Reality (XR) Market Market Share Comparison by By Type (2016-2032)
- Table 33: North America Extended Reality (XR) Market Market Share Comparison by By End-User (2016-2032)
- Table 34: Western Europe Extended Reality (XR) Market Market Comparison by By Component (2016-2032)
- Table 35: Western Europe Extended Reality (XR) Market Market Comparison by By Type (2016-2032)
- Table 36: Western Europe Extended Reality (XR) Market Market Comparison by By End-User (2016-2032)
- Table 37: Western Europe Extended Reality (XR) Market Revenue (US$ Mn) Comparison by Country (2016-2032)
- Table 38: Western Europe Extended Reality (XR) Market Market Revenue (US$ Mn) (2016-2032)
- Table 39: Western Europe Extended Reality (XR) Market Market Revenue (US$ Mn) Comparison by Country (2016-2032)
- Table 40: Western Europe Extended Reality (XR) Market Market Revenue (US$ Mn) Comparison by By Component (2016-2032)
- Table 41: Western Europe Extended Reality (XR) Market Market Revenue (US$ Mn) Comparison by By Type (2016-2032)
- Table 42: Western Europe Extended Reality (XR) Market Market Revenue (US$ Mn) Comparison by By End-User (2016-2032)
- Table 43: Western Europe Extended Reality (XR) Market Market Y-o-Y Growth Rate Comparison by Country (2016-2032)
- Table 44: Western Europe Extended Reality (XR) Market Market Y-o-Y Growth Rate Comparison by By Component (2016-2032)
- Table 45: Western Europe Extended Reality (XR) Market Market Y-o-Y Growth Rate Comparison by By Type (2016-2032)
- Table 46: Western Europe Extended Reality (XR) Market Market Y-o-Y Growth Rate Comparison by By End-User (2016-2032)
- Table 47: Western Europe Extended Reality (XR) Market Market Share Comparison by Country (2016-2032)
- Table 48: Western Europe Extended Reality (XR) Market Market Share Comparison by By Component (2016-2032)
- Table 49: Western Europe Extended Reality (XR) Market Market Share Comparison by By Type (2016-2032)
- Table 50: Western Europe Extended Reality (XR) Market Market Share Comparison by By End-User (2016-2032)
- Table 51: Eastern Europe Extended Reality (XR) Market Market Comparison by By Component (2016-2032)
- Table 52: Eastern Europe Extended Reality (XR) Market Market Comparison by By Type (2016-2032)
- Table 53: Eastern Europe Extended Reality (XR) Market Market Comparison by By End-User (2016-2032)
- Table 54: Eastern Europe Extended Reality (XR) Market Revenue (US$ Mn) Comparison by Country (2016-2032)
- Table 55: Eastern Europe Extended Reality (XR) Market Market Revenue (US$ Mn) (2016-2032)
- Table 56: Eastern Europe Extended Reality (XR) Market Market Revenue (US$ Mn) Comparison by Country (2016-2032)
- Table 57: Eastern Europe Extended Reality (XR) Market Market Revenue (US$ Mn) Comparison by By Component (2016-2032)
- Table 58: Eastern Europe Extended Reality (XR) Market Market Revenue (US$ Mn) Comparison by By Type (2016-2032)
- Table 59: Eastern Europe Extended Reality (XR) Market Market Revenue (US$ Mn) Comparison by By End-User (2016-2032)
- Table 60: Eastern Europe Extended Reality (XR) Market Market Y-o-Y Growth Rate Comparison by Country (2016-2032)
- Table 61: Eastern Europe Extended Reality (XR) Market Market Y-o-Y Growth Rate Comparison by By Component (2016-2032)
- Table 62: Eastern Europe Extended Reality (XR) Market Market Y-o-Y Growth Rate Comparison by By Type (2016-2032)
- Table 63: Eastern Europe Extended Reality (XR) Market Market Y-o-Y Growth Rate Comparison by By End-User (2016-2032)
- Table 64: Eastern Europe Extended Reality (XR) Market Market Share Comparison by Country (2016-2032)
- Table 65: Eastern Europe Extended Reality (XR) Market Market Share Comparison by By Component (2016-2032)
- Table 66: Eastern Europe Extended Reality (XR) Market Market Share Comparison by By Type (2016-2032)
- Table 67: Eastern Europe Extended Reality (XR) Market Market Share Comparison by By End-User (2016-2032)
- Table 68: APAC Extended Reality (XR) Market Market Comparison by By Component (2016-2032)
- Table 69: APAC Extended Reality (XR) Market Market Comparison by By Type (2016-2032)
- Table 70: APAC Extended Reality (XR) Market Market Comparison by By End-User (2016-2032)
- Table 71: APAC Extended Reality (XR) Market Revenue (US$ Mn) Comparison by Country (2016-2032)
- Table 72: APAC Extended Reality (XR) Market Market Revenue (US$ Mn) (2016-2032)
- Table 73: APAC Extended Reality (XR) Market Market Revenue (US$ Mn) Comparison by Country (2016-2032)
- Table 74: APAC Extended Reality (XR) Market Market Revenue (US$ Mn) Comparison by By Component (2016-2032)
- Table 75: APAC Extended Reality (XR) Market Market Revenue (US$ Mn) Comparison by By Type (2016-2032)
- Table 76: APAC Extended Reality (XR) Market Market Revenue (US$ Mn) Comparison by By End-User (2016-2032)
- Table 77: APAC Extended Reality (XR) Market Market Y-o-Y Growth Rate Comparison by Country (2016-2032)
- Table 78: APAC Extended Reality (XR) Market Market Y-o-Y Growth Rate Comparison by By Component (2016-2032)
- Table 79: APAC Extended Reality (XR) Market Market Y-o-Y Growth Rate Comparison by By Type (2016-2032)
- Table 80: APAC Extended Reality (XR) Market Market Y-o-Y Growth Rate Comparison by By End-User (2016-2032)
- Table 81: APAC Extended Reality (XR) Market Market Share Comparison by Country (2016-2032)
- Table 82: APAC Extended Reality (XR) Market Market Share Comparison by By Component (2016-2032)
- Table 83: APAC Extended Reality (XR) Market Market Share Comparison by By Type (2016-2032)
- Table 84: APAC Extended Reality (XR) Market Market Share Comparison by By End-User (2016-2032)
- Table 85: Latin America Extended Reality (XR) Market Market Comparison by By Component (2016-2032)
- Table 86: Latin America Extended Reality (XR) Market Market Comparison by By Type (2016-2032)
- Table 87: Latin America Extended Reality (XR) Market Market Comparison by By End-User (2016-2032)
- Table 88: Latin America Extended Reality (XR) Market Revenue (US$ Mn) Comparison by Country (2016-2032)
- Table 89: Latin America Extended Reality (XR) Market Market Revenue (US$ Mn) (2016-2032)
- Table 90: Latin America Extended Reality (XR) Market Market Revenue (US$ Mn) Comparison by Country (2016-2032)
- Table 91: Latin America Extended Reality (XR) Market Market Revenue (US$ Mn) Comparison by By Component (2016-2032)
- Table 92: Latin America Extended Reality (XR) Market Market Revenue (US$ Mn) Comparison by By Type (2016-2032)
- Table 93: Latin America Extended Reality (XR) Market Market Revenue (US$ Mn) Comparison by By End-User (2016-2032)
- Table 94: Latin America Extended Reality (XR) Market Market Y-o-Y Growth Rate Comparison by Country (2016-2032)
- Table 95: Latin America Extended Reality (XR) Market Market Y-o-Y Growth Rate Comparison by By Component (2016-2032)
- Table 96: Latin America Extended Reality (XR) Market Market Y-o-Y Growth Rate Comparison by By Type (2016-2032)
- Table 97: Latin America Extended Reality (XR) Market Market Y-o-Y Growth Rate Comparison by By End-User (2016-2032)
- Table 98: Latin America Extended Reality (XR) Market Market Share Comparison by Country (2016-2032)
- Table 99: Latin America Extended Reality (XR) Market Market Share Comparison by By Component (2016-2032)
- Table 100: Latin America Extended Reality (XR) Market Market Share Comparison by By Type (2016-2032)
- Table 101: Latin America Extended Reality (XR) Market Market Share Comparison by By End-User (2016-2032)
- Table 102: Middle East & Africa Extended Reality (XR) Market Market Comparison by By Component (2016-2032)
- Table 103: Middle East & Africa Extended Reality (XR) Market Market Comparison by By Type (2016-2032)
- Table 104: Middle East & Africa Extended Reality (XR) Market Market Comparison by By End-User (2016-2032)
- Table 105: Middle East & Africa Extended Reality (XR) Market Revenue (US$ Mn) Comparison by Country (2016-2032)
- Table 106: Middle East & Africa Extended Reality (XR) Market Market Revenue (US$ Mn) (2016-2032)
- Table 107: Middle East & Africa Extended Reality (XR) Market Market Revenue (US$ Mn) Comparison by Country (2016-2032)
- Table 108: Middle East & Africa Extended Reality (XR) Market Market Revenue (US$ Mn) Comparison by By Component (2016-2032)
- Table 109: Middle East & Africa Extended Reality (XR) Market Market Revenue (US$ Mn) Comparison by By Type (2016-2032)
- Table 110: Middle East & Africa Extended Reality (XR) Market Market Revenue (US$ Mn) Comparison by By End-User (2016-2032)
- Table 111: Middle East & Africa Extended Reality (XR) Market Market Y-o-Y Growth Rate Comparison by Country (2016-2032)
- Table 112: Middle East & Africa Extended Reality (XR) Market Market Y-o-Y Growth Rate Comparison by By Component (2016-2032)
- Table 113: Middle East & Africa Extended Reality (XR) Market Market Y-o-Y Growth Rate Comparison by By Type (2016-2032)
- Table 114: Middle East & Africa Extended Reality (XR) Market Market Y-o-Y Growth Rate Comparison by By End-User (2016-2032)
- Table 115: Middle East & Africa Extended Reality (XR) Market Market Share Comparison by Country (2016-2032)
- Table 116: Middle East & Africa Extended Reality (XR) Market Market Share Comparison by By Component (2016-2032)
- Table 117: Middle East & Africa Extended Reality (XR) Market Market Share Comparison by By Type (2016-2032)
- Table 118: Middle East & Africa Extended Reality (XR) Market Market Share Comparison by By End-User (2016-2032)
- 1. Executive Summary
-
- HTC Corporation
- Qualcomm Technologies Inc.
- Samsung Electronics Co., Ltd
- Accenture PLC
- SoftServe Inc.
- Intel Corporation
- SphereGen Technologies LLC
- Northern Digital Inc.
- Microsoft Corporation
- Softweb Solutions Inc. (Avnet Inc.)
- Tata Elxsi Limited
- Xiaomi Corporation
- Varjo Technologies Oy
- Talespin Reality Labs Inc
- Other
Our Clients


View Our Licence Options
