
Virtual Reality Content Creation Market By Content Type (Videos, 360 Degree Photos, Games), By Component (Software, Services), By End-User (Real estate, Travel and hospitality, Media and entertainment, Healthcare, Other), By Region And Companies - Industry Segment Outlook, Market Assessment, Competition Scenario, Trends, And Forecast 2023-2032
9381
May 2023
155
Report Overview
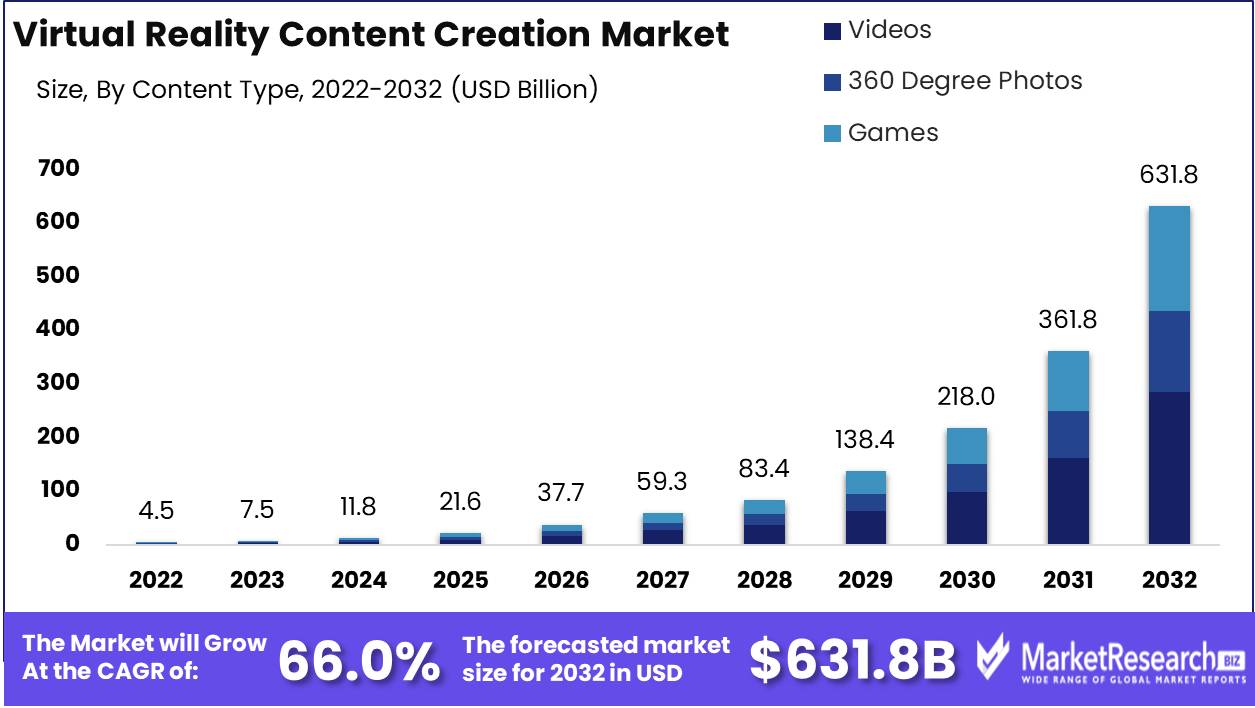
Virtual Reality Content Creation Market size is expected to be worth around USD 631.8 Bn by 2032 from USD 4.5 Bn in 2022, growing at a CAGR of 66.0% during the forecast period from 2023 to 2032.
Virtual reality (VR) has transformed our perception and interaction with digital content. As technology continues to develop, the demand for immersive virtual reality experiences has skyrocketed. The virtual reality content creation market has emerged and flourished within this context.
The virtual reality content creation market refers to the industry that specializes in creating immersive and interactive VR experiences. Its primary objective is to develop content that transports users into virtual realms, allowing them to explore, interact, and engage with digital environments in previously unimaginable ways.
Because it can provide a level of immersion and engagement that traditional media cannot, virtual reality content creation is important. Virtual reality content enables users to suspend disbelief and enter a real-feeling world by producing realistic and immersive experiences. This level of immersion has many benefits, including the potential to revolutionize numerous industries and improve extant products and services.
The introduction of 360-degree videos and virtual excursions is a significant innovation on the virtual reality content creation market. By providing a comprehensive view of the adjacent area, these videos enable users to investigate various environments and locales. This innovation has revolutionized industries such as travel, real estate, and education by allowing prospective customers to virtually visit destinations, properties, and institutions from the comfort of their own homes.
Diverse industries have witnessed major investments and incorporation of Virtual Reality Content Creation Market into their products and services. Companies such as Oculus (owned by Facebook), HTC, and Sony have invested extensively in developing virtual reality hardware and technologies, while content creation companies such as VR Workforce Studios and Felix & Paul Studios have emerged as key participants in creating immersive experiences.
Driving factors
Virtual Reality (VR) Hardware and Technology
Continuous advancements in virtual reality (VR) technology and hardware are one of the primary forces behind the increase in demand for immersive entertainment experiences. The quality and affordability of VR headsets, such as the Oculus Rift, HTC Vive, and PlayStation VR, have advanced significantly. They now provide more authentic and immersive experiences with enhanced graphics, frame rates, and monitoring abilities. These advancements in VR technology and hardware have enabled content developers to create more engaging and captivating virtual reality experiences.
Virtual Reality in Gaming and Entertainment
The growing adoption of virtual reality (VR) in the gaming and entertainment industries is another factor contributing to the rising demand for immersive entertainment experiences. Game developers recognize the revolutionary potential of VR technology and are embracing it unreservedly. VR gaming provides a level of immersion and interactivity that is unmatched by traditional gaming. With the introduction of VR headsets and VR-specific titles, the gaming industry has experienced a substantial revenue increase.
Expanding Training and Simulation Applications
Beyond the domains of entertainment, virtual reality has found widespread use in training and simulation. Aviation, healthcare, the military, and even retail are using VR technology to educate their employees and simulate real-life scenarios. Pilots in the aviation industry can undergo realistic flight simulations to hone their skills and prepare for difficult situations. Complex medical procedures can be practiced in a virtual environment before being performed on actual patients. Retailers can establish virtual stores where customers can peruse merchandise and make purchases from the convenience of their own residences.
Interest in Virtual Travel and Exploration Is Growing
Those who are enthusiastic about travel and exploration have also shown an interest in virtual reality. Many individuals desire to travel to exotic locations around the world, but may lack the resources or leisure to do so. Virtual Reality Content Creation Market offers an alternative by allowing users to virtually experience these locations. Virtual travel provides a distinct and immersive experience, whether it's discovering the ancient ruins of Machu Picchu, strolling through the streets of Paris, or plunging into the Great Barrier Reef. Users can simply don a virtual reality (VR) headset and be instantaneously transported to their desired location, eliminating the need for costly flights or accommodations.
Restraining Factors
Potentially Expensive VR Content Creation
The virtual reality (VR) content creation market has evolved into a dynamic and cutting-edge industry that offers a variety of opportunities for businesses and consumers. However, despite its numerous benefits, there are a number of limiting factors that must be considered. One of these factors is the possible high cost of VR content creation. The creation of compelling and immersive virtual reality (VR) experiences requires substantial investments in terms of technology, apparatus, and qualified personnel. Traditional content creation processes do not translate directly to the virtual reality landscape, necessitating the investment of specialized hardware and software by businesses.
Potential Technical Difficulty and Competency Requirements
The potential technical complexity and skill requirements associated with developing VR experiences are a further factor inhibiting the virtual reality content creation market. A comprehensive comprehension of 3D modeling, animation, programming, and interactive design is required for VR development. It requires knowledge of multiple software applications and programming languages. The technical knowledge required to create high-quality VR content can be an obstacle for both individuals and companies. The VR development learning curve can be high, requiring a substantial investment of time and resources.
Possibility of a Limited User Base and Adoption
The potential limited user base and adoption rate of VR technology is an additional factor restraining the market for content creation. In comparison to other platforms, the number of users and devices capable of operating VR experiences is limited due to the industry's youth and dynamism. Adoption of virtual reality technology is highly dependent on the accessibility and affordability of suitable hardware. Currently, VR headsets and devices may be expensive, limiting their accessibility to the general public.
Distribution and Monetization of Content
The content creation process for virtual reality (VR) can be complex and resource-intensive, but the difficulties do not end there. Once created, the distribution and monetization of virtual reality (VR) content may present challenges for businesses in this market. Unlike traditional media platforms, virtual reality (VR) necessitates a distinct method of content distribution. Users frequently require specialized platforms or applications to access VR experiences. These platforms may have their own set of technical requirements and guidelines, which complicates content deployment.
Possible Health and Safety Issues
Lastly, the market for Virtual Reality Content Creation Market raises health and safety concerns. Extensive exposure to virtual reality (VR) experiences can result in adverse effects such as nausea, ocular fatigue, and disorientation. These issues can detract from the overall user experience and serve as potential impediments to widespread adoption. Health and safety concerns must be addressed if the VR industry is to flourish. To ensure a positive user experience, businesses investing in VR content creation must prioritize user comfort and safety.
Content Type Analysis
Virtual reality content creation market is experiencing significant growth, with the video segment dominating the industry. This trend can be attributed to the increasing demand for immersive and interactive visual experiences. Videos have the unique ability to transport users to different virtual environments, allowing them to explore and engage with content in a more realistic and engaging way.
Consumer trends and behaviors also play a crucial role in the dominance of the video segment in virtual reality content creation market. Consumers are increasingly seeking out immersive and interactive experiences that go beyond traditional forms of entertainment. Videos offer a unique and captivating way to experience virtual reality, providing users with a sense of presence and immersion. This has led to a growing demand for video content among consumers, further driving the growth of this segment.
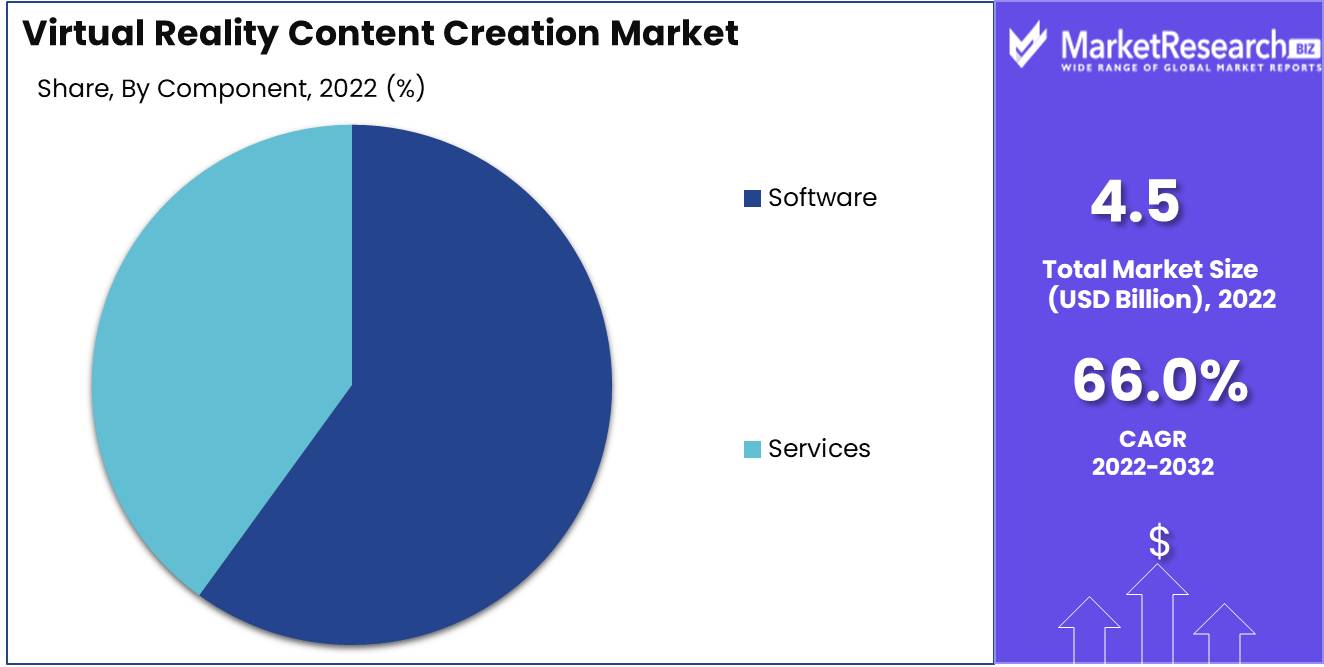
Component Analysis
When it comes to virtual reality content creation, the software segment takes the lead. Software plays a crucial role in creating and delivering immersive virtual reality experiences. From content creation tools to platform development, software is at the heart of the virtual reality industry.
Consumer trends and behaviors also contribute to the dominance of the software segment in Virtual Reality Content Creation Market. Consumers are increasingly seeking out personalized and tailored experiences, and software provides the means to create and deliver these experiences. From virtual reality games to interactive educational applications, software allows users to customize their virtual reality experience based on their preferences and interests.
End-User Analysis
In the virtual reality content creation market, the gaming segment dominates. Virtual reality gaming has gained immense popularity among consumers, offering a new level of immersion and interaction. The gaming industry has been quick to embrace virtual reality, with various game developers creating virtual reality experiences for gamers.
Consumer trends and behaviors also influence the dominance of the gaming segment in virtual reality content creation. Gaming has always been a popular form of entertainment, and virtual reality technology takes it to a whole new level. With virtual reality gaming, users can fully immerse themselves in the game, with an enhanced sense of presence and interaction. The demand for innovative and immersive gaming experiences drives the growth of the gaming segment in the virtual reality content creation market.
Key Market Segments
By Content Type
- Videos
- 360 Degree Photos
- Games
By Component
- Software
- Services
By End-User
- Real estate
- Travel and hospitality
- Media and entertainment
- Healthcare
- Retail
- Gaming
- Automotive
- Other End-Users
Growth Opportunity
Use of Artificial Intelligence (AI) Technology
As Artificial Intelligence (AI) technology continues to advance, incorporating it into Virtual Reality Content Creation Market tools and software enables new immersive experience possibilities. Using AI algorithms, developers can create more interactive and realistic virtual environments, thereby increasing user engagement and satisfaction. AI is capable of analyzing real-time user input and adjusting the virtual environment accordingly, resulting in personalized and adaptable VR experiences. This integration of VR and AI presents an intriguing growth opportunity, as it has the potential to attract more users and stimulate innovation in the virtual reality content creation market.
IoT (Internet of Things) device integration
By connecting devices and facilitating seamless interactions, the Internet of Things (IoT) has transformed numerous industries. The combination of Internet of Things devices and Virtual Reality Content Creation Market creates new opportunities for immersive experiences. For instance, VR content developers can synchronize VR simulations with Internet of Things (IoT) devices, allowing users to interact with real-world objects while immersed in virtual environments. This integration can be especially advantageous in disciplines such as architecture, engineering, and healthcare where precise object manipulation is essential. Expanding into this IoT-enabled VR content creation market not only improves user experiences, but also opens the door for innovative applications and partnerships.
Convergence of Augmented Reality (AR) and Virtual Reality (VR)
While virtual reality (VR) and augmented reality (AR) are typically viewed as separate technologies, their convergence can result in compelling and immersive experiences. By combining the capabilities of augmented reality in overlaying virtual elements onto the real world and virtual reality in creating entirely immersive environments, content creators can open up new avenues of exploration. For example, VR content creators can develop applications that seamlessly transition between VR and AR, thereby augmenting user engagement and providing a wider variety of narrative experiences. This convergence of augmented reality and virtual reality expands the purview of content creation opportunities, paving the way for intriguing growth opportunities in the virtual reality content creation market.
Latest Trends
VR Gaming Content and Experiences Growth
VR is no exception to gaming's technical lead. Gamers may now experience realistic virtual worlds thanks to high-quality VR headsets and powerful consoles or PCs. VR gaming content has increased as developers explore the limits of virtual reality. VR games now include first-person shooters and puzzle games. Physically interacting with virtual environments engages players' senses in ways traditional gaming cannot. VR game content demand will rise as VR technology becomes more cheap.
Immersive storytelling and cinematic VR demand
VR has elevated storytelling, a staple of human civilization. Immersive storytelling blurs the boundaries between fiction and reality. Cinematic VR lets viewers explore distinct locations, become characters, and participate in the tale. VR is helping filmmakers convey stories. 360-degree films and lifelike virtual worlds may immerse viewers like never before. Cinematic VR content demand gives content providers, filmmakers, and artists new visual expression options.
VR in Architectural and Design Visualization
VR helps architects and designers visualize and communicate. Virtual reality (VR) lets architects, interior designers, and real estate developers visualize their plans in a virtual environment. In a realistic virtual environment, clients and stakeholders may better comprehend proposed initiatives and make informed decisions. VR enhances architects' designs' depth and size. Buildings may be toured virtually before construction. This speeds up design and lowers construction mistakes. VR in architecture and design visualization has become essential for efficient and engaging experiences.
VR-Based Healthcare and Defense Simulations
VR training and simulations are used in healthcare and military. VR technology helps doctors to safely simulate difficult procedures. Surgeons may practice complex operations safely. The defense industry uses VR simulations to educate soldiers and pilots. VR simulates battlefields, flights, and equipment handling. Trainees can practice critical thinking and high-pressure circumstances in virtual settings. VR-based training and simulations in various industries are effective, cost-effective, and time-saving. It lets professionals learn in a risk-free environment, benefiting their clients.
360-degree video and VR livestreaming
360-degree video and VR live streaming have changed content consumption and sharing. 360-degree video offers a more immersive and engaging experience than standard video formats. Moving their smartphone or donning a VR headset lets them explore the full area. VR live broadcasting lets consumers virtually attend live events. VR live broadcasting lets viewers from across the world experience sports games and music events. 360-degree video and VR live streaming allow content providers, social media influencers, and corporations to connect with their audiences. Virtual travel, education, and entertainment have all expanded.
Regional Analysis
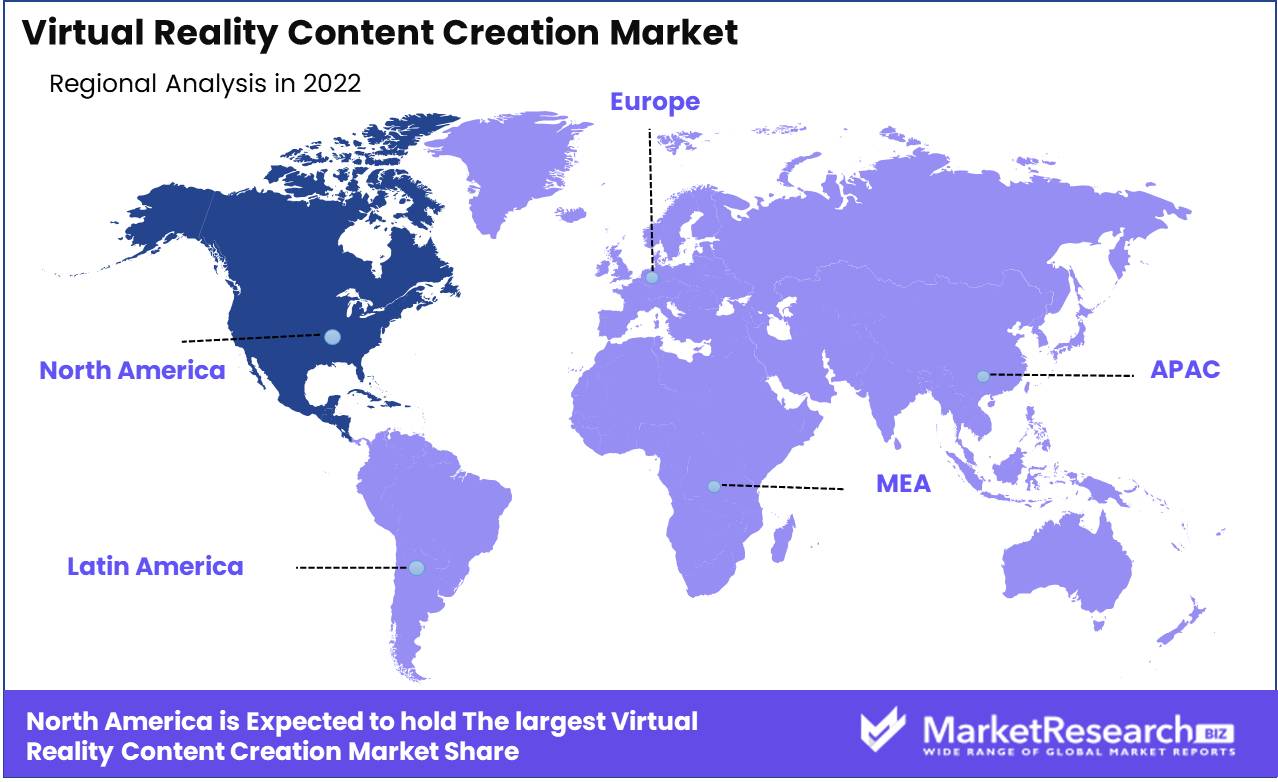
The Virtual Reality Content Creation Market is dominated by the North American region. In the dynamic domain of technology, the virtual reality (VR) industry has emerged as a game-changer. With its immersive and interactive capabilities, virtual reality has captivated the fascination and interest of both consumers and businesses. As a result, the demand for virtual reality content creation has surged, and North America has emerged as the market leader in this burgeoning industry.
North America is prominent among the primary regions in the VR content creation market. With its sophisticated technological infrastructure, large talent pool, and flourishing startup ecosystem, North America is well positioned to dominate this dynamic industry. Moreover, the region's established amusement and gaming industry provides a firm foundation for VR content creation, as it integrates with existing media and entertainment platforms.
The presence of significant industry participants is one of the primary factors contributing to North America's market dominance in Virtual Reality Content Creation Market. North America possesses a robust ecosystem of VR content creators, comprised of both established businesses and innovative ventures. These companies have the necessary skills and resources to create immersive experiences that captivate audiences and stimulate participation. In addition, the region's access to cutting-edge technology and research facilities allows for continuous innovation and keeps North American companies at the vanguard of VR content creation.
Additionally contributing to North America's dominance is the region's emphasis on research and development. Universities and research institutions in North America conduct innovative research in the field of virtual reality, resulting in significant advances in content creation techniques and technologies. This research-driven approach fosters a culture of innovation, enabling VR content creators in North America to develop distinct and engaging experiences.
Key Regions and Countries
North America
- US
- Canada
- Mexico
Western Europe
- Germany
- France
- The UK
- Spain
- Italy
- Portugal
- Ireland
- Austria
- Switzerland
- Benelux
- Nordic
- Rest of Western Europe
Eastern Europe
- Russia
- Poland
- The Czech Republic
- Greece
- Rest of Eastern Europe
APAC
- China
- Japan
- South Korea
- India
- Australia & New Zealand
- Indonesia
- Malaysia
- Philippines
- Singapore
- Thailand
- Vietnam
- Rest of APAC
Latin America
- Brazil
- Colombia
- Chile
- Argentina
- Costa Rica
- Rest of Latin America
Middle East & Africa
- Algeria
- Egypt
- Israel
- Kuwait
- Nigeria
- Saudi Arabia
- South Africa
- Turkey
- United Arab Emirates
- Rest of MEA
Key Players Analysis
IBM, a global technology champion, is renowned for its ground-breaking innovations in a variety of disciplines. The company has been at the forefront of virtual reality's development and innovation. IBM's research division actively investigates the potential of virtual reality in diverse industries, including healthcare, gaming, manufacturing, and education.
The British company Blippar is recognized for its expertise in augmented reality (AR) and virtual reality (VR). Blippar intends to revolutionize how we perceive and interact with our surroundings by emphasizing interactive and immersive experiences. Its cutting-edge technologies seamlessly combine the actual and digital realms by combining computer vision, artificial intelligence, and augmented reality/virtual reality.
As its name suggests, 360 Labs specializes in creating high-quality and engaging virtual reality (VR) experiences. This U.S.-based company has made a significant impact on the Virtual Reality Content Creation Market, with an extensive portfolio that includes creating immersive content for brands, documentaries, and even feature films. 360 Labs utilizes innovative storytelling techniques and cutting-edge technology to convey viewers into richly detailed virtual environments.
Matterport Inc., situated in the United States, has emerged as a major competitor in the market for virtual reality content creation, particularly in the real estate industry. The business provides an innovative infrastructure for the creation of photorealistic 3D scans and virtual excursions. Real estate agents can remotely present properties to prospective purchasers, providing an immersive experience that aids in decision-making.
The United States-based Koncept VR LLC is a renowned company in the field of virtual reality filmmaking and production. They have created exceptional VR experiences for clients ranging from fashion brands to music festivals using a team of expert professionals. The company combines innovative technology and imaginative storytelling to produce captivating and immersive virtual reality (VR) content.
SubVRsive is a significant participant in the virtual reality content creation market, specializing in VR advertising. The U.S.-based company utilizes virtual reality technology to create interactive advertising campaigns that captivate audiences. SubVRsive is an expert at creating immersive experiences that enable advertisers to engage with consumers on a much deeper level.
Top Key Players in Virtual Reality Content Creation Market
- IBM (U.S.)
- Blippar (U.K)
- 360 Labs (U.S.)
- Matterport Inc. (U.S.)
- Koncept VR LLC (U.S.)
- SubVRsive (U.S.)
- Panedia Pty Ltd.
- WeMakeVR (Netherlands)
- VIAR (U.S.)
- Scapic Innovations Private Limited (India)
- Dell Inc (U.S.)
- Intel Corporation (U.S)
- McAfee LLC (U.S.)
- Trend Micro Incorporated (Japan)
- VMware (U.S.) Juniper Networks Inc. (U.S.)
- Fortinet Inc (U.S.)
- Sophos Ltd. (U.K)
- Cisco Systems Inc. (U.S.)
Recent Development
- In 2023, Unity 2023.1 software offers a host of revolutionary features specifically tailored to enhance the VR content creation process. It empowers developers with a comprehensive toolset to craft immersive virtual experiences.
- In 2023, Unreal Engine 5 is a next-generation software offers an array of advanced capabilities, allowing creators to explore new dimensions within virtual reality and augmented reality (AR). It is poised to deliver unparalleled realism, interactivity, and scalability.
- In 2023, Adobe Aero is interactive and intuitive software aims to democratize the creation and sharing of captivating VR experiences. It empowers users to effortlessly build and distribute interactive VR content, revolutionizing the accessibility and reach of virtual reality storytelling.
Report Scope:
Report Features Description Market Value (2022) USD 4.5 Bn Forecast Revenue (2032) USD 631.8 Bn CAGR (2023-2032) 66.0% Base Year for Estimation 2022 Historic Period 2016-2022 Forecast Period 2023-2032 Report Coverage Revenue Forecast, Market Dynamics, COVID-19 Impact, Competitive Landscape, Recent Developments Segments Covered By Content Type (Videos, 360 Degree Photos, Games)
By Component (Software, Services)
By End-User (Real estate, Travel and hospitality, Media and entertainment, Healthcare, Retail, Gaming, Automotive, Other End-UsersRegional Analysis North America – The US, Canada, & Mexico; Western Europe – Germany, France, The UK, Spain, Italy, Portugal, Ireland, Austria, Switzerland, Benelux, Nordic, & Rest of Western Europe; Eastern Europe – Russia, Poland, The Czech Republic, Greece, & Rest of Eastern Europe; APAC – China, Japan, South Korea, India, Australia & New Zealand, Indonesia, Malaysia, Philippines, Singapore, Thailand, Vietnam, & Rest of APAC; Latin America – Brazil, Colombia, Chile, Argentina, Costa Rica, & Rest of Latin America; Middle East & Africa – Algeria, Egypt, Israel, Kuwait, Nigeria, Saudi Arabia, South Africa, Turkey, United Arab Emirates, & Rest of MEA Competitive Landscape IBM (U.S.), Blippar (U.K), 360 Labs (U.S.), Matterport Inc. (U.S.), Koncept VR LLC (U.S.), SubVRsive (U.S.), Panedia Pty Ltd., WeMakeVR (Netherlands), VIAR (U.S.), Scapic Innovations Private Limited (India), Dell Inc (U.S.), Intel Corporation (U.S), McAfee LLC (U.S.), Trend Micro Incorporated (Japan), VMware (U.S.) Juniper Networks Inc. (U.S.), Fortinet Inc (U.S.), Sophos Ltd. (U.K), Cisco Systems Inc. (U.S.) Customization Scope Customization for segments, region/country-level will be provided. Moreover, additional customization can be done based on the requirements. Purchase Options We have three licenses to opt for: Single User License, Multi-User License (Up to 5 Users), Corporate Use License (Unlimited User and Printable PDF) - IBM (U.S.)
- Blippar (U.K)
- 360 Labs (U.S.)
- Matterport Inc. (U.S.)
- Koncept VR LLC (U.S.)
- SubVRsive (U.S.)
- Panedia Pty Ltd.
- WeMakeVR (Netherlands)
- VIAR (U.S.)
- Scapic Innovations Private Limited (India)
- Dell Inc (U.S.)
- Intel Corporation (U.S)
- McAfee LLC (U.S.)
- Trend Micro Incorporated (Japan)
- VMware (U.S.) Juniper Networks Inc. (U.S.)
- Fortinet Inc (U.S.)
- Sophos Ltd. (U.K)
- Cisco Systems Inc. (U.S.)
- 1. Executive Summary
- 1.1. Definition
- 1.2. Taxonomy
- 1.3. Research Scope
- 1.4. Key Analysis
- 1.5. Key Findings by Major Segments
- 1.6. Top strategies by Major Players
- 2. Global Virtual Reality Content Creation Market Overview
- 2.1. Virtual Reality Content Creation Market Dynamics
- 2.1.1. Drivers
- 2.1.2. Opportunities
- 2.1.3. Restraints
- 2.1.4. Challenges
- 2.2. Macro-economic Factors
- 2.3. Regulatory Framework
- 2.4. Market Investment Feasibility Index
- 2.5. PEST Analysis
- 2.6. PORTER’S Five Force Analysis
- 2.7. Drivers & Restraints Impact Analysis
- 2.8. Industry Chain Analysis
- 2.9. Cost Structure Analysis
- 2.10. Marketing Strategy
- 2.11. Russia-Ukraine War Impact Analysis
- 2.12. Opportunity Map Analysis
- 2.13. Market Competition Scenario Analysis
- 2.14. Product Life Cycle Analysis
- 2.15. Opportunity Orbits
- 2.16. Manufacturer Intensity Map
- 2.17. Major Companies sales by Value & Volume
- 2.1. Virtual Reality Content Creation Market Dynamics
- 3. Global Virtual Reality Content Creation Market Analysis, Opportunity and Forecast, 2016-2032
- 3.1. Global Virtual Reality Content Creation Market Analysis, 2016-2021
- 3.2. Global Virtual Reality Content Creation Market Opportunity and Forecast, 2023-2032
- 3.3. Global Virtual Reality Content Creation Market Analysis, Opportunity and Forecast, By By Content Type, 2016-2032
- 3.3.1. Global Virtual Reality Content Creation Market Analysis by By Content Type: Introduction
- 3.3.2. Market Size Absolute $ Opportunity Analysis and Forecast, By By Content Type, 2016-2032
- 3.3.3. Videos
- 3.3.4. 360 Degree Photos
- 3.3.5. Games
- 3.4. Global Virtual Reality Content Creation Market Analysis, Opportunity and Forecast, By By Component, 2016-2032
- 3.4.1. Global Virtual Reality Content Creation Market Analysis by By Component: Introduction
- 3.4.2. Market Size Absolute $ Opportunity Analysis and Forecast, By By Component, 2016-2032
- 3.4.3. Software
- 3.4.4. Services
- 3.5. Global Virtual Reality Content Creation Market Analysis, Opportunity and Forecast, By By End-User, 2016-2032
- 3.5.1. Global Virtual Reality Content Creation Market Analysis by By End-User: Introduction
- 3.5.2. Market Size Absolute $ Opportunity Analysis and Forecast, By By End-User, 2016-2032
- 3.5.3. Real estate
- 3.5.4. Travel and hospitality
- 3.5.5. Media and entertainment
- 3.5.6. Healthcare
- 3.5.7. Retail
- 3.5.8. Gaming
- 3.5.9. Automotive
- 3.5.10. Other End-Users
- 4. North America Virtual Reality Content Creation Market Analysis, Opportunity and Forecast, 2016-2032
- 4.1. North America Virtual Reality Content Creation Market Analysis, 2016-2021
- 4.2. North America Virtual Reality Content Creation Market Opportunity and Forecast, 2023-2032
- 4.3. North America Virtual Reality Content Creation Market Analysis, Opportunity and Forecast, By By Content Type, 2016-2032
- 4.3.1. North America Virtual Reality Content Creation Market Analysis by By Content Type: Introduction
- 4.3.2. Market Size Absolute $ Opportunity Analysis and Forecast, By By Content Type, 2016-2032
- 4.3.3. Videos
- 4.3.4. 360 Degree Photos
- 4.3.5. Games
- 4.4. North America Virtual Reality Content Creation Market Analysis, Opportunity and Forecast, By By Component, 2016-2032
- 4.4.1. North America Virtual Reality Content Creation Market Analysis by By Component: Introduction
- 4.4.2. Market Size Absolute $ Opportunity Analysis and Forecast, By By Component, 2016-2032
- 4.4.3. Software
- 4.4.4. Services
- 4.5. North America Virtual Reality Content Creation Market Analysis, Opportunity and Forecast, By By End-User, 2016-2032
- 4.5.1. North America Virtual Reality Content Creation Market Analysis by By End-User: Introduction
- 4.5.2. Market Size Absolute $ Opportunity Analysis and Forecast, By By End-User, 2016-2032
- 4.5.3. Real estate
- 4.5.4. Travel and hospitality
- 4.5.5. Media and entertainment
- 4.5.6. Healthcare
- 4.5.7. Retail
- 4.5.8. Gaming
- 4.5.9. Automotive
- 4.5.10. Other End-Users
- 4.6. North America Virtual Reality Content Creation Market Analysis, Opportunity and Forecast, By Country , 2016-2032
- 4.6.1. North America Virtual Reality Content Creation Market Analysis by Country : Introduction
- 4.6.2. Market Size Absolute $ Opportunity Analysis and Forecast, Country , 2016-2032
- 4.6.2.1. The US
- 4.6.2.2. Canada
- 4.6.2.3. Mexico
- 5. Western Europe Virtual Reality Content Creation Market Analysis, Opportunity and Forecast, 2016-2032
- 5.1. Western Europe Virtual Reality Content Creation Market Analysis, 2016-2021
- 5.2. Western Europe Virtual Reality Content Creation Market Opportunity and Forecast, 2023-2032
- 5.3. Western Europe Virtual Reality Content Creation Market Analysis, Opportunity and Forecast, By By Content Type, 2016-2032
- 5.3.1. Western Europe Virtual Reality Content Creation Market Analysis by By Content Type: Introduction
- 5.3.2. Market Size Absolute $ Opportunity Analysis and Forecast, By By Content Type, 2016-2032
- 5.3.3. Videos
- 5.3.4. 360 Degree Photos
- 5.3.5. Games
- 5.4. Western Europe Virtual Reality Content Creation Market Analysis, Opportunity and Forecast, By By Component, 2016-2032
- 5.4.1. Western Europe Virtual Reality Content Creation Market Analysis by By Component: Introduction
- 5.4.2. Market Size Absolute $ Opportunity Analysis and Forecast, By By Component, 2016-2032
- 5.4.3. Software
- 5.4.4. Services
- 5.5. Western Europe Virtual Reality Content Creation Market Analysis, Opportunity and Forecast, By By End-User, 2016-2032
- 5.5.1. Western Europe Virtual Reality Content Creation Market Analysis by By End-User: Introduction
- 5.5.2. Market Size Absolute $ Opportunity Analysis and Forecast, By By End-User, 2016-2032
- 5.5.3. Real estate
- 5.5.4. Travel and hospitality
- 5.5.5. Media and entertainment
- 5.5.6. Healthcare
- 5.5.7. Retail
- 5.5.8. Gaming
- 5.5.9. Automotive
- 5.5.10. Other End-Users
- 5.6. Western Europe Virtual Reality Content Creation Market Analysis, Opportunity and Forecast, By Country , 2016-2032
- 5.6.1. Western Europe Virtual Reality Content Creation Market Analysis by Country : Introduction
- 5.6.2. Market Size Absolute $ Opportunity Analysis and Forecast, Country , 2016-2032
- 5.6.2.1. Germany
- 5.6.2.2. France
- 5.6.2.3. The UK
- 5.6.2.4. Spain
- 5.6.2.5. Italy
- 5.6.2.6. Portugal
- 5.6.2.7. Ireland
- 5.6.2.8. Austria
- 5.6.2.9. Switzerland
- 5.6.2.10. Benelux
- 5.6.2.11. Nordic
- 5.6.2.12. Rest of Western Europe
- 6. Eastern Europe Virtual Reality Content Creation Market Analysis, Opportunity and Forecast, 2016-2032
- 6.1. Eastern Europe Virtual Reality Content Creation Market Analysis, 2016-2021
- 6.2. Eastern Europe Virtual Reality Content Creation Market Opportunity and Forecast, 2023-2032
- 6.3. Eastern Europe Virtual Reality Content Creation Market Analysis, Opportunity and Forecast, By By Content Type, 2016-2032
- 6.3.1. Eastern Europe Virtual Reality Content Creation Market Analysis by By Content Type: Introduction
- 6.3.2. Market Size Absolute $ Opportunity Analysis and Forecast, By By Content Type, 2016-2032
- 6.3.3. Videos
- 6.3.4. 360 Degree Photos
- 6.3.5. Games
- 6.4. Eastern Europe Virtual Reality Content Creation Market Analysis, Opportunity and Forecast, By By Component, 2016-2032
- 6.4.1. Eastern Europe Virtual Reality Content Creation Market Analysis by By Component: Introduction
- 6.4.2. Market Size Absolute $ Opportunity Analysis and Forecast, By By Component, 2016-2032
- 6.4.3. Software
- 6.4.4. Services
- 6.5. Eastern Europe Virtual Reality Content Creation Market Analysis, Opportunity and Forecast, By By End-User, 2016-2032
- 6.5.1. Eastern Europe Virtual Reality Content Creation Market Analysis by By End-User: Introduction
- 6.5.2. Market Size Absolute $ Opportunity Analysis and Forecast, By By End-User, 2016-2032
- 6.5.3. Real estate
- 6.5.4. Travel and hospitality
- 6.5.5. Media and entertainment
- 6.5.6. Healthcare
- 6.5.7. Retail
- 6.5.8. Gaming
- 6.5.9. Automotive
- 6.5.10. Other End-Users
- 6.6. Eastern Europe Virtual Reality Content Creation Market Analysis, Opportunity and Forecast, By Country , 2016-2032
- 6.6.1. Eastern Europe Virtual Reality Content Creation Market Analysis by Country : Introduction
- 6.6.2. Market Size Absolute $ Opportunity Analysis and Forecast, Country , 2016-2032
- 6.6.2.1. Russia
- 6.6.2.2. Poland
- 6.6.2.3. The Czech Republic
- 6.6.2.4. Greece
- 6.6.2.5. Rest of Eastern Europe
- 7. APAC Virtual Reality Content Creation Market Analysis, Opportunity and Forecast, 2016-2032
- 7.1. APAC Virtual Reality Content Creation Market Analysis, 2016-2021
- 7.2. APAC Virtual Reality Content Creation Market Opportunity and Forecast, 2023-2032
- 7.3. APAC Virtual Reality Content Creation Market Analysis, Opportunity and Forecast, By By Content Type, 2016-2032
- 7.3.1. APAC Virtual Reality Content Creation Market Analysis by By Content Type: Introduction
- 7.3.2. Market Size Absolute $ Opportunity Analysis and Forecast, By By Content Type, 2016-2032
- 7.3.3. Videos
- 7.3.4. 360 Degree Photos
- 7.3.5. Games
- 7.4. APAC Virtual Reality Content Creation Market Analysis, Opportunity and Forecast, By By Component, 2016-2032
- 7.4.1. APAC Virtual Reality Content Creation Market Analysis by By Component: Introduction
- 7.4.2. Market Size Absolute $ Opportunity Analysis and Forecast, By By Component, 2016-2032
- 7.4.3. Software
- 7.4.4. Services
- 7.5. APAC Virtual Reality Content Creation Market Analysis, Opportunity and Forecast, By By End-User, 2016-2032
- 7.5.1. APAC Virtual Reality Content Creation Market Analysis by By End-User: Introduction
- 7.5.2. Market Size Absolute $ Opportunity Analysis and Forecast, By By End-User, 2016-2032
- 7.5.3. Real estate
- 7.5.4. Travel and hospitality
- 7.5.5. Media and entertainment
- 7.5.6. Healthcare
- 7.5.7. Retail
- 7.5.8. Gaming
- 7.5.9. Automotive
- 7.5.10. Other End-Users
- 7.6. APAC Virtual Reality Content Creation Market Analysis, Opportunity and Forecast, By Country , 2016-2032
- 7.6.1. APAC Virtual Reality Content Creation Market Analysis by Country : Introduction
- 7.6.2. Market Size Absolute $ Opportunity Analysis and Forecast, Country , 2016-2032
- 7.6.2.1. China
- 7.6.2.2. Japan
- 7.6.2.3. South Korea
- 7.6.2.4. India
- 7.6.2.5. Australia & New Zeland
- 7.6.2.6. Indonesia
- 7.6.2.7. Malaysia
- 7.6.2.8. Philippines
- 7.6.2.9. Singapore
- 7.6.2.10. Thailand
- 7.6.2.11. Vietnam
- 7.6.2.12. Rest of APAC
- 8. Latin America Virtual Reality Content Creation Market Analysis, Opportunity and Forecast, 2016-2032
- 8.1. Latin America Virtual Reality Content Creation Market Analysis, 2016-2021
- 8.2. Latin America Virtual Reality Content Creation Market Opportunity and Forecast, 2023-2032
- 8.3. Latin America Virtual Reality Content Creation Market Analysis, Opportunity and Forecast, By By Content Type, 2016-2032
- 8.3.1. Latin America Virtual Reality Content Creation Market Analysis by By Content Type: Introduction
- 8.3.2. Market Size Absolute $ Opportunity Analysis and Forecast, By By Content Type, 2016-2032
- 8.3.3. Videos
- 8.3.4. 360 Degree Photos
- 8.3.5. Games
- 8.4. Latin America Virtual Reality Content Creation Market Analysis, Opportunity and Forecast, By By Component, 2016-2032
- 8.4.1. Latin America Virtual Reality Content Creation Market Analysis by By Component: Introduction
- 8.4.2. Market Size Absolute $ Opportunity Analysis and Forecast, By By Component, 2016-2032
- 8.4.3. Software
- 8.4.4. Services
- 8.5. Latin America Virtual Reality Content Creation Market Analysis, Opportunity and Forecast, By By End-User, 2016-2032
- 8.5.1. Latin America Virtual Reality Content Creation Market Analysis by By End-User: Introduction
- 8.5.2. Market Size Absolute $ Opportunity Analysis and Forecast, By By End-User, 2016-2032
- 8.5.3. Real estate
- 8.5.4. Travel and hospitality
- 8.5.5. Media and entertainment
- 8.5.6. Healthcare
- 8.5.7. Retail
- 8.5.8. Gaming
- 8.5.9. Automotive
- 8.5.10. Other End-Users
- 8.6. Latin America Virtual Reality Content Creation Market Analysis, Opportunity and Forecast, By Country , 2016-2032
- 8.6.1. Latin America Virtual Reality Content Creation Market Analysis by Country : Introduction
- 8.6.2. Market Size Absolute $ Opportunity Analysis and Forecast, Country , 2016-2032
- 8.6.2.1. Brazil
- 8.6.2.2. Colombia
- 8.6.2.3. Chile
- 8.6.2.4. Argentina
- 8.6.2.5. Costa Rica
- 8.6.2.6. Rest of Latin America
- 9. Middle East & Africa Virtual Reality Content Creation Market Analysis, Opportunity and Forecast, 2016-2032
- 9.1. Middle East & Africa Virtual Reality Content Creation Market Analysis, 2016-2021
- 9.2. Middle East & Africa Virtual Reality Content Creation Market Opportunity and Forecast, 2023-2032
- 9.3. Middle East & Africa Virtual Reality Content Creation Market Analysis, Opportunity and Forecast, By By Content Type, 2016-2032
- 9.3.1. Middle East & Africa Virtual Reality Content Creation Market Analysis by By Content Type: Introduction
- 9.3.2. Market Size Absolute $ Opportunity Analysis and Forecast, By By Content Type, 2016-2032
- 9.3.3. Videos
- 9.3.4. 360 Degree Photos
- 9.3.5. Games
- 9.4. Middle East & Africa Virtual Reality Content Creation Market Analysis, Opportunity and Forecast, By By Component, 2016-2032
- 9.4.1. Middle East & Africa Virtual Reality Content Creation Market Analysis by By Component: Introduction
- 9.4.2. Market Size Absolute $ Opportunity Analysis and Forecast, By By Component, 2016-2032
- 9.4.3. Software
- 9.4.4. Services
- 9.5. Middle East & Africa Virtual Reality Content Creation Market Analysis, Opportunity and Forecast, By By End-User, 2016-2032
- 9.5.1. Middle East & Africa Virtual Reality Content Creation Market Analysis by By End-User: Introduction
- 9.5.2. Market Size Absolute $ Opportunity Analysis and Forecast, By By End-User, 2016-2032
- 9.5.3. Real estate
- 9.5.4. Travel and hospitality
- 9.5.5. Media and entertainment
- 9.5.6. Healthcare
- 9.5.7. Retail
- 9.5.8. Gaming
- 9.5.9. Automotive
- 9.5.10. Other End-Users
- 9.6. Middle East & Africa Virtual Reality Content Creation Market Analysis, Opportunity and Forecast, By Country , 2016-2032
- 9.6.1. Middle East & Africa Virtual Reality Content Creation Market Analysis by Country : Introduction
- 9.6.2. Market Size Absolute $ Opportunity Analysis and Forecast, Country , 2016-2032
- 9.6.2.1. Algeria
- 9.6.2.2. Egypt
- 9.6.2.3. Israel
- 9.6.2.4. Kuwait
- 9.6.2.5. Nigeria
- 9.6.2.6. Saudi Arabia
- 9.6.2.7. South Africa
- 9.6.2.8. Turkey
- 9.6.2.9. The UAE
- 9.6.2.10. Rest of MEA
- 10. Global Virtual Reality Content Creation Market Analysis, Opportunity and Forecast, By Region , 2016-2032
- 10.1. Global Virtual Reality Content Creation Market Analysis by Region : Introduction
- 10.2. Market Size Absolute $ Opportunity Analysis and Forecast, By Region , 2016-2032
- 10.2.1. North America
- 10.2.2. Western Europe
- 10.2.3. Eastern Europe
- 10.2.4. APAC
- 10.2.5. Latin America
- 10.2.6. Middle East & Africa
- 11. Global Virtual Reality Content Creation Market Competitive Landscape, Market Share Analysis, and Company Profiles
- 11.1. Market Share Analysis
- 11.2. Company Profiles
- 11.3. IBM (U.S.)
- 11.3.1. Company Overview
- 11.3.2. Financial Highlights
- 11.3.3. Product Portfolio
- 11.3.4. SWOT Analysis
- 11.3.5. Key Strategies and Developments
- 11.4. Blippar (U.K)
- 11.4.1. Company Overview
- 11.4.2. Financial Highlights
- 11.4.3. Product Portfolio
- 11.4.4. SWOT Analysis
- 11.4.5. Key Strategies and Developments
- 11.5. 360 Labs (U.S.)
- 11.5.1. Company Overview
- 11.5.2. Financial Highlights
- 11.5.3. Product Portfolio
- 11.5.4. SWOT Analysis
- 11.5.5. Key Strategies and Developments
- 11.6. Matterport Inc. (U.S.)
- 11.6.1. Company Overview
- 11.6.2. Financial Highlights
- 11.6.3. Product Portfolio
- 11.6.4. SWOT Analysis
- 11.6.5. Key Strategies and Developments
- 11.7. Koncept VR LLC (U.S.)
- 11.7.1. Company Overview
- 11.7.2. Financial Highlights
- 11.7.3. Product Portfolio
- 11.7.4. SWOT Analysis
- 11.7.5. Key Strategies and Developments
- 11.8. SubVRsive (U.S.)
- 11.8.1. Company Overview
- 11.8.2. Financial Highlights
- 11.8.3. Product Portfolio
- 11.8.4. SWOT Analysis
- 11.8.5. Key Strategies and Developments
- 11.9. Panedia Pty Ltd.
- 11.9.1. Company Overview
- 11.9.2. Financial Highlights
- 11.9.3. Product Portfolio
- 11.9.4. SWOT Analysis
- 11.9.5. Key Strategies and Developments
- 11.10. WeMakeVR (Netherlands)
- 11.10.1. Company Overview
- 11.10.2. Financial Highlights
- 11.10.3. Product Portfolio
- 11.10.4. SWOT Analysis
- 11.10.5. Key Strategies and Developments
- 11.11. VIAR (U.S.)
- 11.11.1. Company Overview
- 11.11.2. Financial Highlights
- 11.11.3. Product Portfolio
- 11.11.4. SWOT Analysis
- 11.11.5. Key Strategies and Developments
- 11.12. Scapic Innovations Private Limited (India)
- 11.12.1. Company Overview
- 11.12.2. Financial Highlights
- 11.12.3. Product Portfolio
- 11.12.4. SWOT Analysis
- 11.12.5. Key Strategies and Developments
- 11.13. Dell Inc (U.S.)
- 11.13.1. Company Overview
- 11.13.2. Financial Highlights
- 11.13.3. Product Portfolio
- 11.13.4. SWOT Analysis
- 11.13.5. Key Strategies and Developments
- 11.14. Intel Corporation (U.S)
- 11.14.1. Company Overview
- 11.14.2. Financial Highlights
- 11.14.3. Product Portfolio
- 11.14.4. SWOT Analysis
- 11.14.5. Key Strategies and Developments
- 11.15. McAfee LLC (U.S.)
- 11.15.1. Company Overview
- 11.15.2. Financial Highlights
- 11.15.3. Product Portfolio
- 11.15.4. SWOT Analysis
- 11.15.5. Key Strategies and Developments
- 11.16. Trend Micro Incorporated (Japan)
- 11.16.1. Company Overview
- 11.16.2. Financial Highlights
- 11.16.3. Product Portfolio
- 11.16.4. SWOT Analysis
- 11.16.5. Key Strategies and Developments
- 11.17. VMware (U.S.) Juniper Networks Inc. (U.S.)
- 11.17.1. Company Overview
- 11.17.2. Financial Highlights
- 11.17.3. Product Portfolio
- 11.17.4. SWOT Analysis
- 11.17.5. Key Strategies and Developments
- 11.18. Fortinet Inc (U.S.)
- 11.18.1. Company Overview
- 11.18.2. Financial Highlights
- 11.18.3. Product Portfolio
- 11.18.4. SWOT Analysis
- 11.18.5. Key Strategies and Developments
- 11.19. Sophos Ltd. (U.K)
- 11.19.1. Company Overview
- 11.19.2. Financial Highlights
- 11.19.3. Product Portfolio
- 11.19.4. SWOT Analysis
- 11.19.5. Key Strategies and Developments
- 11.20. Cisco Systems Inc. (U.S.)
- 11.20.1. Company Overview
- 11.20.2. Financial Highlights
- 11.20.3. Product Portfolio
- 11.20.4. SWOT Analysis
- 11.20.5. Key Strategies and Developments
- 12. Assumptions and Acronyms
- 13. Research Methodology
- 14. Contact
- List of Figures
- Figure 1: Global Virtual Reality Content Creation Market Revenue (US$ Mn) Market Share by By Content Type in 2022
- Figure 2: Global Virtual Reality Content Creation Market Attractiveness Analysis by By Content Type, 2016-2032
- Figure 3: Global Virtual Reality Content Creation Market Revenue (US$ Mn) Market Share by By Componentin 2022
- Figure 4: Global Virtual Reality Content Creation Market Attractiveness Analysis by By Component, 2016-2032
- Figure 5: Global Virtual Reality Content Creation Market Revenue (US$ Mn) Market Share by By End-Userin 2022
- Figure 6: Global Virtual Reality Content Creation Market Attractiveness Analysis by By End-User, 2016-2032
- Figure 7: Global Virtual Reality Content Creation Market Revenue (US$ Mn) Market Share by Region in 2022
- Figure 8: Global Virtual Reality Content Creation Market Attractiveness Analysis by Region, 2016-2032
- Figure 9: Global Virtual Reality Content Creation Market Revenue (US$ Mn) (2016-2032)
- Figure 10: Global Virtual Reality Content Creation Market Revenue (US$ Mn) Comparison by Region (2016-2032)
- Figure 11: Global Virtual Reality Content Creation Market Revenue (US$ Mn) Comparison by By Content Type (2016-2032)
- Figure 12: Global Virtual Reality Content Creation Market Revenue (US$ Mn) Comparison by By Component (2016-2032)
- Figure 13: Global Virtual Reality Content Creation Market Revenue (US$ Mn) Comparison by By End-User (2016-2032)
- Figure 14: Global Virtual Reality Content Creation Market Y-o-Y Growth Rate Comparison by Region (2016-2032)
- Figure 15: Global Virtual Reality Content Creation Market Y-o-Y Growth Rate Comparison by By Content Type (2016-2032)
- Figure 16: Global Virtual Reality Content Creation Market Y-o-Y Growth Rate Comparison by By Component (2016-2032)
- Figure 17: Global Virtual Reality Content Creation Market Y-o-Y Growth Rate Comparison by By End-User (2016-2032)
- Figure 18: Global Virtual Reality Content Creation Market Share Comparison by Region (2016-2032)
- Figure 19: Global Virtual Reality Content Creation Market Share Comparison by By Content Type (2016-2032)
- Figure 20: Global Virtual Reality Content Creation Market Share Comparison by By Component (2016-2032)
- Figure 21: Global Virtual Reality Content Creation Market Share Comparison by By End-User (2016-2032)
- Figure 22: North America Virtual Reality Content Creation Market Revenue (US$ Mn) Market Share by By Content Typein 2022
- Figure 23: North America Virtual Reality Content Creation Market Attractiveness Analysis by By Content Type, 2016-2032
- Figure 24: North America Virtual Reality Content Creation Market Revenue (US$ Mn) Market Share by By Componentin 2022
- Figure 25: North America Virtual Reality Content Creation Market Attractiveness Analysis by By Component, 2016-2032
- Figure 26: North America Virtual Reality Content Creation Market Revenue (US$ Mn) Market Share by By End-Userin 2022
- Figure 27: North America Virtual Reality Content Creation Market Attractiveness Analysis by By End-User, 2016-2032
- Figure 28: North America Virtual Reality Content Creation Market Revenue (US$ Mn) Market Share by Country in 2022
- Figure 29: North America Virtual Reality Content Creation Market Attractiveness Analysis by Country, 2016-2032
- Figure 30: North America Virtual Reality Content Creation Market Revenue (US$ Mn) (2016-2032)
- Figure 31: North America Virtual Reality Content Creation Market Revenue (US$ Mn) Comparison by Country (2016-2032)
- Figure 32: North America Virtual Reality Content Creation Market Revenue (US$ Mn) Comparison by By Content Type (2016-2032)
- Figure 33: North America Virtual Reality Content Creation Market Revenue (US$ Mn) Comparison by By Component (2016-2032)
- Figure 34: North America Virtual Reality Content Creation Market Revenue (US$ Mn) Comparison by By End-User (2016-2032)
- Figure 35: North America Virtual Reality Content Creation Market Y-o-Y Growth Rate Comparison by Country (2016-2032)
- Figure 36: North America Virtual Reality Content Creation Market Y-o-Y Growth Rate Comparison by By Content Type (2016-2032)
- Figure 37: North America Virtual Reality Content Creation Market Y-o-Y Growth Rate Comparison by By Component (2016-2032)
- Figure 38: North America Virtual Reality Content Creation Market Y-o-Y Growth Rate Comparison by By End-User (2016-2032)
- Figure 39: North America Virtual Reality Content Creation Market Share Comparison by Country (2016-2032)
- Figure 40: North America Virtual Reality Content Creation Market Share Comparison by By Content Type (2016-2032)
- Figure 41: North America Virtual Reality Content Creation Market Share Comparison by By Component (2016-2032)
- Figure 42: North America Virtual Reality Content Creation Market Share Comparison by By End-User (2016-2032)
- Figure 43: Western Europe Virtual Reality Content Creation Market Revenue (US$ Mn) Market Share by By Content Typein 2022
- Figure 44: Western Europe Virtual Reality Content Creation Market Attractiveness Analysis by By Content Type, 2016-2032
- Figure 45: Western Europe Virtual Reality Content Creation Market Revenue (US$ Mn) Market Share by By Componentin 2022
- Figure 46: Western Europe Virtual Reality Content Creation Market Attractiveness Analysis by By Component, 2016-2032
- Figure 47: Western Europe Virtual Reality Content Creation Market Revenue (US$ Mn) Market Share by By End-Userin 2022
- Figure 48: Western Europe Virtual Reality Content Creation Market Attractiveness Analysis by By End-User, 2016-2032
- Figure 49: Western Europe Virtual Reality Content Creation Market Revenue (US$ Mn) Market Share by Country in 2022
- Figure 50: Western Europe Virtual Reality Content Creation Market Attractiveness Analysis by Country, 2016-2032
- Figure 51: Western Europe Virtual Reality Content Creation Market Revenue (US$ Mn) (2016-2032)
- Figure 52: Western Europe Virtual Reality Content Creation Market Revenue (US$ Mn) Comparison by Country (2016-2032)
- Figure 53: Western Europe Virtual Reality Content Creation Market Revenue (US$ Mn) Comparison by By Content Type (2016-2032)
- Figure 54: Western Europe Virtual Reality Content Creation Market Revenue (US$ Mn) Comparison by By Component (2016-2032)
- Figure 55: Western Europe Virtual Reality Content Creation Market Revenue (US$ Mn) Comparison by By End-User (2016-2032)
- Figure 56: Western Europe Virtual Reality Content Creation Market Y-o-Y Growth Rate Comparison by Country (2016-2032)
- Figure 57: Western Europe Virtual Reality Content Creation Market Y-o-Y Growth Rate Comparison by By Content Type (2016-2032)
- Figure 58: Western Europe Virtual Reality Content Creation Market Y-o-Y Growth Rate Comparison by By Component (2016-2032)
- Figure 59: Western Europe Virtual Reality Content Creation Market Y-o-Y Growth Rate Comparison by By End-User (2016-2032)
- Figure 60: Western Europe Virtual Reality Content Creation Market Share Comparison by Country (2016-2032)
- Figure 61: Western Europe Virtual Reality Content Creation Market Share Comparison by By Content Type (2016-2032)
- Figure 62: Western Europe Virtual Reality Content Creation Market Share Comparison by By Component (2016-2032)
- Figure 63: Western Europe Virtual Reality Content Creation Market Share Comparison by By End-User (2016-2032)
- Figure 64: Eastern Europe Virtual Reality Content Creation Market Revenue (US$ Mn) Market Share by By Content Typein 2022
- Figure 65: Eastern Europe Virtual Reality Content Creation Market Attractiveness Analysis by By Content Type, 2016-2032
- Figure 66: Eastern Europe Virtual Reality Content Creation Market Revenue (US$ Mn) Market Share by By Componentin 2022
- Figure 67: Eastern Europe Virtual Reality Content Creation Market Attractiveness Analysis by By Component, 2016-2032
- Figure 68: Eastern Europe Virtual Reality Content Creation Market Revenue (US$ Mn) Market Share by By End-Userin 2022
- Figure 69: Eastern Europe Virtual Reality Content Creation Market Attractiveness Analysis by By End-User, 2016-2032
- Figure 70: Eastern Europe Virtual Reality Content Creation Market Revenue (US$ Mn) Market Share by Country in 2022
- Figure 71: Eastern Europe Virtual Reality Content Creation Market Attractiveness Analysis by Country, 2016-2032
- Figure 72: Eastern Europe Virtual Reality Content Creation Market Revenue (US$ Mn) (2016-2032)
- Figure 73: Eastern Europe Virtual Reality Content Creation Market Revenue (US$ Mn) Comparison by Country (2016-2032)
- Figure 74: Eastern Europe Virtual Reality Content Creation Market Revenue (US$ Mn) Comparison by By Content Type (2016-2032)
- Figure 75: Eastern Europe Virtual Reality Content Creation Market Revenue (US$ Mn) Comparison by By Component (2016-2032)
- Figure 76: Eastern Europe Virtual Reality Content Creation Market Revenue (US$ Mn) Comparison by By End-User (2016-2032)
- Figure 77: Eastern Europe Virtual Reality Content Creation Market Y-o-Y Growth Rate Comparison by Country (2016-2032)
- Figure 78: Eastern Europe Virtual Reality Content Creation Market Y-o-Y Growth Rate Comparison by By Content Type (2016-2032)
- Figure 79: Eastern Europe Virtual Reality Content Creation Market Y-o-Y Growth Rate Comparison by By Component (2016-2032)
- Figure 80: Eastern Europe Virtual Reality Content Creation Market Y-o-Y Growth Rate Comparison by By End-User (2016-2032)
- Figure 81: Eastern Europe Virtual Reality Content Creation Market Share Comparison by Country (2016-2032)
- Figure 82: Eastern Europe Virtual Reality Content Creation Market Share Comparison by By Content Type (2016-2032)
- Figure 83: Eastern Europe Virtual Reality Content Creation Market Share Comparison by By Component (2016-2032)
- Figure 84: Eastern Europe Virtual Reality Content Creation Market Share Comparison by By End-User (2016-2032)
- Figure 85: APAC Virtual Reality Content Creation Market Revenue (US$ Mn) Market Share by By Content Typein 2022
- Figure 86: APAC Virtual Reality Content Creation Market Attractiveness Analysis by By Content Type, 2016-2032
- Figure 87: APAC Virtual Reality Content Creation Market Revenue (US$ Mn) Market Share by By Componentin 2022
- Figure 88: APAC Virtual Reality Content Creation Market Attractiveness Analysis by By Component, 2016-2032
- Figure 89: APAC Virtual Reality Content Creation Market Revenue (US$ Mn) Market Share by By End-Userin 2022
- Figure 90: APAC Virtual Reality Content Creation Market Attractiveness Analysis by By End-User, 2016-2032
- Figure 91: APAC Virtual Reality Content Creation Market Revenue (US$ Mn) Market Share by Country in 2022
- Figure 92: APAC Virtual Reality Content Creation Market Attractiveness Analysis by Country, 2016-2032
- Figure 93: APAC Virtual Reality Content Creation Market Revenue (US$ Mn) (2016-2032)
- Figure 94: APAC Virtual Reality Content Creation Market Revenue (US$ Mn) Comparison by Country (2016-2032)
- Figure 95: APAC Virtual Reality Content Creation Market Revenue (US$ Mn) Comparison by By Content Type (2016-2032)
- Figure 96: APAC Virtual Reality Content Creation Market Revenue (US$ Mn) Comparison by By Component (2016-2032)
- Figure 97: APAC Virtual Reality Content Creation Market Revenue (US$ Mn) Comparison by By End-User (2016-2032)
- Figure 98: APAC Virtual Reality Content Creation Market Y-o-Y Growth Rate Comparison by Country (2016-2032)
- Figure 99: APAC Virtual Reality Content Creation Market Y-o-Y Growth Rate Comparison by By Content Type (2016-2032)
- Figure 100: APAC Virtual Reality Content Creation Market Y-o-Y Growth Rate Comparison by By Component (2016-2032)
- Figure 101: APAC Virtual Reality Content Creation Market Y-o-Y Growth Rate Comparison by By End-User (2016-2032)
- Figure 102: APAC Virtual Reality Content Creation Market Share Comparison by Country (2016-2032)
- Figure 103: APAC Virtual Reality Content Creation Market Share Comparison by By Content Type (2016-2032)
- Figure 104: APAC Virtual Reality Content Creation Market Share Comparison by By Component (2016-2032)
- Figure 105: APAC Virtual Reality Content Creation Market Share Comparison by By End-User (2016-2032)
- Figure 106: Latin America Virtual Reality Content Creation Market Revenue (US$ Mn) Market Share by By Content Typein 2022
- Figure 107: Latin America Virtual Reality Content Creation Market Attractiveness Analysis by By Content Type, 2016-2032
- Figure 108: Latin America Virtual Reality Content Creation Market Revenue (US$ Mn) Market Share by By Componentin 2022
- Figure 109: Latin America Virtual Reality Content Creation Market Attractiveness Analysis by By Component, 2016-2032
- Figure 110: Latin America Virtual Reality Content Creation Market Revenue (US$ Mn) Market Share by By End-Userin 2022
- Figure 111: Latin America Virtual Reality Content Creation Market Attractiveness Analysis by By End-User, 2016-2032
- Figure 112: Latin America Virtual Reality Content Creation Market Revenue (US$ Mn) Market Share by Country in 2022
- Figure 113: Latin America Virtual Reality Content Creation Market Attractiveness Analysis by Country, 2016-2032
- Figure 114: Latin America Virtual Reality Content Creation Market Revenue (US$ Mn) (2016-2032)
- Figure 115: Latin America Virtual Reality Content Creation Market Revenue (US$ Mn) Comparison by Country (2016-2032)
- Figure 116: Latin America Virtual Reality Content Creation Market Revenue (US$ Mn) Comparison by By Content Type (2016-2032)
- Figure 117: Latin America Virtual Reality Content Creation Market Revenue (US$ Mn) Comparison by By Component (2016-2032)
- Figure 118: Latin America Virtual Reality Content Creation Market Revenue (US$ Mn) Comparison by By End-User (2016-2032)
- Figure 119: Latin America Virtual Reality Content Creation Market Y-o-Y Growth Rate Comparison by Country (2016-2032)
- Figure 120: Latin America Virtual Reality Content Creation Market Y-o-Y Growth Rate Comparison by By Content Type (2016-2032)
- Figure 121: Latin America Virtual Reality Content Creation Market Y-o-Y Growth Rate Comparison by By Component (2016-2032)
- Figure 122: Latin America Virtual Reality Content Creation Market Y-o-Y Growth Rate Comparison by By End-User (2016-2032)
- Figure 123: Latin America Virtual Reality Content Creation Market Share Comparison by Country (2016-2032)
- Figure 124: Latin America Virtual Reality Content Creation Market Share Comparison by By Content Type (2016-2032)
- Figure 125: Latin America Virtual Reality Content Creation Market Share Comparison by By Component (2016-2032)
- Figure 126: Latin America Virtual Reality Content Creation Market Share Comparison by By End-User (2016-2032)
- Figure 127: Middle East & Africa Virtual Reality Content Creation Market Revenue (US$ Mn) Market Share by By Content Typein 2022
- Figure 128: Middle East & Africa Virtual Reality Content Creation Market Attractiveness Analysis by By Content Type, 2016-2032
- Figure 129: Middle East & Africa Virtual Reality Content Creation Market Revenue (US$ Mn) Market Share by By Componentin 2022
- Figure 130: Middle East & Africa Virtual Reality Content Creation Market Attractiveness Analysis by By Component, 2016-2032
- Figure 131: Middle East & Africa Virtual Reality Content Creation Market Revenue (US$ Mn) Market Share by By End-Userin 2022
- Figure 132: Middle East & Africa Virtual Reality Content Creation Market Attractiveness Analysis by By End-User, 2016-2032
- Figure 133: Middle East & Africa Virtual Reality Content Creation Market Revenue (US$ Mn) Market Share by Country in 2022
- Figure 134: Middle East & Africa Virtual Reality Content Creation Market Attractiveness Analysis by Country, 2016-2032
- Figure 135: Middle East & Africa Virtual Reality Content Creation Market Revenue (US$ Mn) (2016-2032)
- Figure 136: Middle East & Africa Virtual Reality Content Creation Market Revenue (US$ Mn) Comparison by Country (2016-2032)
- Figure 137: Middle East & Africa Virtual Reality Content Creation Market Revenue (US$ Mn) Comparison by By Content Type (2016-2032)
- Figure 138: Middle East & Africa Virtual Reality Content Creation Market Revenue (US$ Mn) Comparison by By Component (2016-2032)
- Figure 139: Middle East & Africa Virtual Reality Content Creation Market Revenue (US$ Mn) Comparison by By End-User (2016-2032)
- Figure 140: Middle East & Africa Virtual Reality Content Creation Market Y-o-Y Growth Rate Comparison by Country (2016-2032)
- Figure 141: Middle East & Africa Virtual Reality Content Creation Market Y-o-Y Growth Rate Comparison by By Content Type (2016-2032)
- Figure 142: Middle East & Africa Virtual Reality Content Creation Market Y-o-Y Growth Rate Comparison by By Component (2016-2032)
- Figure 143: Middle East & Africa Virtual Reality Content Creation Market Y-o-Y Growth Rate Comparison by By End-User (2016-2032)
- Figure 144: Middle East & Africa Virtual Reality Content Creation Market Share Comparison by Country (2016-2032)
- Figure 145: Middle East & Africa Virtual Reality Content Creation Market Share Comparison by By Content Type (2016-2032)
- Figure 146: Middle East & Africa Virtual Reality Content Creation Market Share Comparison by By Component (2016-2032)
- Figure 147: Middle East & Africa Virtual Reality Content Creation Market Share Comparison by By End-User (2016-2032)
- List of Tables
- Table 1: Global Virtual Reality Content Creation Market Comparison by By Content Type (2016-2032)
- Table 2: Global Virtual Reality Content Creation Market Comparison by By Component (2016-2032)
- Table 3: Global Virtual Reality Content Creation Market Comparison by By End-User (2016-2032)
- Table 4: Global Virtual Reality Content Creation Market Revenue (US$ Mn) Comparison by Region (2016-2032)
- Table 5: Global Virtual Reality Content Creation Market Revenue (US$ Mn) (2016-2032)
- Table 6: Global Virtual Reality Content Creation Market Revenue (US$ Mn) Comparison by Region (2016-2032)
- Table 7: Global Virtual Reality Content Creation Market Revenue (US$ Mn) Comparison by By Content Type (2016-2032)
- Table 8: Global Virtual Reality Content Creation Market Revenue (US$ Mn) Comparison by By Component (2016-2032)
- Table 9: Global Virtual Reality Content Creation Market Revenue (US$ Mn) Comparison by By End-User (2016-2032)
- Table 10: Global Virtual Reality Content Creation Market Y-o-Y Growth Rate Comparison by Region (2016-2032)
- Table 11: Global Virtual Reality Content Creation Market Y-o-Y Growth Rate Comparison by By Content Type (2016-2032)
- Table 12: Global Virtual Reality Content Creation Market Y-o-Y Growth Rate Comparison by By Component (2016-2032)
- Table 13: Global Virtual Reality Content Creation Market Y-o-Y Growth Rate Comparison by By End-User (2016-2032)
- Table 14: Global Virtual Reality Content Creation Market Share Comparison by Region (2016-2032)
- Table 15: Global Virtual Reality Content Creation Market Share Comparison by By Content Type (2016-2032)
- Table 16: Global Virtual Reality Content Creation Market Share Comparison by By Component (2016-2032)
- Table 17: Global Virtual Reality Content Creation Market Share Comparison by By End-User (2016-2032)
- Table 18: North America Virtual Reality Content Creation Market Comparison by By Component (2016-2032)
- Table 19: North America Virtual Reality Content Creation Market Comparison by By End-User (2016-2032)
- Table 20: North America Virtual Reality Content Creation Market Revenue (US$ Mn) Comparison by Country (2016-2032)
- Table 21: North America Virtual Reality Content Creation Market Revenue (US$ Mn) (2016-2032)
- Table 22: North America Virtual Reality Content Creation Market Revenue (US$ Mn) Comparison by Country (2016-2032)
- Table 23: North America Virtual Reality Content Creation Market Revenue (US$ Mn) Comparison by By Content Type (2016-2032)
- Table 24: North America Virtual Reality Content Creation Market Revenue (US$ Mn) Comparison by By Component (2016-2032)
- Table 25: North America Virtual Reality Content Creation Market Revenue (US$ Mn) Comparison by By End-User (2016-2032)
- Table 26: North America Virtual Reality Content Creation Market Y-o-Y Growth Rate Comparison by Country (2016-2032)
- Table 27: North America Virtual Reality Content Creation Market Y-o-Y Growth Rate Comparison by By Content Type (2016-2032)
- Table 28: North America Virtual Reality Content Creation Market Y-o-Y Growth Rate Comparison by By Component (2016-2032)
- Table 29: North America Virtual Reality Content Creation Market Y-o-Y Growth Rate Comparison by By End-User (2016-2032)
- Table 30: North America Virtual Reality Content Creation Market Share Comparison by Country (2016-2032)
- Table 31: North America Virtual Reality Content Creation Market Share Comparison by By Content Type (2016-2032)
- Table 32: North America Virtual Reality Content Creation Market Share Comparison by By Component (2016-2032)
- Table 33: North America Virtual Reality Content Creation Market Share Comparison by By End-User (2016-2032)
- Table 34: Western Europe Virtual Reality Content Creation Market Comparison by By Content Type (2016-2032)
- Table 35: Western Europe Virtual Reality Content Creation Market Comparison by By Component (2016-2032)
- Table 36: Western Europe Virtual Reality Content Creation Market Comparison by By End-User (2016-2032)
- Table 37: Western Europe Virtual Reality Content Creation Market Revenue (US$ Mn) Comparison by Country (2016-2032)
- Table 38: Western Europe Virtual Reality Content Creation Market Revenue (US$ Mn) (2016-2032)
- Table 39: Western Europe Virtual Reality Content Creation Market Revenue (US$ Mn) Comparison by Country (2016-2032)
- Table 40: Western Europe Virtual Reality Content Creation Market Revenue (US$ Mn) Comparison by By Content Type (2016-2032)
- Table 41: Western Europe Virtual Reality Content Creation Market Revenue (US$ Mn) Comparison by By Component (2016-2032)
- Table 42: Western Europe Virtual Reality Content Creation Market Revenue (US$ Mn) Comparison by By End-User (2016-2032)
- Table 43: Western Europe Virtual Reality Content Creation Market Y-o-Y Growth Rate Comparison by Country (2016-2032)
- Table 44: Western Europe Virtual Reality Content Creation Market Y-o-Y Growth Rate Comparison by By Content Type (2016-2032)
- Table 45: Western Europe Virtual Reality Content Creation Market Y-o-Y Growth Rate Comparison by By Component (2016-2032)
- Table 46: Western Europe Virtual Reality Content Creation Market Y-o-Y Growth Rate Comparison by By End-User (2016-2032)
- Table 47: Western Europe Virtual Reality Content Creation Market Share Comparison by Country (2016-2032)
- Table 48: Western Europe Virtual Reality Content Creation Market Share Comparison by By Content Type (2016-2032)
- Table 49: Western Europe Virtual Reality Content Creation Market Share Comparison by By Component (2016-2032)
- Table 50: Western Europe Virtual Reality Content Creation Market Share Comparison by By End-User (2016-2032)
- Table 51: Eastern Europe Virtual Reality Content Creation Market Comparison by By Content Type (2016-2032)
- Table 52: Eastern Europe Virtual Reality Content Creation Market Comparison by By Component (2016-2032)
- Table 53: Eastern Europe Virtual Reality Content Creation Market Comparison by By End-User (2016-2032)
- Table 54: Eastern Europe Virtual Reality Content Creation Market Revenue (US$ Mn) Comparison by Country (2016-2032)
- Table 55: Eastern Europe Virtual Reality Content Creation Market Revenue (US$ Mn) (2016-2032)
- Table 56: Eastern Europe Virtual Reality Content Creation Market Revenue (US$ Mn) Comparison by Country (2016-2032)
- Table 57: Eastern Europe Virtual Reality Content Creation Market Revenue (US$ Mn) Comparison by By Content Type (2016-2032)
- Table 58: Eastern Europe Virtual Reality Content Creation Market Revenue (US$ Mn) Comparison by By Component (2016-2032)
- Table 59: Eastern Europe Virtual Reality Content Creation Market Revenue (US$ Mn) Comparison by By End-User (2016-2032)
- Table 60: Eastern Europe Virtual Reality Content Creation Market Y-o-Y Growth Rate Comparison by Country (2016-2032)
- Table 61: Eastern Europe Virtual Reality Content Creation Market Y-o-Y Growth Rate Comparison by By Content Type (2016-2032)
- Table 62: Eastern Europe Virtual Reality Content Creation Market Y-o-Y Growth Rate Comparison by By Component (2016-2032)
- Table 63: Eastern Europe Virtual Reality Content Creation Market Y-o-Y Growth Rate Comparison by By End-User (2016-2032)
- Table 64: Eastern Europe Virtual Reality Content Creation Market Share Comparison by Country (2016-2032)
- Table 65: Eastern Europe Virtual Reality Content Creation Market Share Comparison by By Content Type (2016-2032)
- Table 66: Eastern Europe Virtual Reality Content Creation Market Share Comparison by By Component (2016-2032)
- Table 67: Eastern Europe Virtual Reality Content Creation Market Share Comparison by By End-User (2016-2032)
- Table 68: APAC Virtual Reality Content Creation Market Comparison by By Content Type (2016-2032)
- Table 69: APAC Virtual Reality Content Creation Market Comparison by By Component (2016-2032)
- Table 70: APAC Virtual Reality Content Creation Market Comparison by By End-User (2016-2032)
- Table 71: APAC Virtual Reality Content Creation Market Revenue (US$ Mn) Comparison by Country (2016-2032)
- Table 72: APAC Virtual Reality Content Creation Market Revenue (US$ Mn) (2016-2032)
- Table 73: APAC Virtual Reality Content Creation Market Revenue (US$ Mn) Comparison by Country (2016-2032)
- Table 74: APAC Virtual Reality Content Creation Market Revenue (US$ Mn) Comparison by By Content Type (2016-2032)
- Table 75: APAC Virtual Reality Content Creation Market Revenue (US$ Mn) Comparison by By Component (2016-2032)
- Table 76: APAC Virtual Reality Content Creation Market Revenue (US$ Mn) Comparison by By End-User (2016-2032)
- Table 77: APAC Virtual Reality Content Creation Market Y-o-Y Growth Rate Comparison by Country (2016-2032)
- Table 78: APAC Virtual Reality Content Creation Market Y-o-Y Growth Rate Comparison by By Content Type (2016-2032)
- Table 79: APAC Virtual Reality Content Creation Market Y-o-Y Growth Rate Comparison by By Component (2016-2032)
- Table 80: APAC Virtual Reality Content Creation Market Y-o-Y Growth Rate Comparison by By End-User (2016-2032)
- Table 81: APAC Virtual Reality Content Creation Market Share Comparison by Country (2016-2032)
- Table 82: APAC Virtual Reality Content Creation Market Share Comparison by By Content Type (2016-2032)
- Table 83: APAC Virtual Reality Content Creation Market Share Comparison by By Component (2016-2032)
- Table 84: APAC Virtual Reality Content Creation Market Share Comparison by By End-User (2016-2032)
- Table 85: Latin America Virtual Reality Content Creation Market Comparison by By Content Type (2016-2032)
- Table 86: Latin America Virtual Reality Content Creation Market Comparison by By Component (2016-2032)
- Table 87: Latin America Virtual Reality Content Creation Market Comparison by By End-User (2016-2032)
- Table 88: Latin America Virtual Reality Content Creation Market Revenue (US$ Mn) Comparison by Country (2016-2032)
- Table 89: Latin America Virtual Reality Content Creation Market Revenue (US$ Mn) (2016-2032)
- Table 90: Latin America Virtual Reality Content Creation Market Revenue (US$ Mn) Comparison by Country (2016-2032)
- Table 91: Latin America Virtual Reality Content Creation Market Revenue (US$ Mn) Comparison by By Content Type (2016-2032)
- Table 92: Latin America Virtual Reality Content Creation Market Revenue (US$ Mn) Comparison by By Component (2016-2032)
- Table 93: Latin America Virtual Reality Content Creation Market Revenue (US$ Mn) Comparison by By End-User (2016-2032)
- Table 94: Latin America Virtual Reality Content Creation Market Y-o-Y Growth Rate Comparison by Country (2016-2032)
- Table 95: Latin America Virtual Reality Content Creation Market Y-o-Y Growth Rate Comparison by By Content Type (2016-2032)
- Table 96: Latin America Virtual Reality Content Creation Market Y-o-Y Growth Rate Comparison by By Component (2016-2032)
- Table 97: Latin America Virtual Reality Content Creation Market Y-o-Y Growth Rate Comparison by By End-User (2016-2032)
- Table 98: Latin America Virtual Reality Content Creation Market Share Comparison by Country (2016-2032)
- Table 99: Latin America Virtual Reality Content Creation Market Share Comparison by By Content Type (2016-2032)
- Table 100: Latin America Virtual Reality Content Creation Market Share Comparison by By Component (2016-2032)
- Table 101: Latin America Virtual Reality Content Creation Market Share Comparison by By End-User (2016-2032)
- Table 102: Middle East & Africa Virtual Reality Content Creation Market Comparison by By Content Type (2016-2032)
- Table 103: Middle East & Africa Virtual Reality Content Creation Market Comparison by By Component (2016-2032)
- Table 104: Middle East & Africa Virtual Reality Content Creation Market Comparison by By End-User (2016-2032)
- Table 105: Middle East & Africa Virtual Reality Content Creation Market Revenue (US$ Mn) Comparison by Country (2016-2032)
- Table 106: Middle East & Africa Virtual Reality Content Creation Market Revenue (US$ Mn) (2016-2032)
- Table 107: Middle East & Africa Virtual Reality Content Creation Market Revenue (US$ Mn) Comparison by Country (2016-2032)
- Table 108: Middle East & Africa Virtual Reality Content Creation Market Revenue (US$ Mn) Comparison by By Content Type (2016-2032)
- Table 109: Middle East & Africa Virtual Reality Content Creation Market Revenue (US$ Mn) Comparison by By Component (2016-2032)
- Table 110: Middle East & Africa Virtual Reality Content Creation Market Revenue (US$ Mn) Comparison by By End-User (2016-2032)
- Table 111: Middle East & Africa Virtual Reality Content Creation Market Y-o-Y Growth Rate Comparison by Country (2016-2032)
- Table 112: Middle East & Africa Virtual Reality Content Creation Market Y-o-Y Growth Rate Comparison by By Content Type (2016-2032)
- Table 113: Middle East & Africa Virtual Reality Content Creation Market Y-o-Y Growth Rate Comparison by By Component (2016-2032)
- Table 114: Middle East & Africa Virtual Reality Content Creation Market Y-o-Y Growth Rate Comparison by By End-User (2016-2032)
- Table 115: Middle East & Africa Virtual Reality Content Creation Market Share Comparison by Country (2016-2032)
- Table 116: Middle East & Africa Virtual Reality Content Creation Market Share Comparison by By Content Type (2016-2032)
- Table 117: Middle East & Africa Virtual Reality Content Creation Market Share Comparison by By Component (2016-2032)
- Table 118: Middle East & Africa Virtual Reality Content Creation Market Share Comparison by By End-User (2016-2032)
- 1. Executive Summary
Inquiry Form
Why Choose Us
- 360 Degree Approach
- Growth Consulting
- 24/7 Research Support
- Comprehensive-Level of Customization
- Competitive Intelligence
- Single-Country/ Region Intelligence
- Post-Sale Service Assistance
- Access to Lead Analysts
- Available in PDF, Excel, Word/ PPT
Request for Customization
OUR CLIENTS
Don't just take our word. We are trusted by these great companies!