
Global Ev Connectors Market By Type(CCS, Chademo, GB/T, Tesla), By Charging level(Level 1, Level 2, Level 3 , Level 4), By Charging speed(Slow, Fast), By Voltage(AC, DC), By Application(Residential, Commercial), By Region And Companies - Industry Segment Outlook, Market Assessment, Competition Scenario, Trends, And Forecast 2024-2033
-
37451
-
August 2024
-
300
-


-
This report was compiled by Vishwa Gaul Vishwa is an experienced market research and consulting professional with over 8 years of expertise in the ICT industry, contributing to over 700 reports across telecommunications, software, hardware, and digital solutions. Correspondence Team Lead- ICT Linkedin | Detailed Market research Methodology Our methodology involves a mix of primary research, including interviews with leading mental health experts, and secondary research from reputable medical journals and databases. View Detailed Methodology Page
-
Quick Navigation
Report Overview
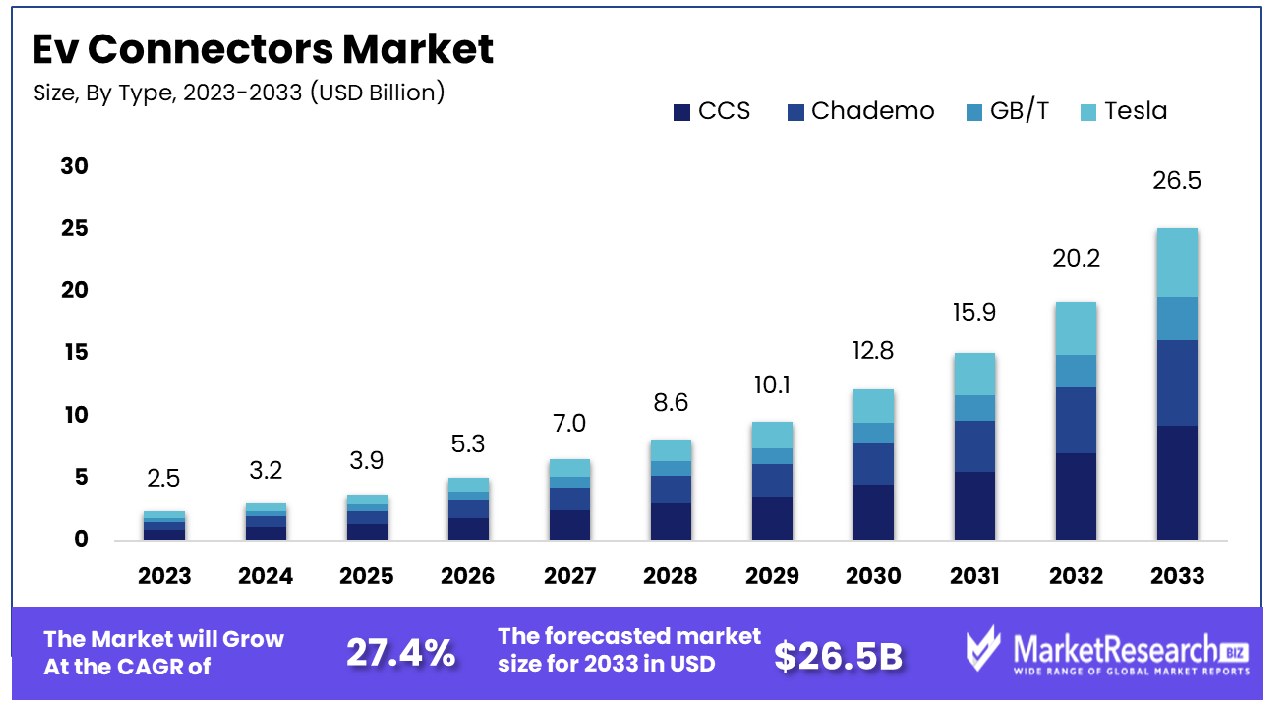
The Global Ev Connectors Market was valued at USD 2.5 billion in 2023. It is expected to reach USD 26.5 billion by 2033, with a CAGR of 27.4% during the forecast period from 2024 to 2033.
The EV Connectors Market comprises entities engaged in manufacturing and distributing electrical connection interfaces for electric vehicles (EVs). These connectors are essential for charging and power transfer between the vehicle and the charging station. As the electrification of transportation gains momentum globally, the demand for efficient, reliable, and standardized EV connectors intensifies.
This market is critical for supporting the infrastructure needed to sustain the growing adoption of electric vehicles. Strategic developments in this sector focus on innovation in connector technology, compatibility across different vehicle models, and compliance with international safety standards, aiming to enhance user convenience and promote widespread EV usage.
The EV Connectors Market is positioned at a crucial juncture, reflecting the pivotal role of infrastructure in the broader transition towards electric vehicles. As stakeholders intensify their focus on reducing carbon emissions, the demand for advanced, efficient EV charging solutions escalates, driving significant developments within this sector. Currently, the market offers a range of connector options tailored to diverse user needs and technological capacities.
For instance, basic Level 1 connectors utilize a standard 120V outlet, which, while widely accessible, provides a slow charge, adding approximately 5 km or 3 miles per hour to the vehicle's range, with full charge times extending beyond 20 hours. This option, although slow, presents a low-barrier entry point for EV owners without access to more sophisticated infrastructure.
In contrast, Level 2 connectors operate on a 240V outlet, enhancing charging efficiency substantially with speeds ranging from 30–50 km (20–30 miles) per hour and reducing full charge times to between 6 and 14 hours. This category has become a standard for residential and commercial settings, balancing speed and accessibility.
At the pinnacle of charging technology, direct current (DC) fast chargers revolutionize the market by offering rapid charging capabilities, achieving up to 200 km (124 miles) per hour and dramatically diminishing full charge times to between 20 minutes and an hour. This technology caters to commercial fleets and public charging stations, facilitating longer journeys and reducing downtime for vehicles.
The strategic importance of developing and enhancing EV connector technologies cannot be overstated. Innovations in this field are not only crucial for meeting consumer demand but also for fostering the scalability of electric mobility, aligning with global sustainability goals. The EV Connectors Market is expected to witness robust growth, driven by technological advancements, regulatory support, and increased consumer adoption of electric vehicles.
Key Takeaways
- Market Growth: The Global Ev Connectors Market was valued at USD 2.5 billion in 2023. It is expected to reach USD 26.5 billion by 2033, with a CAGR of 27.4% during the forecast period from 2024 to 2033.
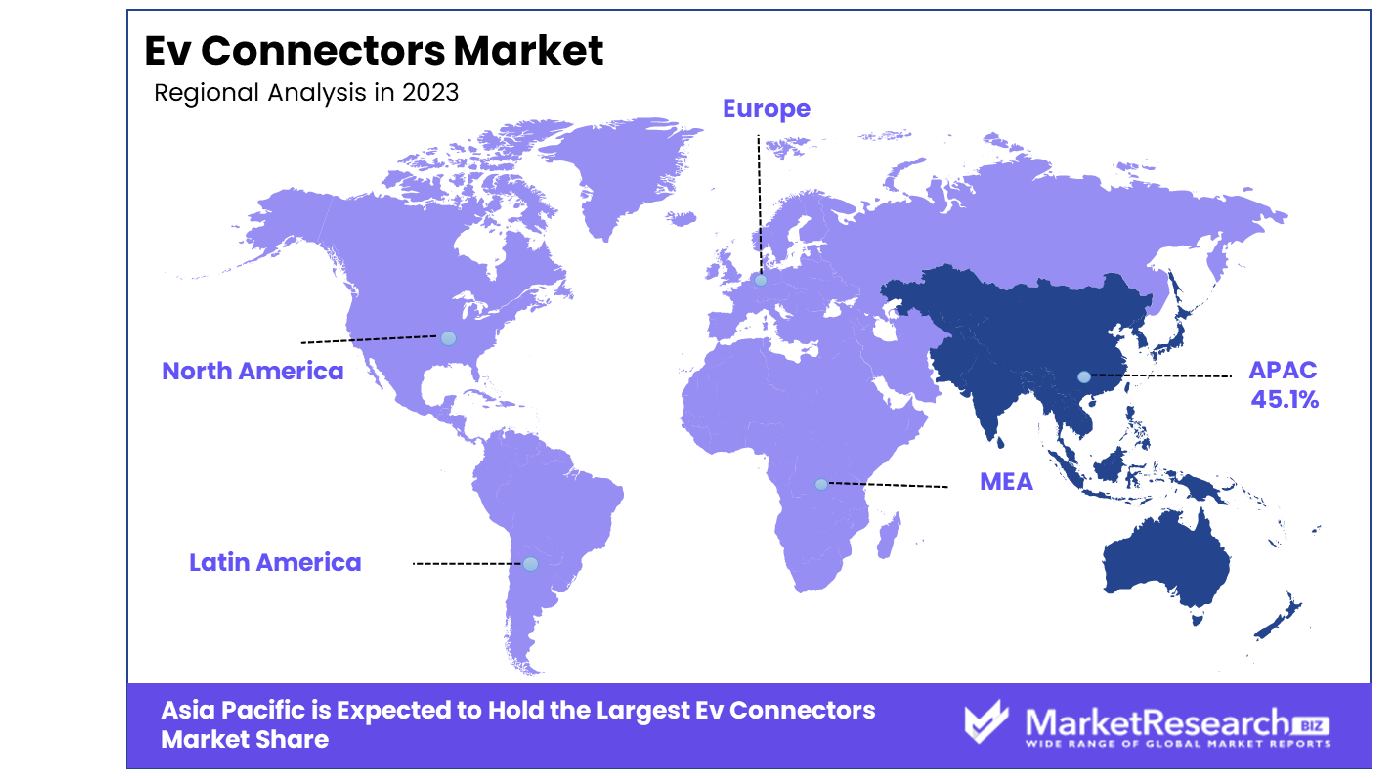
- Regional Dominance: Asia Pacific dominates the EV Connectors Market with a 45.1% share.
- By Type: CCS connectors lead the market by type with 40%.
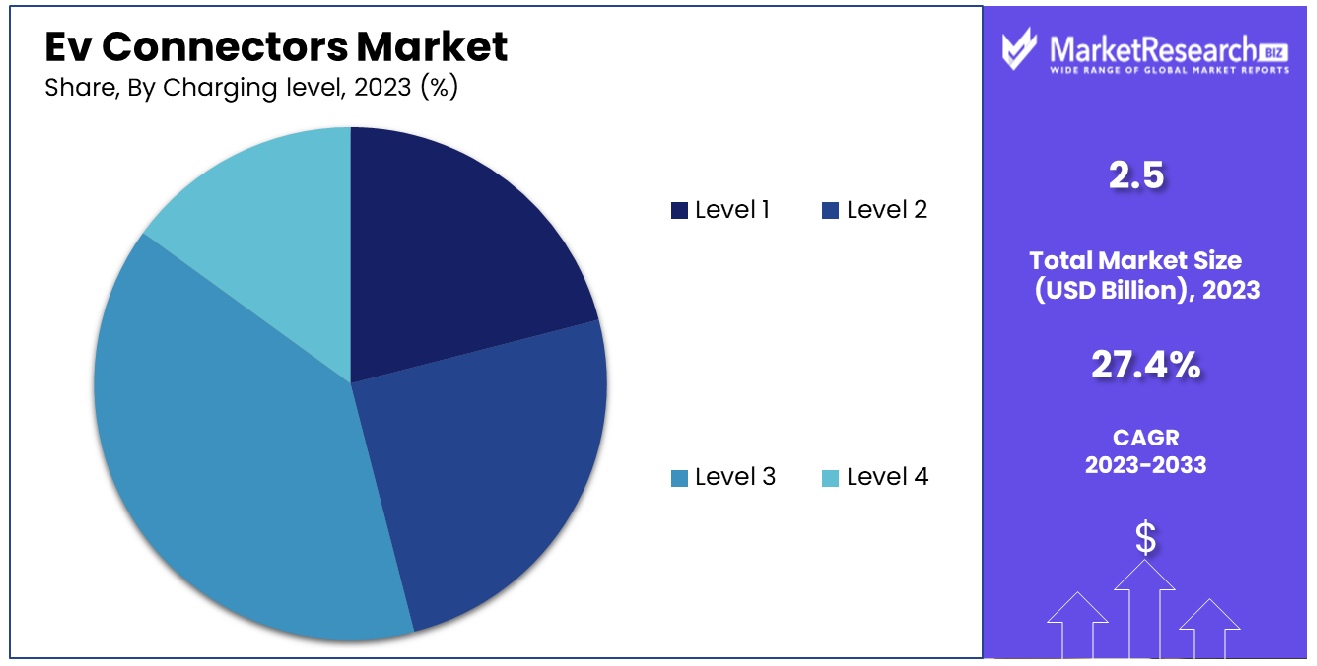
- By Charging level: Level 3 charging dominates levels, capturing 50% of the market.
- By Charging speed: Fast charging speed is dominant, holding 70% market share.
- By Voltage: DC voltage predominates, accounting for 60% of the market.
- By Application: Commercial applications lead, constituting 60% of the market use.
Driving factors
Increasing Adoption of Electric Vehicles (EVs)
The surge in electric vehicle (EV) adoption is a primary catalyst driving the expansion of the EV Connectors Market. As more consumers and enterprises transition towards sustainable transportation options, the demand for robust and efficient charging infrastructure escalates.
This uptrend in EV sales, fueled by heightened environmental awareness and the proliferation of more affordable EV models, necessitates a parallel growth in charging facilities, including advanced connectors that ensure compatibility and safety. The correlation between the number of EVs on the road and the requirement for more charging points directly boosts the market for EV connectors.
Government Incentives and Subsidies for EV Infrastructure
Government policies play a pivotal role in shaping the EV Connectors Market. Incentives and subsidies designed to bolster EV adoption also extend to supporting infrastructure development. Governments worldwide are not only encouraging EV purchases through rebates and tax benefits but are also investing in the establishment of public charging networks.
Such policies lower the financial barriers for new charging stations, promoting the deployment of both standard and fast-charging connectors. This governmental push significantly lowers entry barriers for new market entrants and accelerates the build-out of necessary charging infrastructure, thereby driving demand for innovative connector solutions.
Advancements in Fast Charging Technology
The evolution of fast charging technology is revolutionizing the EV Connectors Market. As fast chargers become more efficient, offering substantial charges in minimal time, they address one of the critical pain points for EV adoption—charging duration. Modern fast chargers, capable of delivering speeds up to 200 km per hour, reduce EV downtime drastically, appealing to both private and commercial users.
The development of such technologies not only enhances user convenience but also amplifies the operational feasibility of EVs for longer journeys, thus expanding the overall market for high-performance EV connectors. This technological trajectory is anticipated to continue, propelling the market forward with innovations that meet the fast-evolving standards of the automotive industry.
Restraining Factors
High Installation Cost of Charging Stations
The substantial initial investment required for the installation of charging stations is a significant restraining factor in the growth of the EV Connectors Market. Establishing a network of reliable and accessible EV charging stations involves high costs associated with infrastructure, such as electrical upgrades and real estate, along with the actual hardware of the stations and connectors.
These expenses can be prohibitive for new market entrants and may slow the expansion rate of charging networks, particularly in regions lacking governmental or financial incentives. This financial barrier not only restricts the deployment of new charging points but also influences the pace at which existing stations are upgraded with advanced connector technologies, ultimately impacting the overall market expansion.
Compatibility Issues Between Different Connector Types
Compatibility remains a critical challenge within the EV Connectors Market. As different automakers design and implement proprietary connectors for their EV models, the lack of standardization across the industry leads to significant usability issues. This fragmentation forces consumers to seek specific charging stations that match their vehicle’s connector type, reducing the convenience and perceived benefit of EVs.
Furthermore, compatibility issues can deter new users from transitioning to electric vehicles, as the uncertainty about charging options adds a layer of complexity to EV ownership. Addressing these compatibility challenges is crucial for market growth, as greater standardization would not only enhance user convenience but also streamline the manufacturing and distribution of EV connectors, potentially reducing costs and accelerating market expansion.
By Type Analysis
The CCS type significantly dominated the market, holding a robust 40% share in 2023.
In 2023, CCS (Combined Charging System) held a dominant market position in the "By Type" segment of the EV Connectors Market, capturing more than a 40% share. This substantial market penetration is attributed to the widespread adoption of CCS standards by leading automotive manufacturers in Europe and North America, which have prioritized interoperability and fast-charging capabilities. The CCS technology facilitates rapid charging, a crucial factor driving consumer preference amidst growing electric vehicle adoption.
CHAdeMO, initially leading in Japan, secured a smaller portion of the global market, reflecting regional preferences and the gradual pivot of Japanese automakers towards CCS standards. Its market presence underscores the technological diversity within the EV connectors landscape and highlights the ongoing competition between global charging standards.
The GB/T connector, predominant in the Chinese market, has demonstrated significant influence within Asia. The standard benefits from state-backed initiatives aimed at promoting electric vehicles in China, the largest EV market globally. The integration of GB/T standards into local infrastructure projects and domestic vehicle designs emphasizes its critical role in shaping the regional EV ecosystem.
Tesla’s proprietary connector maintains a niche but noteworthy segment, particularly in the United States, where Tesla continues to expand its dedicated Supercharger network. Although it represents a smaller share compared to CCS, Tesla’s innovation in charging technology and infrastructure development remains pivotal in advancing EV adoption and influencing market trends.
By Charging level Analysis
Level 3 charging, designed for rapid energy delivery, captured a commanding 50% of the market.
In 2023, Level 3 held a dominant market position in the "By Charging Level" segment of the EV Connectors Market, capturing more than a 50% share. This substantial market control can be attributed to the increasing adoption of rapid charging technologies, which are integral to supporting the high throughput needs of contemporary electric vehicles. Level 3 connectors, commonly referred to as DC fast chargers, offer the advantage of significantly reduced charging times compared to their Level 1 and Level 2 counterparts, which primarily provide AC charging solutions.
Level 1 connectors, typically utilized for residential charging, accounted for the smallest market share, as they offer the slowest charging speeds. On the other hand, Level 2 connectors, which are used both in residential and commercial settings, held a moderate market share. These connectors support a more extensive range of applications than Level 1 and are favored for overnight charging or at workplaces.
Level 4 charging technology, which is still in the nascent stages of development and deployment, represented a minimal portion of the market in 2023. This segment is expected to grow as technological advancements pave the way for ultra-fast charging solutions that could revolutionize how energy is delivered to electric vehicles.
The dominance of Level 3 in the market underscores the trend towards optimizing charging time, which is a critical factor in the consumer adoption of electric vehicles. As infrastructure expands and technology improves, the dynamics within this segment are anticipated to evolve, potentially increasing the competitive pressure on Level 3 while opening new opportunities for Levels 1, 2, and 4.
By Charging Speed Analysis
Fast charging speeds prevailed, constituting 70% of the market, appealing to consumers seeking convenience.
In 2023, Fast chargers held a dominant market position in the "By Charging Speed" segment of the EV Connectors Market, capturing more than a 70% share. This commanding presence is primarily driven by the increasing demand for reduced charging times and enhanced convenience among electric vehicle users. Fast chargers, which significantly shorten the charging process compared to their slow counterparts, have become increasingly vital in commercial settings and public charging stations, where time efficiency is a critical factor.
The slow charging segment, typically utilized for overnight residential charging or at locations where vehicles remain parked for extended periods, retained a smaller share of the market. These chargers are often perceived as more economical due to lower installation and maintenance costs, but their lengthy charging times limit their appeal for users needing quicker turnaround.
The overwhelming preference for fast chargers underscores the market's shift towards supporting a lifestyle that aligns more closely with the traditional fueling experience—quick and convenient. This trend is facilitated by technological advancements that allow fast chargers to provide substantial charge in short durations, making electric vehicles more appealing to the general public and fleet operators.
Looking forward, the fast-charging segment is expected to maintain its dominance as infrastructure development continues to focus on expanding the availability of quick-charging stations. This expansion is anticipated to further propel the adoption of electric vehicles, affirming the pivotal role of fast-charging technology in the growth of the global EV market.
By Voltage Analysis
DC voltage, known for its efficiency in fast charging, dominated with a 60% market share.
In 2023, DC connectors held a dominant market position in the "By Voltage" segment of the EV Connectors Market, capturing more than a 60% share. This predominance is largely due to the rapid charging capabilities that DC connectors offer, which significantly reduces charging time compared to AC connectors. The preference for DC connectors is especially pronounced in commercial and public charging settings, where the need for speed is paramount to accommodate the high turnover of vehicles requiring quick energy replenishment.
AC connectors, which are typically used for residential charging due to their slower charging speeds, occupy a lesser share of the market. These connectors remain popular for home use because they align well with overnight charging habits and are compatible with the existing residential electrical infrastructure. However, their slower charging rates make them less ideal for drivers who require a quick charge on the go.
The market's tilt toward DC charging underscores a broader trend in the electric vehicle industry toward enhancing user convenience and reducing downtime, which is crucial for broader EV adoption. As electric vehicle ownership increases, the demand for faster, more efficient charging solutions is expected to rise, potentially increasing the market share for DC connectors even further.
Future advancements in technology and reductions in the cost of DC charging equipment could further consolidate its dominance in the market, while also potentially expanding its use in residential settings as consumers seek more efficient home charging solutions.
By Application Analysis
The commercial application led, occupying 60% of the market, driven by business and fleet usage.
In 2023, the Commercial segment held a dominant market position in the "By Application" segment of the EV Connectors Market, capturing more than a 60% share. This significant market presence reflects the growing installation of EV charging stations in commercial venues such as shopping centers, public parking spaces, and business complexes. The push for commercial charging infrastructure is largely driven by governmental policies and incentives aimed at promoting electric vehicle adoption, alongside growing consumer demand for accessible and rapid charging options outside of the home.
Conversely, the Residential segment, which encompasses home-based charging solutions, accounted for a smaller portion of the market. Despite the convenience of home charging, the growth in this segment has been somewhat tempered by the slower adoption rate of individual charging equipment and the continuing need for infrastructure improvements in residential settings.
The predominance of commercial applications highlights the strategic focus on developing EV charging as a service, which not only supports the existing population of electric vehicle owners but also entices potential buyers by alleviating range anxiety. The expansion of commercial charging facilities is expected to continue, driven by investments from both public and private sectors.
Moving forward, the market is likely to witness even greater growth in the commercial sector as new business models emerge around EV charging services, including subscription plans and integrated vehicle-to-grid systems, further cementing the importance of commercial applications in the EV connectors market.
Key Market Segments
By Type
- CCS
- Chademo
- GB/T
- Tesla
By Charging level
- Level 1
- Level 2
- Level 3
- Level 4
By Charging speed
- Slow
- Fast
By Voltage
- AC
- DC
By Application
- Residential
- Commercial
Growth Opportunity
Expansion into Developing Markets
The year 2023 presents significant opportunities for the global EV Connectors Market, particularly through expansion into developing markets. As countries in regions such as Asia, Africa, and Latin America increase their focus on sustainable development, the demand for electric vehicle infrastructure is expected to rise sharply. These markets offer a vast new consumer base and are often supported by government policies aimed at reducing carbon emissions and enhancing energy efficiency.
The expansion into these areas not only opens up new revenue streams for companies in the EV Connectors Market but also diversifies the geographical risk and dependency on more mature markets. Moreover, developing markets frequently leapfrog older technologies directly to newer solutions, providing a ripe environment for the adoption of advanced EV technologies and infrastructure.
Innovations in Wireless Charging Technologies
Innovations in wireless charging technologies are set to redefine the landscape of the EV Connectors Market in 2023. Wireless EV charging systems, which allow for the automatic charging of electric vehicles without the need for physical connectors, represent a breakthrough in convenience and functionality. These systems can drastically simplify the charging process, reducing wear and tear on traditional connectors and potentially increasing the adoption of EVs due to the enhanced user experience.
The development and refinement of such technologies are likely to attract investment and research, driving the market forward. Companies that pioneer these innovations could establish strong competitive advantages, setting the stage for leadership in a rapidly evolving industry. As these technologies mature, they could become a key differentiator in the EV infrastructure, catalyzing further growth in the global EV Connectors Market.
Latest Trends
Emergence of Ultra-Fast Charging Stations
The emergence of ultra-fast charging stations is a definitive trend shaping the EV Connectors Market in 2023. As the electric vehicle market grows, so does the demand for reduced charging times, driving significant investment in ultra-fast charging technologies. These stations can dramatically accelerate the charging process, offering rates that can replenish significant portions of an EV’s battery in just minutes, compared to the hours required by earlier models.
This capability is not only more convenient for consumers but also critical for the feasibility of electric vehicles in commercial and heavy-duty applications, where downtime for charging is a major operational concern. The deployment of ultra-fast charging stations is expected to bolster the appeal of electric vehicles, enhancing their viability as a replacement for traditional combustion engines and pushing the boundaries of what's possible within the EV charging infrastructure.
Integration of Smart Features in EV Connectors
Another trend gaining momentum in 2023 is the integration of smart features into EV connectors. Smart connectors enhance the user experience by providing features such as real-time charging data, remote control via smartphone apps, and enhanced security measures to prevent unauthorized usage. Furthermore, these intelligent systems can optimize power consumption based on grid demand, contributing to more efficient energy use and supporting grid stability.
The sophistication of these smart connectors aligns with broader trends toward IoT (Internet of Things) and home automation technologies, creating a more interconnected and user-friendly charging ecosystem. As consumers become increasingly tech-savvy, the demand for these advanced features is expected to grow, thereby driving further innovations and developments in the EV Connectors Market.
Regional Analysis
The Asia Pacific region leads the EV Connectors Market, holding a dominant share of 45.1%.
The EV Connectors Market is segmented into diverse regional landscapes, each with its own unique growth dynamics and market penetration levels. Among these, the Asia Pacific region dominates the market with a substantial 45.1% share, driven by aggressive electric vehicle adoption rates in countries such as China, Japan, and South Korea. These countries are not only leading in terms of EV sales but also the development and deployment of EV charging infrastructure. Government incentives, robust manufacturing capabilities, and the presence of major automotive players contribute significantly to this dominance.
In contrast, Europe follows closely with strong regulatory support promoting eco-friendly vehicles, particularly in nations like Germany, the UK, and the Netherlands. The European market benefits from well-established automotive industries and stringent environmental regulations, which drive the demand for EV connectors as part of the broader push towards green mobility.
North America, particularly the United States, shows significant growth potential due to increasing environmental awareness, state-level incentives for EVs, and initiatives to expand charging infrastructure. This region's market is characterized by a quick adoption of innovative technologies, including high-speed and smart charging solutions.
Meanwhile, the Middle East & Africa and Latin America regions are emerging markets in the EV connectors space. These regions present untapped opportunities due to increasing urbanization and industrialization, paired with a growing governmental focus on reducing reliance on fossil fuels. However, the growth in these regions is gradual, with infrastructural and economic challenges influencing the pace of adoption compared to other regions. Collectively, these regional markets contribute to a dynamic global landscape, with Asia Pacific leading the charge in shaping future trends and technology adoption in the EV connectors sector.
Key Regions and Countries
North America
- The US
- Canada
- Rest of North America
Europe
- Germany
- France
- The UK
- Spain
- Netherlands
- Russia
- Italy
- Rest of Europe
Asia-Pacific
- China
- Japan
- Singapore
- Thailand
- South Korea
- Vietnam
- India
- New Zealand
- Rest of Asia Pacific
Latin America
- Mexico
- Brazil
- Rest of Latin America
Middle East & Africa
- Saudi Arabia
- South Africa
- UAE
- Rest of the Middle East & Africa
Key Players Analysis
In 2023, the global EV Connectors Market will be significantly shaped by the activities and innovations of key players. Each of these companies contributes distinct technological advancements and strategic expansions that bolster the market's overall dynamics.
Yazaki and Fujikura from Japan are notable for their pioneering efforts in high-reliability connectors that suit varying climates and demanding usage conditions, a critical factor for markets with diverse geographical and environmental challenges. Their continued innovation in durability and efficiency plays a crucial role in maintaining Japan's leading position in automotive technologies.
Schneider Electric from France and Siemens AG from Germany emphasize the integration of smart technology into their EV charging solutions. Their focus on IoT-enabled connectors allows for more efficient energy management and aligns with Europe’s stringent energy regulations and digital transformation goals.
Tesla in the U.S., renowned for its disruption in the electric vehicle industry, also innovates in connector technologies that support its rapid charging network and superchargers, enhancing the convenience and practicality of EV ownership.
Bosch and Siemens AG, with their roots in industrial engineering, have been pivotal in driving forward the technology for fast and ultra-fast charging stations, supporting quicker adoption rates in both commercial and residential segments.
ABB in China leverages its global presence and expertise in heavy electrical equipment to lead developments in robust and high-capacity charging systems, especially catering to China’s expansive and rapidly growing EV market.
Amphenol, Huber+Suhner, and Sumitomo provide specialized connector solutions that support the diverse needs of global automotive manufacturers, enhancing the interoperability and efficiency of EV charging across different vehicle types.
Market Key Players
- Yazaki (Japan)
- Schneider Electric (France)
- Tesla (U.S.)
- Bosch (Germany)
- ABB (China)
- Siemens AG (Germany)
- Fujikura (Japan)
- Amphenol (U.S.)
- Huber+Suhner (Switzerland)
- Sumitomo (Japan)
- others
Recent Development
- In June 2024, Yazaki launched a new line of ultra-fast EV connectors designed to reduce charging time by 25%. This innovation aims to cater to the growing demand for faster charging solutions in the electric vehicle market.
- In May 2024, ABB launched a global initiative in May 2024 to install 10,000 new EV charging stations equipped with their latest high-efficiency connectors. This initiative is expected to expand ABB’s global footprint in the EV charging infrastructure market by 25% over the next two years.
- In April 2024, Bosch secured a $40 million investment to develop a new generation of EV connectors that are more durable and weather-resistant. This funding will enable Bosch to potentially reduce manufacturing costs by 15% while maintaining high-quality standards.
Report Scope
Report Features Description Market Value (2023) USD 2.5 Billion Forecast Revenue (2033) USD 26.5 Billion CAGR (2024-2032) 27.4% Base Year for Estimation 2023 Historic Period 2016-2023 Forecast Period 2024-2033 Report Coverage Revenue Forecast, Market Dynamics, COVID-19 Impact, Competitive Landscape, Recent Developments Segments Covered By Type(CCS, Chademo, GB/T, Tesla), By Charging level(Level 1, Level 2, Level 3 , Level 4), By Charging speed(Slow, Fast), By Voltage(AC, DC), By Application(Residential, Commercial) Regional Analysis North America - The US, Canada, Rest of North America, Europe - Germany, France, The UK, Spain, Italy, Russia, Netherlands, Rest of Europe, Asia-Pacific - China, Japan, South Korea, India, New Zealand, Singapore, Thailand, Vietnam, Rest of Asia Pacific, Latin America - Brazil, Mexico, Rest of Latin America, Middle East & Africa - South Africa, Saudi Arabia, UAE, Rest of Middle East & Africa Competitive Landscape Yazaki (Japan), Schneider Electric (France), Tesla (U.S.), Bosch (Germany), ABB (China), Siemens AG (Germany), Fujikura (Japan), Amphenol (U.S.), Huber+Suhner (Switzerland), Sumitomo (Japan), others Customization Scope Customization for segments, region/country-level will be provided. Moreover, additional customization can be done based on the requirements. Purchase Options We have three licenses to opt for Single User License, Multi-User License (Up to 5 Users), Corporate Use License (Unlimited User and Printable PDF) -
- 1. Executive Summary
- 1.1. Definition
- 1.2. Taxonomy
- 1.3. Research Scope
- 1.4. Key Analysis
- 1.5. Key Findings by Major Segments
- 1.6. Top strategies by Major Players
- 2. Global Ev Connectors Market Overview
- 2.1. Ev Connectors Market Dynamics
- 2.1.1. Drivers
- 2.1.2. Opportunities
- 2.1.3. Restraints
- 2.1.4. Challenges
- 2.2. Macro-economic Factors
- 2.3. Regulatory Framework
- 2.4. Market Investment Feasibility Index
- 2.5. PEST Analysis
- 2.6. PORTER’S Five Force Analysis
- 2.7. Drivers & Restraints Impact Analysis
- 2.8. Industry Chain Analysis
- 2.9. Cost Structure Analysis
- 2.10. Marketing Strategy
- 2.11. Russia-Ukraine War Impact Analysis
- 2.12. Opportunity Map Analysis
- 2.13. Market Competition Scenario Analysis
- 2.14. Product Life Cycle Analysis
- 2.15. Opportunity Orbits
- 2.16. Manufacturer Intensity Map
- 2.17. Major Companies sales by Value & Volume
- 2.1. Ev Connectors Market Dynamics
- 3. Global Ev Connectors Market Analysis, Opportunity and Forecast, 2016-2032
- 3.1. Global Ev Connectors Market Analysis, 2016-2021
- 3.2. Global Ev Connectors Market Opportunity and Forecast, 2023-2032
- 3.3. Global Ev Connectors Market Analysis, Opportunity and Forecast, By By Type, 2016-2032
- 3.3.1. Global Ev Connectors Market Analysis by By Type: Introduction
- 3.3.2. Market Size Absolute $ Opportunity Analysis and Forecast, By By Type, 2016-2032
- 3.3.3. CCS
- 3.3.4. Chademo
- 3.3.5. GB/T
- 3.3.6. Tesla
- 3.4. Global Ev Connectors Market Analysis, Opportunity and Forecast, By By Charging level, 2016-2032
- 3.4.1. Global Ev Connectors Market Analysis by By Charging level: Introduction
- 3.4.2. Market Size Absolute $ Opportunity Analysis and Forecast, By By Charging level, 2016-2032
- 3.4.3. Level 1
- 3.4.4. Level 2
- 3.4.5. Level 3
- 3.4.6. Level 4
- 3.5. Global Ev Connectors Market Analysis, Opportunity and Forecast, By By Charging speed, 2016-2032
- 3.5.1. Global Ev Connectors Market Analysis by By Charging speed: Introduction
- 3.5.2. Market Size Absolute $ Opportunity Analysis and Forecast, By By Charging speed, 2016-2032
- 3.5.3. Slow
- 3.5.4. Fast
- 3.6. Global Ev Connectors Market Analysis, Opportunity and Forecast, By By Voltage, 2016-2032
- 3.6.1. Global Ev Connectors Market Analysis by By Voltage: Introduction
- 3.6.2. Market Size Absolute $ Opportunity Analysis and Forecast, By By Voltage, 2016-2032
- 3.6.3. AC
- 3.6.4. DC
- 3.7. Global Ev Connectors Market Analysis, Opportunity and Forecast, By By Application, 2016-2032
- 3.7.1. Global Ev Connectors Market Analysis by By Application: Introduction
- 3.7.2. Market Size Absolute $ Opportunity Analysis and Forecast, By By Application, 2016-2032
- 3.7.3. Residential
- 3.7.4. Commercial
- 4. North America Ev Connectors Market Analysis, Opportunity and Forecast, 2016-2032
- 4.1. North America Ev Connectors Market Analysis, 2016-2021
- 4.2. North America Ev Connectors Market Opportunity and Forecast, 2023-2032
- 4.3. North America Ev Connectors Market Analysis, Opportunity and Forecast, By By Type, 2016-2032
- 4.3.1. North America Ev Connectors Market Analysis by By Type: Introduction
- 4.3.2. Market Size Absolute $ Opportunity Analysis and Forecast, By By Type, 2016-2032
- 4.3.3. CCS
- 4.3.4. Chademo
- 4.3.5. GB/T
- 4.3.6. Tesla
- 4.4. North America Ev Connectors Market Analysis, Opportunity and Forecast, By By Charging level, 2016-2032
- 4.4.1. North America Ev Connectors Market Analysis by By Charging level: Introduction
- 4.4.2. Market Size Absolute $ Opportunity Analysis and Forecast, By By Charging level, 2016-2032
- 4.4.3. Level 1
- 4.4.4. Level 2
- 4.4.5. Level 3
- 4.4.6. Level 4
- 4.5. North America Ev Connectors Market Analysis, Opportunity and Forecast, By By Charging speed, 2016-2032
- 4.5.1. North America Ev Connectors Market Analysis by By Charging speed: Introduction
- 4.5.2. Market Size Absolute $ Opportunity Analysis and Forecast, By By Charging speed, 2016-2032
- 4.5.3. Slow
- 4.5.4. Fast
- 4.6. North America Ev Connectors Market Analysis, Opportunity and Forecast, By By Voltage, 2016-2032
- 4.6.1. North America Ev Connectors Market Analysis by By Voltage: Introduction
- 4.6.2. Market Size Absolute $ Opportunity Analysis and Forecast, By By Voltage, 2016-2032
- 4.6.3. AC
- 4.6.4. DC
- 4.7. North America Ev Connectors Market Analysis, Opportunity and Forecast, By By Application, 2016-2032
- 4.7.1. North America Ev Connectors Market Analysis by By Application: Introduction
- 4.7.2. Market Size Absolute $ Opportunity Analysis and Forecast, By By Application, 2016-2032
- 4.7.3. Residential
- 4.7.4. Commercial
- 4.8. North America Ev Connectors Market Analysis, Opportunity and Forecast, By Country , 2016-2032
- 4.8.1. North America Ev Connectors Market Analysis by Country : Introduction
- 4.8.2. Market Size Absolute $ Opportunity Analysis and Forecast, Country , 2016-2032
- 4.8.2.1. The US
- 4.8.2.2. Canada
- 4.8.2.3. Mexico
- 5. Western Europe Ev Connectors Market Analysis, Opportunity and Forecast, 2016-2032
- 5.1. Western Europe Ev Connectors Market Analysis, 2016-2021
- 5.2. Western Europe Ev Connectors Market Opportunity and Forecast, 2023-2032
- 5.3. Western Europe Ev Connectors Market Analysis, Opportunity and Forecast, By By Type, 2016-2032
- 5.3.1. Western Europe Ev Connectors Market Analysis by By Type: Introduction
- 5.3.2. Market Size Absolute $ Opportunity Analysis and Forecast, By By Type, 2016-2032
- 5.3.3. CCS
- 5.3.4. Chademo
- 5.3.5. GB/T
- 5.3.6. Tesla
- 5.4. Western Europe Ev Connectors Market Analysis, Opportunity and Forecast, By By Charging level, 2016-2032
- 5.4.1. Western Europe Ev Connectors Market Analysis by By Charging level: Introduction
- 5.4.2. Market Size Absolute $ Opportunity Analysis and Forecast, By By Charging level, 2016-2032
- 5.4.3. Level 1
- 5.4.4. Level 2
- 5.4.5. Level 3
- 5.4.6. Level 4
- 5.5. Western Europe Ev Connectors Market Analysis, Opportunity and Forecast, By By Charging speed, 2016-2032
- 5.5.1. Western Europe Ev Connectors Market Analysis by By Charging speed: Introduction
- 5.5.2. Market Size Absolute $ Opportunity Analysis and Forecast, By By Charging speed, 2016-2032
- 5.5.3. Slow
- 5.5.4. Fast
- 5.6. Western Europe Ev Connectors Market Analysis, Opportunity and Forecast, By By Voltage, 2016-2032
- 5.6.1. Western Europe Ev Connectors Market Analysis by By Voltage: Introduction
- 5.6.2. Market Size Absolute $ Opportunity Analysis and Forecast, By By Voltage, 2016-2032
- 5.6.3. AC
- 5.6.4. DC
- 5.7. Western Europe Ev Connectors Market Analysis, Opportunity and Forecast, By By Application, 2016-2032
- 5.7.1. Western Europe Ev Connectors Market Analysis by By Application: Introduction
- 5.7.2. Market Size Absolute $ Opportunity Analysis and Forecast, By By Application, 2016-2032
- 5.7.3. Residential
- 5.7.4. Commercial
- 5.8. Western Europe Ev Connectors Market Analysis, Opportunity and Forecast, By Country , 2016-2032
- 5.8.1. Western Europe Ev Connectors Market Analysis by Country : Introduction
- 5.8.2. Market Size Absolute $ Opportunity Analysis and Forecast, Country , 2016-2032
- 5.8.2.1. Germany
- 5.8.2.2. France
- 5.8.2.3. The UK
- 5.8.2.4. Spain
- 5.8.2.5. Italy
- 5.8.2.6. Portugal
- 5.8.2.7. Ireland
- 5.8.2.8. Austria
- 5.8.2.9. Switzerland
- 5.8.2.10. Benelux
- 5.8.2.11. Nordic
- 5.8.2.12. Rest of Western Europe
- 6. Eastern Europe Ev Connectors Market Analysis, Opportunity and Forecast, 2016-2032
- 6.1. Eastern Europe Ev Connectors Market Analysis, 2016-2021
- 6.2. Eastern Europe Ev Connectors Market Opportunity and Forecast, 2023-2032
- 6.3. Eastern Europe Ev Connectors Market Analysis, Opportunity and Forecast, By By Type, 2016-2032
- 6.3.1. Eastern Europe Ev Connectors Market Analysis by By Type: Introduction
- 6.3.2. Market Size Absolute $ Opportunity Analysis and Forecast, By By Type, 2016-2032
- 6.3.3. CCS
- 6.3.4. Chademo
- 6.3.5. GB/T
- 6.3.6. Tesla
- 6.4. Eastern Europe Ev Connectors Market Analysis, Opportunity and Forecast, By By Charging level, 2016-2032
- 6.4.1. Eastern Europe Ev Connectors Market Analysis by By Charging level: Introduction
- 6.4.2. Market Size Absolute $ Opportunity Analysis and Forecast, By By Charging level, 2016-2032
- 6.4.3. Level 1
- 6.4.4. Level 2
- 6.4.5. Level 3
- 6.4.6. Level 4
- 6.5. Eastern Europe Ev Connectors Market Analysis, Opportunity and Forecast, By By Charging speed, 2016-2032
- 6.5.1. Eastern Europe Ev Connectors Market Analysis by By Charging speed: Introduction
- 6.5.2. Market Size Absolute $ Opportunity Analysis and Forecast, By By Charging speed, 2016-2032
- 6.5.3. Slow
- 6.5.4. Fast
- 6.6. Eastern Europe Ev Connectors Market Analysis, Opportunity and Forecast, By By Voltage, 2016-2032
- 6.6.1. Eastern Europe Ev Connectors Market Analysis by By Voltage: Introduction
- 6.6.2. Market Size Absolute $ Opportunity Analysis and Forecast, By By Voltage, 2016-2032
- 6.6.3. AC
- 6.6.4. DC
- 6.7. Eastern Europe Ev Connectors Market Analysis, Opportunity and Forecast, By By Application, 2016-2032
- 6.7.1. Eastern Europe Ev Connectors Market Analysis by By Application: Introduction
- 6.7.2. Market Size Absolute $ Opportunity Analysis and Forecast, By By Application, 2016-2032
- 6.7.3. Residential
- 6.7.4. Commercial
- 6.8. Eastern Europe Ev Connectors Market Analysis, Opportunity and Forecast, By Country , 2016-2032
- 6.8.1. Eastern Europe Ev Connectors Market Analysis by Country : Introduction
- 6.8.2. Market Size Absolute $ Opportunity Analysis and Forecast, Country , 2016-2032
- 6.8.2.1. Russia
- 6.8.2.2. Poland
- 6.8.2.3. The Czech Republic
- 6.8.2.4. Greece
- 6.8.2.5. Rest of Eastern Europe
- 7. APAC Ev Connectors Market Analysis, Opportunity and Forecast, 2016-2032
- 7.1. APAC Ev Connectors Market Analysis, 2016-2021
- 7.2. APAC Ev Connectors Market Opportunity and Forecast, 2023-2032
- 7.3. APAC Ev Connectors Market Analysis, Opportunity and Forecast, By By Type, 2016-2032
- 7.3.1. APAC Ev Connectors Market Analysis by By Type: Introduction
- 7.3.2. Market Size Absolute $ Opportunity Analysis and Forecast, By By Type, 2016-2032
- 7.3.3. CCS
- 7.3.4. Chademo
- 7.3.5. GB/T
- 7.3.6. Tesla
- 7.4. APAC Ev Connectors Market Analysis, Opportunity and Forecast, By By Charging level, 2016-2032
- 7.4.1. APAC Ev Connectors Market Analysis by By Charging level: Introduction
- 7.4.2. Market Size Absolute $ Opportunity Analysis and Forecast, By By Charging level, 2016-2032
- 7.4.3. Level 1
- 7.4.4. Level 2
- 7.4.5. Level 3
- 7.4.6. Level 4
- 7.5. APAC Ev Connectors Market Analysis, Opportunity and Forecast, By By Charging speed, 2016-2032
- 7.5.1. APAC Ev Connectors Market Analysis by By Charging speed: Introduction
- 7.5.2. Market Size Absolute $ Opportunity Analysis and Forecast, By By Charging speed, 2016-2032
- 7.5.3. Slow
- 7.5.4. Fast
- 7.6. APAC Ev Connectors Market Analysis, Opportunity and Forecast, By By Voltage, 2016-2032
- 7.6.1. APAC Ev Connectors Market Analysis by By Voltage: Introduction
- 7.6.2. Market Size Absolute $ Opportunity Analysis and Forecast, By By Voltage, 2016-2032
- 7.6.3. AC
- 7.6.4. DC
- 7.7. APAC Ev Connectors Market Analysis, Opportunity and Forecast, By By Application, 2016-2032
- 7.7.1. APAC Ev Connectors Market Analysis by By Application: Introduction
- 7.7.2. Market Size Absolute $ Opportunity Analysis and Forecast, By By Application, 2016-2032
- 7.7.3. Residential
- 7.7.4. Commercial
- 7.8. APAC Ev Connectors Market Analysis, Opportunity and Forecast, By Country , 2016-2032
- 7.8.1. APAC Ev Connectors Market Analysis by Country : Introduction
- 7.8.2. Market Size Absolute $ Opportunity Analysis and Forecast, Country , 2016-2032
- 7.8.2.1. China
- 7.8.2.2. Japan
- 7.8.2.3. South Korea
- 7.8.2.4. India
- 7.8.2.5. Australia & New Zeland
- 7.8.2.6. Indonesia
- 7.8.2.7. Malaysia
- 7.8.2.8. Philippines
- 7.8.2.9. Singapore
- 7.8.2.10. Thailand
- 7.8.2.11. Vietnam
- 7.8.2.12. Rest of APAC
- 8. Latin America Ev Connectors Market Analysis, Opportunity and Forecast, 2016-2032
- 8.1. Latin America Ev Connectors Market Analysis, 2016-2021
- 8.2. Latin America Ev Connectors Market Opportunity and Forecast, 2023-2032
- 8.3. Latin America Ev Connectors Market Analysis, Opportunity and Forecast, By By Type, 2016-2032
- 8.3.1. Latin America Ev Connectors Market Analysis by By Type: Introduction
- 8.3.2. Market Size Absolute $ Opportunity Analysis and Forecast, By By Type, 2016-2032
- 8.3.3. CCS
- 8.3.4. Chademo
- 8.3.5. GB/T
- 8.3.6. Tesla
- 8.4. Latin America Ev Connectors Market Analysis, Opportunity and Forecast, By By Charging level, 2016-2032
- 8.4.1. Latin America Ev Connectors Market Analysis by By Charging level: Introduction
- 8.4.2. Market Size Absolute $ Opportunity Analysis and Forecast, By By Charging level, 2016-2032
- 8.4.3. Level 1
- 8.4.4. Level 2
- 8.4.5. Level 3
- 8.4.6. Level 4
- 8.5. Latin America Ev Connectors Market Analysis, Opportunity and Forecast, By By Charging speed, 2016-2032
- 8.5.1. Latin America Ev Connectors Market Analysis by By Charging speed: Introduction
- 8.5.2. Market Size Absolute $ Opportunity Analysis and Forecast, By By Charging speed, 2016-2032
- 8.5.3. Slow
- 8.5.4. Fast
- 8.6. Latin America Ev Connectors Market Analysis, Opportunity and Forecast, By By Voltage, 2016-2032
- 8.6.1. Latin America Ev Connectors Market Analysis by By Voltage: Introduction
- 8.6.2. Market Size Absolute $ Opportunity Analysis and Forecast, By By Voltage, 2016-2032
- 8.6.3. AC
- 8.6.4. DC
- 8.7. Latin America Ev Connectors Market Analysis, Opportunity and Forecast, By By Application, 2016-2032
- 8.7.1. Latin America Ev Connectors Market Analysis by By Application: Introduction
- 8.7.2. Market Size Absolute $ Opportunity Analysis and Forecast, By By Application, 2016-2032
- 8.7.3. Residential
- 8.7.4. Commercial
- 8.8. Latin America Ev Connectors Market Analysis, Opportunity and Forecast, By Country , 2016-2032
- 8.8.1. Latin America Ev Connectors Market Analysis by Country : Introduction
- 8.8.2. Market Size Absolute $ Opportunity Analysis and Forecast, Country , 2016-2032
- 8.8.2.1. Brazil
- 8.8.2.2. Colombia
- 8.8.2.3. Chile
- 8.8.2.4. Argentina
- 8.8.2.5. Costa Rica
- 8.8.2.6. Rest of Latin America
- 9. Middle East & Africa Ev Connectors Market Analysis, Opportunity and Forecast, 2016-2032
- 9.1. Middle East & Africa Ev Connectors Market Analysis, 2016-2021
- 9.2. Middle East & Africa Ev Connectors Market Opportunity and Forecast, 2023-2032
- 9.3. Middle East & Africa Ev Connectors Market Analysis, Opportunity and Forecast, By By Type, 2016-2032
- 9.3.1. Middle East & Africa Ev Connectors Market Analysis by By Type: Introduction
- 9.3.2. Market Size Absolute $ Opportunity Analysis and Forecast, By By Type, 2016-2032
- 9.3.3. CCS
- 9.3.4. Chademo
- 9.3.5. GB/T
- 9.3.6. Tesla
- 9.4. Middle East & Africa Ev Connectors Market Analysis, Opportunity and Forecast, By By Charging level, 2016-2032
- 9.4.1. Middle East & Africa Ev Connectors Market Analysis by By Charging level: Introduction
- 9.4.2. Market Size Absolute $ Opportunity Analysis and Forecast, By By Charging level, 2016-2032
- 9.4.3. Level 1
- 9.4.4. Level 2
- 9.4.5. Level 3
- 9.4.6. Level 4
- 9.5. Middle East & Africa Ev Connectors Market Analysis, Opportunity and Forecast, By By Charging speed, 2016-2032
- 9.5.1. Middle East & Africa Ev Connectors Market Analysis by By Charging speed: Introduction
- 9.5.2. Market Size Absolute $ Opportunity Analysis and Forecast, By By Charging speed, 2016-2032
- 9.5.3. Slow
- 9.5.4. Fast
- 9.6. Middle East & Africa Ev Connectors Market Analysis, Opportunity and Forecast, By By Voltage, 2016-2032
- 9.6.1. Middle East & Africa Ev Connectors Market Analysis by By Voltage: Introduction
- 9.6.2. Market Size Absolute $ Opportunity Analysis and Forecast, By By Voltage, 2016-2032
- 9.6.3. AC
- 9.6.4. DC
- 9.7. Middle East & Africa Ev Connectors Market Analysis, Opportunity and Forecast, By By Application, 2016-2032
- 9.7.1. Middle East & Africa Ev Connectors Market Analysis by By Application: Introduction
- 9.7.2. Market Size Absolute $ Opportunity Analysis and Forecast, By By Application, 2016-2032
- 9.7.3. Residential
- 9.7.4. Commercial
- 9.8. Middle East & Africa Ev Connectors Market Analysis, Opportunity and Forecast, By Country , 2016-2032
- 9.8.1. Middle East & Africa Ev Connectors Market Analysis by Country : Introduction
- 9.8.2. Market Size Absolute $ Opportunity Analysis and Forecast, Country , 2016-2032
- 9.8.2.1. Algeria
- 9.8.2.2. Egypt
- 9.8.2.3. Israel
- 9.8.2.4. Kuwait
- 9.8.2.5. Nigeria
- 9.8.2.6. Saudi Arabia
- 9.8.2.7. South Africa
- 9.8.2.8. Turkey
- 9.8.2.9. The UAE
- 9.8.2.10. Rest of MEA
- 10. Global Ev Connectors Market Analysis, Opportunity and Forecast, By Region , 2016-2032
- 10.1. Global Ev Connectors Market Analysis by Region : Introduction
- 10.2. Market Size Absolute $ Opportunity Analysis and Forecast, By Region , 2016-2032
- 10.2.1. North America
- 10.2.2. Western Europe
- 10.2.3. Eastern Europe
- 10.2.4. APAC
- 10.2.5. Latin America
- 10.2.6. Middle East & Africa
- 11. Global Ev Connectors Market Competitive Landscape, Market Share Analysis, and Company Profiles
- 11.1. Market Share Analysis
- 11.2. Company Profiles
- 11.3. Yazaki (Japan)
- 11.3.1. Company Overview
- 11.3.2. Financial Highlights
- 11.3.3. Product Portfolio
- 11.3.4. SWOT Analysis
- 11.3.5. Key Strategies and Developments
- 11.4. Schneider Electric (France)
- 11.4.1. Company Overview
- 11.4.2. Financial Highlights
- 11.4.3. Product Portfolio
- 11.4.4. SWOT Analysis
- 11.4.5. Key Strategies and Developments
- 11.5. Tesla (U.S.)
- 11.5.1. Company Overview
- 11.5.2. Financial Highlights
- 11.5.3. Product Portfolio
- 11.5.4. SWOT Analysis
- 11.5.5. Key Strategies and Developments
- 11.6. Bosch (Germany)
- 11.6.1. Company Overview
- 11.6.2. Financial Highlights
- 11.6.3. Product Portfolio
- 11.6.4. SWOT Analysis
- 11.6.5. Key Strategies and Developments
- 11.7. ABB (China)
- 11.7.1. Company Overview
- 11.7.2. Financial Highlights
- 11.7.3. Product Portfolio
- 11.7.4. SWOT Analysis
- 11.7.5. Key Strategies and Developments
- 11.8. Siemens AG (Germany)
- 11.8.1. Company Overview
- 11.8.2. Financial Highlights
- 11.8.3. Product Portfolio
- 11.8.4. SWOT Analysis
- 11.8.5. Key Strategies and Developments
- 11.9. Fujikura (Japan)
- 11.9.1. Company Overview
- 11.9.2. Financial Highlights
- 11.9.3. Product Portfolio
- 11.9.4. SWOT Analysis
- 11.9.5. Key Strategies and Developments
- 11.10. Amphenol (U.S.)
- 11.10.1. Company Overview
- 11.10.2. Financial Highlights
- 11.10.3. Product Portfolio
- 11.10.4. SWOT Analysis
- 11.10.5. Key Strategies and Developments
- 11.11. Huber+Suhner (Switzerland)
- 11.11.1. Company Overview
- 11.11.2. Financial Highlights
- 11.11.3. Product Portfolio
- 11.11.4. SWOT Analysis
- 11.11.5. Key Strategies and Developments
- 11.12. Sumitomo (Japan)
- 11.12.1. Company Overview
- 11.12.2. Financial Highlights
- 11.12.3. Product Portfolio
- 11.12.4. SWOT Analysis
- 11.12.5. Key Strategies and Developments
- 11.13.1. Company Overview
- 11.13.2. Financial Highlights
- 11.13.3. Product Portfolio
- 11.13.4. SWOT Analysis
- 11.13.5. Key Strategies and Developments
- 11.14. others
- 11.14.1. Company Overview
- 11.14.2. Financial Highlights
- 11.14.3. Product Portfolio
- 11.14.4. SWOT Analysis
- 11.14.5. Key Strategies and Developments
- 12. Assumptions and Acronyms
- 13. Research Methodology
- 14. Contact
"
- List of Figures
- "
- Figure 1: Global Ev Connectors Market Revenue (US$ Mn) Market Share by By Type in 2022
- Figure 2: Global Ev Connectors Market Market Attractiveness Analysis by By Type, 2016-2032
- Figure 3: Global Ev Connectors Market Revenue (US$ Mn) Market Share by By Charging levelin 2022
- Figure 4: Global Ev Connectors Market Market Attractiveness Analysis by By Charging level, 2016-2032
- Figure 5: Global Ev Connectors Market Revenue (US$ Mn) Market Share by By Charging speedin 2022
- Figure 6: Global Ev Connectors Market Market Attractiveness Analysis by By Charging speed, 2016-2032
- Figure 7: Global Ev Connectors Market Revenue (US$ Mn) Market Share by By Voltagein 2022
- Figure 8: Global Ev Connectors Market Market Attractiveness Analysis by By Voltage, 2016-2032
- Figure 9: Global Ev Connectors Market Revenue (US$ Mn) Market Share by By Applicationin 2022
- Figure 10: Global Ev Connectors Market Market Attractiveness Analysis by By Application, 2016-2032
- Figure 11: Global Ev Connectors Market Revenue (US$ Mn) Market Share by Region in 2022
- Figure 12: Global Ev Connectors Market Market Attractiveness Analysis by Region, 2016-2032
- Figure 13: Global Ev Connectors Market Market Revenue (US$ Mn) (2016-2032)
- Figure 14: Global Ev Connectors Market Market Revenue (US$ Mn) Comparison by Region (2016-2032)
- Figure 15: Global Ev Connectors Market Market Revenue (US$ Mn) Comparison by By Type (2016-2032)
- Figure 16: Global Ev Connectors Market Market Revenue (US$ Mn) Comparison by By Charging level (2016-2032)
- Figure 17: Global Ev Connectors Market Market Revenue (US$ Mn) Comparison by By Charging speed (2016-2032)
- Figure 18: Global Ev Connectors Market Market Revenue (US$ Mn) Comparison by By Voltage (2016-2032)
- Figure 19: Global Ev Connectors Market Market Revenue (US$ Mn) Comparison by By Application (2016-2032)
- Figure 20: Global Ev Connectors Market Market Y-o-Y Growth Rate Comparison by Region (2016-2032)
- Figure 21: Global Ev Connectors Market Market Y-o-Y Growth Rate Comparison by By Type (2016-2032)
- Figure 22: Global Ev Connectors Market Market Y-o-Y Growth Rate Comparison by By Charging level (2016-2032)
- Figure 23: Global Ev Connectors Market Market Y-o-Y Growth Rate Comparison by By Charging speed (2016-2032)
- Figure 24: Global Ev Connectors Market Market Y-o-Y Growth Rate Comparison by By Voltage (2016-2032)
- Figure 25: Global Ev Connectors Market Market Y-o-Y Growth Rate Comparison by By Application (2016-2032)
- Figure 26: Global Ev Connectors Market Market Share Comparison by Region (2016-2032)
- Figure 27: Global Ev Connectors Market Market Share Comparison by By Type (2016-2032)
- Figure 28: Global Ev Connectors Market Market Share Comparison by By Charging level (2016-2032)
- Figure 29: Global Ev Connectors Market Market Share Comparison by By Charging speed (2016-2032)
- Figure 30: Global Ev Connectors Market Market Share Comparison by By Voltage (2016-2032)
- Figure 31: Global Ev Connectors Market Market Share Comparison by By Application (2016-2032)
- Figure 32: North America Ev Connectors Market Revenue (US$ Mn) Market Share by By Typein 2022
- Figure 33: North America Ev Connectors Market Market Attractiveness Analysis by By Type, 2016-2032
- Figure 34: North America Ev Connectors Market Revenue (US$ Mn) Market Share by By Charging levelin 2022
- Figure 35: North America Ev Connectors Market Market Attractiveness Analysis by By Charging level, 2016-2032
- Figure 36: North America Ev Connectors Market Revenue (US$ Mn) Market Share by By Charging speedin 2022
- Figure 37: North America Ev Connectors Market Market Attractiveness Analysis by By Charging speed, 2016-2032
- Figure 38: North America Ev Connectors Market Revenue (US$ Mn) Market Share by By Voltagein 2022
- Figure 39: North America Ev Connectors Market Market Attractiveness Analysis by By Voltage, 2016-2032
- Figure 40: North America Ev Connectors Market Revenue (US$ Mn) Market Share by By Applicationin 2022
- Figure 41: North America Ev Connectors Market Market Attractiveness Analysis by By Application, 2016-2032
- Figure 42: North America Ev Connectors Market Revenue (US$ Mn) Market Share by Country in 2022
- Figure 43: North America Ev Connectors Market Market Attractiveness Analysis by Country, 2016-2032
- Figure 44: North America Ev Connectors Market Market Revenue (US$ Mn) (2016-2032)
- Figure 45: North America Ev Connectors Market Market Revenue (US$ Mn) Comparison by Country (2016-2032)
- Figure 46: North America Ev Connectors Market Market Revenue (US$ Mn) Comparison by By Type (2016-2032)
- Figure 47: North America Ev Connectors Market Market Revenue (US$ Mn) Comparison by By Charging level (2016-2032)
- Figure 48: North America Ev Connectors Market Market Revenue (US$ Mn) Comparison by By Charging speed (2016-2032)
- Figure 49: North America Ev Connectors Market Market Revenue (US$ Mn) Comparison by By Voltage (2016-2032)
- Figure 50: North America Ev Connectors Market Market Revenue (US$ Mn) Comparison by By Application (2016-2032)
- Figure 51: North America Ev Connectors Market Market Y-o-Y Growth Rate Comparison by Country (2016-2032)
- Figure 52: North America Ev Connectors Market Market Y-o-Y Growth Rate Comparison by By Type (2016-2032)
- Figure 53: North America Ev Connectors Market Market Y-o-Y Growth Rate Comparison by By Charging level (2016-2032)
- Figure 54: North America Ev Connectors Market Market Y-o-Y Growth Rate Comparison by By Charging speed (2016-2032)
- Figure 55: North America Ev Connectors Market Market Y-o-Y Growth Rate Comparison by By Voltage (2016-2032)
- Figure 56: North America Ev Connectors Market Market Y-o-Y Growth Rate Comparison by By Application (2016-2032)
- Figure 57: North America Ev Connectors Market Market Share Comparison by Country (2016-2032)
- Figure 58: North America Ev Connectors Market Market Share Comparison by By Type (2016-2032)
- Figure 59: North America Ev Connectors Market Market Share Comparison by By Charging level (2016-2032)
- Figure 60: North America Ev Connectors Market Market Share Comparison by By Charging speed (2016-2032)
- Figure 61: North America Ev Connectors Market Market Share Comparison by By Voltage (2016-2032)
- Figure 62: North America Ev Connectors Market Market Share Comparison by By Application (2016-2032)
- Figure 63: Western Europe Ev Connectors Market Revenue (US$ Mn) Market Share by By Typein 2022
- Figure 64: Western Europe Ev Connectors Market Market Attractiveness Analysis by By Type, 2016-2032
- Figure 65: Western Europe Ev Connectors Market Revenue (US$ Mn) Market Share by By Charging levelin 2022
- Figure 66: Western Europe Ev Connectors Market Market Attractiveness Analysis by By Charging level, 2016-2032
- Figure 67: Western Europe Ev Connectors Market Revenue (US$ Mn) Market Share by By Charging speedin 2022
- Figure 68: Western Europe Ev Connectors Market Market Attractiveness Analysis by By Charging speed, 2016-2032
- Figure 69: Western Europe Ev Connectors Market Revenue (US$ Mn) Market Share by By Voltagein 2022
- Figure 70: Western Europe Ev Connectors Market Market Attractiveness Analysis by By Voltage, 2016-2032
- Figure 71: Western Europe Ev Connectors Market Revenue (US$ Mn) Market Share by By Applicationin 2022
- Figure 72: Western Europe Ev Connectors Market Market Attractiveness Analysis by By Application, 2016-2032
- Figure 73: Western Europe Ev Connectors Market Revenue (US$ Mn) Market Share by Country in 2022
- Figure 74: Western Europe Ev Connectors Market Market Attractiveness Analysis by Country, 2016-2032
- Figure 75: Western Europe Ev Connectors Market Market Revenue (US$ Mn) (2016-2032)
- Figure 76: Western Europe Ev Connectors Market Market Revenue (US$ Mn) Comparison by Country (2016-2032)
- Figure 77: Western Europe Ev Connectors Market Market Revenue (US$ Mn) Comparison by By Type (2016-2032)
- Figure 78: Western Europe Ev Connectors Market Market Revenue (US$ Mn) Comparison by By Charging level (2016-2032)
- Figure 79: Western Europe Ev Connectors Market Market Revenue (US$ Mn) Comparison by By Charging speed (2016-2032)
- Figure 80: Western Europe Ev Connectors Market Market Revenue (US$ Mn) Comparison by By Voltage (2016-2032)
- Figure 81: Western Europe Ev Connectors Market Market Revenue (US$ Mn) Comparison by By Application (2016-2032)
- Figure 82: Western Europe Ev Connectors Market Market Y-o-Y Growth Rate Comparison by Country (2016-2032)
- Figure 83: Western Europe Ev Connectors Market Market Y-o-Y Growth Rate Comparison by By Type (2016-2032)
- Figure 84: Western Europe Ev Connectors Market Market Y-o-Y Growth Rate Comparison by By Charging level (2016-2032)
- Figure 85: Western Europe Ev Connectors Market Market Y-o-Y Growth Rate Comparison by By Charging speed (2016-2032)
- Figure 86: Western Europe Ev Connectors Market Market Y-o-Y Growth Rate Comparison by By Voltage (2016-2032)
- Figure 87: Western Europe Ev Connectors Market Market Y-o-Y Growth Rate Comparison by By Application (2016-2032)
- Figure 88: Western Europe Ev Connectors Market Market Share Comparison by Country (2016-2032)
- Figure 89: Western Europe Ev Connectors Market Market Share Comparison by By Type (2016-2032)
- Figure 90: Western Europe Ev Connectors Market Market Share Comparison by By Charging level (2016-2032)
- Figure 91: Western Europe Ev Connectors Market Market Share Comparison by By Charging speed (2016-2032)
- Figure 92: Western Europe Ev Connectors Market Market Share Comparison by By Voltage (2016-2032)
- Figure 93: Western Europe Ev Connectors Market Market Share Comparison by By Application (2016-2032)
- Figure 94: Eastern Europe Ev Connectors Market Revenue (US$ Mn) Market Share by By Typein 2022
- Figure 95: Eastern Europe Ev Connectors Market Market Attractiveness Analysis by By Type, 2016-2032
- Figure 96: Eastern Europe Ev Connectors Market Revenue (US$ Mn) Market Share by By Charging levelin 2022
- Figure 97: Eastern Europe Ev Connectors Market Market Attractiveness Analysis by By Charging level, 2016-2032
- Figure 98: Eastern Europe Ev Connectors Market Revenue (US$ Mn) Market Share by By Charging speedin 2022
- Figure 99: Eastern Europe Ev Connectors Market Market Attractiveness Analysis by By Charging speed, 2016-2032
- Figure 100: Eastern Europe Ev Connectors Market Revenue (US$ Mn) Market Share by By Voltagein 2022
- Figure 101: Eastern Europe Ev Connectors Market Market Attractiveness Analysis by By Voltage, 2016-2032
- Figure 102: Eastern Europe Ev Connectors Market Revenue (US$ Mn) Market Share by By Applicationin 2022
- Figure 103: Eastern Europe Ev Connectors Market Market Attractiveness Analysis by By Application, 2016-2032
- Figure 104: Eastern Europe Ev Connectors Market Revenue (US$ Mn) Market Share by Country in 2022
- Figure 105: Eastern Europe Ev Connectors Market Market Attractiveness Analysis by Country, 2016-2032
- Figure 106: Eastern Europe Ev Connectors Market Market Revenue (US$ Mn) (2016-2032)
- Figure 107: Eastern Europe Ev Connectors Market Market Revenue (US$ Mn) Comparison by Country (2016-2032)
- Figure 108: Eastern Europe Ev Connectors Market Market Revenue (US$ Mn) Comparison by By Type (2016-2032)
- Figure 109: Eastern Europe Ev Connectors Market Market Revenue (US$ Mn) Comparison by By Charging level (2016-2032)
- Figure 110: Eastern Europe Ev Connectors Market Market Revenue (US$ Mn) Comparison by By Charging speed (2016-2032)
- Figure 111: Eastern Europe Ev Connectors Market Market Revenue (US$ Mn) Comparison by By Voltage (2016-2032)
- Figure 112: Eastern Europe Ev Connectors Market Market Revenue (US$ Mn) Comparison by By Application (2016-2032)
- Figure 113: Eastern Europe Ev Connectors Market Market Y-o-Y Growth Rate Comparison by Country (2016-2032)
- Figure 114: Eastern Europe Ev Connectors Market Market Y-o-Y Growth Rate Comparison by By Type (2016-2032)
- Figure 115: Eastern Europe Ev Connectors Market Market Y-o-Y Growth Rate Comparison by By Charging level (2016-2032)
- Figure 116: Eastern Europe Ev Connectors Market Market Y-o-Y Growth Rate Comparison by By Charging speed (2016-2032)
- Figure 117: Eastern Europe Ev Connectors Market Market Y-o-Y Growth Rate Comparison by By Voltage (2016-2032)
- Figure 118: Eastern Europe Ev Connectors Market Market Y-o-Y Growth Rate Comparison by By Application (2016-2032)
- Figure 119: Eastern Europe Ev Connectors Market Market Share Comparison by Country (2016-2032)
- Figure 120: Eastern Europe Ev Connectors Market Market Share Comparison by By Type (2016-2032)
- Figure 121: Eastern Europe Ev Connectors Market Market Share Comparison by By Charging level (2016-2032)
- Figure 122: Eastern Europe Ev Connectors Market Market Share Comparison by By Charging speed (2016-2032)
- Figure 123: Eastern Europe Ev Connectors Market Market Share Comparison by By Voltage (2016-2032)
- Figure 124: Eastern Europe Ev Connectors Market Market Share Comparison by By Application (2016-2032)
- Figure 125: APAC Ev Connectors Market Revenue (US$ Mn) Market Share by By Typein 2022
- Figure 126: APAC Ev Connectors Market Market Attractiveness Analysis by By Type, 2016-2032
- Figure 127: APAC Ev Connectors Market Revenue (US$ Mn) Market Share by By Charging levelin 2022
- Figure 128: APAC Ev Connectors Market Market Attractiveness Analysis by By Charging level, 2016-2032
- Figure 129: APAC Ev Connectors Market Revenue (US$ Mn) Market Share by By Charging speedin 2022
- Figure 130: APAC Ev Connectors Market Market Attractiveness Analysis by By Charging speed, 2016-2032
- Figure 131: APAC Ev Connectors Market Revenue (US$ Mn) Market Share by By Voltagein 2022
- Figure 132: APAC Ev Connectors Market Market Attractiveness Analysis by By Voltage, 2016-2032
- Figure 133: APAC Ev Connectors Market Revenue (US$ Mn) Market Share by By Applicationin 2022
- Figure 134: APAC Ev Connectors Market Market Attractiveness Analysis by By Application, 2016-2032
- Figure 135: APAC Ev Connectors Market Revenue (US$ Mn) Market Share by Country in 2022
- Figure 136: APAC Ev Connectors Market Market Attractiveness Analysis by Country, 2016-2032
- Figure 137: APAC Ev Connectors Market Market Revenue (US$ Mn) (2016-2032)
- Figure 138: APAC Ev Connectors Market Market Revenue (US$ Mn) Comparison by Country (2016-2032)
- Figure 139: APAC Ev Connectors Market Market Revenue (US$ Mn) Comparison by By Type (2016-2032)
- Figure 140: APAC Ev Connectors Market Market Revenue (US$ Mn) Comparison by By Charging level (2016-2032)
- Figure 141: APAC Ev Connectors Market Market Revenue (US$ Mn) Comparison by By Charging speed (2016-2032)
- Figure 142: APAC Ev Connectors Market Market Revenue (US$ Mn) Comparison by By Voltage (2016-2032)
- Figure 143: APAC Ev Connectors Market Market Revenue (US$ Mn) Comparison by By Application (2016-2032)
- Figure 144: APAC Ev Connectors Market Market Y-o-Y Growth Rate Comparison by Country (2016-2032)
- Figure 145: APAC Ev Connectors Market Market Y-o-Y Growth Rate Comparison by By Type (2016-2032)
- Figure 146: APAC Ev Connectors Market Market Y-o-Y Growth Rate Comparison by By Charging level (2016-2032)
- Figure 147: APAC Ev Connectors Market Market Y-o-Y Growth Rate Comparison by By Charging speed (2016-2032)
- Figure 148: APAC Ev Connectors Market Market Y-o-Y Growth Rate Comparison by By Voltage (2016-2032)
- Figure 149: APAC Ev Connectors Market Market Y-o-Y Growth Rate Comparison by By Application (2016-2032)
- Figure 150: APAC Ev Connectors Market Market Share Comparison by Country (2016-2032)
- Figure 151: APAC Ev Connectors Market Market Share Comparison by By Type (2016-2032)
- Figure 152: APAC Ev Connectors Market Market Share Comparison by By Charging level (2016-2032)
- Figure 153: APAC Ev Connectors Market Market Share Comparison by By Charging speed (2016-2032)
- Figure 154: APAC Ev Connectors Market Market Share Comparison by By Voltage (2016-2032)
- Figure 155: APAC Ev Connectors Market Market Share Comparison by By Application (2016-2032)
- Figure 156: Latin America Ev Connectors Market Revenue (US$ Mn) Market Share by By Typein 2022
- Figure 157: Latin America Ev Connectors Market Market Attractiveness Analysis by By Type, 2016-2032
- Figure 158: Latin America Ev Connectors Market Revenue (US$ Mn) Market Share by By Charging levelin 2022
- Figure 159: Latin America Ev Connectors Market Market Attractiveness Analysis by By Charging level, 2016-2032
- Figure 160: Latin America Ev Connectors Market Revenue (US$ Mn) Market Share by By Charging speedin 2022
- Figure 161: Latin America Ev Connectors Market Market Attractiveness Analysis by By Charging speed, 2016-2032
- Figure 162: Latin America Ev Connectors Market Revenue (US$ Mn) Market Share by By Voltagein 2022
- Figure 163: Latin America Ev Connectors Market Market Attractiveness Analysis by By Voltage, 2016-2032
- Figure 164: Latin America Ev Connectors Market Revenue (US$ Mn) Market Share by By Applicationin 2022
- Figure 165: Latin America Ev Connectors Market Market Attractiveness Analysis by By Application, 2016-2032
- Figure 166: Latin America Ev Connectors Market Revenue (US$ Mn) Market Share by Country in 2022
- Figure 167: Latin America Ev Connectors Market Market Attractiveness Analysis by Country, 2016-2032
- Figure 168: Latin America Ev Connectors Market Market Revenue (US$ Mn) (2016-2032)
- Figure 169: Latin America Ev Connectors Market Market Revenue (US$ Mn) Comparison by Country (2016-2032)
- Figure 170: Latin America Ev Connectors Market Market Revenue (US$ Mn) Comparison by By Type (2016-2032)
- Figure 171: Latin America Ev Connectors Market Market Revenue (US$ Mn) Comparison by By Charging level (2016-2032)
- Figure 172: Latin America Ev Connectors Market Market Revenue (US$ Mn) Comparison by By Charging speed (2016-2032)
- Figure 173: Latin America Ev Connectors Market Market Revenue (US$ Mn) Comparison by By Voltage (2016-2032)
- Figure 174: Latin America Ev Connectors Market Market Revenue (US$ Mn) Comparison by By Application (2016-2032)
- Figure 175: Latin America Ev Connectors Market Market Y-o-Y Growth Rate Comparison by Country (2016-2032)
- Figure 176: Latin America Ev Connectors Market Market Y-o-Y Growth Rate Comparison by By Type (2016-2032)
- Figure 177: Latin America Ev Connectors Market Market Y-o-Y Growth Rate Comparison by By Charging level (2016-2032)
- Figure 178: Latin America Ev Connectors Market Market Y-o-Y Growth Rate Comparison by By Charging speed (2016-2032)
- Figure 179: Latin America Ev Connectors Market Market Y-o-Y Growth Rate Comparison by By Voltage (2016-2032)
- Figure 180: Latin America Ev Connectors Market Market Y-o-Y Growth Rate Comparison by By Application (2016-2032)
- Figure 181: Latin America Ev Connectors Market Market Share Comparison by Country (2016-2032)
- Figure 182: Latin America Ev Connectors Market Market Share Comparison by By Type (2016-2032)
- Figure 183: Latin America Ev Connectors Market Market Share Comparison by By Charging level (2016-2032)
- Figure 184: Latin America Ev Connectors Market Market Share Comparison by By Charging speed (2016-2032)
- Figure 185: Latin America Ev Connectors Market Market Share Comparison by By Voltage (2016-2032)
- Figure 186: Latin America Ev Connectors Market Market Share Comparison by By Application (2016-2032)
- Figure 187: Middle East & Africa Ev Connectors Market Revenue (US$ Mn) Market Share by By Typein 2022
- Figure 188: Middle East & Africa Ev Connectors Market Market Attractiveness Analysis by By Type, 2016-2032
- Figure 189: Middle East & Africa Ev Connectors Market Revenue (US$ Mn) Market Share by By Charging levelin 2022
- Figure 190: Middle East & Africa Ev Connectors Market Market Attractiveness Analysis by By Charging level, 2016-2032
- Figure 191: Middle East & Africa Ev Connectors Market Revenue (US$ Mn) Market Share by By Charging speedin 2022
- Figure 192: Middle East & Africa Ev Connectors Market Market Attractiveness Analysis by By Charging speed, 2016-2032
- Figure 193: Middle East & Africa Ev Connectors Market Revenue (US$ Mn) Market Share by By Voltagein 2022
- Figure 194: Middle East & Africa Ev Connectors Market Market Attractiveness Analysis by By Voltage, 2016-2032
- Figure 195: Middle East & Africa Ev Connectors Market Revenue (US$ Mn) Market Share by By Applicationin 2022
- Figure 196: Middle East & Africa Ev Connectors Market Market Attractiveness Analysis by By Application, 2016-2032
- Figure 197: Middle East & Africa Ev Connectors Market Revenue (US$ Mn) Market Share by Country in 2022
- Figure 198: Middle East & Africa Ev Connectors Market Market Attractiveness Analysis by Country, 2016-2032
- Figure 199: Middle East & Africa Ev Connectors Market Market Revenue (US$ Mn) (2016-2032)
- Figure 200: Middle East & Africa Ev Connectors Market Market Revenue (US$ Mn) Comparison by Country (2016-2032)
- Figure 201: Middle East & Africa Ev Connectors Market Market Revenue (US$ Mn) Comparison by By Type (2016-2032)
- Figure 202: Middle East & Africa Ev Connectors Market Market Revenue (US$ Mn) Comparison by By Charging level (2016-2032)
- Figure 203: Middle East & Africa Ev Connectors Market Market Revenue (US$ Mn) Comparison by By Charging speed (2016-2032)
- Figure 204: Middle East & Africa Ev Connectors Market Market Revenue (US$ Mn) Comparison by By Voltage (2016-2032)
- Figure 205: Middle East & Africa Ev Connectors Market Market Revenue (US$ Mn) Comparison by By Application (2016-2032)
- Figure 206: Middle East & Africa Ev Connectors Market Market Y-o-Y Growth Rate Comparison by Country (2016-2032)
- Figure 207: Middle East & Africa Ev Connectors Market Market Y-o-Y Growth Rate Comparison by By Type (2016-2032)
- Figure 208: Middle East & Africa Ev Connectors Market Market Y-o-Y Growth Rate Comparison by By Charging level (2016-2032)
- Figure 209: Middle East & Africa Ev Connectors Market Market Y-o-Y Growth Rate Comparison by By Charging speed (2016-2032)
- Figure 210: Middle East & Africa Ev Connectors Market Market Y-o-Y Growth Rate Comparison by By Voltage (2016-2032)
- Figure 211: Middle East & Africa Ev Connectors Market Market Y-o-Y Growth Rate Comparison by By Application (2016-2032)
- Figure 212: Middle East & Africa Ev Connectors Market Market Share Comparison by Country (2016-2032)
- Figure 213: Middle East & Africa Ev Connectors Market Market Share Comparison by By Type (2016-2032)
- Figure 214: Middle East & Africa Ev Connectors Market Market Share Comparison by By Charging level (2016-2032)
- Figure 215: Middle East & Africa Ev Connectors Market Market Share Comparison by By Charging speed (2016-2032)
- Figure 216: Middle East & Africa Ev Connectors Market Market Share Comparison by By Voltage (2016-2032)
- Figure 217: Middle East & Africa Ev Connectors Market Market Share Comparison by By Application (2016-2032)
"
- List of Tables
- "
- Table 1: Global Ev Connectors Market Market Comparison by By Type (2016-2032)
- Table 2: Global Ev Connectors Market Market Comparison by By Charging level (2016-2032)
- Table 3: Global Ev Connectors Market Market Comparison by By Charging speed (2016-2032)
- Table 4: Global Ev Connectors Market Market Comparison by By Voltage (2016-2032)
- Table 5: Global Ev Connectors Market Market Comparison by By Application (2016-2032)
- Table 6: Global Ev Connectors Market Revenue (US$ Mn) Comparison by Region (2016-2032)
- Table 7: Global Ev Connectors Market Market Revenue (US$ Mn) (2016-2032)
- Table 8: Global Ev Connectors Market Market Revenue (US$ Mn) Comparison by Region (2016-2032)
- Table 9: Global Ev Connectors Market Market Revenue (US$ Mn) Comparison by By Type (2016-2032)
- Table 10: Global Ev Connectors Market Market Revenue (US$ Mn) Comparison by By Charging level (2016-2032)
- Table 11: Global Ev Connectors Market Market Revenue (US$ Mn) Comparison by By Charging speed (2016-2032)
- Table 12: Global Ev Connectors Market Market Revenue (US$ Mn) Comparison by By Voltage (2016-2032)
- Table 13: Global Ev Connectors Market Market Revenue (US$ Mn) Comparison by By Application (2016-2032)
- Table 14: Global Ev Connectors Market Market Y-o-Y Growth Rate Comparison by Region (2016-2032)
- Table 15: Global Ev Connectors Market Market Y-o-Y Growth Rate Comparison by By Type (2016-2032)
- Table 16: Global Ev Connectors Market Market Y-o-Y Growth Rate Comparison by By Charging level (2016-2032)
- Table 17: Global Ev Connectors Market Market Y-o-Y Growth Rate Comparison by By Charging speed (2016-2032)
- Table 18: Global Ev Connectors Market Market Y-o-Y Growth Rate Comparison by By Voltage (2016-2032)
- Table 19: Global Ev Connectors Market Market Y-o-Y Growth Rate Comparison by By Application (2016-2032)
- Table 20: Global Ev Connectors Market Market Share Comparison by Region (2016-2032)
- Table 21: Global Ev Connectors Market Market Share Comparison by By Type (2016-2032)
- Table 22: Global Ev Connectors Market Market Share Comparison by By Charging level (2016-2032)
- Table 23: Global Ev Connectors Market Market Share Comparison by By Charging speed (2016-2032)
- Table 24: Global Ev Connectors Market Market Share Comparison by By Voltage (2016-2032)
- Table 25: Global Ev Connectors Market Market Share Comparison by By Application (2016-2032)
- Table 26: North America Ev Connectors Market Market Comparison by By Charging level (2016-2032)
- Table 27: North America Ev Connectors Market Market Comparison by By Charging speed (2016-2032)
- Table 28: North America Ev Connectors Market Market Comparison by By Voltage (2016-2032)
- Table 29: North America Ev Connectors Market Market Comparison by By Application (2016-2032)
- Table 30: North America Ev Connectors Market Revenue (US$ Mn) Comparison by Country (2016-2032)
- Table 31: North America Ev Connectors Market Market Revenue (US$ Mn) (2016-2032)
- Table 32: North America Ev Connectors Market Market Revenue (US$ Mn) Comparison by Country (2016-2032)
- Table 33: North America Ev Connectors Market Market Revenue (US$ Mn) Comparison by By Type (2016-2032)
- Table 34: North America Ev Connectors Market Market Revenue (US$ Mn) Comparison by By Charging level (2016-2032)
- Table 35: North America Ev Connectors Market Market Revenue (US$ Mn) Comparison by By Charging speed (2016-2032)
- Table 36: North America Ev Connectors Market Market Revenue (US$ Mn) Comparison by By Voltage (2016-2032)
- Table 37: North America Ev Connectors Market Market Revenue (US$ Mn) Comparison by By Application (2016-2032)
- Table 38: North America Ev Connectors Market Market Y-o-Y Growth Rate Comparison by Country (2016-2032)
- Table 39: North America Ev Connectors Market Market Y-o-Y Growth Rate Comparison by By Type (2016-2032)
- Table 40: North America Ev Connectors Market Market Y-o-Y Growth Rate Comparison by By Charging level (2016-2032)
- Table 41: North America Ev Connectors Market Market Y-o-Y Growth Rate Comparison by By Charging speed (2016-2032)
- Table 42: North America Ev Connectors Market Market Y-o-Y Growth Rate Comparison by By Voltage (2016-2032)
- Table 43: North America Ev Connectors Market Market Y-o-Y Growth Rate Comparison by By Application (2016-2032)
- Table 44: North America Ev Connectors Market Market Share Comparison by Country (2016-2032)
- Table 45: North America Ev Connectors Market Market Share Comparison by By Type (2016-2032)
- Table 46: North America Ev Connectors Market Market Share Comparison by By Charging level (2016-2032)
- Table 47: North America Ev Connectors Market Market Share Comparison by By Charging speed (2016-2032)
- Table 48: North America Ev Connectors Market Market Share Comparison by By Voltage (2016-2032)
- Table 49: North America Ev Connectors Market Market Share Comparison by By Application (2016-2032)
- Table 50: Western Europe Ev Connectors Market Market Comparison by By Type (2016-2032)
- Table 51: Western Europe Ev Connectors Market Market Comparison by By Charging level (2016-2032)
- Table 52: Western Europe Ev Connectors Market Market Comparison by By Charging speed (2016-2032)
- Table 53: Western Europe Ev Connectors Market Market Comparison by By Voltage (2016-2032)
- Table 54: Western Europe Ev Connectors Market Market Comparison by By Application (2016-2032)
- Table 55: Western Europe Ev Connectors Market Revenue (US$ Mn) Comparison by Country (2016-2032)
- Table 56: Western Europe Ev Connectors Market Market Revenue (US$ Mn) (2016-2032)
- Table 57: Western Europe Ev Connectors Market Market Revenue (US$ Mn) Comparison by Country (2016-2032)
- Table 58: Western Europe Ev Connectors Market Market Revenue (US$ Mn) Comparison by By Type (2016-2032)
- Table 59: Western Europe Ev Connectors Market Market Revenue (US$ Mn) Comparison by By Charging level (2016-2032)
- Table 60: Western Europe Ev Connectors Market Market Revenue (US$ Mn) Comparison by By Charging speed (2016-2032)
- Table 61: Western Europe Ev Connectors Market Market Revenue (US$ Mn) Comparison by By Voltage (2016-2032)
- Table 62: Western Europe Ev Connectors Market Market Revenue (US$ Mn) Comparison by By Application (2016-2032)
- Table 63: Western Europe Ev Connectors Market Market Y-o-Y Growth Rate Comparison by Country (2016-2032)
- Table 64: Western Europe Ev Connectors Market Market Y-o-Y Growth Rate Comparison by By Type (2016-2032)
- Table 65: Western Europe Ev Connectors Market Market Y-o-Y Growth Rate Comparison by By Charging level (2016-2032)
- Table 66: Western Europe Ev Connectors Market Market Y-o-Y Growth Rate Comparison by By Charging speed (2016-2032)
- Table 67: Western Europe Ev Connectors Market Market Y-o-Y Growth Rate Comparison by By Voltage (2016-2032)
- Table 68: Western Europe Ev Connectors Market Market Y-o-Y Growth Rate Comparison by By Application (2016-2032)
- Table 69: Western Europe Ev Connectors Market Market Share Comparison by Country (2016-2032)
- Table 70: Western Europe Ev Connectors Market Market Share Comparison by By Type (2016-2032)
- Table 71: Western Europe Ev Connectors Market Market Share Comparison by By Charging level (2016-2032)
- Table 72: Western Europe Ev Connectors Market Market Share Comparison by By Charging speed (2016-2032)
- Table 73: Western Europe Ev Connectors Market Market Share Comparison by By Voltage (2016-2032)
- Table 74: Western Europe Ev Connectors Market Market Share Comparison by By Application (2016-2032)
- Table 75: Eastern Europe Ev Connectors Market Market Comparison by By Type (2016-2032)
- Table 76: Eastern Europe Ev Connectors Market Market Comparison by By Charging level (2016-2032)
- Table 77: Eastern Europe Ev Connectors Market Market Comparison by By Charging speed (2016-2032)
- Table 78: Eastern Europe Ev Connectors Market Market Comparison by By Voltage (2016-2032)
- Table 79: Eastern Europe Ev Connectors Market Market Comparison by By Application (2016-2032)
- Table 80: Eastern Europe Ev Connectors Market Revenue (US$ Mn) Comparison by Country (2016-2032)
- Table 81: Eastern Europe Ev Connectors Market Market Revenue (US$ Mn) (2016-2032)
- Table 82: Eastern Europe Ev Connectors Market Market Revenue (US$ Mn) Comparison by Country (2016-2032)
- Table 83: Eastern Europe Ev Connectors Market Market Revenue (US$ Mn) Comparison by By Type (2016-2032)
- Table 84: Eastern Europe Ev Connectors Market Market Revenue (US$ Mn) Comparison by By Charging level (2016-2032)
- Table 85: Eastern Europe Ev Connectors Market Market Revenue (US$ Mn) Comparison by By Charging speed (2016-2032)
- Table 86: Eastern Europe Ev Connectors Market Market Revenue (US$ Mn) Comparison by By Voltage (2016-2032)
- Table 87: Eastern Europe Ev Connectors Market Market Revenue (US$ Mn) Comparison by By Application (2016-2032)
- Table 88: Eastern Europe Ev Connectors Market Market Y-o-Y Growth Rate Comparison by Country (2016-2032)
- Table 89: Eastern Europe Ev Connectors Market Market Y-o-Y Growth Rate Comparison by By Type (2016-2032)
- Table 90: Eastern Europe Ev Connectors Market Market Y-o-Y Growth Rate Comparison by By Charging level (2016-2032)
- Table 91: Eastern Europe Ev Connectors Market Market Y-o-Y Growth Rate Comparison by By Charging speed (2016-2032)
- Table 92: Eastern Europe Ev Connectors Market Market Y-o-Y Growth Rate Comparison by By Voltage (2016-2032)
- Table 93: Eastern Europe Ev Connectors Market Market Y-o-Y Growth Rate Comparison by By Application (2016-2032)
- Table 94: Eastern Europe Ev Connectors Market Market Share Comparison by Country (2016-2032)
- Table 95: Eastern Europe Ev Connectors Market Market Share Comparison by By Type (2016-2032)
- Table 96: Eastern Europe Ev Connectors Market Market Share Comparison by By Charging level (2016-2032)
- Table 97: Eastern Europe Ev Connectors Market Market Share Comparison by By Charging speed (2016-2032)
- Table 98: Eastern Europe Ev Connectors Market Market Share Comparison by By Voltage (2016-2032)
- Table 99: Eastern Europe Ev Connectors Market Market Share Comparison by By Application (2016-2032)
- Table 100: APAC Ev Connectors Market Market Comparison by By Type (2016-2032)
- Table 101: APAC Ev Connectors Market Market Comparison by By Charging level (2016-2032)
- Table 102: APAC Ev Connectors Market Market Comparison by By Charging speed (2016-2032)
- Table 103: APAC Ev Connectors Market Market Comparison by By Voltage (2016-2032)
- Table 104: APAC Ev Connectors Market Market Comparison by By Application (2016-2032)
- Table 105: APAC Ev Connectors Market Revenue (US$ Mn) Comparison by Country (2016-2032)
- Table 106: APAC Ev Connectors Market Market Revenue (US$ Mn) (2016-2032)
- Table 107: APAC Ev Connectors Market Market Revenue (US$ Mn) Comparison by Country (2016-2032)
- Table 108: APAC Ev Connectors Market Market Revenue (US$ Mn) Comparison by By Type (2016-2032)
- Table 109: APAC Ev Connectors Market Market Revenue (US$ Mn) Comparison by By Charging level (2016-2032)
- Table 110: APAC Ev Connectors Market Market Revenue (US$ Mn) Comparison by By Charging speed (2016-2032)
- Table 111: APAC Ev Connectors Market Market Revenue (US$ Mn) Comparison by By Voltage (2016-2032)
- Table 112: APAC Ev Connectors Market Market Revenue (US$ Mn) Comparison by By Application (2016-2032)
- Table 113: APAC Ev Connectors Market Market Y-o-Y Growth Rate Comparison by Country (2016-2032)
- Table 114: APAC Ev Connectors Market Market Y-o-Y Growth Rate Comparison by By Type (2016-2032)
- Table 115: APAC Ev Connectors Market Market Y-o-Y Growth Rate Comparison by By Charging level (2016-2032)
- Table 116: APAC Ev Connectors Market Market Y-o-Y Growth Rate Comparison by By Charging speed (2016-2032)
- Table 117: APAC Ev Connectors Market Market Y-o-Y Growth Rate Comparison by By Voltage (2016-2032)
- Table 118: APAC Ev Connectors Market Market Y-o-Y Growth Rate Comparison by By Application (2016-2032)
- Table 119: APAC Ev Connectors Market Market Share Comparison by Country (2016-2032)
- Table 120: APAC Ev Connectors Market Market Share Comparison by By Type (2016-2032)
- Table 121: APAC Ev Connectors Market Market Share Comparison by By Charging level (2016-2032)
- Table 122: APAC Ev Connectors Market Market Share Comparison by By Charging speed (2016-2032)
- Table 123: APAC Ev Connectors Market Market Share Comparison by By Voltage (2016-2032)
- Table 124: APAC Ev Connectors Market Market Share Comparison by By Application (2016-2032)
- Table 125: Latin America Ev Connectors Market Market Comparison by By Type (2016-2032)
- Table 126: Latin America Ev Connectors Market Market Comparison by By Charging level (2016-2032)
- Table 127: Latin America Ev Connectors Market Market Comparison by By Charging speed (2016-2032)
- Table 128: Latin America Ev Connectors Market Market Comparison by By Voltage (2016-2032)
- Table 129: Latin America Ev Connectors Market Market Comparison by By Application (2016-2032)
- Table 130: Latin America Ev Connectors Market Revenue (US$ Mn) Comparison by Country (2016-2032)
- Table 131: Latin America Ev Connectors Market Market Revenue (US$ Mn) (2016-2032)
- Table 132: Latin America Ev Connectors Market Market Revenue (US$ Mn) Comparison by Country (2016-2032)
- Table 133: Latin America Ev Connectors Market Market Revenue (US$ Mn) Comparison by By Type (2016-2032)
- Table 134: Latin America Ev Connectors Market Market Revenue (US$ Mn) Comparison by By Charging level (2016-2032)
- Table 135: Latin America Ev Connectors Market Market Revenue (US$ Mn) Comparison by By Charging speed (2016-2032)
- Table 136: Latin America Ev Connectors Market Market Revenue (US$ Mn) Comparison by By Voltage (2016-2032)
- Table 137: Latin America Ev Connectors Market Market Revenue (US$ Mn) Comparison by By Application (2016-2032)
- Table 138: Latin America Ev Connectors Market Market Y-o-Y Growth Rate Comparison by Country (2016-2032)
- Table 139: Latin America Ev Connectors Market Market Y-o-Y Growth Rate Comparison by By Type (2016-2032)
- Table 140: Latin America Ev Connectors Market Market Y-o-Y Growth Rate Comparison by By Charging level (2016-2032)
- Table 141: Latin America Ev Connectors Market Market Y-o-Y Growth Rate Comparison by By Charging speed (2016-2032)
- Table 142: Latin America Ev Connectors Market Market Y-o-Y Growth Rate Comparison by By Voltage (2016-2032)
- Table 143: Latin America Ev Connectors Market Market Y-o-Y Growth Rate Comparison by By Application (2016-2032)
- Table 144: Latin America Ev Connectors Market Market Share Comparison by Country (2016-2032)
- Table 145: Latin America Ev Connectors Market Market Share Comparison by By Type (2016-2032)
- Table 146: Latin America Ev Connectors Market Market Share Comparison by By Charging level (2016-2032)
- Table 147: Latin America Ev Connectors Market Market Share Comparison by By Charging speed (2016-2032)
- Table 148: Latin America Ev Connectors Market Market Share Comparison by By Voltage (2016-2032)
- Table 149: Latin America Ev Connectors Market Market Share Comparison by By Application (2016-2032)
- Table 150: Middle East & Africa Ev Connectors Market Market Comparison by By Type (2016-2032)
- Table 151: Middle East & Africa Ev Connectors Market Market Comparison by By Charging level (2016-2032)
- Table 152: Middle East & Africa Ev Connectors Market Market Comparison by By Charging speed (2016-2032)
- Table 153: Middle East & Africa Ev Connectors Market Market Comparison by By Voltage (2016-2032)
- Table 154: Middle East & Africa Ev Connectors Market Market Comparison by By Application (2016-2032)
- Table 155: Middle East & Africa Ev Connectors Market Revenue (US$ Mn) Comparison by Country (2016-2032)
- Table 156: Middle East & Africa Ev Connectors Market Market Revenue (US$ Mn) (2016-2032)
- Table 157: Middle East & Africa Ev Connectors Market Market Revenue (US$ Mn) Comparison by Country (2016-2032)
- Table 158: Middle East & Africa Ev Connectors Market Market Revenue (US$ Mn) Comparison by By Type (2016-2032)
- Table 159: Middle East & Africa Ev Connectors Market Market Revenue (US$ Mn) Comparison by By Charging level (2016-2032)
- Table 160: Middle East & Africa Ev Connectors Market Market Revenue (US$ Mn) Comparison by By Charging speed (2016-2032)
- Table 161: Middle East & Africa Ev Connectors Market Market Revenue (US$ Mn) Comparison by By Voltage (2016-2032)
- Table 162: Middle East & Africa Ev Connectors Market Market Revenue (US$ Mn) Comparison by By Application (2016-2032)
- Table 163: Middle East & Africa Ev Connectors Market Market Y-o-Y Growth Rate Comparison by Country (2016-2032)
- Table 164: Middle East & Africa Ev Connectors Market Market Y-o-Y Growth Rate Comparison by By Type (2016-2032)
- Table 165: Middle East & Africa Ev Connectors Market Market Y-o-Y Growth Rate Comparison by By Charging level (2016-2032)
- Table 166: Middle East & Africa Ev Connectors Market Market Y-o-Y Growth Rate Comparison by By Charging speed (2016-2032)
- Table 167: Middle East & Africa Ev Connectors Market Market Y-o-Y Growth Rate Comparison by By Voltage (2016-2032)
- Table 168: Middle East & Africa Ev Connectors Market Market Y-o-Y Growth Rate Comparison by By Application (2016-2032)
- Table 169: Middle East & Africa Ev Connectors Market Market Share Comparison by Country (2016-2032)
- Table 170: Middle East & Africa Ev Connectors Market Market Share Comparison by By Type (2016-2032)
- Table 171: Middle East & Africa Ev Connectors Market Market Share Comparison by By Charging level (2016-2032)
- Table 172: Middle East & Africa Ev Connectors Market Market Share Comparison by By Charging speed (2016-2032)
- Table 173: Middle East & Africa Ev Connectors Market Market Share Comparison by By Voltage (2016-2032)
- Table 174: Middle East & Africa Ev Connectors Market Market Share Comparison by By Application (2016-2032)
- 1. Executive Summary
-
- Yazaki (Japan)
- Schneider Electric (France)
- Tesla (U.S.)
- Bosch (Germany)
- ABB (China)
- Siemens AG (Germany)
- Fujikura (Japan)
- Amphenol (U.S.)
- Huber+Suhner (Switzerland)
- Sumitomo (Japan)
- others
Our Clients


View Our Licence Options
