
Eubiotics Market By Product Type(Probiotics, Prebiotics, Organic Acids, Other), By Form(Dry, Liquid), By Livestock(Poultry, Cattle, Other), By Function(Gut & Digestive Health, Immunity, Others), By Region And Companies - Industry Segment Outlook, Market Assessment, Competition Scenario, Trends, And Forecast 2023-2032
-
4037
-
May 2023
-
180
-


-
This report was compiled by Correspondence Linkedin | Detailed Market research Methodology Our methodology involves a mix of primary research, including interviews with leading mental health experts, and secondary research from reputable medical journals and databases. View Detailed Methodology Page
-
Quick Navigation
Report Overview
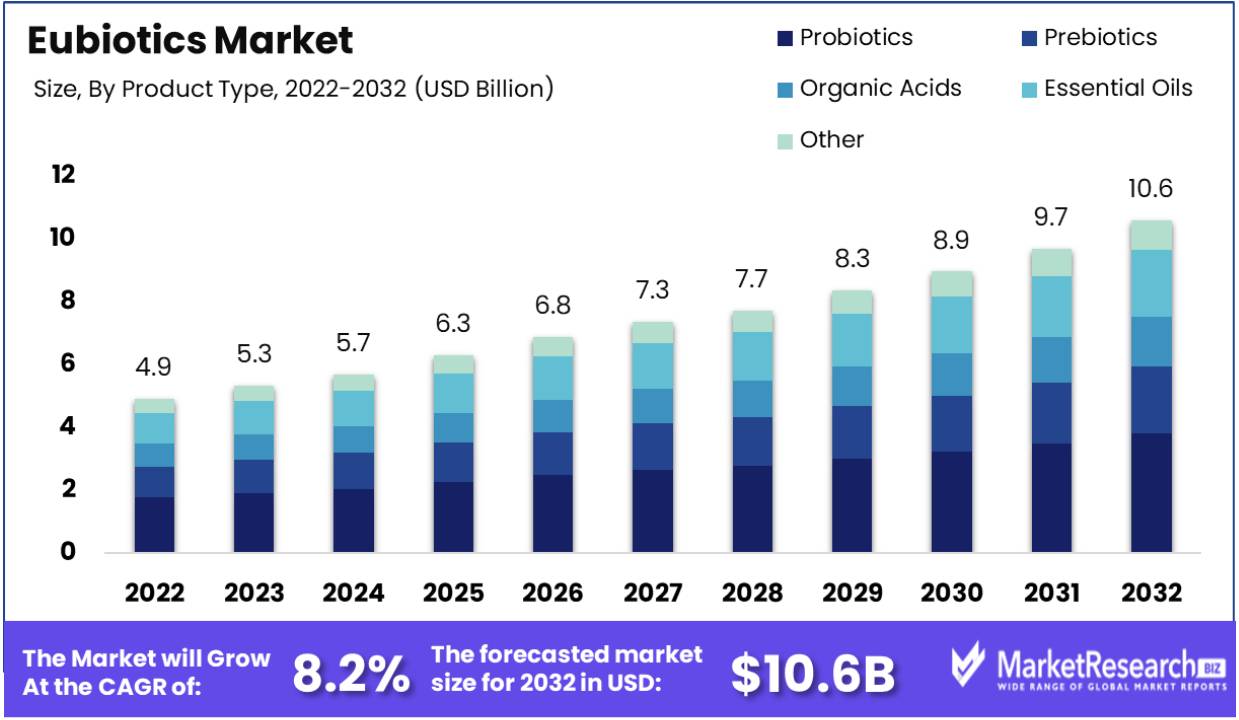
Eubiotics Market size is expected to be worth around USD 10.6 Bn by 2032 from USD 4.9 Bn in 2022, growing at a CAGR of 8.2% during the forecast period from 2023 to 2032. The surge in meat consumption and regulatory scenarios that forbid the use of antibiotics are some of the main driving factors for the eubiotics market expansion.
Eubiotics are used in the animal feed sector to help livestock increase the demand for meat products. This product is used as a feed additive that can enhance animal performance, maintain digestive health, and surge nutrient utilization.
According to a report, annually more than 2 million Individuals are infected with antibiotic resistance bacteria, with more than 23K death cases. It is predicted that by 2050, globally there will be more than 10 million death cases that will result in antimicrobial resistance. According to WHO, antimicrobial resistance (AMR) is the ability of a virus, bacteria, or some other parasites to end antimicrobials like antivirals, antibiotics, and others from working against it.
Eubiotics' market growth will likely be propelled by favorable legal decisions that reduce antibiotic usage and boost global meat consumption. With competition among companies intensifying in this rapidly expanding and competitive marketplace, many are investing heavily in R&D initiatives for creating eco-friendly production procedures to gain market share.
Given the intense market competition in many developing regions, new businesses can easily take advantage of opportunities presented to them to enter and create an identity in these marketplaces. Eubiotics play a critical role in developing countries due to an increasing need for antibiotics. Eubiotics help strengthen immunity and play an integral part in overall healthcare.
These are good for digestive health and act as an alternative to antibiotics in feed. The market is not only expanding in the US and Europe but also it is widening its reach in developing regions such as India, Brazil, and China. The global demand for human food and the need for eco-friendly products, animal and fishery feed items, and food supplements has gotten major attention in humans as well as in prebiotics in animal feed additives.
Additionally, the high demand for end use such as feed, and pharmaceutical along with the surge in manufacturing, which is inclined to connect the gap between the stock and demand is further expected to increase the prices over the coming future and will contribute to the market expansion in the forecast period.
Driving factors
Growing Demand for Natural Growth Promoters Fuels Eubiotics Market
The growing demand for natural growth promoters in animal feed is a significant factor driving the eubiotics market. As the livestock industry seeks alternatives to synthetic growth enhancers, which include probiotics, prebiotics, essential oils, and organic acids, are becoming increasingly popular. These natural additives promote gut health and improve feed efficiency, leading to healthier and faster-growing animals.
This shift towards natural growth promoters is driven by consumer demand for healthier and more naturally raised livestock. As the industry continues to move away from synthetic additives, the demand for eubiotics is expected to rise, supporting sustained market growth.
Rising Awareness of Animal Health Boosts Eubiotics Market
Awareness of animal health among farmers, veterinarians, and consumers has spurred an explosion of interest in products among these groups. Increased knowledge about how animal health, productivity, and food quality interrelate leads to an increase in nutrition and gut health for livestock - serving an integral role in maintaining an ideal microflora to support animal well-being and their overall well-being.
This industry trend is further supported by increasing consumer awareness of how livestock are raised, with an emphasis on healthy and well-cared-for animals. This long-term effect will likely create a steady demand for eubiotics as essential elements of animal health and nutrition programs.
Stringent Regulations on Antibiotic Use Propel Eubiotics Demand
Stringent regulations on the use of antibiotics in livestock feed are driving demand for eubiotics. As concerns over antibiotic resistance mount, many countries are enacting regulations restricting antibiotic usage as growth promoters in demand for animal feed mills - leading the livestock industry to look for other solutions; with eubiotics emerging as effective and safe solutions.
As these regulations spread further, the shift towards eubiotics may accelerate as a way to comply with them and address public health concerns related to antibiotic resistance.
Growing Demand for Organic Meat and Dairy Products Enhances Eubiotics Market
The growing demand for organic meat and demand for dairy products is enhancing the eubiotics market. As consumers increasingly opt for organic and naturally produced food, the livestock industry is adapting to meet these preferences. Eubiotics are essential in organic farming practices, as they naturally enhance animal growth and health of animals without the use of synthetic additives.
This consumer-driven future trend towards organic products is encouraging farmers to incorporate eubiotics into their feed, aligning with the market demand for natural and organic livestock products. The ongoing preference for organic foods suggests a continued market expansion, paralleling the growth of the organic food industry.
Restraining Factors
High-Cost Restrains Eubiotics Market Growth
The high cost of eubiotics is a significant barrier to their widespread adoption and market growth. Eubiotics, which include probiotics, prebiotics, organic acids, and essential oils, often involve complex production processes and sourcing of quality ingredients, leading to higher prices compared to traditional feed additives. This cost factor can be particularly prohibitive for small-scale farmers or those in developing regions, where budget constraints are a major consideration. As a result, the higher cost can limit their use to larger, more financially stable farming operations, thus restraining the growth potential of the market across a broader consumer base.
Lack of Knowledge Restrains Eubiotics Market Growth
A lack of knowledge and understanding about eubiotics and their benefits in animal nutrition and health significantly limits market growth. Many farmers and feed manufacturers may not be fully aware of how eubiotics work, their advantages over traditional feed additives, or the long-term benefits they offer in terms of animal health and productivity. This lack of awareness can result in hesitation or resistance to adoption, particularly in regions where conventional feed additives have been the norm for decades. Education and outreach efforts are essential to increase understanding and acceptance, which is crucial for expanding their market presence.
Segmentation Analysis of Eubiotics Market
By Product Type Analysis
The probiotics segment leads the eubiotics market due to their proven capabilities of improving gut health and increasing nutrient absorption rates in livestock. Probiotics in animal feed also play an integral part in maintaining balance in gut microbiota, optimizing feed efficiency, and overall improving animal wellbeing. Demand for probiotics has risen due to an increasing focus on natural growth promoters as well as decreased use of antibiotics in production animals; probiotics provide an alternative option that provides disease prevention as well as growth enhancement capabilities in these instances.
Prebiotics are gaining traction for their role in fostering beneficial gut bacteria. Organic acids are used for their preservative and pH-lowering properties, contributing to pathogen control. Essential oils are emerging as natural growth promoters with antimicrobial properties. Each of these segments complements probiotics, offering diverse solutions in animal nutrition and health.
By Form Analysis
The dry segment form of eubiotics is predominant due to its ease of handling, storage, and longer shelf life. Dry eubiotics, including powders and granules, are easily mixable with feed, making them a convenient option for large-scale livestock producers.
Liquid forms of eubiotics are used in specific applications where they may be more effective or easier to administer. However, their use is limited compared to dry forms due to handling and storage challenges.
By Livestock Analysis
The poultry segment is the largest segment for eubiotics, reflecting the extensive poultry production worldwide and the high demand for poultry feed products. Eubiotics are crucial in optimizing gut health, enhancing feed efficiency, and maintaining the overall health of poultry, which is vital for maximizing production and profitability. The eubiotics industry thrives as it supports the health of livestock. Regional segments see major players with a strong awareness of eubiotic ingredients.
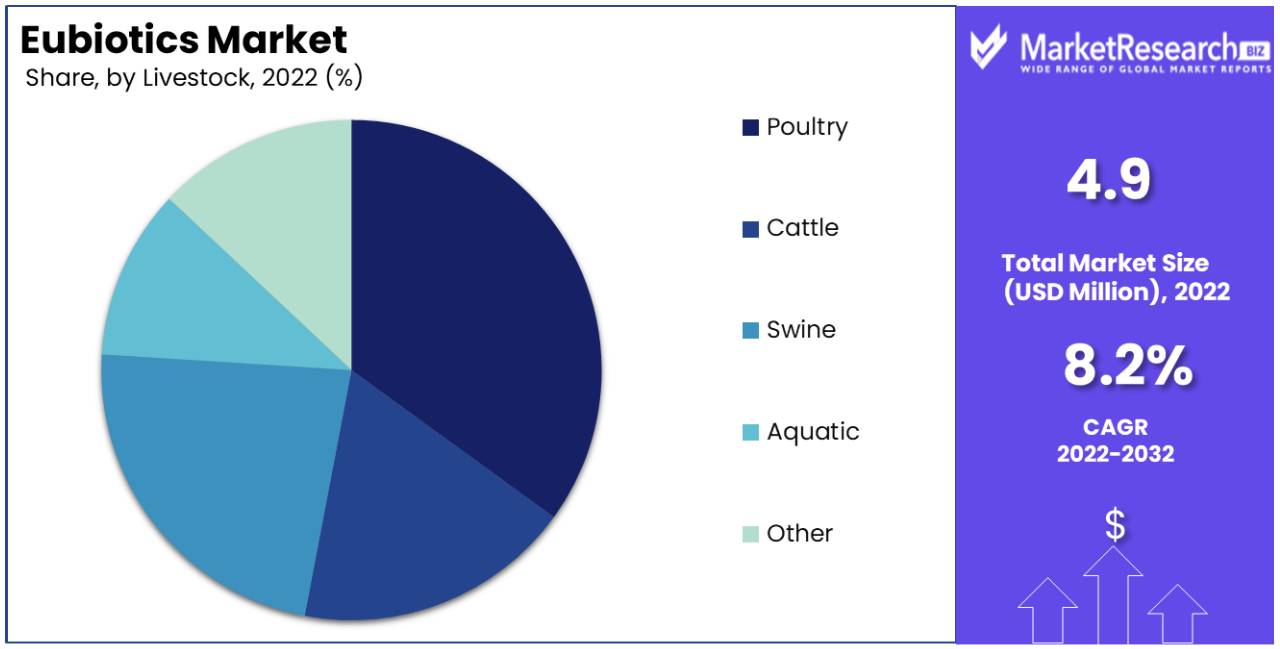
Eubiotics are also significant in cattle for improving rumen health and in swine feed for growth performance. The use of aquaculture is growing, focusing on water quality and disease prevention. Each livestock segment presents unique challenges and opportunities for applications.
By Function Analysis
The gut and digestive health segment is the primary function of eubiotics. Their role in maintaining a healthy balance of gut microflora is essential for effective nutrient absorption, optimal digestive function, and prevention of gastrointestinal disorders in livestock.
Eubiotics also contribute to general health and wellness, enhancing immune responses and preventing diseases. Other functions include improving feed palatability and reducing the environmental impact of livestock production.
Key Market Segments
By Product Type
- Probiotics
- Prebiotics
- Organic Acids
- Essential Oils
- Other
By Form
- Dry
- Liquid
By Livestock
- Poultry
- Cattle
- Swine
- Aquatic
- Other
By Function
- Gut & Digestive Health
- General Health & Wellness
- Immunity
- Others
Growth Opportunity
Increasing Investments in Healthcare Research Propel Eubiotics Market Growth
Expansion Role: The growing investments in healthcare research, particularly in the veterinary sector, present significant opportunities for the eubiotics market. These investments enable the development of advanced eubiotic products tailored to various animal health needs. Increased funding is crucial for conducting extensive research on the efficacy and safety of eubiotics, which is essential for market acceptance and growth.
As the global veterinary healthcare market continues to expand, driven by rising pet ownership and livestock production, the demand for effective is expected to increase, thereby fostering market growth. The Eubiotics Market experiences robust growth due to the high demand for feed additives. The largest market share is divided among various market segments catering to animal feed products, ultimately contributing to the overall health maintenance of animals.
Continuous Technological Advancements Enhance Eubiotics Market
Technological Innovations Are At the Core: Technological advancements play a vital role in expanding the eubiotics market. Developments in biotechnology and microbiology have resulted in more effective, targeted products being created. Furthermore, technological innovations enable better manipulation of microbial populations found within animal guts for improved animal health and productivity; more efficient production processes reduce costs and increase accessibility; as technological progress evolves it may create new applications and enhance effectiveness, further driving market expansion.
Growing Applications of Eubiotics in Animal Feed Stimulate Market Opportunities
Expansion Role: The expanding applications of eubiotics in animal feed present substantial opportunities for market growth. Eubiotics are increasingly being incorporated into feed for livestock and pets due to their benefits in improving feed efficiency, enhancing gut health, and boosting immunity. The global animal feed market's growth, coupled with the rising demand for high-quality animal products, is driving the incorporation of eubiotics in feed formulations.
As the awareness and demand for sustainable and natural growth promoters in animal feed grow, the eubiotics market is poised for significant expansion. Eubiotics secure health applications and the largest share, fostering proper growth in demand. strong demand propels continuous growth for Eubiotics, driving market expansion.
Regional Analysis
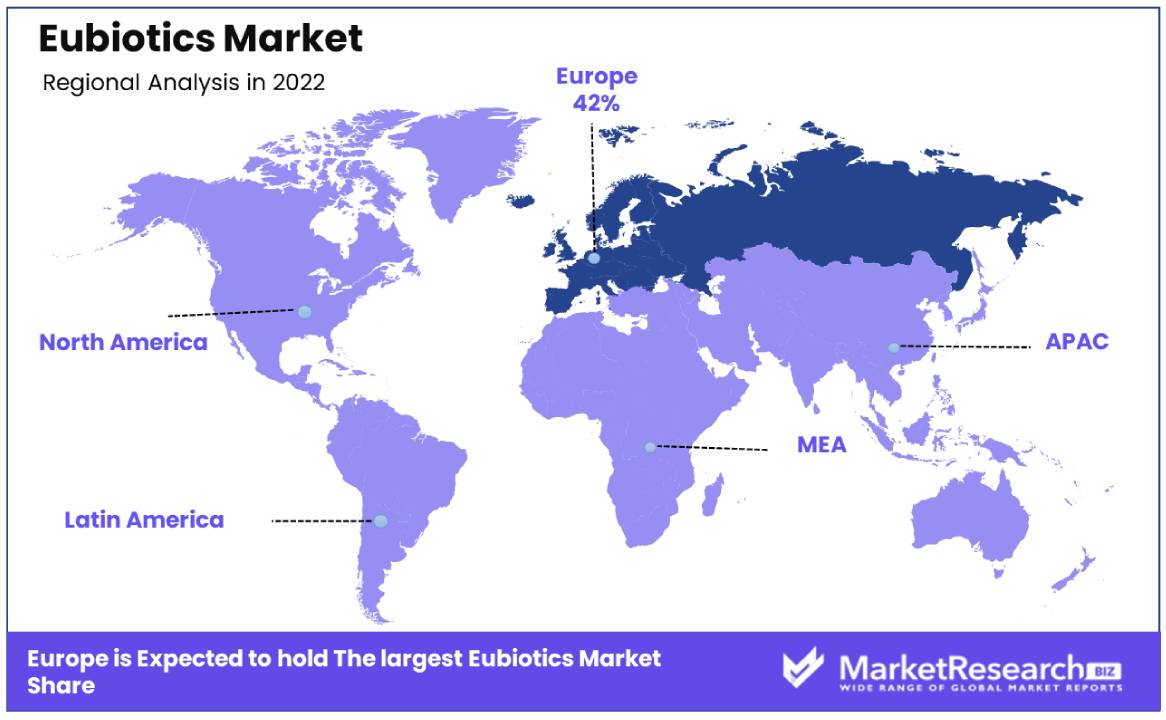
Europe Dominates with 42% Market Share
Europe's dominance in the Eubiotics Market, commanding a substantial 42% market share, can be attributed to several key factors. Firstly, the region's stringent regulations on antibiotic use in animal agriculture have driven the demand for eubiotics as alternatives, fostering innovation and market growth. Additionally, Europe's focus on sustainable farming practices aligns with the rising consumer preference for antibiotic-free and environmentally-friendly food products, further boosting the adoption of eubiotics.
The well-established livestock farming sector in countries like Germany, France, and the Netherlands creates a substantial customer base for eubiotics. Moreover, Europe's affluent consumer base places a premium on food quality and safety, encouraging the livestock industry to adopt eubiotics to meet these demands. The region's diverse climate and agriculture landscape also contribute to a wide range of applications for eubiotics, from poultry to aquaculture. Looking ahead, Europe's dominant position in the Eubiotics Market is likely to continue its growth trajectory.
Asia-Pacific Emerges as a Growing Force
The Asia-Pacific region's unique characteristics play a pivotal role in shaping the Eubiotics Market dynamics. The diverse climates and farming practices across countries in this region require versatile eubiotic solutions that cater to a variety of animal species. Furthermore, the presence of large-scale, vertically integrated livestock operations in some countries necessitates the use of eubiotics to maintain herd health.
As consumers in Asia-Pacific become more discerning and health-conscious, the eubiotics market is poised for continued growth. The region's increasing investment in research and development also contributes to product innovation, further enhancing its market position.
North America Holds a Strong Foothold with Significant Market Share
The North American region's specific characteristics play a pivotal role in shaping the dynamics of the Eubiotics Market. The United States and Canada, in particular, have extensive livestock industries that rely on eubiotics to maintain herd health and meet consumer demands for safe and sustainable food products.
The region's advanced regulatory framework and stringent quality standards drive innovation in eubiotic products, ensuring their safety and efficacy. As consumer awareness of eubiotics' benefits continues to rise, North America's eubiotics market is poised for sustained growth. Collaborations between research institutions and the private sector further contribute to the development of cutting-edge eubiotic solutions.
Key Regions and Countries
North America
- The US
- Canada
- Rest of North America
Europe
- Germany
- France
- The UK
- Spain
- Italy
- Russia
- Netherlands
- Rest of Europe
Asia-Pacific
- China
- Japan
- South Korea
- India
- New Zealand
- Singapore
- Thailand
- Vietnam
- Rest of Asia Pacific
Latin America
- Brazil
- Mexico
- Rest of Latin America
Middle East & Africa
- South Africa
- Saudi Arabia
- UAE
- Rest of Middle East & Africa
Key Players Analysis
The eubiotics market is characterized by the presence of global corporations and specialized nutrition firms, each contributing significantly to the industry's landscape. Cargill Incorporated and DSM N.V. are leading prominent players, recognized for their comprehensive range of eubiotics products and substantial contributions to animal nutrition research. Their strategic positioning emphasizes a commitment to sustainable and efficient animal production.
DuPont de Nemours, Inc. and Associated British Foods plc have a strong market presence, offering a diverse portfolio of eubiotics focused on improving animal gut health and overall feed efficiency. Their innovations in animal nutrition underscore their influence in the market.
BASF SE and Novozymes A/S are noted for their advancements in natural and organic eubiotics, catering to the growing demand for sustainable animal feed solutions. UAS Laboratories and Lesaffre Group specialize in probiotics, with a focus on specific health benefits and custom solutions for various animal species.
Collectively, these key players drive the eubiotics market through a blend of extensive research, product innovation, and a focus on sustainable and efficient animal nutrition, catering to the evolving needs of the global animal feed industry.
Top Key Players in Eubiotics Market
- Cargill Incorporated
- DSM N.V.
- DuPont de Nemours, Inc.
- Associated British Foods plc
- BASF SE
- Novozymes A/S
- UAS Laboratories
- Kemin Industries Inc.
- Advanced BioNutrition Corp
- Lesaffre Group
- Calpis Co., Ltd.
- Koninklijke DSM NV
- E I. du Pont de Nemours and Company
- Chr Hansen Holding A/S
- Behn Meyer Holding AG
- Lallemand Inc.
- Cargill Inc.
- Midori USA Inc.
- Bluestar Adisseo Co.
- Novus International, Inc.
- Other Key Players
Recent Development
- In January 2023, Cargill and BASF expanded their cooperation in feed enzyme development to cater to the growing demand for animal protein in the U.S. Novus International Inc. acquired Agrivida Inc., bringing innovative technology for encapsulating feed additives inside grains.
- In August 2022, DSM introduced Symphiome, a precision biotic designed to boost poultry health and sustainability. It aimed to optimize resilience to enteric stress, improve nutrient utilization, and reduce emissions, aligning with the focus on sustainable meat production.
- In July 2022, Kemin Industries launched ENTEROSURE, a next-generation probiotic solution designed to enhance intestinal resilience in poultry. This innovation aimed to reduce the risk of diseases affecting poultry's intestinal health.
- In 2022, Meat consumption continued to rise globally, driven by population growth, particularly in China, which consumed over 53 million tons of pork and 10 million tons of beef and veal.
Report Scope:
Report Features Description Market Value (2022) USD 4.9 Bn Forecast Revenue (2032) USD 10.6 Bn CAGR (2023-2032) 8.2% Base Year for Estimation 2022 Historic Period 2016-2022 Forecast Period 2023-2032 Report Coverage Revenue Forecast, Market Dynamics, COVID-19 Impact, Competitive Landscape, Recent Developments Segments Covered By Product Type(Probiotics, Prebiotics, Organic Acids, Essential Oils, Other), By Form(Dry, Liquid), By Livestock(Poultry, Cattle, Swine, Aquatic, Other), By Function(Gut & Digestive Health, General Health & Wellness, Immunity, Others) Regional Analysis North America - The US, Canada, Rest of North America, Europe - Germany, France, The UK, Spain, Italy, Russia, Netherlands, Rest of Europe, Asia-Pacific - China, Japan, South Korea, India, New Zealand, Singapore, Thailand, Vietnam, Rest of Asia Pacific, Latin America - Brazil, Mexico, Rest of Latin America, Middle East & Africa - South Africa, Saudi Arabia, UAE, Rest of Middle East & Africa Competitive Landscape Cargill Incorporated, DSM N.V., DuPont de Nemours, Inc., Associated British Foods plc, BASF SE, Novozymes A/S, UAS Laboratories, Kemin Industries Inc., Advanced BioNutrition Corp, Lesaffre Group, Calpis Co., Ltd., Koninklijke DSM NV, E I. du Pont de Nemours and Company, Chr Hansen Holding A/S, Behn Meyer Holding AG, Lallemand Inc., Cargill Inc., Bluestar Adisseo Co., Novus International, Inc.Other Key Players Customization Scope Customization for segments, region/country-level will be provided. Moreover, additional customization can be done based on the requirements. Purchase Options We have three licenses to opt for: Single User License, Multi-User License (Up to 5 Users), Corporate Use License (Unlimited User and Printable PDF) -
- 1. Executive Summary
- 1.1. Definition
- 1.2. Taxonomy
- 1.3. Research Scope
- 1.4. Key Analysis
- 1.5. Key Findings by Major Segments
- 1.6. Top strategies by Major Players
- 2. Global Eubiotics Market Overview
- 2.1. Eubiotics Market Dynamics
- 2.1.1. Drivers
- 2.1.2. Opportunities
- 2.1.3. Restraints
- 2.1.4. Challenges
- 2.2. Macro-economic Factors
- 2.3. Regulatory Framework
- 2.4. Market Investment Feasibility Index
- 2.5. PEST Analysis
- 2.6. PORTER’S Five Force Analysis
- 2.7. Drivers & Restraints Impact Analysis
- 2.8. Industry Chain Analysis
- 2.9. Cost Structure Analysis
- 2.10. Marketing Strategy
- 2.11. Russia-Ukraine War Impact Analysis
- 2.12. Opportunity Map Analysis
- 2.13. Market Competition Scenario Analysis
- 2.14. Product Life Cycle Analysis
- 2.15. Opportunity Orbits
- 2.16. Manufacturer Intensity Map
- 2.17. Major Companies sales by Value & Volume
- 2.1. Eubiotics Market Dynamics
- 3. Global Eubiotics Market Analysis, Opportunity and Forecast, 2016-2032
- 3.1. Global Eubiotics Market Analysis, 2016-2021
- 3.2. Global Eubiotics Market Opportunity and Forecast, 2023-2032
- 3.3. Global Eubiotics Market Analysis, Opportunity and Forecast, By Product Type, 2016-2032
- 3.3.1. Global Eubiotics Market Analysis by Product Type: Introduction
- 3.3.2. Market Size Absolute $ Opportunity Analysis and Forecast, By Product Type, 2016-2032
- 3.3.3. Probiotics
- 3.3.4. Prebiotics
- 3.3.5. Organic Acids
- 3.3.6. Essential Oils
- 3.3.7. Other Product Types
- 3.4. Global Eubiotics Market Analysis, Opportunity and Forecast, By Form, 2016-2032
- 3.4.1. Global Eubiotics Market Analysis by Form: Introduction
- 3.4.2. Market Size Absolute $ Opportunity Analysis and Forecast, By Form, 2016-2032
- 3.4.3. Solid
- 3.4.4. Liquid
- 3.5. Global Eubiotics Market Analysis, Opportunity and Forecast, By Livestock, 2016-2032
- 3.5.1. Global Eubiotics Market Analysis by Livestock: Introduction
- 3.5.2. Market Size Absolute $ Opportunity Analysis and Forecast, By Livestock, 2016-2032
- 3.5.3. Poultry
- 3.5.4. Cattle
- 3.5.5. Swine
- 3.5.6. Aquatic
- 3.5.7. Other Livestock
- 3.6. Global Eubiotics Market Analysis, Opportunity and Forecast, By Function, 2016-2032
- 3.6.1. Global Eubiotics Market Analysis by Function: Introduction
- 3.6.2. Market Size Absolute $ Opportunity Analysis and Forecast, By Function, 2016-2032
- 3.6.3. Nutrition & Gut Health
- 3.6.4. Immunity
- 3.6.5. Yield
- 3.6.6. Other Functions
- 4. North America Eubiotics Market Analysis, Opportunity and Forecast, 2016-2032
- 4.1. North America Eubiotics Market Analysis, 2016-2021
- 4.2. North America Eubiotics Market Opportunity and Forecast, 2023-2032
- 4.3. North America Eubiotics Market Analysis, Opportunity and Forecast, By Product Type, 2016-2032
- 4.3.1. North America Eubiotics Market Analysis by Product Type: Introduction
- 4.3.2. Market Size Absolute $ Opportunity Analysis and Forecast, By Product Type, 2016-2032
- 4.3.3. Probiotics
- 4.3.4. Prebiotics
- 4.3.5. Organic Acids
- 4.3.6. Essential Oils
- 4.3.7. Other Product Types
- 4.4. North America Eubiotics Market Analysis, Opportunity and Forecast, By Form, 2016-2032
- 4.4.1. North America Eubiotics Market Analysis by Form: Introduction
- 4.4.2. Market Size Absolute $ Opportunity Analysis and Forecast, By Form, 2016-2032
- 4.4.3. Solid
- 4.4.4. Liquid
- 4.5. North America Eubiotics Market Analysis, Opportunity and Forecast, By Livestock, 2016-2032
- 4.5.1. North America Eubiotics Market Analysis by Livestock: Introduction
- 4.5.2. Market Size Absolute $ Opportunity Analysis and Forecast, By Livestock, 2016-2032
- 4.5.3. Poultry
- 4.5.4. Cattle
- 4.5.5. Swine
- 4.5.6. Aquatic
- 4.5.7. Other Livestock
- 4.6. North America Eubiotics Market Analysis, Opportunity and Forecast, By Function, 2016-2032
- 4.6.1. North America Eubiotics Market Analysis by Function: Introduction
- 4.6.2. Market Size Absolute $ Opportunity Analysis and Forecast, By Function, 2016-2032
- 4.6.3. Nutrition & Gut Health
- 4.6.4. Immunity
- 4.6.5. Yield
- 4.6.6. Other Functions
- 4.7. North America Eubiotics Market Analysis, Opportunity and Forecast, By Country , 2016-2032
- 4.7.1. North America Eubiotics Market Analysis by Country : Introduction
- 4.7.2. Market Size Absolute $ Opportunity Analysis and Forecast, Country , 2016-2032
- 4.7.2.1. The US
- 4.7.2.2. Canada
- 4.7.2.3. Mexico
- 5. Western Europe Eubiotics Market Analysis, Opportunity and Forecast, 2016-2032
- 5.1. Western Europe Eubiotics Market Analysis, 2016-2021
- 5.2. Western Europe Eubiotics Market Opportunity and Forecast, 2023-2032
- 5.3. Western Europe Eubiotics Market Analysis, Opportunity and Forecast, By Product Type, 2016-2032
- 5.3.1. Western Europe Eubiotics Market Analysis by Product Type: Introduction
- 5.3.2. Market Size Absolute $ Opportunity Analysis and Forecast, By Product Type, 2016-2032
- 5.3.3. Probiotics
- 5.3.4. Prebiotics
- 5.3.5. Organic Acids
- 5.3.6. Essential Oils
- 5.3.7. Other Product Types
- 5.4. Western Europe Eubiotics Market Analysis, Opportunity and Forecast, By Form, 2016-2032
- 5.4.1. Western Europe Eubiotics Market Analysis by Form: Introduction
- 5.4.2. Market Size Absolute $ Opportunity Analysis and Forecast, By Form, 2016-2032
- 5.4.3. Solid
- 5.4.4. Liquid
- 5.5. Western Europe Eubiotics Market Analysis, Opportunity and Forecast, By Livestock, 2016-2032
- 5.5.1. Western Europe Eubiotics Market Analysis by Livestock: Introduction
- 5.5.2. Market Size Absolute $ Opportunity Analysis and Forecast, By Livestock, 2016-2032
- 5.5.3. Poultry
- 5.5.4. Cattle
- 5.5.5. Swine
- 5.5.6. Aquatic
- 5.5.7. Other Livestock
- 5.6. Western Europe Eubiotics Market Analysis, Opportunity and Forecast, By Function, 2016-2032
- 5.6.1. Western Europe Eubiotics Market Analysis by Function: Introduction
- 5.6.2. Market Size Absolute $ Opportunity Analysis and Forecast, By Function, 2016-2032
- 5.6.3. Nutrition & Gut Health
- 5.6.4. Immunity
- 5.6.5. Yield
- 5.6.6. Other Functions
- 5.7. Western Europe Eubiotics Market Analysis, Opportunity and Forecast, By Country , 2016-2032
- 5.7.1. Western Europe Eubiotics Market Analysis by Country : Introduction
- 5.7.2. Market Size Absolute $ Opportunity Analysis and Forecast, Country , 2016-2032
- 5.7.2.1. Germany
- 5.7.2.2. France
- 5.7.2.3. The UK
- 5.7.2.4. Spain
- 5.7.2.5. Italy
- 5.7.2.6. Portugal
- 5.7.2.7. Ireland
- 5.7.2.8. Austria
- 5.7.2.9. Switzerland
- 5.7.2.10. Benelux
- 5.7.2.11. Nordic
- 5.7.2.12. Rest of Western Europe
- 6. Eastern Europe Eubiotics Market Analysis, Opportunity and Forecast, 2016-2032
- 6.1. Eastern Europe Eubiotics Market Analysis, 2016-2021
- 6.2. Eastern Europe Eubiotics Market Opportunity and Forecast, 2023-2032
- 6.3. Eastern Europe Eubiotics Market Analysis, Opportunity and Forecast, By Product Type, 2016-2032
- 6.3.1. Eastern Europe Eubiotics Market Analysis by Product Type: Introduction
- 6.3.2. Market Size Absolute $ Opportunity Analysis and Forecast, By Product Type, 2016-2032
- 6.3.3. Probiotics
- 6.3.4. Prebiotics
- 6.3.5. Organic Acids
- 6.3.6. Essential Oils
- 6.3.7. Other Product Types
- 6.4. Eastern Europe Eubiotics Market Analysis, Opportunity and Forecast, By Form, 2016-2032
- 6.4.1. Eastern Europe Eubiotics Market Analysis by Form: Introduction
- 6.4.2. Market Size Absolute $ Opportunity Analysis and Forecast, By Form, 2016-2032
- 6.4.3. Solid
- 6.4.4. Liquid
- 6.5. Eastern Europe Eubiotics Market Analysis, Opportunity and Forecast, By Livestock, 2016-2032
- 6.5.1. Eastern Europe Eubiotics Market Analysis by Livestock: Introduction
- 6.5.2. Market Size Absolute $ Opportunity Analysis and Forecast, By Livestock, 2016-2032
- 6.5.3. Poultry
- 6.5.4. Cattle
- 6.5.5. Swine
- 6.5.6. Aquatic
- 6.5.7. Other Livestock
- 6.6. Eastern Europe Eubiotics Market Analysis, Opportunity and Forecast, By Function, 2016-2032
- 6.6.1. Eastern Europe Eubiotics Market Analysis by Function: Introduction
- 6.6.2. Market Size Absolute $ Opportunity Analysis and Forecast, By Function, 2016-2032
- 6.6.3. Nutrition & Gut Health
- 6.6.4. Immunity
- 6.6.5. Yield
- 6.6.6. Other Functions
- 6.7. Eastern Europe Eubiotics Market Analysis, Opportunity and Forecast, By Country , 2016-2032
- 6.7.1. Eastern Europe Eubiotics Market Analysis by Country : Introduction
- 6.7.2. Market Size Absolute $ Opportunity Analysis and Forecast, Country , 2016-2032
- 6.7.2.1. Russia
- 6.7.2.2. Poland
- 6.7.2.3. The Czech Republic
- 6.7.2.4. Greece
- 6.7.2.5. Rest of Eastern Europe
- 7. APAC Eubiotics Market Analysis, Opportunity and Forecast, 2016-2032
- 7.1. APAC Eubiotics Market Analysis, 2016-2021
- 7.2. APAC Eubiotics Market Opportunity and Forecast, 2023-2032
- 7.3. APAC Eubiotics Market Analysis, Opportunity and Forecast, By Product Type, 2016-2032
- 7.3.1. APAC Eubiotics Market Analysis by Product Type: Introduction
- 7.3.2. Market Size Absolute $ Opportunity Analysis and Forecast, By Product Type, 2016-2032
- 7.3.3. Probiotics
- 7.3.4. Prebiotics
- 7.3.5. Organic Acids
- 7.3.6. Essential Oils
- 7.3.7. Other Product Types
- 7.4. APAC Eubiotics Market Analysis, Opportunity and Forecast, By Form, 2016-2032
- 7.4.1. APAC Eubiotics Market Analysis by Form: Introduction
- 7.4.2. Market Size Absolute $ Opportunity Analysis and Forecast, By Form, 2016-2032
- 7.4.3. Solid
- 7.4.4. Liquid
- 7.5. APAC Eubiotics Market Analysis, Opportunity and Forecast, By Livestock, 2016-2032
- 7.5.1. APAC Eubiotics Market Analysis by Livestock: Introduction
- 7.5.2. Market Size Absolute $ Opportunity Analysis and Forecast, By Livestock, 2016-2032
- 7.5.3. Poultry
- 7.5.4. Cattle
- 7.5.5. Swine
- 7.5.6. Aquatic
- 7.5.7. Other Livestock
- 7.6. APAC Eubiotics Market Analysis, Opportunity and Forecast, By Function, 2016-2032
- 7.6.1. APAC Eubiotics Market Analysis by Function: Introduction
- 7.6.2. Market Size Absolute $ Opportunity Analysis and Forecast, By Function, 2016-2032
- 7.6.3. Nutrition & Gut Health
- 7.6.4. Immunity
- 7.6.5. Yield
- 7.6.6. Other Functions
- 7.7. APAC Eubiotics Market Analysis, Opportunity and Forecast, By Country , 2016-2032
- 7.7.1. APAC Eubiotics Market Analysis by Country : Introduction
- 7.7.2. Market Size Absolute $ Opportunity Analysis and Forecast, Country , 2016-2032
- 7.7.2.1. China
- 7.7.2.2. Japan
- 7.7.2.3. South Korea
- 7.7.2.4. India
- 7.7.2.5. Australia & New Zeland
- 7.7.2.6. Indonesia
- 7.7.2.7. Malaysia
- 7.7.2.8. Philippines
- 7.7.2.9. Singapore
- 7.7.2.10. Thailand
- 7.7.2.11. Vietnam
- 7.7.2.12. Rest of APAC
- 8. Latin America Eubiotics Market Analysis, Opportunity and Forecast, 2016-2032
- 8.1. Latin America Eubiotics Market Analysis, 2016-2021
- 8.2. Latin America Eubiotics Market Opportunity and Forecast, 2023-2032
- 8.3. Latin America Eubiotics Market Analysis, Opportunity and Forecast, By Product Type, 2016-2032
- 8.3.1. Latin America Eubiotics Market Analysis by Product Type: Introduction
- 8.3.2. Market Size Absolute $ Opportunity Analysis and Forecast, By Product Type, 2016-2032
- 8.3.3. Probiotics
- 8.3.4. Prebiotics
- 8.3.5. Organic Acids
- 8.3.6. Essential Oils
- 8.3.7. Other Product Types
- 8.4. Latin America Eubiotics Market Analysis, Opportunity and Forecast, By Form, 2016-2032
- 8.4.1. Latin America Eubiotics Market Analysis by Form: Introduction
- 8.4.2. Market Size Absolute $ Opportunity Analysis and Forecast, By Form, 2016-2032
- 8.4.3. Solid
- 8.4.4. Liquid
- 8.5. Latin America Eubiotics Market Analysis, Opportunity and Forecast, By Livestock, 2016-2032
- 8.5.1. Latin America Eubiotics Market Analysis by Livestock: Introduction
- 8.5.2. Market Size Absolute $ Opportunity Analysis and Forecast, By Livestock, 2016-2032
- 8.5.3. Poultry
- 8.5.4. Cattle
- 8.5.5. Swine
- 8.5.6. Aquatic
- 8.5.7. Other Livestock
- 8.6. Latin America Eubiotics Market Analysis, Opportunity and Forecast, By Function, 2016-2032
- 8.6.1. Latin America Eubiotics Market Analysis by Function: Introduction
- 8.6.2. Market Size Absolute $ Opportunity Analysis and Forecast, By Function, 2016-2032
- 8.6.3. Nutrition & Gut Health
- 8.6.4. Immunity
- 8.6.5. Yield
- 8.6.6. Other Functions
- 8.7. Latin America Eubiotics Market Analysis, Opportunity and Forecast, By Country , 2016-2032
- 8.7.1. Latin America Eubiotics Market Analysis by Country : Introduction
- 8.7.2. Market Size Absolute $ Opportunity Analysis and Forecast, Country , 2016-2032
- 8.7.2.1. Brazil
- 8.7.2.2. Colombia
- 8.7.2.3. Chile
- 8.7.2.4. Argentina
- 8.7.2.5. Costa Rica
- 8.7.2.6. Rest of Latin America
- 9. Middle East & Africa Eubiotics Market Analysis, Opportunity and Forecast, 2016-2032
- 9.1. Middle East & Africa Eubiotics Market Analysis, 2016-2021
- 9.2. Middle East & Africa Eubiotics Market Opportunity and Forecast, 2023-2032
- 9.3. Middle East & Africa Eubiotics Market Analysis, Opportunity and Forecast, By Product Type, 2016-2032
- 9.3.1. Middle East & Africa Eubiotics Market Analysis by Product Type: Introduction
- 9.3.2. Market Size Absolute $ Opportunity Analysis and Forecast, By Product Type, 2016-2032
- 9.3.3. Probiotics
- 9.3.4. Prebiotics
- 9.3.5. Organic Acids
- 9.3.6. Essential Oils
- 9.3.7. Other Product Types
- 9.4. Middle East & Africa Eubiotics Market Analysis, Opportunity and Forecast, By Form, 2016-2032
- 9.4.1. Middle East & Africa Eubiotics Market Analysis by Form: Introduction
- 9.4.2. Market Size Absolute $ Opportunity Analysis and Forecast, By Form, 2016-2032
- 9.4.3. Solid
- 9.4.4. Liquid
- 9.5. Middle East & Africa Eubiotics Market Analysis, Opportunity and Forecast, By Livestock, 2016-2032
- 9.5.1. Middle East & Africa Eubiotics Market Analysis by Livestock: Introduction
- 9.5.2. Market Size Absolute $ Opportunity Analysis and Forecast, By Livestock, 2016-2032
- 9.5.3. Poultry
- 9.5.4. Cattle
- 9.5.5. Swine
- 9.5.6. Aquatic
- 9.5.7. Other Livestock
- 9.6. Middle East & Africa Eubiotics Market Analysis, Opportunity and Forecast, By Function, 2016-2032
- 9.6.1. Middle East & Africa Eubiotics Market Analysis by Function: Introduction
- 9.6.2. Market Size Absolute $ Opportunity Analysis and Forecast, By Function, 2016-2032
- 9.6.3. Nutrition & Gut Health
- 9.6.4. Immunity
- 9.6.5. Yield
- 9.6.6. Other Functions
- 9.7. Middle East & Africa Eubiotics Market Analysis, Opportunity and Forecast, By Country , 2016-2032
- 9.7.1. Middle East & Africa Eubiotics Market Analysis by Country : Introduction
- 9.7.2. Market Size Absolute $ Opportunity Analysis and Forecast, Country , 2016-2032
- 9.7.2.1. Algeria
- 9.7.2.2. Egypt
- 9.7.2.3. Israel
- 9.7.2.4. Kuwait
- 9.7.2.5. Nigeria
- 9.7.2.6. Saudi Arabia
- 9.7.2.7. South Africa
- 9.7.2.8. Turkey
- 9.7.2.9. The UAE
- 9.7.2.10. Rest of MEA
- 10. Global Eubiotics Market Analysis, Opportunity and Forecast, By Region , 2016-2032
- 10.1. Global Eubiotics Market Analysis by Region : Introduction
- 10.2. Market Size Absolute $ Opportunity Analysis and Forecast, By Region , 2016-2032
- 10.2.1. North America
- 10.2.2. Western Europe
- 10.2.3. Eastern Europe
- 10.2.4. APAC
- 10.2.5. Latin America
- 10.2.6. Middle East & Africa
- 11. Global Eubiotics Market Competitive Landscape, Market Share Analysis, and Company Profiles
- 11.1. Market Share Analysis
- 11.2. Company Profiles
- 11.3. Cargill Incorporated
- 11.3.1. Company Overview
- 11.3.2. Financial Highlights
- 11.3.3. Product Portfolio
- 11.3.4. SWOT Analysis
- 11.3.5. Key Strategies and Developments
- 11.4. DSM
- 11.4.1. Company Overview
- 11.4.2. Financial Highlights
- 11.4.3. Product Portfolio
- 11.4.4. SWOT Analysis
- 11.4.5. Key Strategies and Developments
- 11.5. DuPont de Nemours, Inc.
- 11.5.1. Company Overview
- 11.5.2. Financial Highlights
- 11.5.3. Product Portfolio
- 11.5.4. SWOT Analysis
- 11.5.5. Key Strategies and Developments
- 11.6. Associated British Foods plc
- 11.6.1. Company Overview
- 11.6.2. Financial Highlights
- 11.6.3. Product Portfolio
- 11.6.4. SWOT Analysis
- 11.6.5. Key Strategies and Developments
- 11.7. BASF SE
- 11.7.1. Company Overview
- 11.7.2. Financial Highlights
- 11.7.3. Product Portfolio
- 11.7.4. SWOT Analysis
- 11.7.5. Key Strategies and Developments
- 11.8. Novozymes
- 11.8.1. Company Overview
- 11.8.2. Financial Highlights
- 11.8.3. Product Portfolio
- 11.8.4. SWOT Analysis
- 11.8.5. Key Strategies and Developments
- 11.9. UAS Laboratories
- 11.9.1. Company Overview
- 11.9.2. Financial Highlights
- 11.9.3. Product Portfolio
- 11.9.4. SWOT Analysis
- 11.9.5. Key Strategies and Developments
- 11.10. Kemin Industries, Inc.
- 11.10.1. Company Overview
- 11.10.2. Financial Highlights
- 11.10.3. Product Portfolio
- 11.10.4. SWOT Analysis
- 11.10.5. Key Strategies and Developments
- 11.11. Advanced BioNutrition Corp
- 11.11.1. Company Overview
- 11.11.2. Financial Highlights
- 11.11.3. Product Portfolio
- 11.11.4. SWOT Analysis
- 11.11.5. Key Strategies and Developments
- 11.12. Lesaffre Group
- 11.12.1. Company Overview
- 11.12.2. Financial Highlights
- 11.12.3. Product Portfolio
- 11.12.4. SWOT Analysis
- 11.12.5. Key Strategies and Developments
- 11.13. Calpis Co., Ltd.
- 11.13.1. Company Overview
- 11.13.2. Financial Highlights
- 11.13.3. Product Portfolio
- 11.13.4. SWOT Analysis
- 11.13.5. Key Strategies and Developments
- 11.14. Other Key Players
- 11.14.1. Company Overview
- 11.14.2. Financial Highlights
- 11.14.3. Product Portfolio
- 11.14.4. SWOT Analysis
- 11.14.5. Key Strategies and Developments
- 12. Assumptions and Acronyms
- 13. Research Methodology
- 14. Contact
- List of Figures
- Figure 1: Global Eubiotics Market Revenue (US$ Mn) Market Share by Product Type in 2022
- Figure 2: Global Eubiotics Market Attractiveness Analysis by Product Type, 2016-2032
- Figure 3: Global Eubiotics Market Revenue (US$ Mn) Market Share by Formin 2022
- Figure 4: Global Eubiotics Market Attractiveness Analysis by Form, 2016-2032
- Figure 5: Global Eubiotics Market Revenue (US$ Mn) Market Share by Livestockin 2022
- Figure 6: Global Eubiotics Market Attractiveness Analysis by Livestock, 2016-2032
- Figure 7: Global Eubiotics Market Revenue (US$ Mn) Market Share by Functionin 2022
- Figure 8: Global Eubiotics Market Attractiveness Analysis by Function, 2016-2032
- Figure 9: Global Eubiotics Market Revenue (US$ Mn) Market Share by Region in 2022
- Figure 10: Global Eubiotics Market Attractiveness Analysis by Region, 2016-2032
- Figure 11: Global Eubiotics Market Revenue (US$ Mn) (2016-2032)
- Figure 12: Global Eubiotics Market Revenue (US$ Mn) Comparison by Region (2016-2032)
- Figure 13: Global Eubiotics Market Revenue (US$ Mn) Comparison by Product Type (2016-2032)
- Figure 14: Global Eubiotics Market Revenue (US$ Mn) Comparison by Form (2016-2032)
- Figure 15: Global Eubiotics Market Revenue (US$ Mn) Comparison by Livestock (2016-2032)
- Figure 16: Global Eubiotics Market Revenue (US$ Mn) Comparison by Function (2016-2032)
- Figure 17: Global Eubiotics Market Y-o-Y Growth Rate Comparison by Region (2016-2032)
- Figure 18: Global Eubiotics Market Y-o-Y Growth Rate Comparison by Product Type (2016-2032)
- Figure 19: Global Eubiotics Market Y-o-Y Growth Rate Comparison by Form (2016-2032)
- Figure 20: Global Eubiotics Market Y-o-Y Growth Rate Comparison by Livestock (2016-2032)
- Figure 21: Global Eubiotics Market Y-o-Y Growth Rate Comparison by Function (2016-2032)
- Figure 22: Global Eubiotics Market Share Comparison by Region (2016-2032)
- Figure 23: Global Eubiotics Market Share Comparison by Product Type (2016-2032)
- Figure 24: Global Eubiotics Market Share Comparison by Form (2016-2032)
- Figure 25: Global Eubiotics Market Share Comparison by Livestock (2016-2032)
- Figure 26: Global Eubiotics Market Share Comparison by Function (2016-2032)
- Figure 27: North America Eubiotics Market Revenue (US$ Mn) Market Share by Product Typein 2022
- Figure 28: North America Eubiotics Market Attractiveness Analysis by Product Type, 2016-2032
- Figure 29: North America Eubiotics Market Revenue (US$ Mn) Market Share by Formin 2022
- Figure 30: North America Eubiotics Market Attractiveness Analysis by Form, 2016-2032
- Figure 31: North America Eubiotics Market Revenue (US$ Mn) Market Share by Livestockin 2022
- Figure 32: North America Eubiotics Market Attractiveness Analysis by Livestock, 2016-2032
- Figure 33: North America Eubiotics Market Revenue (US$ Mn) Market Share by Functionin 2022
- Figure 34: North America Eubiotics Market Attractiveness Analysis by Function, 2016-2032
- Figure 35: North America Eubiotics Market Revenue (US$ Mn) Market Share by Country in 2022
- Figure 36: North America Eubiotics Market Attractiveness Analysis by Country, 2016-2032
- Figure 37: North America Eubiotics Market Revenue (US$ Mn) (2016-2032)
- Figure 38: North America Eubiotics Market Revenue (US$ Mn) Comparison by Country (2016-2032)
- Figure 39: North America Eubiotics Market Revenue (US$ Mn) Comparison by Product Type (2016-2032)
- Figure 40: North America Eubiotics Market Revenue (US$ Mn) Comparison by Form (2016-2032)
- Figure 41: North America Eubiotics Market Revenue (US$ Mn) Comparison by Livestock (2016-2032)
- Figure 42: North America Eubiotics Market Revenue (US$ Mn) Comparison by Function (2016-2032)
- Figure 43: North America Eubiotics Market Y-o-Y Growth Rate Comparison by Country (2016-2032)
- Figure 44: North America Eubiotics Market Y-o-Y Growth Rate Comparison by Product Type (2016-2032)
- Figure 45: North America Eubiotics Market Y-o-Y Growth Rate Comparison by Form (2016-2032)
- Figure 46: North America Eubiotics Market Y-o-Y Growth Rate Comparison by Livestock (2016-2032)
- Figure 47: North America Eubiotics Market Y-o-Y Growth Rate Comparison by Function (2016-2032)
- Figure 48: North America Eubiotics Market Share Comparison by Country (2016-2032)
- Figure 49: North America Eubiotics Market Share Comparison by Product Type (2016-2032)
- Figure 50: North America Eubiotics Market Share Comparison by Form (2016-2032)
- Figure 51: North America Eubiotics Market Share Comparison by Livestock (2016-2032)
- Figure 52: North America Eubiotics Market Share Comparison by Function (2016-2032)
- Figure 53: Western Europe Eubiotics Market Revenue (US$ Mn) Market Share by Product Typein 2022
- Figure 54: Western Europe Eubiotics Market Attractiveness Analysis by Product Type, 2016-2032
- Figure 55: Western Europe Eubiotics Market Revenue (US$ Mn) Market Share by Formin 2022
- Figure 56: Western Europe Eubiotics Market Attractiveness Analysis by Form, 2016-2032
- Figure 57: Western Europe Eubiotics Market Revenue (US$ Mn) Market Share by Livestockin 2022
- Figure 58: Western Europe Eubiotics Market Attractiveness Analysis by Livestock, 2016-2032
- Figure 59: Western Europe Eubiotics Market Revenue (US$ Mn) Market Share by Functionin 2022
- Figure 60: Western Europe Eubiotics Market Attractiveness Analysis by Function, 2016-2032
- Figure 61: Western Europe Eubiotics Market Revenue (US$ Mn) Market Share by Country in 2022
- Figure 62: Western Europe Eubiotics Market Attractiveness Analysis by Country, 2016-2032
- Figure 63: Western Europe Eubiotics Market Revenue (US$ Mn) (2016-2032)
- Figure 64: Western Europe Eubiotics Market Revenue (US$ Mn) Comparison by Country (2016-2032)
- Figure 65: Western Europe Eubiotics Market Revenue (US$ Mn) Comparison by Product Type (2016-2032)
- Figure 66: Western Europe Eubiotics Market Revenue (US$ Mn) Comparison by Form (2016-2032)
- Figure 67: Western Europe Eubiotics Market Revenue (US$ Mn) Comparison by Livestock (2016-2032)
- Figure 68: Western Europe Eubiotics Market Revenue (US$ Mn) Comparison by Function (2016-2032)
- Figure 69: Western Europe Eubiotics Market Y-o-Y Growth Rate Comparison by Country (2016-2032)
- Figure 70: Western Europe Eubiotics Market Y-o-Y Growth Rate Comparison by Product Type (2016-2032)
- Figure 71: Western Europe Eubiotics Market Y-o-Y Growth Rate Comparison by Form (2016-2032)
- Figure 72: Western Europe Eubiotics Market Y-o-Y Growth Rate Comparison by Livestock (2016-2032)
- Figure 73: Western Europe Eubiotics Market Y-o-Y Growth Rate Comparison by Function (2016-2032)
- Figure 74: Western Europe Eubiotics Market Share Comparison by Country (2016-2032)
- Figure 75: Western Europe Eubiotics Market Share Comparison by Product Type (2016-2032)
- Figure 76: Western Europe Eubiotics Market Share Comparison by Form (2016-2032)
- Figure 77: Western Europe Eubiotics Market Share Comparison by Livestock (2016-2032)
- Figure 78: Western Europe Eubiotics Market Share Comparison by Function (2016-2032)
- Figure 79: Eastern Europe Eubiotics Market Revenue (US$ Mn) Market Share by Product Typein 2022
- Figure 80: Eastern Europe Eubiotics Market Attractiveness Analysis by Product Type, 2016-2032
- Figure 81: Eastern Europe Eubiotics Market Revenue (US$ Mn) Market Share by Formin 2022
- Figure 82: Eastern Europe Eubiotics Market Attractiveness Analysis by Form, 2016-2032
- Figure 83: Eastern Europe Eubiotics Market Revenue (US$ Mn) Market Share by Livestockin 2022
- Figure 84: Eastern Europe Eubiotics Market Attractiveness Analysis by Livestock, 2016-2032
- Figure 85: Eastern Europe Eubiotics Market Revenue (US$ Mn) Market Share by Functionin 2022
- Figure 86: Eastern Europe Eubiotics Market Attractiveness Analysis by Function, 2016-2032
- Figure 87: Eastern Europe Eubiotics Market Revenue (US$ Mn) Market Share by Country in 2022
- Figure 88: Eastern Europe Eubiotics Market Attractiveness Analysis by Country, 2016-2032
- Figure 89: Eastern Europe Eubiotics Market Revenue (US$ Mn) (2016-2032)
- Figure 90: Eastern Europe Eubiotics Market Revenue (US$ Mn) Comparison by Country (2016-2032)
- Figure 91: Eastern Europe Eubiotics Market Revenue (US$ Mn) Comparison by Product Type (2016-2032)
- Figure 92: Eastern Europe Eubiotics Market Revenue (US$ Mn) Comparison by Form (2016-2032)
- Figure 93: Eastern Europe Eubiotics Market Revenue (US$ Mn) Comparison by Livestock (2016-2032)
- Figure 94: Eastern Europe Eubiotics Market Revenue (US$ Mn) Comparison by Function (2016-2032)
- Figure 95: Eastern Europe Eubiotics Market Y-o-Y Growth Rate Comparison by Country (2016-2032)
- Figure 96: Eastern Europe Eubiotics Market Y-o-Y Growth Rate Comparison by Product Type (2016-2032)
- Figure 97: Eastern Europe Eubiotics Market Y-o-Y Growth Rate Comparison by Form (2016-2032)
- Figure 98: Eastern Europe Eubiotics Market Y-o-Y Growth Rate Comparison by Livestock (2016-2032)
- Figure 99: Eastern Europe Eubiotics Market Y-o-Y Growth Rate Comparison by Function (2016-2032)
- Figure 100: Eastern Europe Eubiotics Market Share Comparison by Country (2016-2032)
- Figure 101: Eastern Europe Eubiotics Market Share Comparison by Product Type (2016-2032)
- Figure 102: Eastern Europe Eubiotics Market Share Comparison by Form (2016-2032)
- Figure 103: Eastern Europe Eubiotics Market Share Comparison by Livestock (2016-2032)
- Figure 104: Eastern Europe Eubiotics Market Share Comparison by Function (2016-2032)
- Figure 105: APAC Eubiotics Market Revenue (US$ Mn) Market Share by Product Typein 2022
- Figure 106: APAC Eubiotics Market Attractiveness Analysis by Product Type, 2016-2032
- Figure 107: APAC Eubiotics Market Revenue (US$ Mn) Market Share by Formin 2022
- Figure 108: APAC Eubiotics Market Attractiveness Analysis by Form, 2016-2032
- Figure 109: APAC Eubiotics Market Revenue (US$ Mn) Market Share by Livestockin 2022
- Figure 110: APAC Eubiotics Market Attractiveness Analysis by Livestock, 2016-2032
- Figure 111: APAC Eubiotics Market Revenue (US$ Mn) Market Share by Functionin 2022
- Figure 112: APAC Eubiotics Market Attractiveness Analysis by Function, 2016-2032
- Figure 113: APAC Eubiotics Market Revenue (US$ Mn) Market Share by Country in 2022
- Figure 114: APAC Eubiotics Market Attractiveness Analysis by Country, 2016-2032
- Figure 115: APAC Eubiotics Market Revenue (US$ Mn) (2016-2032)
- Figure 116: APAC Eubiotics Market Revenue (US$ Mn) Comparison by Country (2016-2032)
- Figure 117: APAC Eubiotics Market Revenue (US$ Mn) Comparison by Product Type (2016-2032)
- Figure 118: APAC Eubiotics Market Revenue (US$ Mn) Comparison by Form (2016-2032)
- Figure 119: APAC Eubiotics Market Revenue (US$ Mn) Comparison by Livestock (2016-2032)
- Figure 120: APAC Eubiotics Market Revenue (US$ Mn) Comparison by Function (2016-2032)
- Figure 121: APAC Eubiotics Market Y-o-Y Growth Rate Comparison by Country (2016-2032)
- Figure 122: APAC Eubiotics Market Y-o-Y Growth Rate Comparison by Product Type (2016-2032)
- Figure 123: APAC Eubiotics Market Y-o-Y Growth Rate Comparison by Form (2016-2032)
- Figure 124: APAC Eubiotics Market Y-o-Y Growth Rate Comparison by Livestock (2016-2032)
- Figure 125: APAC Eubiotics Market Y-o-Y Growth Rate Comparison by Function (2016-2032)
- Figure 126: APAC Eubiotics Market Share Comparison by Country (2016-2032)
- Figure 127: APAC Eubiotics Market Share Comparison by Product Type (2016-2032)
- Figure 128: APAC Eubiotics Market Share Comparison by Form (2016-2032)
- Figure 129: APAC Eubiotics Market Share Comparison by Livestock (2016-2032)
- Figure 130: APAC Eubiotics Market Share Comparison by Function (2016-2032)
- Figure 131: Latin America Eubiotics Market Revenue (US$ Mn) Market Share by Product Typein 2022
- Figure 132: Latin America Eubiotics Market Attractiveness Analysis by Product Type, 2016-2032
- Figure 133: Latin America Eubiotics Market Revenue (US$ Mn) Market Share by Formin 2022
- Figure 134: Latin America Eubiotics Market Attractiveness Analysis by Form, 2016-2032
- Figure 135: Latin America Eubiotics Market Revenue (US$ Mn) Market Share by Livestockin 2022
- Figure 136: Latin America Eubiotics Market Attractiveness Analysis by Livestock, 2016-2032
- Figure 137: Latin America Eubiotics Market Revenue (US$ Mn) Market Share by Functionin 2022
- Figure 138: Latin America Eubiotics Market Attractiveness Analysis by Function, 2016-2032
- Figure 139: Latin America Eubiotics Market Revenue (US$ Mn) Market Share by Country in 2022
- Figure 140: Latin America Eubiotics Market Attractiveness Analysis by Country, 2016-2032
- Figure 141: Latin America Eubiotics Market Revenue (US$ Mn) (2016-2032)
- Figure 142: Latin America Eubiotics Market Revenue (US$ Mn) Comparison by Country (2016-2032)
- Figure 143: Latin America Eubiotics Market Revenue (US$ Mn) Comparison by Product Type (2016-2032)
- Figure 144: Latin America Eubiotics Market Revenue (US$ Mn) Comparison by Form (2016-2032)
- Figure 145: Latin America Eubiotics Market Revenue (US$ Mn) Comparison by Livestock (2016-2032)
- Figure 146: Latin America Eubiotics Market Revenue (US$ Mn) Comparison by Function (2016-2032)
- Figure 147: Latin America Eubiotics Market Y-o-Y Growth Rate Comparison by Country (2016-2032)
- Figure 148: Latin America Eubiotics Market Y-o-Y Growth Rate Comparison by Product Type (2016-2032)
- Figure 149: Latin America Eubiotics Market Y-o-Y Growth Rate Comparison by Form (2016-2032)
- Figure 150: Latin America Eubiotics Market Y-o-Y Growth Rate Comparison by Livestock (2016-2032)
- Figure 151: Latin America Eubiotics Market Y-o-Y Growth Rate Comparison by Function (2016-2032)
- Figure 152: Latin America Eubiotics Market Share Comparison by Country (2016-2032)
- Figure 153: Latin America Eubiotics Market Share Comparison by Product Type (2016-2032)
- Figure 154: Latin America Eubiotics Market Share Comparison by Form (2016-2032)
- Figure 155: Latin America Eubiotics Market Share Comparison by Livestock (2016-2032)
- Figure 156: Latin America Eubiotics Market Share Comparison by Function (2016-2032)
- Figure 157: Middle East & Africa Eubiotics Market Revenue (US$ Mn) Market Share by Product Typein 2022
- Figure 158: Middle East & Africa Eubiotics Market Attractiveness Analysis by Product Type, 2016-2032
- Figure 159: Middle East & Africa Eubiotics Market Revenue (US$ Mn) Market Share by Formin 2022
- Figure 160: Middle East & Africa Eubiotics Market Attractiveness Analysis by Form, 2016-2032
- Figure 161: Middle East & Africa Eubiotics Market Revenue (US$ Mn) Market Share by Livestockin 2022
- Figure 162: Middle East & Africa Eubiotics Market Attractiveness Analysis by Livestock, 2016-2032
- Figure 163: Middle East & Africa Eubiotics Market Revenue (US$ Mn) Market Share by Functionin 2022
- Figure 164: Middle East & Africa Eubiotics Market Attractiveness Analysis by Function, 2016-2032
- Figure 165: Middle East & Africa Eubiotics Market Revenue (US$ Mn) Market Share by Country in 2022
- Figure 166: Middle East & Africa Eubiotics Market Attractiveness Analysis by Country, 2016-2032
- Figure 167: Middle East & Africa Eubiotics Market Revenue (US$ Mn) (2016-2032)
- Figure 168: Middle East & Africa Eubiotics Market Revenue (US$ Mn) Comparison by Country (2016-2032)
- Figure 169: Middle East & Africa Eubiotics Market Revenue (US$ Mn) Comparison by Product Type (2016-2032)
- Figure 170: Middle East & Africa Eubiotics Market Revenue (US$ Mn) Comparison by Form (2016-2032)
- Figure 171: Middle East & Africa Eubiotics Market Revenue (US$ Mn) Comparison by Livestock (2016-2032)
- Figure 172: Middle East & Africa Eubiotics Market Revenue (US$ Mn) Comparison by Function (2016-2032)
- Figure 173: Middle East & Africa Eubiotics Market Y-o-Y Growth Rate Comparison by Country (2016-2032)
- Figure 174: Middle East & Africa Eubiotics Market Y-o-Y Growth Rate Comparison by Product Type (2016-2032)
- Figure 175: Middle East & Africa Eubiotics Market Y-o-Y Growth Rate Comparison by Form (2016-2032)
- Figure 176: Middle East & Africa Eubiotics Market Y-o-Y Growth Rate Comparison by Livestock (2016-2032)
- Figure 177: Middle East & Africa Eubiotics Market Y-o-Y Growth Rate Comparison by Function (2016-2032)
- Figure 178: Middle East & Africa Eubiotics Market Share Comparison by Country (2016-2032)
- Figure 179: Middle East & Africa Eubiotics Market Share Comparison by Product Type (2016-2032)
- Figure 180: Middle East & Africa Eubiotics Market Share Comparison by Form (2016-2032)
- Figure 181: Middle East & Africa Eubiotics Market Share Comparison by Livestock (2016-2032)
- Figure 182: Middle East & Africa Eubiotics Market Share Comparison by Function (2016-2032)
- List of Tables
- Table 1: Global Eubiotics Market Comparison by Product Type (2016-2032)
- Table 2: Global Eubiotics Market Comparison by Form (2016-2032)
- Table 3: Global Eubiotics Market Comparison by Livestock (2016-2032)
- Table 4: Global Eubiotics Market Comparison by Function (2016-2032)
- Table 5: Global Eubiotics Market Revenue (US$ Mn) Comparison by Region (2016-2032)
- Table 6: Global Eubiotics Market Revenue (US$ Mn) (2016-2032)
- Table 7: Global Eubiotics Market Revenue (US$ Mn) Comparison by Region (2016-2032)
- Table 8: Global Eubiotics Market Revenue (US$ Mn) Comparison by Product Type (2016-2032)
- Table 9: Global Eubiotics Market Revenue (US$ Mn) Comparison by Form (2016-2032)
- Table 10: Global Eubiotics Market Revenue (US$ Mn) Comparison by Livestock (2016-2032)
- Table 11: Global Eubiotics Market Revenue (US$ Mn) Comparison by Function (2016-2032)
- Table 12: Global Eubiotics Market Y-o-Y Growth Rate Comparison by Region (2016-2032)
- Table 13: Global Eubiotics Market Y-o-Y Growth Rate Comparison by Product Type (2016-2032)
- Table 14: Global Eubiotics Market Y-o-Y Growth Rate Comparison by Form (2016-2032)
- Table 15: Global Eubiotics Market Y-o-Y Growth Rate Comparison by Livestock (2016-2032)
- Table 16: Global Eubiotics Market Y-o-Y Growth Rate Comparison by Function (2016-2032)
- Table 17: Global Eubiotics Market Share Comparison by Region (2016-2032)
- Table 18: Global Eubiotics Market Share Comparison by Product Type (2016-2032)
- Table 19: Global Eubiotics Market Share Comparison by Form (2016-2032)
- Table 20: Global Eubiotics Market Share Comparison by Livestock (2016-2032)
- Table 21: Global Eubiotics Market Share Comparison by Function (2016-2032)
- Table 22: North America Eubiotics Market Comparison by Form (2016-2032)
- Table 23: North America Eubiotics Market Comparison by Livestock (2016-2032)
- Table 24: North America Eubiotics Market Comparison by Function (2016-2032)
- Table 25: North America Eubiotics Market Revenue (US$ Mn) Comparison by Country (2016-2032)
- Table 26: North America Eubiotics Market Revenue (US$ Mn) (2016-2032)
- Table 27: North America Eubiotics Market Revenue (US$ Mn) Comparison by Country (2016-2032)
- Table 28: North America Eubiotics Market Revenue (US$ Mn) Comparison by Product Type (2016-2032)
- Table 29: North America Eubiotics Market Revenue (US$ Mn) Comparison by Form (2016-2032)
- Table 30: North America Eubiotics Market Revenue (US$ Mn) Comparison by Livestock (2016-2032)
- Table 31: North America Eubiotics Market Revenue (US$ Mn) Comparison by Function (2016-2032)
- Table 32: North America Eubiotics Market Y-o-Y Growth Rate Comparison by Country (2016-2032)
- Table 33: North America Eubiotics Market Y-o-Y Growth Rate Comparison by Product Type (2016-2032)
- Table 34: North America Eubiotics Market Y-o-Y Growth Rate Comparison by Form (2016-2032)
- Table 35: North America Eubiotics Market Y-o-Y Growth Rate Comparison by Livestock (2016-2032)
- Table 36: North America Eubiotics Market Y-o-Y Growth Rate Comparison by Function (2016-2032)
- Table 37: North America Eubiotics Market Share Comparison by Country (2016-2032)
- Table 38: North America Eubiotics Market Share Comparison by Product Type (2016-2032)
- Table 39: North America Eubiotics Market Share Comparison by Form (2016-2032)
- Table 40: North America Eubiotics Market Share Comparison by Livestock (2016-2032)
- Table 41: North America Eubiotics Market Share Comparison by Function (2016-2032)
- Table 42: Western Europe Eubiotics Market Comparison by Product Type (2016-2032)
- Table 43: Western Europe Eubiotics Market Comparison by Form (2016-2032)
- Table 44: Western Europe Eubiotics Market Comparison by Livestock (2016-2032)
- Table 45: Western Europe Eubiotics Market Comparison by Function (2016-2032)
- Table 46: Western Europe Eubiotics Market Revenue (US$ Mn) Comparison by Country (2016-2032)
- Table 47: Western Europe Eubiotics Market Revenue (US$ Mn) (2016-2032)
- Table 48: Western Europe Eubiotics Market Revenue (US$ Mn) Comparison by Country (2016-2032)
- Table 49: Western Europe Eubiotics Market Revenue (US$ Mn) Comparison by Product Type (2016-2032)
- Table 50: Western Europe Eubiotics Market Revenue (US$ Mn) Comparison by Form (2016-2032)
- Table 51: Western Europe Eubiotics Market Revenue (US$ Mn) Comparison by Livestock (2016-2032)
- Table 52: Western Europe Eubiotics Market Revenue (US$ Mn) Comparison by Function (2016-2032)
- Table 53: Western Europe Eubiotics Market Y-o-Y Growth Rate Comparison by Country (2016-2032)
- Table 54: Western Europe Eubiotics Market Y-o-Y Growth Rate Comparison by Product Type (2016-2032)
- Table 55: Western Europe Eubiotics Market Y-o-Y Growth Rate Comparison by Form (2016-2032)
- Table 56: Western Europe Eubiotics Market Y-o-Y Growth Rate Comparison by Livestock (2016-2032)
- Table 57: Western Europe Eubiotics Market Y-o-Y Growth Rate Comparison by Function (2016-2032)
- Table 58: Western Europe Eubiotics Market Share Comparison by Country (2016-2032)
- Table 59: Western Europe Eubiotics Market Share Comparison by Product Type (2016-2032)
- Table 60: Western Europe Eubiotics Market Share Comparison by Form (2016-2032)
- Table 61: Western Europe Eubiotics Market Share Comparison by Livestock (2016-2032)
- Table 62: Western Europe Eubiotics Market Share Comparison by Function (2016-2032)
- Table 63: Eastern Europe Eubiotics Market Comparison by Product Type (2016-2032)
- Table 64: Eastern Europe Eubiotics Market Comparison by Form (2016-2032)
- Table 65: Eastern Europe Eubiotics Market Comparison by Livestock (2016-2032)
- Table 66: Eastern Europe Eubiotics Market Comparison by Function (2016-2032)
- Table 67: Eastern Europe Eubiotics Market Revenue (US$ Mn) Comparison by Country (2016-2032)
- Table 68: Eastern Europe Eubiotics Market Revenue (US$ Mn) (2016-2032)
- Table 69: Eastern Europe Eubiotics Market Revenue (US$ Mn) Comparison by Country (2016-2032)
- Table 70: Eastern Europe Eubiotics Market Revenue (US$ Mn) Comparison by Product Type (2016-2032)
- Table 71: Eastern Europe Eubiotics Market Revenue (US$ Mn) Comparison by Form (2016-2032)
- Table 72: Eastern Europe Eubiotics Market Revenue (US$ Mn) Comparison by Livestock (2016-2032)
- Table 73: Eastern Europe Eubiotics Market Revenue (US$ Mn) Comparison by Function (2016-2032)
- Table 74: Eastern Europe Eubiotics Market Y-o-Y Growth Rate Comparison by Country (2016-2032)
- Table 75: Eastern Europe Eubiotics Market Y-o-Y Growth Rate Comparison by Product Type (2016-2032)
- Table 76: Eastern Europe Eubiotics Market Y-o-Y Growth Rate Comparison by Form (2016-2032)
- Table 77: Eastern Europe Eubiotics Market Y-o-Y Growth Rate Comparison by Livestock (2016-2032)
- Table 78: Eastern Europe Eubiotics Market Y-o-Y Growth Rate Comparison by Function (2016-2032)
- Table 79: Eastern Europe Eubiotics Market Share Comparison by Country (2016-2032)
- Table 80: Eastern Europe Eubiotics Market Share Comparison by Product Type (2016-2032)
- Table 81: Eastern Europe Eubiotics Market Share Comparison by Form (2016-2032)
- Table 82: Eastern Europe Eubiotics Market Share Comparison by Livestock (2016-2032)
- Table 83: Eastern Europe Eubiotics Market Share Comparison by Function (2016-2032)
- Table 84: APAC Eubiotics Market Comparison by Product Type (2016-2032)
- Table 85: APAC Eubiotics Market Comparison by Form (2016-2032)
- Table 86: APAC Eubiotics Market Comparison by Livestock (2016-2032)
- Table 87: APAC Eubiotics Market Comparison by Function (2016-2032)
- Table 88: APAC Eubiotics Market Revenue (US$ Mn) Comparison by Country (2016-2032)
- Table 89: APAC Eubiotics Market Revenue (US$ Mn) (2016-2032)
- Table 90: APAC Eubiotics Market Revenue (US$ Mn) Comparison by Country (2016-2032)
- Table 91: APAC Eubiotics Market Revenue (US$ Mn) Comparison by Product Type (2016-2032)
- Table 92: APAC Eubiotics Market Revenue (US$ Mn) Comparison by Form (2016-2032)
- Table 93: APAC Eubiotics Market Revenue (US$ Mn) Comparison by Livestock (2016-2032)
- Table 94: APAC Eubiotics Market Revenue (US$ Mn) Comparison by Function (2016-2032)
- Table 95: APAC Eubiotics Market Y-o-Y Growth Rate Comparison by Country (2016-2032)
- Table 96: APAC Eubiotics Market Y-o-Y Growth Rate Comparison by Product Type (2016-2032)
- Table 97: APAC Eubiotics Market Y-o-Y Growth Rate Comparison by Form (2016-2032)
- Table 98: APAC Eubiotics Market Y-o-Y Growth Rate Comparison by Livestock (2016-2032)
- Table 99: APAC Eubiotics Market Y-o-Y Growth Rate Comparison by Function (2016-2032)
- Table 100: APAC Eubiotics Market Share Comparison by Country (2016-2032)
- Table 101: APAC Eubiotics Market Share Comparison by Product Type (2016-2032)
- Table 102: APAC Eubiotics Market Share Comparison by Form (2016-2032)
- Table 103: APAC Eubiotics Market Share Comparison by Livestock (2016-2032)
- Table 104: APAC Eubiotics Market Share Comparison by Function (2016-2032)
- Table 105: Latin America Eubiotics Market Comparison by Product Type (2016-2032)
- Table 106: Latin America Eubiotics Market Comparison by Form (2016-2032)
- Table 107: Latin America Eubiotics Market Comparison by Livestock (2016-2032)
- Table 108: Latin America Eubiotics Market Comparison by Function (2016-2032)
- Table 109: Latin America Eubiotics Market Revenue (US$ Mn) Comparison by Country (2016-2032)
- Table 110: Latin America Eubiotics Market Revenue (US$ Mn) (2016-2032)
- Table 111: Latin America Eubiotics Market Revenue (US$ Mn) Comparison by Country (2016-2032)
- Table 112: Latin America Eubiotics Market Revenue (US$ Mn) Comparison by Product Type (2016-2032)
- Table 113: Latin America Eubiotics Market Revenue (US$ Mn) Comparison by Form (2016-2032)
- Table 114: Latin America Eubiotics Market Revenue (US$ Mn) Comparison by Livestock (2016-2032)
- Table 115: Latin America Eubiotics Market Revenue (US$ Mn) Comparison by Function (2016-2032)
- Table 116: Latin America Eubiotics Market Y-o-Y Growth Rate Comparison by Country (2016-2032)
- Table 117: Latin America Eubiotics Market Y-o-Y Growth Rate Comparison by Product Type (2016-2032)
- Table 118: Latin America Eubiotics Market Y-o-Y Growth Rate Comparison by Form (2016-2032)
- Table 119: Latin America Eubiotics Market Y-o-Y Growth Rate Comparison by Livestock (2016-2032)
- Table 120: Latin America Eubiotics Market Y-o-Y Growth Rate Comparison by Function (2016-2032)
- Table 121: Latin America Eubiotics Market Share Comparison by Country (2016-2032)
- Table 122: Latin America Eubiotics Market Share Comparison by Product Type (2016-2032)
- Table 123: Latin America Eubiotics Market Share Comparison by Form (2016-2032)
- Table 124: Latin America Eubiotics Market Share Comparison by Livestock (2016-2032)
- Table 125: Latin America Eubiotics Market Share Comparison by Function (2016-2032)
- Table 126: Middle East & Africa Eubiotics Market Comparison by Product Type (2016-2032)
- Table 127: Middle East & Africa Eubiotics Market Comparison by Form (2016-2032)
- Table 128: Middle East & Africa Eubiotics Market Comparison by Livestock (2016-2032)
- Table 129: Middle East & Africa Eubiotics Market Comparison by Function (2016-2032)
- Table 130: Middle East & Africa Eubiotics Market Revenue (US$ Mn) Comparison by Country (2016-2032)
- Table 131: Middle East & Africa Eubiotics Market Revenue (US$ Mn) (2016-2032)
- Table 132: Middle East & Africa Eubiotics Market Revenue (US$ Mn) Comparison by Country (2016-2032)
- Table 133: Middle East & Africa Eubiotics Market Revenue (US$ Mn) Comparison by Product Type (2016-2032)
- Table 134: Middle East & Africa Eubiotics Market Revenue (US$ Mn) Comparison by Form (2016-2032)
- Table 135: Middle East & Africa Eubiotics Market Revenue (US$ Mn) Comparison by Livestock (2016-2032)
- Table 136: Middle East & Africa Eubiotics Market Revenue (US$ Mn) Comparison by Function (2016-2032)
- Table 137: Middle East & Africa Eubiotics Market Y-o-Y Growth Rate Comparison by Country (2016-2032)
- Table 138: Middle East & Africa Eubiotics Market Y-o-Y Growth Rate Comparison by Product Type (2016-2032)
- Table 139: Middle East & Africa Eubiotics Market Y-o-Y Growth Rate Comparison by Form (2016-2032)
- Table 140: Middle East & Africa Eubiotics Market Y-o-Y Growth Rate Comparison by Livestock (2016-2032)
- Table 141: Middle East & Africa Eubiotics Market Y-o-Y Growth Rate Comparison by Function (2016-2032)
- Table 142: Middle East & Africa Eubiotics Market Share Comparison by Country (2016-2032)
- Table 143: Middle East & Africa Eubiotics Market Share Comparison by Product Type (2016-2032)
- Table 144: Middle East & Africa Eubiotics Market Share Comparison by Form (2016-2032)
- Table 145: Middle East & Africa Eubiotics Market Share Comparison by Livestock (2016-2032)
- Table 146: Middle East & Africa Eubiotics Market Share Comparison by Function (2016-2032)
- 1. Executive Summary
-
- Cargill Incorporated
- DSM N.V.
- DuPont de Nemours, Inc.
- Associated British Foods plc
- BASF SE
- Novozymes A/S
- UAS Laboratories
- Kemin Industries Inc.
- Advanced BioNutrition Corp
- Lesaffre Group
- Calpis Co., Ltd.
- Koninklijke DSM NV
- E I. du Pont de Nemours and Company
- Chr Hansen Holding A/S
- Behn Meyer Holding AG
- Lallemand Inc.
- Cargill Inc.
- Midori USA Inc.
- Bluestar Adisseo Co.
- Novus International, Inc.
- Other Key Players
Our Clients


View Our Licence Options
