
Essential Oils Market By Product(Orange, Black Pepper, Other), By Application(Food & Beverages, Pharmaceutical, Other), By Distribution Channel(Online, Offline), By Region And Companies - Industry Segment Outlook, Market Assessment, Competition Scenario, Trends, And Forecast 2023-2032
-
2080
-
Jul 2023
-
185
-


-
This report was compiled by Shreyas Rokade Shreyas Rokade is a seasoned Research Analyst with CMFE, bringing extensive expertise in market research and consulting, with a strong background in Chemical Engineering. Correspondence Team Lead-CMFE Linkedin | Detailed Market research Methodology Our methodology involves a mix of primary research, including interviews with leading mental health experts, and secondary research from reputable medical journals and databases. View Detailed Methodology Page
-
Quick Navigation
Report Overview
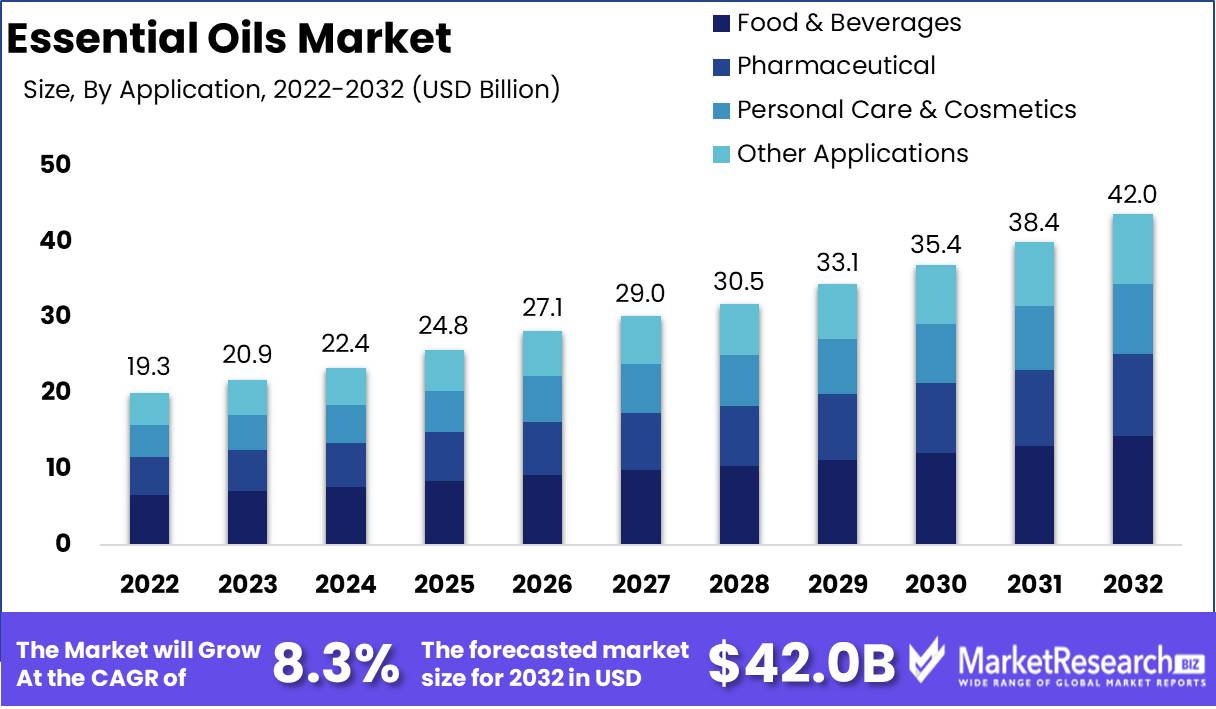
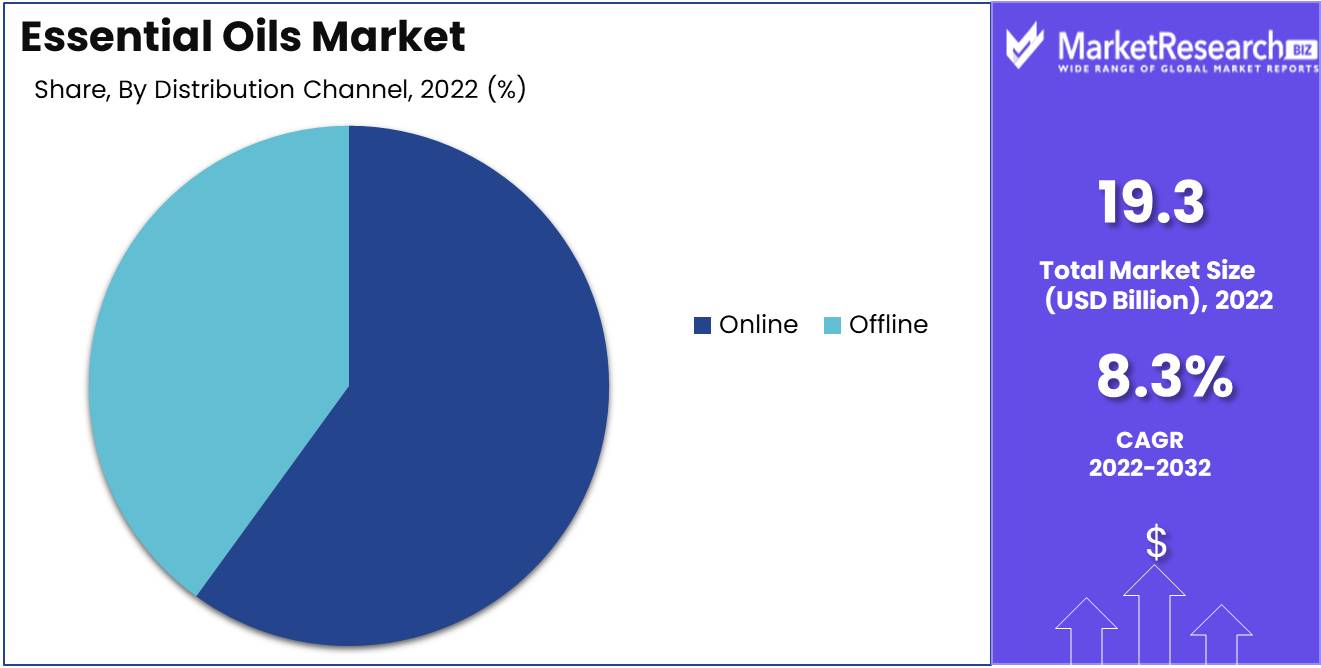
Essential Oils Market size is expected to be worth around USD 42.0 Bn by 2032 from USD 19.3 Bn in 2022, growing at a CAGR of 8.3% during the forecast period from 2023 to 2032.
The market for essential oils is experiencing a remarkable growth spurt and gaining immense popularity among consumers worldwide. These remarkable oils, derived from plants and endowed with the essential essence and aromatic compounds, provide a plethora of health benefits, making them an extraordinarily versatile and invaluable resource across a myriad of industries.
Essential oils, which are distinguished by their high concentration, are obtained through a diverse range of techniques, such as steam distillation, cold pressing, and solvent extraction. These meticulous procedures allow for the extraction of the inherent properties of plants, including their alluring aromas, delectable flavors, and medicinal properties. The primary objective of the essential oils market is to provide consumers with high-quality, unadulterated, ultra-pure oils that can be utilized in a variety of personal care regimens, aromatherapy practices, and other applications.
Essential oils are of the utmost importance because of their inherent commitment to a natural and holistic approach to health and well-being. The only way to get a good deal on a new car is to buy a used one. Their efficacy extends to a myriad of benefits, including but not limited to relaxation promotion, improvement of sleep quality, tension and anxiety reduction, immune system enhancement, and relief from a diverse range of ailments.
Recent years have witnessed a plethora of noteworthy innovations in the realm of agarwood essential oils. Among these revolutionary developments, one must highlight the creation of cutting-edge extraction techniques that guarantee the fats' unparalleled integrity and potency. Simultaneously, the march of progress has led to advancements in analytical testing methodologies, affording essential oils with superior quality control and authentication measures. In addition, inventive packaging solutions have emerged, enhancing the durability and efficacy of these priceless oils.
Driving factors
Increasing consumer interest in holistic and natural health
The world has witnessed a significant transition in consumer behavior, with an increasing interest in natural and holistic health. People are becoming increasingly aware of the positive effects that natural products can have on their overall health. Consequently, the demand for essential oils, which are derived from plants and offer a variety of therapeutic properties, has been consistently increasing.
Essential oils have been used as a holistic treatment for numerous health issues for centuries. Those interested in alternative forms of healing and self-care appreciate their natural and aromatic properties. The market for essential oils has experienced exponential growth due to the rise of natural and holistic wellness practices.
Demand is driven by the aromatherapy and personal care industries
The increasing prevalence of aromatherapy is one of the primary factors influencing the growth of the essential oils market. Aromatherapy is the practice of using essential oils to promote physical, mental, and emotional health. Due to its ability to alleviate stress and anxiety, as well as improve mood, the practice has acquired widespread popularity.
As more individuals turn to aromatherapy as a means of enhancing their overall health, the demand for essential oils has exploded. Furthermore, essential oils are utilized extensively in the personal care industry. As consumers become more conscious of what they put on their skin, natural products have acquired significant popularity. Due to their calming and nurturing properties, essential oils are frequently used in body care, hair care, and skincare products.
Applications expanding in the Food and Beverage Industry
Expanding applications in the food and beverage industry is another factor propelling the essential oils market. In a variety of food and beverage products, essential oils are frequently used as natural flavorings. With the rise of clean dining and the demand for natural ingredients, essential oils have become an increasingly popular choice for flavoring.
Essential oils such as lemon, peppermint, and lavender are frequently added to beverages, baked products, and savory dishes to impart a burst of natural flavor. Their concentrated nature allows a small quantity to go a long way, making them a versatile and cost-effective choice for food manufacturers. In addition, essential oils lack artificial additives, making them a healthier alternative to artificial flavorings.
Demand for Natural Flavors and Fragrances Is Growing
The growth of the economy has led to the development of a number of industries, including the pharmaceutical industry, which has contributed to the growth of the industry. Consumers are becoming more conscious of the potential health hazards associated with synthetic ingredients, particularly in everyday products.
Essential oils provide a safer and more natural alternative to the synthetic fragrances and flavors commonly found in perfumes, candles, household cleansers, and personal care products. The following is a list of some of the most prevalent ways to use your phone's camera.
Restraining Factors
Variations in the Quality and Authenticity of Essential Oils
The potential for quality and authenticity variations is one of the most significant market restraints that must be taken into account in relation to the essential oils market. As consumers have become more aware of the products they use and their constituents, the demand for high-quality essential oils has increased. With such an increase in demand, there is a greater possibility of quality and authenticity variances.
The extraction of essential oils from vegetation, flowers, and other natural sources. Numerous factors affect the quality and authenticity of essential oils, including plant species, growing conditions, harvesting methods, and extraction techniques.
Requirements for Labeling and Regulation
The possibility of regulatory and labeling requirements is another restraint that businesses in the essential oils market must consider. As the market continues to expand, regulatory bodies are becoming more stringent in their efforts to ensure the safety and accuracy of product information.
To be in compliance with these regulations, businesses must be aware of the specific requirements for essential oils and ensure that their products meet all applicable criteria.
Sustainability and Procurement Issues
Sustainability and sourcing issues play a significant role in the essential oils market in today's environmentally conscious world. As consumers become more environmentally conscious, they seek out products that are ethically and sustainably sourced.
The production of essential oils frequently requires large quantities of plant material, which, if not managed responsibly, can place a strain on natural resources. It is crucial for businesses to ensure that their sourcing practices are sustainable and do not negatively impact the environment or local communities.
Competition posed by artificial fragrances and flavors
While essential oils are derived from natural sources, they encounter competition on the market from synthetic flavors and fragrances. Synthetic alternatives are typically less expensive to manufacture and can imitate the aroma or flavor of natural essential oils. This makes it difficult for businesses to maintain their market share and to justify their higher prices.
However, it is essential to emphasize the distinct advantages of natural essential oils over synthetic alternatives. Natural essential oils offer distinct aromatic profiles, therapeutic benefits, and a connection to nature that cannot be replicated by synthetic fragrances and flavors.
Product Analysis
Orange Segment dominates the essential oils market. The health benefits of this oil are well-known, and it's easy to see why it's so popular. Cold-pressing orange peels preserve their natural components. Orange essential oil is well-known for its energizing scent, making it a common ingredient in aromatherapy and fragrance products.
Emerging economies' economic growth has played a significant effect in driving Orange Segment adoption in the essential oils market. Emerging economies like India, China, Brazil, and South Africa have grown rapidly. This has led to a burgeoning middle class with more spare cash to spend on personal care and wellness products, including essential oils.
Consumer trends and behavior toward the Orange Segment have contributed to its market dominance. Today's health-conscious consumers want natural and organic products. Orange essential oil, a natural product with many medicinal uses, suits these preferences.
Application Analysis
Food & Beverages dominates essential oils. Essential oils, like orange essential oil, are used in cooking to enhance flavors and fragrances. Chefs and home cooks love orange essential oil for its lemony flavor.
Similar to Orange, rising economies have played a vital impact in driving Food & Beverages Segment adoption. As disposable incomes rise and lifestyles are busier, consumers want convenient and imaginative methods to add flavor to their meals. A few drops of orange essential oil can replace fresh orange juice or zest.
Food & Beverages Segment consumer trends and behavior have also contributed to its essential oils market dominance. Today's consumers want to try new foods and flavors. Essential oils help chefs produce unique recipes.
Distribution Channel Analysis
Essential oils are distributed online. Consumers now have easy access to a wide range of essential oils, including orange essential oil, thanks to e-commerce and the increasing demand for online buying. Online platforms make it convenient for consumers to research and buy essential oil products from home, making them popular.
The rise of the Online Segment in the essential oils market has been propelled by the economic prosperity of emerging economies. Consumers are accepting online shopping as a convenient and affordable choice as internet access and smartphone usage rise in these economies. This transition to online platforms has given essential oil manufacturers a wider reach.
Key Market Segments
By Product
- Orange
- Black Pepper
- Ginger
- Cinnamon
- Lemon
- Other Products
By Application
- Food & Beverages
- Pharmaceutical
- Personal Care & Cosmetics
- Other Applications
By Distribution Channel
- Online
- Offline
Growth Opportunity
Innovation in Product Development for Specific Applications
Increased awareness and demand for natural products in the health and wellness sector is one of the main factors driving the essential oils market. To remain ahead of the competition, companies should concentrate on developing novel products that address specific health concerns or wellness needs. By conducting extensive research and collaborating with experts in the field, businesses can create essential oil mixtures tailored to treat a variety of conditions, including stress management, immunity enhancement, and sleep improvement.
Expansion into the Food and Beverage Industry
While the essential oils market has been primarily associated with personal care and wellness products, there is enormous potential for growth by breaking into the food and beverage industry. As consumers pursue natural and additive-free alternatives, there is an exciting opportunity to incorporate essential oils into culinary creations and beverages. By collaborating closely with food and beverage producers, companies can create distinctive and enticing flavors that enhance the consumer experience.
Collaboration with Practitioners of Holistic Healthcare
Collaborating with holistic healthcare practitioners offers another opportunity for growth in the essential oils market, in addition to personal care brands. These professionals, which include naturopaths, aromatherapists, and wellness coaches, play a crucial role in advocating the use of essential oils in holistic treatments. By forming strategic alliances with these practitioners, companies can leverage their expertise and credibility to educate consumers on the benefits and efficacy of essential oils.
Digital Advertising and Customization
Due to the accelerated development of technology, digital marketing is now an essential component of any growth strategy. Companies should invest in comprehensive online platforms, such as e-commerce websites and social media channels, in order to maximize reach and engagement. By utilizing data analytics and AI-driven personalization, businesses can provide customers with distinct and customized experiences. Social media campaigns, influencer partnerships, and targeted advertising can increase brand awareness and attract new customers.
Latest Trends
Expansion of Lavender, Citrus, and Peppermint Essential Oils
In recent years, lavender, citrus, and peppermint essential oils have experienced significant growth, becoming some of the most popular options available to consumers. Lavender essential oil, which is well-known in the wellness industry for its calming effects and calming scent, has acquired enormous popularity. Essential oils from citrus fruits such as lemon and orange are prized for their energizing and revitalizing properties. Peppermint essential oil has found a niche in numerous applications, including aromatherapy and natural headache remedies, due to its invigorating aroma and revitalizing sensation.
Growing demand for Therapeutic-Grade and Single-Origin Oils
The purity and origin of essential oils are becoming increasingly important to consumers. Therapeutic-grade oils, which undergo rigorous testing to ensure their integrity and efficacy, have gained popularity among wellness enthusiasts seeking holistic remedies. Single-origin oils from distinct regions renowned for their unique qualities have also garnered popularity. The lavender essential oil from Provence, France, for instance, is highly sought after due to its exceptional aroma and therapeutic properties.
Utilization of Essential Oils in Natural and Organic Personal Care Products
The demand for natural and organic personal care products has skyrocketed in recent years, as consumers have become increasingly concerned about the potentially harmful effects of synthetic ingredients. Various cosmetic and wellness products, including soaps, shampoos, lotions, and perfumes, now contain essential oils as an integral component. Their all-natural composition and enticing fragrances make them an excellent option for conscientious consumers seeking safe and effective alternatives. Businesses that incorporate essential oils into their product lines will be able to capitalize on the market's growth and attract consumers who value natural ingredients.
On the Rise of Customized and Personalized Essential Oil Blends
As consumers pursue products tailored to their particular needs, the demand for customized and personalized essential oil blends continues to increase. Customers now anticipate the ability to personalize their own mixtures based on their desired effects and aroma preferences. Businesses can attract and retain customers who value a personalized experience by offering personalized blending services or educational materials on the creation of custom mixtures. This trend enables businesses to cultivate a closer relationship with their audience and establish themselves as authorities in the essential oils industry.
Use of the Steam Distillation and Cold-Press Extraction Methods
It is generally accepted that steam distillation and cold-press extraction are the most effective techniques for extracting essential oils while maintaining their therapeutic properties. As consumers gain a greater understanding of the production process, they seek out products derived from these extraction techniques. Steam distillation is the process of conveying steam through plant material to extract volatile compounds containing essential oil. In contrast, cold-press extraction presses plant material mechanically to extract oil.
Regional Analysis
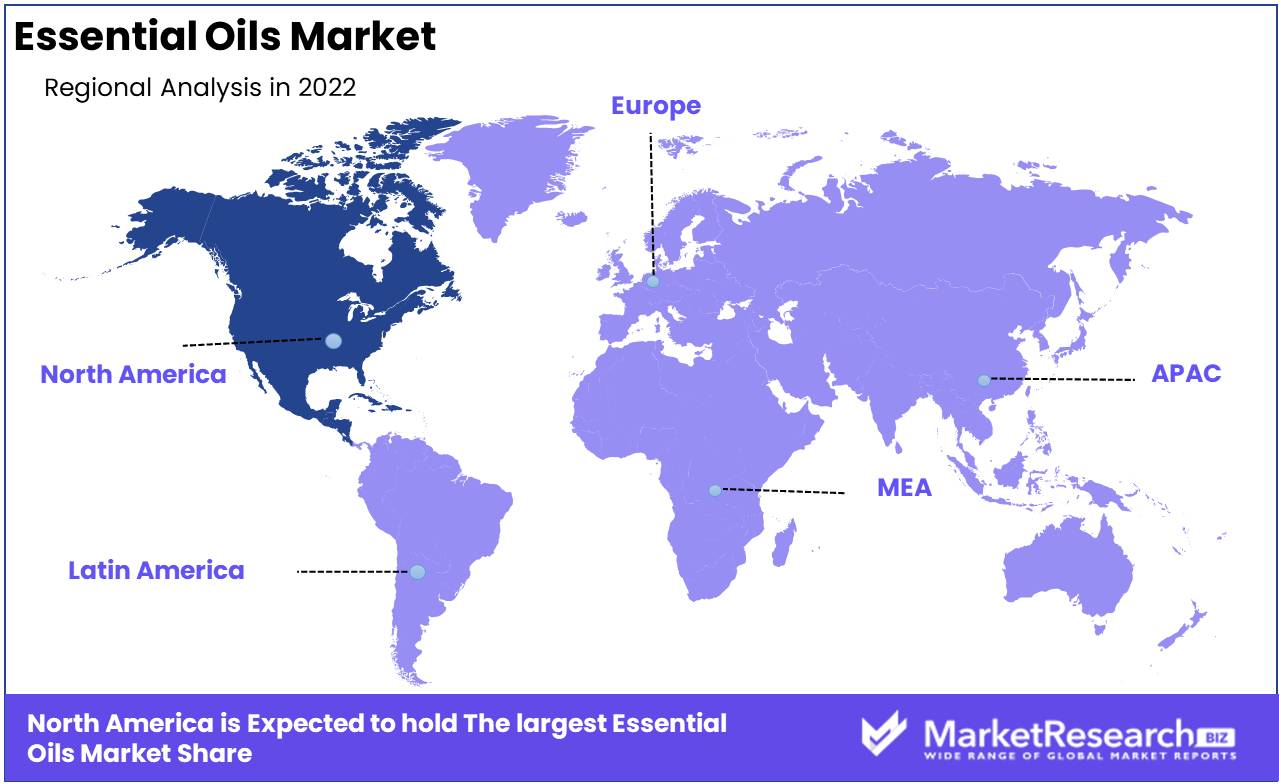
North America Region Dominates the Essential Oils Market
In the ever-evolving world of essential oils, one region stands out as the unrivaled leader - North America. With its vast natural resources and advanced technological capabilities, this region has positioned itself at the forefront of the essential oils market. From large-scale production to innovative research and development, North America continues to dominate this booming industry.
As the demand for natural and organic products continues to soar, essential oils have captured the attention of consumers worldwide. These highly concentrated plant extracts not only offer aromatic benefits but also possess remarkable therapeutic properties. From lavender to peppermint, tea tree to eucalyptus, the range of essential oils available is expansive, catering to a diverse set of needs and preferences.
When it comes to production, North America has a distinct advantage. The region boasts an abundance of indigenous plant species known for their rich essential oil content. From the rainforests of the Pacific Northwest to the sun-soaked fields of California, North America's diverse climate and geography provide ideal conditions for cultivating a wide variety of aromatic plants.
Furthermore, North America's advanced manufacturing infrastructure ensures that the production process adheres to the highest standards of quality and purity. The region excels in the extraction techniques required to obtain the maximum potency from these aromatic plants, ensuring that the resulting essential oils are of exceptional quality.
North America's dominance in the essential oils market is also bolstered by its commitment to research and development. Cutting-edge laboratories and scientific institutions across the region are dedicated to unlocking the full potential of these natural wonders. By exploring the therapeutic properties of essential oils, researchers are discovering new applications and expanding the scope of their usage.
The region's proficiency in research and development is exemplified by the extensive studies conducted on the antimicrobial properties of essential oils. These studies have demonstrated the efficacy of essential oils in combating various pathogens, making them integral to the formulation of natural and eco-friendly cleaning and personal care products.
Key Regions and Countries
North America
- US
- Canada
- Mexico
Western Europe
- Germany
- France
- The UK
- Spain
- Italy
- Portugal
- Ireland
- Austria
- Switzerland
- Benelux
- Nordic
- Rest of Western Europe
Eastern Europe
- Russia
- Poland
- The Czech Republic
- Greece
- Rest of Eastern Europe
APAC
- China
- Japan
- South Korea
- India
- Australia & New Zealand
- Indonesia
- Malaysia
- Philippines
- Singapore
- Thailand
- Vietnam
- Rest of APAC
Latin America
- Brazil
- Colombia
- Chile
- Argentina
- Costa Rica
- Rest of Latin America
Middle East & Africa
- Algeria
- Egypt
- Israel
- Kuwait
- Nigeria
- Saudi Arabia
- South Africa
- Turkey
- United Arab Emirates
- Rest of MEA
Key Players Analysis
GrainCorp, a prominent Australian company, has made significant advances in the market for essential oils. GrainCorp has leveraged its extensive network of grain storage and handling facilities to expand into the production and distribution of essential oils. By adhering to stringent manufacturing procedures and employing cutting-edge technology, the company assures the quality and purity of its oils. GrainCorp's commitment to sustainability and ethical procurement has strengthened its standing as an industry leader.
Malteurop, a French company, is a global champion in the malting industry. However, the company has also established a significant presence in the market for essential oils. Malteurop has effectively branched out into the production and distribution of high-quality essential oils by leveraging its extensive expertise in the agricultural industry. The company's emphasis on research and development, coupled with its strategic alliances, enables Malteurop to deliver innovative and exceptional products in response to changing consumer demands.
The United States-based Rahr Corporation is well-known in the brewing industry. Extending its reach beyond brewing, Rahr Corporation has successfully entered the market for essential oils. The company's commitment to sustainability and state-of-the-art facilities have enabled Rahr Corporation to produce and distribute premium essential oils. Rahr's commitment to quality control and customer fulfillment places them among the market leaders in essential oils.
Boortmalt, a company situated in Belgium, has established an outstanding reputation in the malting and brewing industries. Boortmalt has effectively diversified its offerings to include essential oils, thanks to its extensive experience and global presence. Boortmalt produces a variety of high-quality essential oils by integrating traditional manufacturing techniques with contemporary innovations. Boortmalt's prominence on the essential oils market is a result of the company's commitment to sustainable practices and continuous refinement.
Top Key Players in Essential Oils Market
- GrainCorp (Australia)
- Malteurop (France)
- Rahr Corporation (US)
- Boortmalt (Belgium)
- Indesso (Spain)
- Lipoid Kosmetic AG,(Germany)
- The Herbarie at Stoney Hill Farm Inc.(U.S)
- International Flavors& Fragrances Inc.(Netherlands)
- Bell Flavors& Fragrances (france)
- Rutland Biodynamics Ltd. (Scotland)
- Prakruti Products Pvt. Ltd (India)
- AmbePhytoextractsPvt. Ltd. (Austria)
- The Green Labs LLC (Nethelands)
- Berje Inc.(Italy)
- Umalaxmi Organics Pvt. Ltd.(India)
- DSM (Netherlands)
Recent Development
- In 2023, Young Living, an industry giant renowned for its premium essential oils, stunned pet owners and devotees around the globe by unveiling its innovative new line of essential oils designed specifically for pets.
- In 2022, DoTerra, another prominent player in the essential oils market, caused a stir when it announced the construction of an essential oils facility in the United States. This investment demonstrates DoTerra's commitment to expanding its production capabilities closer to home, assuring its devoted customers of the highest quality and freshest oils.
- In 2021, Plant Therapy, a reputable brand renowned for its natural and organic essential oils, joined forces with retail behemoth Walmart. This partnership brought Plant Therapy's extensive product line to the shelves of Walmart, making high-quality essential oils more accessible to a larger audience.
- In 2020, Rocky Mountain Oils, renowned for its commitment to supplying natural and pure essential oils, significantly expanded its product offerings.
Report Scope:
Report Features Description Market Value (2022) USD 19.3 Bn Forecast Revenue (2032) USD 42.0 Bn CAGR (2023-2032) 8.3% Base Year for Estimation 2022 Historic Period 2016-2022 Forecast Period 2023-2032 Report Coverage Revenue Forecast, Market Dynamics, COVID-19 Impact, Competitive Landscape, Recent Developments Segments Covered By Product(Orange, Black Pepper, Other), By Application(Food & Beverages, Pharmaceutical, Other), By Distribution Channel(Online, Offline) Regional Analysis North America – The US, Canada, & Mexico; Western Europe – Germany, France, The UK, Spain, Italy, Portugal, Ireland, Austria, Switzerland, Benelux, Nordic, & Rest of Western Europe; Eastern Europe – Russia, Poland, The Czech Republic, Greece, & Rest of Eastern Europe; APAC – China, Japan, South Korea, India, Australia & New Zealand, Indonesia, Malaysia, Philippines, Singapore, Thailand, Vietnam, & Rest of APAC; Latin America – Brazil, Colombia, Chile, Argentina, Costa Rica, & Rest of Latin America; Middle East & Africa – Algeria, Egypt, Israel, Kuwait, Nigeria, Saudi Arabia, South Africa, Turkey, United Arab Emirates, & Rest of MEA Competitive Landscape GrainCorp (Australia), Malteurop (France), Rahr Corporation (US), Boortmalt (Belgium), Indesso, (Spain), Lipoid Kosmetic AG,(Germany), The Herbarie at Stoney Hill Farm Inc.(U.S), International Flavors& Fragrances Inc.(Netherlands), Bell Flavors& Fragrances (france), Rutland Biodynamics Ltd. (Scotland), Prakruti Products Pvt. Ltd (India), AmbePhytoextractsPvt. Ltd. (Austria), The Green Labs LLC (Nethelands), Berje Inc.(Italy), Umalaxmi Organics Pvt. Ltd.(India), DSM (Netherlands) Customization Scope Customization for segments, region/country-level will be provided. Moreover, additional customization can be done based on the requirements. Purchase Options We have three licenses to opt for: Single User License, Multi-User License (Up to 5 Users), Corporate Use License (Unlimited User and Printable PDF) -
- 1. Executive Summary
- 1.1. Definition
- 1.2. Taxonomy
- 1.3. Research Scope
- 1.4. Key Analysis
- 1.5. Key Findings by Major Segments
- 1.6. Top strategies by Major Players
- 2. Global Essential Oils Market Overview
- 2.1. Essential Oils Market Dynamics
- 2.1.1. Drivers
- 2.1.2. Opportunities
- 2.1.3. Restraints
- 2.1.4. Challenges
- 2.2. Macro-economic Factors
- 2.3. Regulatory Framework
- 2.4. Market Investment Feasibility Index
- 2.5. PEST Analysis
- 2.6. PORTER’S Five Force Analysis
- 2.7. Drivers & Restraints Impact Analysis
- 2.8. Industry Chain Analysis
- 2.9. Cost Structure Analysis
- 2.10. Marketing Strategy
- 2.11. Russia-Ukraine War Impact Analysis
- 2.12. Opportunity Map Analysis
- 2.13. Market Competition Scenario Analysis
- 2.14. Product Life Cycle Analysis
- 2.15. Opportunity Orbits
- 2.16. Manufacturer Intensity Map
- 2.17. Major Companies sales by Value & Volume
- 2.1. Essential Oils Market Dynamics
- 3. Global Essential Oils Market Analysis, Opportunity and Forecast, 2016-2032
- 3.1. Global Essential Oils Market Analysis, 2016-2021
- 3.2. Global Essential Oils Market Opportunity and Forecast, 2023-2032
- 3.3. Global Essential Oils Market Analysis, Opportunity and Forecast, By By Product, 2016-2032
- 3.3.1. Global Essential Oils Market Analysis by By Product: Introduction
- 3.3.2. Market Size Absolute $ Opportunity Analysis and Forecast, By By Product, 2016-2032
- 3.3.3. Orange
- 3.3.4. Black Pepper
- 3.3.5. Ginger
- 3.3.6. Cinnamon
- 3.3.7. Lemon
- 3.3.8. Other Products
- 3.4. Global Essential Oils Market Analysis, Opportunity and Forecast, By By Application, 2016-2032
- 3.4.1. Global Essential Oils Market Analysis by By Application: Introduction
- 3.4.2. Market Size Absolute $ Opportunity Analysis and Forecast, By By Application, 2016-2032
- 3.4.3. Food & Beverages
- 3.4.4. Pharmaceutical
- 3.4.5. Personal Care & Cosmetics
- 3.4.6. Other Applications
- 3.5. Global Essential Oils Market Analysis, Opportunity and Forecast, By By Distribution Channel, 2016-2032
- 3.5.1. Global Essential Oils Market Analysis by By Distribution Channel: Introduction
- 3.5.2. Market Size Absolute $ Opportunity Analysis and Forecast, By By Distribution Channel, 2016-2032
- 3.5.3. Online
- 3.5.4. Offline
- 4. North America Essential Oils Market Analysis, Opportunity and Forecast, 2016-2032
- 4.1. North America Essential Oils Market Analysis, 2016-2021
- 4.2. North America Essential Oils Market Opportunity and Forecast, 2023-2032
- 4.3. North America Essential Oils Market Analysis, Opportunity and Forecast, By By Product, 2016-2032
- 4.3.1. North America Essential Oils Market Analysis by By Product: Introduction
- 4.3.2. Market Size Absolute $ Opportunity Analysis and Forecast, By By Product, 2016-2032
- 4.3.3. Orange
- 4.3.4. Black Pepper
- 4.3.5. Ginger
- 4.3.6. Cinnamon
- 4.3.7. Lemon
- 4.3.8. Other Products
- 4.4. North America Essential Oils Market Analysis, Opportunity and Forecast, By By Application, 2016-2032
- 4.4.1. North America Essential Oils Market Analysis by By Application: Introduction
- 4.4.2. Market Size Absolute $ Opportunity Analysis and Forecast, By By Application, 2016-2032
- 4.4.3. Food & Beverages
- 4.4.4. Pharmaceutical
- 4.4.5. Personal Care & Cosmetics
- 4.4.6. Other Applications
- 4.5. North America Essential Oils Market Analysis, Opportunity and Forecast, By By Distribution Channel, 2016-2032
- 4.5.1. North America Essential Oils Market Analysis by By Distribution Channel: Introduction
- 4.5.2. Market Size Absolute $ Opportunity Analysis and Forecast, By By Distribution Channel, 2016-2032
- 4.5.3. Online
- 4.5.4. Offline
- 4.6. North America Essential Oils Market Analysis, Opportunity and Forecast, By Country , 2016-2032
- 4.6.1. North America Essential Oils Market Analysis by Country : Introduction
- 4.6.2. Market Size Absolute $ Opportunity Analysis and Forecast, Country , 2016-2032
- 4.6.2.1. The US
- 4.6.2.2. Canada
- 4.6.2.3. Mexico
- 5. Western Europe Essential Oils Market Analysis, Opportunity and Forecast, 2016-2032
- 5.1. Western Europe Essential Oils Market Analysis, 2016-2021
- 5.2. Western Europe Essential Oils Market Opportunity and Forecast, 2023-2032
- 5.3. Western Europe Essential Oils Market Analysis, Opportunity and Forecast, By By Product, 2016-2032
- 5.3.1. Western Europe Essential Oils Market Analysis by By Product: Introduction
- 5.3.2. Market Size Absolute $ Opportunity Analysis and Forecast, By By Product, 2016-2032
- 5.3.3. Orange
- 5.3.4. Black Pepper
- 5.3.5. Ginger
- 5.3.6. Cinnamon
- 5.3.7. Lemon
- 5.3.8. Other Products
- 5.4. Western Europe Essential Oils Market Analysis, Opportunity and Forecast, By By Application, 2016-2032
- 5.4.1. Western Europe Essential Oils Market Analysis by By Application: Introduction
- 5.4.2. Market Size Absolute $ Opportunity Analysis and Forecast, By By Application, 2016-2032
- 5.4.3. Food & Beverages
- 5.4.4. Pharmaceutical
- 5.4.5. Personal Care & Cosmetics
- 5.4.6. Other Applications
- 5.5. Western Europe Essential Oils Market Analysis, Opportunity and Forecast, By By Distribution Channel, 2016-2032
- 5.5.1. Western Europe Essential Oils Market Analysis by By Distribution Channel: Introduction
- 5.5.2. Market Size Absolute $ Opportunity Analysis and Forecast, By By Distribution Channel, 2016-2032
- 5.5.3. Online
- 5.5.4. Offline
- 5.6. Western Europe Essential Oils Market Analysis, Opportunity and Forecast, By Country , 2016-2032
- 5.6.1. Western Europe Essential Oils Market Analysis by Country : Introduction
- 5.6.2. Market Size Absolute $ Opportunity Analysis and Forecast, Country , 2016-2032
- 5.6.2.1. Germany
- 5.6.2.2. France
- 5.6.2.3. The UK
- 5.6.2.4. Spain
- 5.6.2.5. Italy
- 5.6.2.6. Portugal
- 5.6.2.7. Ireland
- 5.6.2.8. Austria
- 5.6.2.9. Switzerland
- 5.6.2.10. Benelux
- 5.6.2.11. Nordic
- 5.6.2.12. Rest of Western Europe
- 6. Eastern Europe Essential Oils Market Analysis, Opportunity and Forecast, 2016-2032
- 6.1. Eastern Europe Essential Oils Market Analysis, 2016-2021
- 6.2. Eastern Europe Essential Oils Market Opportunity and Forecast, 2023-2032
- 6.3. Eastern Europe Essential Oils Market Analysis, Opportunity and Forecast, By By Product, 2016-2032
- 6.3.1. Eastern Europe Essential Oils Market Analysis by By Product: Introduction
- 6.3.2. Market Size Absolute $ Opportunity Analysis and Forecast, By By Product, 2016-2032
- 6.3.3. Orange
- 6.3.4. Black Pepper
- 6.3.5. Ginger
- 6.3.6. Cinnamon
- 6.3.7. Lemon
- 6.3.8. Other Products
- 6.4. Eastern Europe Essential Oils Market Analysis, Opportunity and Forecast, By By Application, 2016-2032
- 6.4.1. Eastern Europe Essential Oils Market Analysis by By Application: Introduction
- 6.4.2. Market Size Absolute $ Opportunity Analysis and Forecast, By By Application, 2016-2032
- 6.4.3. Food & Beverages
- 6.4.4. Pharmaceutical
- 6.4.5. Personal Care & Cosmetics
- 6.4.6. Other Applications
- 6.5. Eastern Europe Essential Oils Market Analysis, Opportunity and Forecast, By By Distribution Channel, 2016-2032
- 6.5.1. Eastern Europe Essential Oils Market Analysis by By Distribution Channel: Introduction
- 6.5.2. Market Size Absolute $ Opportunity Analysis and Forecast, By By Distribution Channel, 2016-2032
- 6.5.3. Online
- 6.5.4. Offline
- 6.6. Eastern Europe Essential Oils Market Analysis, Opportunity and Forecast, By Country , 2016-2032
- 6.6.1. Eastern Europe Essential Oils Market Analysis by Country : Introduction
- 6.6.2. Market Size Absolute $ Opportunity Analysis and Forecast, Country , 2016-2032
- 6.6.2.1. Russia
- 6.6.2.2. Poland
- 6.6.2.3. The Czech Republic
- 6.6.2.4. Greece
- 6.6.2.5. Rest of Eastern Europe
- 7. APAC Essential Oils Market Analysis, Opportunity and Forecast, 2016-2032
- 7.1. APAC Essential Oils Market Analysis, 2016-2021
- 7.2. APAC Essential Oils Market Opportunity and Forecast, 2023-2032
- 7.3. APAC Essential Oils Market Analysis, Opportunity and Forecast, By By Product, 2016-2032
- 7.3.1. APAC Essential Oils Market Analysis by By Product: Introduction
- 7.3.2. Market Size Absolute $ Opportunity Analysis and Forecast, By By Product, 2016-2032
- 7.3.3. Orange
- 7.3.4. Black Pepper
- 7.3.5. Ginger
- 7.3.6. Cinnamon
- 7.3.7. Lemon
- 7.3.8. Other Products
- 7.4. APAC Essential Oils Market Analysis, Opportunity and Forecast, By By Application, 2016-2032
- 7.4.1. APAC Essential Oils Market Analysis by By Application: Introduction
- 7.4.2. Market Size Absolute $ Opportunity Analysis and Forecast, By By Application, 2016-2032
- 7.4.3. Food & Beverages
- 7.4.4. Pharmaceutical
- 7.4.5. Personal Care & Cosmetics
- 7.4.6. Other Applications
- 7.5. APAC Essential Oils Market Analysis, Opportunity and Forecast, By By Distribution Channel, 2016-2032
- 7.5.1. APAC Essential Oils Market Analysis by By Distribution Channel: Introduction
- 7.5.2. Market Size Absolute $ Opportunity Analysis and Forecast, By By Distribution Channel, 2016-2032
- 7.5.3. Online
- 7.5.4. Offline
- 7.6. APAC Essential Oils Market Analysis, Opportunity and Forecast, By Country , 2016-2032
- 7.6.1. APAC Essential Oils Market Analysis by Country : Introduction
- 7.6.2. Market Size Absolute $ Opportunity Analysis and Forecast, Country , 2016-2032
- 7.6.2.1. China
- 7.6.2.2. Japan
- 7.6.2.3. South Korea
- 7.6.2.4. India
- 7.6.2.5. Australia & New Zeland
- 7.6.2.6. Indonesia
- 7.6.2.7. Malaysia
- 7.6.2.8. Philippines
- 7.6.2.9. Singapore
- 7.6.2.10. Thailand
- 7.6.2.11. Vietnam
- 7.6.2.12. Rest of APAC
- 8. Latin America Essential Oils Market Analysis, Opportunity and Forecast, 2016-2032
- 8.1. Latin America Essential Oils Market Analysis, 2016-2021
- 8.2. Latin America Essential Oils Market Opportunity and Forecast, 2023-2032
- 8.3. Latin America Essential Oils Market Analysis, Opportunity and Forecast, By By Product, 2016-2032
- 8.3.1. Latin America Essential Oils Market Analysis by By Product: Introduction
- 8.3.2. Market Size Absolute $ Opportunity Analysis and Forecast, By By Product, 2016-2032
- 8.3.3. Orange
- 8.3.4. Black Pepper
- 8.3.5. Ginger
- 8.3.6. Cinnamon
- 8.3.7. Lemon
- 8.3.8. Other Products
- 8.4. Latin America Essential Oils Market Analysis, Opportunity and Forecast, By By Application, 2016-2032
- 8.4.1. Latin America Essential Oils Market Analysis by By Application: Introduction
- 8.4.2. Market Size Absolute $ Opportunity Analysis and Forecast, By By Application, 2016-2032
- 8.4.3. Food & Beverages
- 8.4.4. Pharmaceutical
- 8.4.5. Personal Care & Cosmetics
- 8.4.6. Other Applications
- 8.5. Latin America Essential Oils Market Analysis, Opportunity and Forecast, By By Distribution Channel, 2016-2032
- 8.5.1. Latin America Essential Oils Market Analysis by By Distribution Channel: Introduction
- 8.5.2. Market Size Absolute $ Opportunity Analysis and Forecast, By By Distribution Channel, 2016-2032
- 8.5.3. Online
- 8.5.4. Offline
- 8.6. Latin America Essential Oils Market Analysis, Opportunity and Forecast, By Country , 2016-2032
- 8.6.1. Latin America Essential Oils Market Analysis by Country : Introduction
- 8.6.2. Market Size Absolute $ Opportunity Analysis and Forecast, Country , 2016-2032
- 8.6.2.1. Brazil
- 8.6.2.2. Colombia
- 8.6.2.3. Chile
- 8.6.2.4. Argentina
- 8.6.2.5. Costa Rica
- 8.6.2.6. Rest of Latin America
- 9. Middle East & Africa Essential Oils Market Analysis, Opportunity and Forecast, 2016-2032
- 9.1. Middle East & Africa Essential Oils Market Analysis, 2016-2021
- 9.2. Middle East & Africa Essential Oils Market Opportunity and Forecast, 2023-2032
- 9.3. Middle East & Africa Essential Oils Market Analysis, Opportunity and Forecast, By By Product, 2016-2032
- 9.3.1. Middle East & Africa Essential Oils Market Analysis by By Product: Introduction
- 9.3.2. Market Size Absolute $ Opportunity Analysis and Forecast, By By Product, 2016-2032
- 9.3.3. Orange
- 9.3.4. Black Pepper
- 9.3.5. Ginger
- 9.3.6. Cinnamon
- 9.3.7. Lemon
- 9.3.8. Other Products
- 9.4. Middle East & Africa Essential Oils Market Analysis, Opportunity and Forecast, By By Application, 2016-2032
- 9.4.1. Middle East & Africa Essential Oils Market Analysis by By Application: Introduction
- 9.4.2. Market Size Absolute $ Opportunity Analysis and Forecast, By By Application, 2016-2032
- 9.4.3. Food & Beverages
- 9.4.4. Pharmaceutical
- 9.4.5. Personal Care & Cosmetics
- 9.4.6. Other Applications
- 9.5. Middle East & Africa Essential Oils Market Analysis, Opportunity and Forecast, By By Distribution Channel, 2016-2032
- 9.5.1. Middle East & Africa Essential Oils Market Analysis by By Distribution Channel: Introduction
- 9.5.2. Market Size Absolute $ Opportunity Analysis and Forecast, By By Distribution Channel, 2016-2032
- 9.5.3. Online
- 9.5.4. Offline
- 9.6. Middle East & Africa Essential Oils Market Analysis, Opportunity and Forecast, By Country , 2016-2032
- 9.6.1. Middle East & Africa Essential Oils Market Analysis by Country : Introduction
- 9.6.2. Market Size Absolute $ Opportunity Analysis and Forecast, Country , 2016-2032
- 9.6.2.1. Algeria
- 9.6.2.2. Egypt
- 9.6.2.3. Israel
- 9.6.2.4. Kuwait
- 9.6.2.5. Nigeria
- 9.6.2.6. Saudi Arabia
- 9.6.2.7. South Africa
- 9.6.2.8. Turkey
- 9.6.2.9. The UAE
- 9.6.2.10. Rest of MEA
- 10. Global Essential Oils Market Analysis, Opportunity and Forecast, By Region , 2016-2032
- 10.1. Global Essential Oils Market Analysis by Region : Introduction
- 10.2. Market Size Absolute $ Opportunity Analysis and Forecast, By Region , 2016-2032
- 10.2.1. North America
- 10.2.2. Western Europe
- 10.2.3. Eastern Europe
- 10.2.4. APAC
- 10.2.5. Latin America
- 10.2.6. Middle East & Africa
- 11. Global Essential Oils Market Competitive Landscape, Market Share Analysis, and Company Profiles
- 11.1. Market Share Analysis
- 11.2. Company Profiles
- 11.3. GrainCorp (Australia)
- 11.3.1. Company Overview
- 11.3.2. Financial Highlights
- 11.3.3. Product Portfolio
- 11.3.4. SWOT Analysis
- 11.3.5. Key Strategies and Developments
- 11.4. Malteurop (France)
- 11.4.1. Company Overview
- 11.4.2. Financial Highlights
- 11.4.3. Product Portfolio
- 11.4.4. SWOT Analysis
- 11.4.5. Key Strategies and Developments
- 11.5. Rahr Corporation (US)
- 11.5.1. Company Overview
- 11.5.2. Financial Highlights
- 11.5.3. Product Portfolio
- 11.5.4. SWOT Analysis
- 11.5.5. Key Strategies and Developments
- 11.6. Boortmalt (Belgium)
- 11.6.1. Company Overview
- 11.6.2. Financial Highlights
- 11.6.3. Product Portfolio
- 11.6.4. SWOT Analysis
- 11.6.5. Key Strategies and Developments
- 11.7. Indesso (Spain)
- 11.7.1. Company Overview
- 11.7.2. Financial Highlights
- 11.7.3. Product Portfolio
- 11.7.4. SWOT Analysis
- 11.7.5. Key Strategies and Developments
- 11.8. Lipoid Kosmetic AG,(Germany)
- 11.8.1. Company Overview
- 11.8.2. Financial Highlights
- 11.8.3. Product Portfolio
- 11.8.4. SWOT Analysis
- 11.8.5. Key Strategies and Developments
- 11.9. The Herbarie at Stoney Hill Farm Inc.(U.S)
- 11.9.1. Company Overview
- 11.9.2. Financial Highlights
- 11.9.3. Product Portfolio
- 11.9.4. SWOT Analysis
- 11.9.5. Key Strategies and Developments
- 11.10. International Flavors& Fragrances Inc.(Netherlands)
- 11.10.1. Company Overview
- 11.10.2. Financial Highlights
- 11.10.3. Product Portfolio
- 11.10.4. SWOT Analysis
- 11.10.5. Key Strategies and Developments
- 11.11. Bell Flavors& Fragrances (france)
- 11.11.1. Company Overview
- 11.11.2. Financial Highlights
- 11.11.3. Product Portfolio
- 11.11.4. SWOT Analysis
- 11.11.5. Key Strategies and Developments
- 11.12. Rutland Biodynamics Ltd. (Scotland)
- 11.12.1. Company Overview
- 11.12.2. Financial Highlights
- 11.12.3. Product Portfolio
- 11.12.4. SWOT Analysis
- 11.12.5. Key Strategies and Developments
- 11.13. Prakruti Products Pvt. Ltd (India)
- 11.13.1. Company Overview
- 11.13.2. Financial Highlights
- 11.13.3. Product Portfolio
- 11.13.4. SWOT Analysis
- 11.13.5. Key Strategies and Developments
- 11.14. AmbePhytoextractsPvt. Ltd. (Austria)
- 11.14.1. Company Overview
- 11.14.2. Financial Highlights
- 11.14.3. Product Portfolio
- 11.14.4. SWOT Analysis
- 11.14.5. Key Strategies and Developments
- 11.15. The Green Labs LLC (Nethelands)
- 11.15.1. Company Overview
- 11.15.2. Financial Highlights
- 11.15.3. Product Portfolio
- 11.15.4. SWOT Analysis
- 11.15.5. Key Strategies and Developments
- 11.16. Berje Inc.(Italy)
- 11.16.1. Company Overview
- 11.16.2. Financial Highlights
- 11.16.3. Product Portfolio
- 11.16.4. SWOT Analysis
- 11.16.5. Key Strategies and Developments
- 11.17. Umalaxmi Organics Pvt. Ltd.(India)
- 11.17.1. Company Overview
- 11.17.2. Financial Highlights
- 11.17.3. Product Portfolio
- 11.17.4. SWOT Analysis
- 11.17.5. Key Strategies and Developments
- 11.18. DSM (Netherlands)
- 11.18.1. Company Overview
- 11.18.2. Financial Highlights
- 11.18.3. Product Portfolio
- 11.18.4. SWOT Analysis
- 11.18.5. Key Strategies and Developments
- 12. Assumptions and Acronyms
- 13. Research Methodology
- 14. Contact
List of Figures
- Figure 1: Global Essential Oils Market Revenue (US$ Mn) Market Share by Product in 2022
- Figure 2: Global Essential Oils Market Attractiveness Analysis by Product, 2016-2032
- Figure 3: Global Essential Oils Market Revenue (US$ Mn) Market Share by Applicationin 2022
- Figure 4: Global Essential Oils Market Attractiveness Analysis by Application, 2016-2032
- Figure 5: Global Essential Oils Market Revenue (US$ Mn) Market Share by Distribution Channelin 2022
- Figure 6: Global Essential Oils Market Attractiveness Analysis by Distribution Channel, 2016-2032
- Figure 7: Global Essential Oils Market Revenue (US$ Mn) Market Share by Region in 2022
- Figure 8: Global Essential Oils Market Attractiveness Analysis by Region, 2016-2032
- Figure 9: Global Essential Oils Market Revenue (US$ Mn) (2016-2032)
- Figure 10: Global Essential Oils Market Revenue (US$ Mn) Comparison by Region (2016-2032)
- Figure 11: Global Essential Oils Market Revenue (US$ Mn) Comparison by Product (2016-2032)
- Figure 12: Global Essential Oils Market Revenue (US$ Mn) Comparison by Application (2016-2032)
- Figure 13: Global Essential Oils Market Revenue (US$ Mn) Comparison by Distribution Channel (2016-2032)
- Figure 14: Global Essential Oils Market Y-o-Y Growth Rate Comparison by Region (2016-2032)
- Figure 15: Global Essential Oils Market Y-o-Y Growth Rate Comparison by Product (2016-2032)
- Figure 16: Global Essential Oils Market Y-o-Y Growth Rate Comparison by Application (2016-2032)
- Figure 17: Global Essential Oils Market Y-o-Y Growth Rate Comparison by Distribution Channel (2016-2032)
- Figure 18: Global Essential Oils Market Share Comparison by Region (2016-2032)
- Figure 19: Global Essential Oils Market Share Comparison by Product (2016-2032)
- Figure 20: Global Essential Oils Market Share Comparison by Application (2016-2032)
- Figure 21: Global Essential Oils Market Share Comparison by Distribution Channel (2016-2032)
- Figure 22: North America Essential Oils Market Revenue (US$ Mn) Market Share by Productin 2022
- Figure 23: North America Essential Oils Market Attractiveness Analysis by Product, 2016-2032
- Figure 24: North America Essential Oils Market Revenue (US$ Mn) Market Share by Applicationin 2022
- Figure 25: North America Essential Oils Market Attractiveness Analysis by Application, 2016-2032
- Figure 26: North America Essential Oils Market Revenue (US$ Mn) Market Share by Distribution Channelin 2022
- Figure 27: North America Essential Oils Market Attractiveness Analysis by Distribution Channel, 2016-2032
- Figure 28: North America Essential Oils Market Revenue (US$ Mn) Market Share by Country in 2022
- Figure 29: North America Essential Oils Market Attractiveness Analysis by Country, 2016-2032
- Figure 30: North America Essential Oils Market Revenue (US$ Mn) (2016-2032)
- Figure 31: North America Essential Oils Market Revenue (US$ Mn) Comparison by Country (2016-2032)
- Figure 32: North America Essential Oils Market Revenue (US$ Mn) Comparison by Product (2016-2032)
- Figure 33: North America Essential Oils Market Revenue (US$ Mn) Comparison by Application (2016-2032)
- Figure 34: North America Essential Oils Market Revenue (US$ Mn) Comparison by Distribution Channel (2016-2032)
- Figure 35: North America Essential Oils Market Y-o-Y Growth Rate Comparison by Country (2016-2032)
- Figure 36: North America Essential Oils Market Y-o-Y Growth Rate Comparison by Product (2016-2032)
- Figure 37: North America Essential Oils Market Y-o-Y Growth Rate Comparison by Application (2016-2032)
- Figure 38: North America Essential Oils Market Y-o-Y Growth Rate Comparison by Distribution Channel (2016-2032)
- Figure 39: North America Essential Oils Market Share Comparison by Country (2016-2032)
- Figure 40: North America Essential Oils Market Share Comparison by Product (2016-2032)
- Figure 41: North America Essential Oils Market Share Comparison by Application (2016-2032)
- Figure 42: North America Essential Oils Market Share Comparison by Distribution Channel (2016-2032)
- Figure 43: Western Europe Essential Oils Market Revenue (US$ Mn) Market Share by Productin 2022
- Figure 44: Western Europe Essential Oils Market Attractiveness Analysis by Product, 2016-2032
- Figure 45: Western Europe Essential Oils Market Revenue (US$ Mn) Market Share by Applicationin 2022
- Figure 46: Western Europe Essential Oils Market Attractiveness Analysis by Application, 2016-2032
- Figure 47: Western Europe Essential Oils Market Revenue (US$ Mn) Market Share by Distribution Channelin 2022
- Figure 48: Western Europe Essential Oils Market Attractiveness Analysis by Distribution Channel, 2016-2032
- Figure 49: Western Europe Essential Oils Market Revenue (US$ Mn) Market Share by Country in 2022
- Figure 50: Western Europe Essential Oils Market Attractiveness Analysis by Country, 2016-2032
- Figure 51: Western Europe Essential Oils Market Revenue (US$ Mn) (2016-2032)
- Figure 52: Western Europe Essential Oils Market Revenue (US$ Mn) Comparison by Country (2016-2032)
- Figure 53: Western Europe Essential Oils Market Revenue (US$ Mn) Comparison by Product (2016-2032)
- Figure 54: Western Europe Essential Oils Market Revenue (US$ Mn) Comparison by Application (2016-2032)
- Figure 55: Western Europe Essential Oils Market Revenue (US$ Mn) Comparison by Distribution Channel (2016-2032)
- Figure 56: Western Europe Essential Oils Market Y-o-Y Growth Rate Comparison by Country (2016-2032)
- Figure 57: Western Europe Essential Oils Market Y-o-Y Growth Rate Comparison by Product (2016-2032)
- Figure 58: Western Europe Essential Oils Market Y-o-Y Growth Rate Comparison by Application (2016-2032)
- Figure 59: Western Europe Essential Oils Market Y-o-Y Growth Rate Comparison by Distribution Channel (2016-2032)
- Figure 60: Western Europe Essential Oils Market Share Comparison by Country (2016-2032)
- Figure 61: Western Europe Essential Oils Market Share Comparison by Product (2016-2032)
- Figure 62: Western Europe Essential Oils Market Share Comparison by Application (2016-2032)
- Figure 63: Western Europe Essential Oils Market Share Comparison by Distribution Channel (2016-2032)
- Figure 64: Eastern Europe Essential Oils Market Revenue (US$ Mn) Market Share by Productin 2022
- Figure 65: Eastern Europe Essential Oils Market Attractiveness Analysis by Product, 2016-2032
- Figure 66: Eastern Europe Essential Oils Market Revenue (US$ Mn) Market Share by Applicationin 2022
- Figure 67: Eastern Europe Essential Oils Market Attractiveness Analysis by Application, 2016-2032
- Figure 68: Eastern Europe Essential Oils Market Revenue (US$ Mn) Market Share by Distribution Channelin 2022
- Figure 69: Eastern Europe Essential Oils Market Attractiveness Analysis by Distribution Channel, 2016-2032
- Figure 70: Eastern Europe Essential Oils Market Revenue (US$ Mn) Market Share by Country in 2022
- Figure 71: Eastern Europe Essential Oils Market Attractiveness Analysis by Country, 2016-2032
- Figure 72: Eastern Europe Essential Oils Market Revenue (US$ Mn) (2016-2032)
- Figure 73: Eastern Europe Essential Oils Market Revenue (US$ Mn) Comparison by Country (2016-2032)
- Figure 74: Eastern Europe Essential Oils Market Revenue (US$ Mn) Comparison by Product (2016-2032)
- Figure 75: Eastern Europe Essential Oils Market Revenue (US$ Mn) Comparison by Application (2016-2032)
- Figure 76: Eastern Europe Essential Oils Market Revenue (US$ Mn) Comparison by Distribution Channel (2016-2032)
- Figure 77: Eastern Europe Essential Oils Market Y-o-Y Growth Rate Comparison by Country (2016-2032)
- Figure 78: Eastern Europe Essential Oils Market Y-o-Y Growth Rate Comparison by Product (2016-2032)
- Figure 79: Eastern Europe Essential Oils Market Y-o-Y Growth Rate Comparison by Application (2016-2032)
- Figure 80: Eastern Europe Essential Oils Market Y-o-Y Growth Rate Comparison by Distribution Channel (2016-2032)
- Figure 81: Eastern Europe Essential Oils Market Share Comparison by Country (2016-2032)
- Figure 82: Eastern Europe Essential Oils Market Share Comparison by Product (2016-2032)
- Figure 83: Eastern Europe Essential Oils Market Share Comparison by Application (2016-2032)
- Figure 84: Eastern Europe Essential Oils Market Share Comparison by Distribution Channel (2016-2032)
- Figure 85: APAC Essential Oils Market Revenue (US$ Mn) Market Share by Productin 2022
- Figure 86: APAC Essential Oils Market Attractiveness Analysis by Product, 2016-2032
- Figure 87: APAC Essential Oils Market Revenue (US$ Mn) Market Share by Applicationin 2022
- Figure 88: APAC Essential Oils Market Attractiveness Analysis by Application, 2016-2032
- Figure 89: APAC Essential Oils Market Revenue (US$ Mn) Market Share by Distribution Channelin 2022
- Figure 90: APAC Essential Oils Market Attractiveness Analysis by Distribution Channel, 2016-2032
- Figure 91: APAC Essential Oils Market Revenue (US$ Mn) Market Share by Country in 2022
- Figure 92: APAC Essential Oils Market Attractiveness Analysis by Country, 2016-2032
- Figure 93: APAC Essential Oils Market Revenue (US$ Mn) (2016-2032)
- Figure 94: APAC Essential Oils Market Revenue (US$ Mn) Comparison by Country (2016-2032)
- Figure 95: APAC Essential Oils Market Revenue (US$ Mn) Comparison by Product (2016-2032)
- Figure 96: APAC Essential Oils Market Revenue (US$ Mn) Comparison by Application (2016-2032)
- Figure 97: APAC Essential Oils Market Revenue (US$ Mn) Comparison by Distribution Channel (2016-2032)
- Figure 98: APAC Essential Oils Market Y-o-Y Growth Rate Comparison by Country (2016-2032)
- Figure 99: APAC Essential Oils Market Y-o-Y Growth Rate Comparison by Product (2016-2032)
- Figure 100: APAC Essential Oils Market Y-o-Y Growth Rate Comparison by Application (2016-2032)
- Figure 101: APAC Essential Oils Market Y-o-Y Growth Rate Comparison by Distribution Channel (2016-2032)
- Figure 102: APAC Essential Oils Market Share Comparison by Country (2016-2032)
- Figure 103: APAC Essential Oils Market Share Comparison by Product (2016-2032)
- Figure 104: APAC Essential Oils Market Share Comparison by Application (2016-2032)
- Figure 105: APAC Essential Oils Market Share Comparison by Distribution Channel (2016-2032)
- Figure 106: Latin America Essential Oils Market Revenue (US$ Mn) Market Share by Productin 2022
- Figure 107: Latin America Essential Oils Market Attractiveness Analysis by Product, 2016-2032
- Figure 108: Latin America Essential Oils Market Revenue (US$ Mn) Market Share by Applicationin 2022
- Figure 109: Latin America Essential Oils Market Attractiveness Analysis by Application, 2016-2032
- Figure 110: Latin America Essential Oils Market Revenue (US$ Mn) Market Share by Distribution Channelin 2022
- Figure 111: Latin America Essential Oils Market Attractiveness Analysis by Distribution Channel, 2016-2032
- Figure 112: Latin America Essential Oils Market Revenue (US$ Mn) Market Share by Country in 2022
- Figure 113: Latin America Essential Oils Market Attractiveness Analysis by Country, 2016-2032
- Figure 114: Latin America Essential Oils Market Revenue (US$ Mn) (2016-2032)
- Figure 115: Latin America Essential Oils Market Revenue (US$ Mn) Comparison by Country (2016-2032)
- Figure 116: Latin America Essential Oils Market Revenue (US$ Mn) Comparison by Product (2016-2032)
- Figure 117: Latin America Essential Oils Market Revenue (US$ Mn) Comparison by Application (2016-2032)
- Figure 118: Latin America Essential Oils Market Revenue (US$ Mn) Comparison by Distribution Channel (2016-2032)
- Figure 119: Latin America Essential Oils Market Y-o-Y Growth Rate Comparison by Country (2016-2032)
- Figure 120: Latin America Essential Oils Market Y-o-Y Growth Rate Comparison by Product (2016-2032)
- Figure 121: Latin America Essential Oils Market Y-o-Y Growth Rate Comparison by Application (2016-2032)
- Figure 122: Latin America Essential Oils Market Y-o-Y Growth Rate Comparison by Distribution Channel (2016-2032)
- Figure 123: Latin America Essential Oils Market Share Comparison by Country (2016-2032)
- Figure 124: Latin America Essential Oils Market Share Comparison by Product (2016-2032)
- Figure 125: Latin America Essential Oils Market Share Comparison by Application (2016-2032)
- Figure 126: Latin America Essential Oils Market Share Comparison by Distribution Channel (2016-2032)
- Figure 127: Middle East & Africa Essential Oils Market Revenue (US$ Mn) Market Share by Productin 2022
- Figure 128: Middle East & Africa Essential Oils Market Attractiveness Analysis by Product, 2016-2032
- Figure 129: Middle East & Africa Essential Oils Market Revenue (US$ Mn) Market Share by Applicationin 2022
- Figure 130: Middle East & Africa Essential Oils Market Attractiveness Analysis by Application, 2016-2032
- Figure 131: Middle East & Africa Essential Oils Market Revenue (US$ Mn) Market Share by Distribution Channelin 2022
- Figure 132: Middle East & Africa Essential Oils Market Attractiveness Analysis by Distribution Channel, 2016-2032
- Figure 133: Middle East & Africa Essential Oils Market Revenue (US$ Mn) Market Share by Country in 2022
- Figure 134: Middle East & Africa Essential Oils Market Attractiveness Analysis by Country, 2016-2032
- Figure 135: Middle East & Africa Essential Oils Market Revenue (US$ Mn) (2016-2032)
- Figure 136: Middle East & Africa Essential Oils Market Revenue (US$ Mn) Comparison by Country (2016-2032)
- Figure 137: Middle East & Africa Essential Oils Market Revenue (US$ Mn) Comparison by Product (2016-2032)
- Figure 138: Middle East & Africa Essential Oils Market Revenue (US$ Mn) Comparison by Application (2016-2032)
- Figure 139: Middle East & Africa Essential Oils Market Revenue (US$ Mn) Comparison by Distribution Channel (2016-2032)
- Figure 140: Middle East & Africa Essential Oils Market Y-o-Y Growth Rate Comparison by Country (2016-2032)
- Figure 141: Middle East & Africa Essential Oils Market Y-o-Y Growth Rate Comparison by Product (2016-2032)
- Figure 142: Middle East & Africa Essential Oils Market Y-o-Y Growth Rate Comparison by Application (2016-2032)
- Figure 143: Middle East & Africa Essential Oils Market Y-o-Y Growth Rate Comparison by Distribution Channel (2016-2032)
- Figure 144: Middle East & Africa Essential Oils Market Share Comparison by Country (2016-2032)
- Figure 145: Middle East & Africa Essential Oils Market Share Comparison by Product (2016-2032)
- Figure 146: Middle East & Africa Essential Oils Market Share Comparison by Application (2016-2032)
- Figure 147: Middle East & Africa Essential Oils Market Share Comparison by Distribution Channel (2016-2032)
List of Tables
-
- Table 1: Global Essential Oils Market Comparison by Product (2016-2032)
- Table 2: Global Essential Oils Market Comparison by Application (2016-2032)
- Table 3: Global Essential Oils Market Comparison by Distribution Channel (2016-2032)
- Table 4: Global Essential Oils Market Revenue (US$ Mn) Comparison by Region (2016-2032)
- Table 5: Global Essential Oils Market Revenue (US$ Mn) (2016-2032)
- Table 6: Global Essential Oils Market Revenue (US$ Mn) Comparison by Region (2016-2032)
- Table 7: Global Essential Oils Market Revenue (US$ Mn) Comparison by Product (2016-2032)
- Table 8: Global Essential Oils Market Revenue (US$ Mn) Comparison by Application (2016-2032)
- Table 9: Global Essential Oils Market Revenue (US$ Mn) Comparison by Distribution Channel (2016-2032)
- Table 10: Global Essential Oils Market Y-o-Y Growth Rate Comparison by Region (2016-2032)
- Table 11: Global Essential Oils Market Y-o-Y Growth Rate Comparison by Product (2016-2032)
- Table 12: Global Essential Oils Market Y-o-Y Growth Rate Comparison by Application (2016-2032)
- Table 13: Global Essential Oils Market Y-o-Y Growth Rate Comparison by Distribution Channel (2016-2032)
- Table 14: Global Essential Oils Market Share Comparison by Region (2016-2032)
- Table 15: Global Essential Oils Market Share Comparison by Product (2016-2032)
- Table 16: Global Essential Oils Market Share Comparison by Application (2016-2032)
- Table 17: Global Essential Oils Market Share Comparison by Distribution Channel (2016-2032)
- Table 18: North America Essential Oils Market Comparison by Application (2016-2032)
- Table 19: North America Essential Oils Market Comparison by Distribution Channel (2016-2032)
- Table 20: North America Essential Oils Market Revenue (US$ Mn) Comparison by Country (2016-2032)
- Table 21: North America Essential Oils Market Revenue (US$ Mn) (2016-2032)
- Table 22: North America Essential Oils Market Revenue (US$ Mn) Comparison by Country (2016-2032)
- Table 23: North America Essential Oils Market Revenue (US$ Mn) Comparison by Product (2016-2032)
- Table 24: North America Essential Oils Market Revenue (US$ Mn) Comparison by Application (2016-2032)
- Table 25: North America Essential Oils Market Revenue (US$ Mn) Comparison by Distribution Channel (2016-2032)
- Table 26: North America Essential Oils Market Y-o-Y Growth Rate Comparison by Country (2016-2032)
- Table 27: North America Essential Oils Market Y-o-Y Growth Rate Comparison by Product (2016-2032)
- Table 28: North America Essential Oils Market Y-o-Y Growth Rate Comparison by Application (2016-2032)
- Table 29: North America Essential Oils Market Y-o-Y Growth Rate Comparison by Distribution Channel (2016-2032)
- Table 30: North America Essential Oils Market Share Comparison by Country (2016-2032)
- Table 31: North America Essential Oils Market Share Comparison by Product (2016-2032)
- Table 32: North America Essential Oils Market Share Comparison by Application (2016-2032)
- Table 33: North America Essential Oils Market Share Comparison by Distribution Channel (2016-2032)
- Table 34: Western Europe Essential Oils Market Comparison by Product (2016-2032)
- Table 35: Western Europe Essential Oils Market Comparison by Application (2016-2032)
- Table 36: Western Europe Essential Oils Market Comparison by Distribution Channel (2016-2032)
- Table 37: Western Europe Essential Oils Market Revenue (US$ Mn) Comparison by Country (2016-2032)
- Table 38: Western Europe Essential Oils Market Revenue (US$ Mn) (2016-2032)
- Table 39: Western Europe Essential Oils Market Revenue (US$ Mn) Comparison by Country (2016-2032)
- Table 40: Western Europe Essential Oils Market Revenue (US$ Mn) Comparison by Product (2016-2032)
- Table 41: Western Europe Essential Oils Market Revenue (US$ Mn) Comparison by Application (2016-2032)
- Table 42: Western Europe Essential Oils Market Revenue (US$ Mn) Comparison by Distribution Channel (2016-2032)
- Table 43: Western Europe Essential Oils Market Y-o-Y Growth Rate Comparison by Country (2016-2032)
- Table 44: Western Europe Essential Oils Market Y-o-Y Growth Rate Comparison by Product (2016-2032)
- Table 45: Western Europe Essential Oils Market Y-o-Y Growth Rate Comparison by Application (2016-2032)
- Table 46: Western Europe Essential Oils Market Y-o-Y Growth Rate Comparison by Distribution Channel (2016-2032)
- Table 47: Western Europe Essential Oils Market Share Comparison by Country (2016-2032)
- Table 48: Western Europe Essential Oils Market Share Comparison by Product (2016-2032)
- Table 49: Western Europe Essential Oils Market Share Comparison by Application (2016-2032)
- Table 50: Western Europe Essential Oils Market Share Comparison by Distribution Channel (2016-2032)
- Table 51: Eastern Europe Essential Oils Market Comparison by Product (2016-2032)
- Table 52: Eastern Europe Essential Oils Market Comparison by Application (2016-2032)
- Table 53: Eastern Europe Essential Oils Market Comparison by Distribution Channel (2016-2032)
- Table 54: Eastern Europe Essential Oils Market Revenue (US$ Mn) Comparison by Country (2016-2032)
- Table 55: Eastern Europe Essential Oils Market Revenue (US$ Mn) (2016-2032)
- Table 56: Eastern Europe Essential Oils Market Revenue (US$ Mn) Comparison by Country (2016-2032)
- Table 57: Eastern Europe Essential Oils Market Revenue (US$ Mn) Comparison by Product (2016-2032)
- Table 58: Eastern Europe Essential Oils Market Revenue (US$ Mn) Comparison by Application (2016-2032)
- Table 59: Eastern Europe Essential Oils Market Revenue (US$ Mn) Comparison by Distribution Channel (2016-2032)
- Table 60: Eastern Europe Essential Oils Market Y-o-Y Growth Rate Comparison by Country (2016-2032)
- Table 61: Eastern Europe Essential Oils Market Y-o-Y Growth Rate Comparison by Product (2016-2032)
- Table 62: Eastern Europe Essential Oils Market Y-o-Y Growth Rate Comparison by Application (2016-2032)
- Table 63: Eastern Europe Essential Oils Market Y-o-Y Growth Rate Comparison by Distribution Channel (2016-2032)
- Table 64: Eastern Europe Essential Oils Market Share Comparison by Country (2016-2032)
- Table 65: Eastern Europe Essential Oils Market Share Comparison by Product (2016-2032)
- Table 66: Eastern Europe Essential Oils Market Share Comparison by Application (2016-2032)
- Table 67: Eastern Europe Essential Oils Market Share Comparison by Distribution Channel (2016-2032)
- Table 68: APAC Essential Oils Market Comparison by Product (2016-2032)
- Table 69: APAC Essential Oils Market Comparison by Application (2016-2032)
- Table 70: APAC Essential Oils Market Comparison by Distribution Channel (2016-2032)
- Table 71: APAC Essential Oils Market Revenue (US$ Mn) Comparison by Country (2016-2032)
- Table 72: APAC Essential Oils Market Revenue (US$ Mn) (2016-2032)
- Table 73: APAC Essential Oils Market Revenue (US$ Mn) Comparison by Country (2016-2032)
- Table 74: APAC Essential Oils Market Revenue (US$ Mn) Comparison by Product (2016-2032)
- Table 75: APAC Essential Oils Market Revenue (US$ Mn) Comparison by Application (2016-2032)
- Table 76: APAC Essential Oils Market Revenue (US$ Mn) Comparison by Distribution Channel (2016-2032)
- Table 77: APAC Essential Oils Market Y-o-Y Growth Rate Comparison by Country (2016-2032)
- Table 78: APAC Essential Oils Market Y-o-Y Growth Rate Comparison by Product (2016-2032)
- Table 79: APAC Essential Oils Market Y-o-Y Growth Rate Comparison by Application (2016-2032)
- Table 80: APAC Essential Oils Market Y-o-Y Growth Rate Comparison by Distribution Channel (2016-2032)
- Table 81: APAC Essential Oils Market Share Comparison by Country (2016-2032)
- Table 82: APAC Essential Oils Market Share Comparison by Product (2016-2032)
- Table 83: APAC Essential Oils Market Share Comparison by Application (2016-2032)
- Table 84: APAC Essential Oils Market Share Comparison by Distribution Channel (2016-2032)
- Table 85: Latin America Essential Oils Market Comparison by Product (2016-2032)
- Table 86: Latin America Essential Oils Market Comparison by Application (2016-2032)
- Table 87: Latin America Essential Oils Market Comparison by Distribution Channel (2016-2032)
- Table 88: Latin America Essential Oils Market Revenue (US$ Mn) Comparison by Country (2016-2032)
- Table 89: Latin America Essential Oils Market Revenue (US$ Mn) (2016-2032)
- Table 90: Latin America Essential Oils Market Revenue (US$ Mn) Comparison by Country (2016-2032)
- Table 91: Latin America Essential Oils Market Revenue (US$ Mn) Comparison by Product (2016-2032)
- Table 92: Latin America Essential Oils Market Revenue (US$ Mn) Comparison by Application (2016-2032)
- Table 93: Latin America Essential Oils Market Revenue (US$ Mn) Comparison by Distribution Channel (2016-2032)
- Table 94: Latin America Essential Oils Market Y-o-Y Growth Rate Comparison by Country (2016-2032)
- Table 95: Latin America Essential Oils Market Y-o-Y Growth Rate Comparison by Product (2016-2032)
- Table 96: Latin America Essential Oils Market Y-o-Y Growth Rate Comparison by Application (2016-2032)
- Table 97: Latin America Essential Oils Market Y-o-Y Growth Rate Comparison by Distribution Channel (2016-2032)
- Table 98: Latin America Essential Oils Market Share Comparison by Country (2016-2032)
- Table 99: Latin America Essential Oils Market Share Comparison by Product (2016-2032)
- Table 100: Latin America Essential Oils Market Share Comparison by Application (2016-2032)
- Table 101: Latin America Essential Oils Market Share Comparison by Distribution Channel (2016-2032)
- Table 102: Middle East & Africa Essential Oils Market Comparison by Product (2016-2032)
- Table 103: Middle East & Africa Essential Oils Market Comparison by Application (2016-2032)
- Table 104: Middle East & Africa Essential Oils Market Comparison by Distribution Channel (2016-2032)
- Table 105: Middle East & Africa Essential Oils Market Revenue (US$ Mn) Comparison by Country (2016-2032)
- Table 106: Middle East & Africa Essential Oils Market Revenue (US$ Mn) (2016-2032)
- Table 107: Middle East & Africa Essential Oils Market Revenue (US$ Mn) Comparison by Country (2016-2032)
- Table 108: Middle East & Africa Essential Oils Market Revenue (US$ Mn) Comparison by Product (2016-2032)
- Table 109: Middle East & Africa Essential Oils Market Revenue (US$ Mn) Comparison by Application (2016-2032)
- Table 110: Middle East & Africa Essential Oils Market Revenue (US$ Mn) Comparison by Distribution Channel (2016-2032)
- Table 111: Middle East & Africa Essential Oils Market Y-o-Y Growth Rate Comparison by Country (2016-2032)
- Table 112: Middle East & Africa Essential Oils Market Y-o-Y Growth Rate Comparison by Product (2016-2032)
- Table 113: Middle East & Africa Essential Oils Market Y-o-Y Growth Rate Comparison by Application (2016-2032)
- Table 114: Middle East & Africa Essential Oils Market Y-o-Y Growth Rate Comparison by Distribution Channel (2016-2032)
- Table 115: Middle East & Africa Essential Oils Market Share Comparison by Country (2016-2032)
- Table 116: Middle East & Africa Essential Oils Market Share Comparison by Product (2016-2032)
- Table 117: Middle East & Africa Essential Oils Market Share Comparison by Application (2016-2032)
- Table 118: Middle East & Africa Essential Oils Market Share Comparison by Distribution Channel (2016-2032)
- 1. Executive Summary
-
- GrainCorp (Australia)
- Malteurop (France)
- Rahr Corporation (US)
- Boortmalt (Belgium)
- Indesso (Spain)
- Lipoid Kosmetic AG,(Germany)
- The Herbarie at Stoney Hill Farm Inc.(U.S)
- International Flavors& Fragrances Inc.(Netherlands)
- Bell Flavors& Fragrances (france)
- Rutland Biodynamics Ltd. (Scotland)
- Prakruti Products Pvt. Ltd (India)
- AmbePhytoextractsPvt. Ltd. (Austria)
- The Green Labs LLC (Nethelands)
- Berje Inc.(Italy)
- Umalaxmi Organics Pvt. Ltd.(India)
- DSM (Netherlands)
Our Clients


View Our Licence Options
