
Erythropoietin Drugs Market Report By Type (Biologics, Biosimilars), By Product (Erythropoietin, Darbepoetin-alfa), By Application (Renal Diseases, Cancer, Neurology, Others), By Region and Companies - Industry Segment Outlook, Market Assessment, Competition Scenario, Trends and Forecast 2024-2033
-
2702
-
March 2024
-
175
-


-
This report was compiled by Trishita Deb Trishita Deb is an experienced market research and consulting professional with over 7 years of expertise across healthcare, consumer goods, and materials, contributing to over 400 healthcare-related reports. Correspondence Team Lead- Healthcare Linkedin | Detailed Market research Methodology Our methodology involves a mix of primary research, including interviews with leading mental health experts, and secondary research from reputable medical journals and databases. View Detailed Methodology Page
-
Quick Navigation
Report Overview
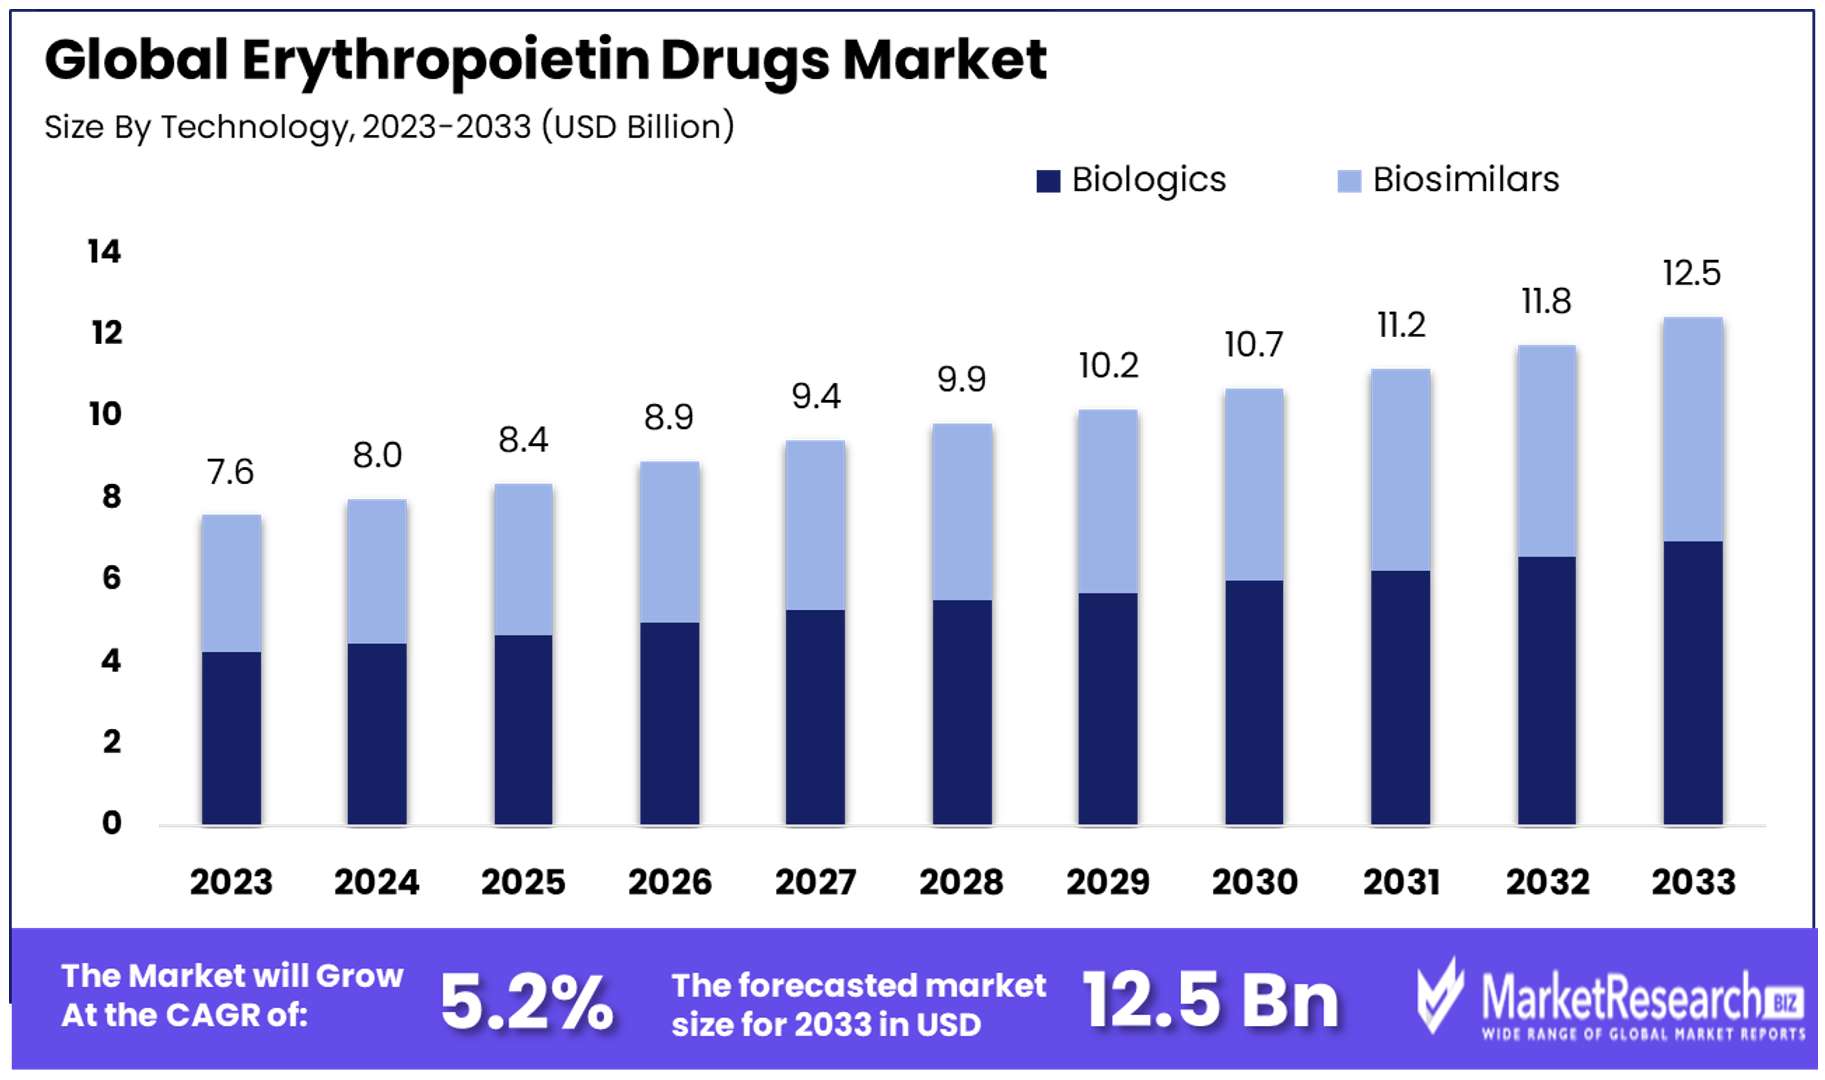
The Global Erythropoietin Drugs Market size is expected to be worth around USD 12.5 Billion by 2033, from USD 7.6 Billion in 2023, growing at a CAGR of 5.20% during the forecast period from 2024 to 2033.
The surge in anaemia related disorders and rise in new innovative in the biotechnology and research and developments are some of the main key driving factors for the Erythropoietin drug market.
Erythropoietin drug is defined as the glycoprotein hormone and a therapeutic drug that are used to stimulate the production of red blood cells in the bone marrow. It plays an important role in upholding the body’s oxygen carrying capacity.
EPO is naturally generated by the kidneys with response to the low oxygen levels in the blood. Recombinant human erythropoietin is a type of synthetic form of EPO that is used medically, particularly in the treatment of anaemia related with the chronic kidney diseases, cancer chemotherapy and some of the other conditions that affects the red blood cells productions.
These drugs are bind to particular receptors on the surface of red blood cells pioneers, stimulating their propagations and discrepancies. This has led to an augmented productions of mature red blood cells, enhancing the oxygen carrying capacity of the blood.
EPO therapy is prudently administered under medical supervision as improper use and more usage of doses can lead to severe risk like hypertension and thrombotic events. Furthermore, its therapeutic advantages, EPO has also being related with misuse in sports to improve athletic performance by lead to regulatory measures and supervising in competitive settings.
According to an article published by kidney research UK in June 2022, highlights that Anaemia is the serious medical conditions that is caused due to insufficient red blood cells and low levels of haemoglobin that causes tiredness and other severe symptoms. It is a common early complication of chronic kidney disease that affects an estimated 75,000 adults in England and Wales. Moreover, the kidneys help to control the production of the red blood cells with a hormone known as erythropoietin.
Additionally, according to an article published by Medicalxpress in July 2023, highlights that globally in 2021, 31.2% of women had Anaemia compared with 17.5% of the men, whereas in women there is 33.7% versus 11.3% in men. There are in total 825 million women and 444 million men affected globally which is 66.2%.
Erythropoietin have great importance in medical applications that supports in the treatment of anaemia related with several conditions. These roles in provokes the red blood cell productions which is important for managing anaemia associated to chronic illnesses by making enhanced oxygen transport and augment quality of life for the patients undergoing treatments such as chemotherapy or experiencing kidney related complications.
The demand for the erythropoietin will increase due to its requirement in different medical hubs that will help in market expansion in the coming years.
Key Takeaways
- Market Value: The Global Erythropoietin Drugs Market is anticipated to reach USD 12.5 Billion by 2033, growing at a CAGR of 5.20% during the forecast period from 2024 to 2033, up from USD 7.6 Billion in 2023.
- Major Segments:
- By Type: Biologics hold a commanding market share of 56%, showcasing trust and reliability due to proven efficacy and safety records. Biosimilars are emerging as a strong segment, focusing on cost-efficiency and expanding access to treatment.
- By Product: Erythropoietin accounts for 76.9% of the market share, widely utilized in managing anemia across various conditions. Darbepoetin-alfa, offering dosing advantages, occupies a smaller but significant market share.
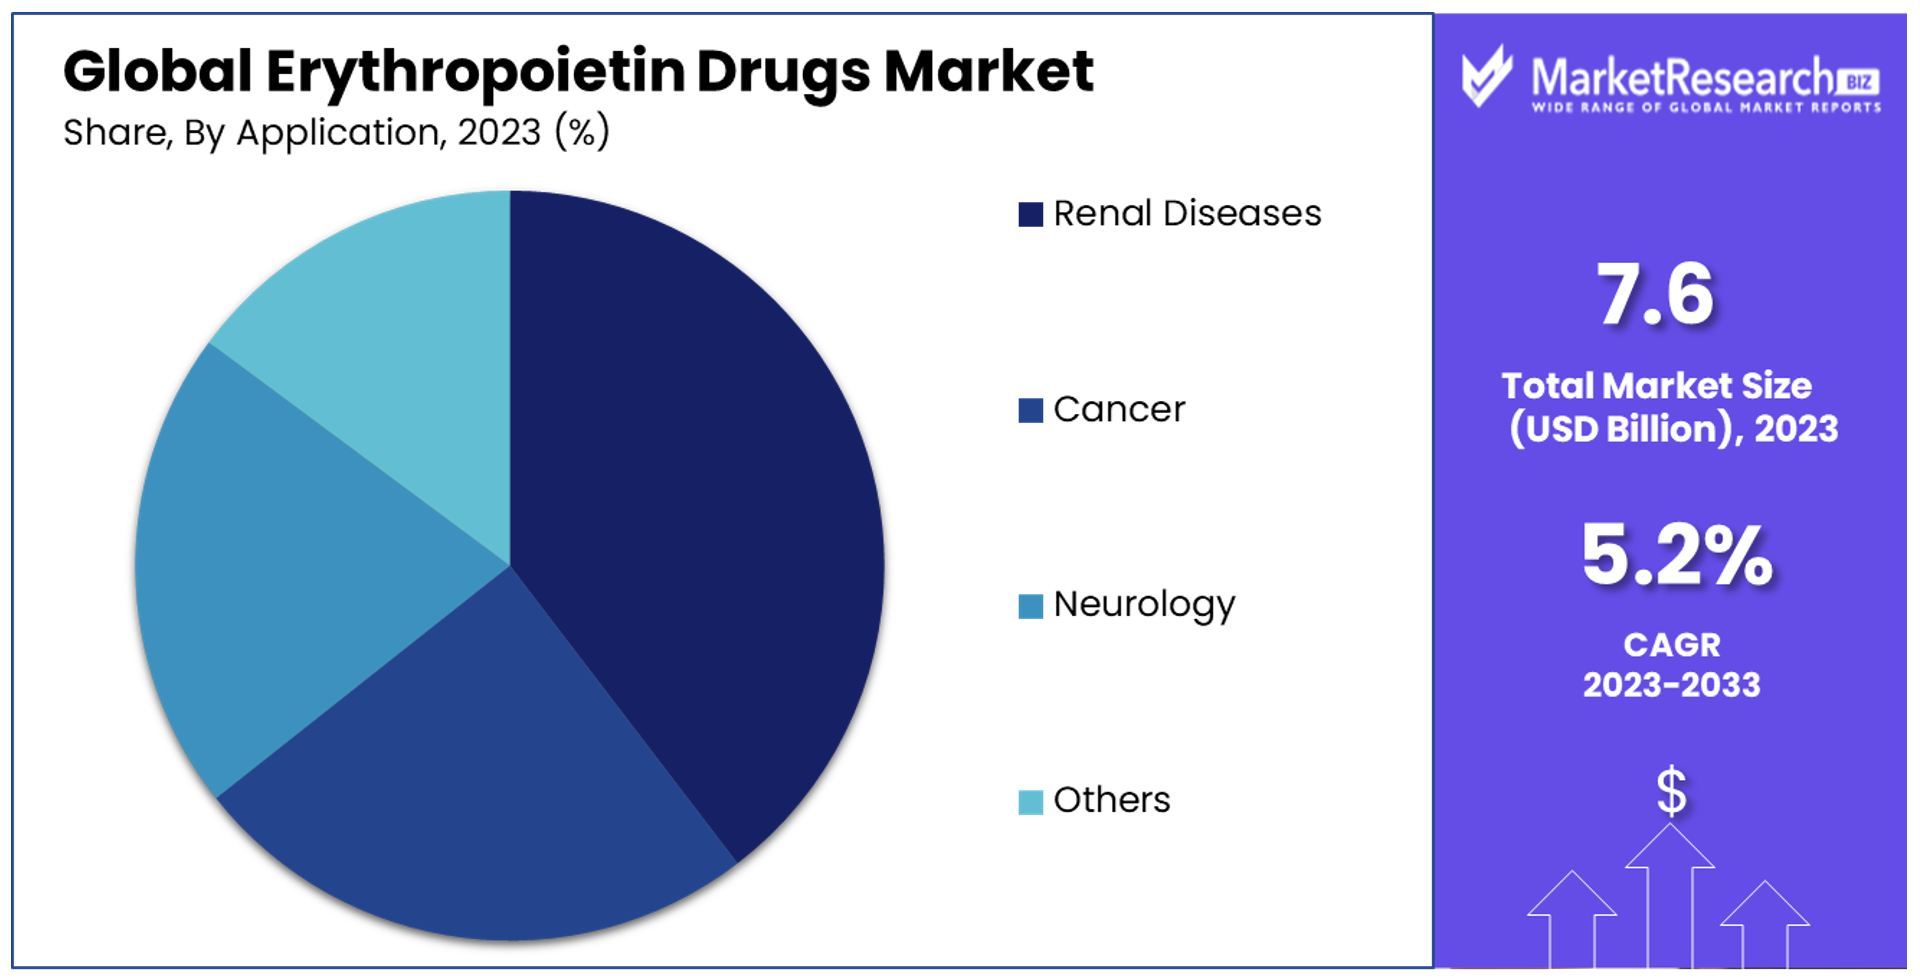
- By Application: Renal Diseases dominate with 40.5% market share, followed by Cancer and Neurology. The versatility of EPO drugs is evident, with potential growth opportunities in various therapeutic areas.
- Regional Analysis: North America leads with a 43.2% market share, followed by Europe. Europe's emphasis on healthcare accessibility and support for biosimilars contribute to its significant market presence.
- Key Players: Major players in the market include Amgen, Johnson & Johnson, Roche Ltd., Pfizer, Biocon, Teva Pharmaceutical, among others.
- Analyst Viewpoint: The market is poised for growth, driven by increasing prevalence of chronic diseases, expanding applications of EPO drugs, and emphasis on cost-effective treatment solutions.
- Growth Opportunities: Expansion into emerging markets, further development of biosimilar alternatives, and exploration of novel therapeutic applications present significant growth opportunities for players in the Erythropoietin Drugs Market in the forecast period.
Driving Factors
Chronic Kidney Disease and End-Stage Renal Disease Prevalence Fuel EPO Drugs Market Expansion
The Erythropoietin (EPO) Drugs Market is witnessing significant growth rate, primarily driven by the rising prevalence of Chronic Kidney Disease (CKD) and End-Stage Renal Disease (ESRD). With over 35.5 million Americans (more than 1 in 7 adults) affected by CKD, as reported by the CDC, the demand for EPO drugs, crucial in treating anemia linked to these conditions, is surging.
The escalation of diabetes and hypertension, leading causes of CKD and ESRD, further compounds this demand. This trend underscores the critical need for EPO drugs, marking a direct correlation between disease prevalence and market growth.
Growing Cancer Incidence Elevates Demand for EPO Drugs
The EPO Drugs Market is also propelled by the increasing prevalence of cancer globally. With the American Cancer Society estimating around 1.9 million new cancer cases in the US in 2022, the need for EPO drugs to manage chemotherapy and radiation-induced anemia is on the rise.
This growing patient pool necessitates expanded use of EPO therapies, highlighting the direct impact of cancer incidence on the market's expansion. The demand dynamics shows a crucial role between cancer treatment requirements and EPO drug utilization, reinforcing the market's growth trajectory in the forecast period.
Innovations in Biopharmaceutical R&D Drive Market Advancements
Advancements in biopharmaceutical research and development significantly contribute to the EPO Drugs Market's growth. Innovations leading to novel and improved EPO drug forms, such as biosimilars and longer-acting formulations, enhance treatment efficacy, safety, and patient convenience.
Companies like Amgen and Kyowa Kirin are at the forefront, developing long-acting EPO biosimilars that broaden treatment options. These R&D breakthroughs not only cater to evolving patient needs but also signal the market's capacity for growth through technological advancement.
Expanded Healthcare Access and Favorable Reimbursement Policies Boost Market Accessibility
The expansion of healthcare access and favorable reimbursement policies are a key market drivers in enhancing the EPO Drugs Market's accessibility. Medicare coverage in the US for EPO therapy for CKD and ESRD patients, along with the recent market approval of Efepoetin alfa in Indonesia, exemplify how policy and regulatory frameworks can drive drug adoption.
These developments make EPO drugs more affordable and accessible, underpinning market growth. The interconnection of healthcare policy, insurance coverage, and market approvals emphasizes a comprehensive ecosystem facilitating the EPO Drugs Market's expansion.
Restraining Factors
Safety Concerns and Adverse Effects Restrain Market Growth
Safety concerns and adverse effects associated with Erythropoietin (EPO) drugs present significant challenges to market growth. The U.S. Food and Drug Administration (FDA)'s 2011 safety communication highlighted the risks of cardiovascular events like stroke and heart attack, especially in patients with chronic kidney disease (CKD) using Erythropoiesis-Stimulating Agents (ESAs) at higher doses.
These risks can deter healthcare providers and patients from opting for EPO drug therapies, affecting their widespread adoption. The potential for serious side effects necessitates careful patient selection and monitoring, creating hurdles in the therapeutic use of EPO drugs and limiting their market expansion.
Stringent Regulatory Guidelines and Reimbursement Policies Limit Market Access
The complex regulatory landscape and reimbursement frameworks significantly impact the Erythropoietin (EPO) Drugs Market. Stringent guidelines by regulatory bodies like the European Medicines Agency (EMA) ensure drug safety and efficacy but can also delay the introduction of new EPO drugs to the market.
These regulatory hurdles, combined with varying reimbursement policies across regions, pose challenges to market entry for new products and restrict patient access to these therapies. The necessity to navigate through rigorous approval processes and the uncertainty around insurance coverage can discourage manufacturers and limit the availability of innovative EPO treatments, constraining market growth.
Type Analysis
In the Erythropoietin Drugs Industry, the "By Type" segment is primarily divided into Biologics and Biosimilars. Biologics, with a commanding market share of 56%, stand as the dominant sub-segment forecast period. They show a notable dominance in the market, reflect a preference rooted in their proven efficacy and established safety records over the years.
These original EPO drugs have been the cornerstone of treatment for anemia associated with various medical conditions, including chronic kidney disease and cancer. The trust and reliability in biologics are attributed to extensive clinical trials and years of successful patient outcomes.
Biosimilars, on the other hand, are emerging as a strong segment within the market. With a focus on cost-efficiency and expanding access to treatment, biosimilars are gradually gaining traction among healthcare providers and patients alike. As the healthcare industry continues to seek more affordable solutions without compromising on quality, biosimilars represent a vital growth area. Their increasing market presence is further supported by the expiration of patents for many biologic drugs, enabling the introduction of biosimilar alternatives that promise similar therapeutic benefits at lower costs.
Product Analysis
In the "By Product" segment, Erythropoietin holds a substantial majority with 76.9% of the market share, making it the most utilized product in the Erythropoietin Drugs Market. This dominance is largely due to its widespread application in managing anemia across a range of conditions, most notably in patients with renal diseases and cancer. Erythropoietin's ability to effectively stimulate red blood cell production has made it a fundamental component of treatment regimens, improving the quality of life for millions of patients worldwide.
Darbepoetin-alfa, as a longer-acting EPO drug, offers a distinct advantage in terms of dosing frequency, allowing patients to maintain stable hemoglobin levels with less frequent injections. While it occupies a smaller market share compared to erythropoietin, darbepoetin-alfa's role in providing enhanced patient convenience and compliance underscores its importance within the market. The choice between erythropoietin and darbepoetin-alfa often depends on clinical considerations and patient preferences, highlighting the market's ability to cater to diverse treatment needs.
Application Analysis
The "By Application" segment showcases Renal Diseases as the dominant sub-segment, accounting for 40.5% of the market. This can be attributed to the high prevalence of CKD and ESRD globally. The role of EPO drugs in managing anemia, a common complication in patients with kidney diseases, is well-established, making them indispensable in clinical practice. This segment's dominance is a direct reflection of the ongoing need to address the complications associated with renal diseases, which affect millions of individuals worldwide.
The application of EPO drugs in Cancer and Neurology also represents significant segments, driven by the need to manage anemia resulting from chemotherapy and radiation therapy, as well as their potential therapeutic benefits in neurological conditions. These segments illustrate the versatility of EPO drugs and their expanding role beyond traditional applications. The "Others" category encompasses a broad range of conditions where EPO drugs may offer therapeutic benefits, indicating the potential for future growth as research continues to uncover new applications.
Key Market Segments
By Type
- Biologics
- Biosimilars
By Product
- Erythropoietin
- Darbepoetin-alfa
By Application
- Renal Diseases
- Cancer
- Neurology
- Others
Growth Opportunities
Development of Targeted EPO Therapies Offers Growth Opportunity
The innovation in developing targeted Erythropoietin (EPO) therapies presents a significant growth opportunity within the EPO drugs market. By focusing on specific patient populations or disease conditions, these therapies can potentially offer enhanced efficacy and improved safety profiles. Tailoring formulations or delivery mechanisms to address unmet medical needs not only fills a crucial gap in patient care but also positions EPO drugs as a more attractive option for healthcare providers.
The exploration into tissue-specific targeting aims to minimize adverse effects, making EPO treatment safer and more effective for patients with specific conditions. This approach could lead to the expansion of the EPO drugs market by broadening the spectrum of treatable conditions and patient demographics.
Expansion into Emerging Markets Offers Growth Opportunity
The expansion into emerging markets like China, India, and Brazil unlocks significant growth opportunities for the EPO drugs market. These regions are characterized by rapid economic growth, improvements in healthcare infrastructure, and increased access to medical services, driving up the demand for EPO drugs.
To capitalize on this opportunity, addressing the challenges of affordability and access is essential. Making EPO drugs more accessible in these markets involves strategic pricing, partnerships with local healthcare providers, and navigating regulatory landscapes. Successfully penetrating these markets could substantially increase the patient base for EPO drugs, contributing to the global growth of the market.
Trending Factors
Biosimilar EPO Drugs Are Trending Factors
The emergence of biosimilar EPO drugs marks a pivotal trend in the market. As patents on branded EPO drugs expire, biosimilars enter the scene, offering more cost-effective alternatives. This shift not only enhances treatment affordability but also intensifies market competition, encouraging innovation and driving down prices.
The introduction of biosimilars broadens access to essential medications for a larger patient population, significantly impacting the market dynamics by making treatment options more accessible to those in need. This trend is reshaping the EPO drugs market landscape, promising to extend the reach of therapies and improve patient access worldwide.
Patient-Centric Approaches Are Trending Factors
The focus on patient-centric approaches within the EPO drugs market signifies a major trend aimed at improving patient experiences and outcomes. Pharmaceutical companies are innovating with formulations and delivery systems that prioritize convenience and adherence.
Long-acting EPO formulations that reduce the need for frequent dosing, alongside alternative administration routes like subcutaneous injections or potentially oral options, are in development. These advancements cater to patient preferences and lifestyle needs, enhancing the overall treatment journey. By emphasizing patient comfort and compliance, this trend is set to drive higher satisfaction and better therapeutic results, contributing to market growth and patient well-being.
Digital Health Integration Are Trending Factors
Digital health integration represents a significant trend in the EPO drugs market, leveraging technology to enhance patient care. Mobile applications, wearable devices, and telemedicine platforms are being increasingly utilized to monitor patient health, ensure adherence to treatment regimens, and facilitate remote healthcare services.
This trend enhances the management of diseases treated with EPO drugs by offering real-time data and insights, improving communication between patients and healthcare providers, and enabling personalized care plans. As digital health technologies continue to evolve, their integration into the EPO drugs market is expected to improve outcomes, patient engagement, and accessibility to care, marking a transformative shift in how treatments are administered and monitored.
Regional Analysis
North America Dominates with 43.2% Market Share
North America holds a largest share with 43.2% of the Erythropoietin Drugs Market, underpinned by robust healthcare infrastructure, high healthcare spending, and a strong focus on research and development. This region's dominance is further supported by the prevalence of anemia and chronic diseases such as cancer and kidney disease, which require EPO drug therapies. Additionally, the presence of leading pharmaceutical companies and a favorable regulatory environment contribute to North America's leading position.
Market dynamics in North America are influenced by patient access to advanced healthcare, significant investment in biotechnology, and the adoption of innovative treatment options. The region's comprehensive insurance coverage and emphasis on improving patient outcomes play vital roles in supporting the market's growth.
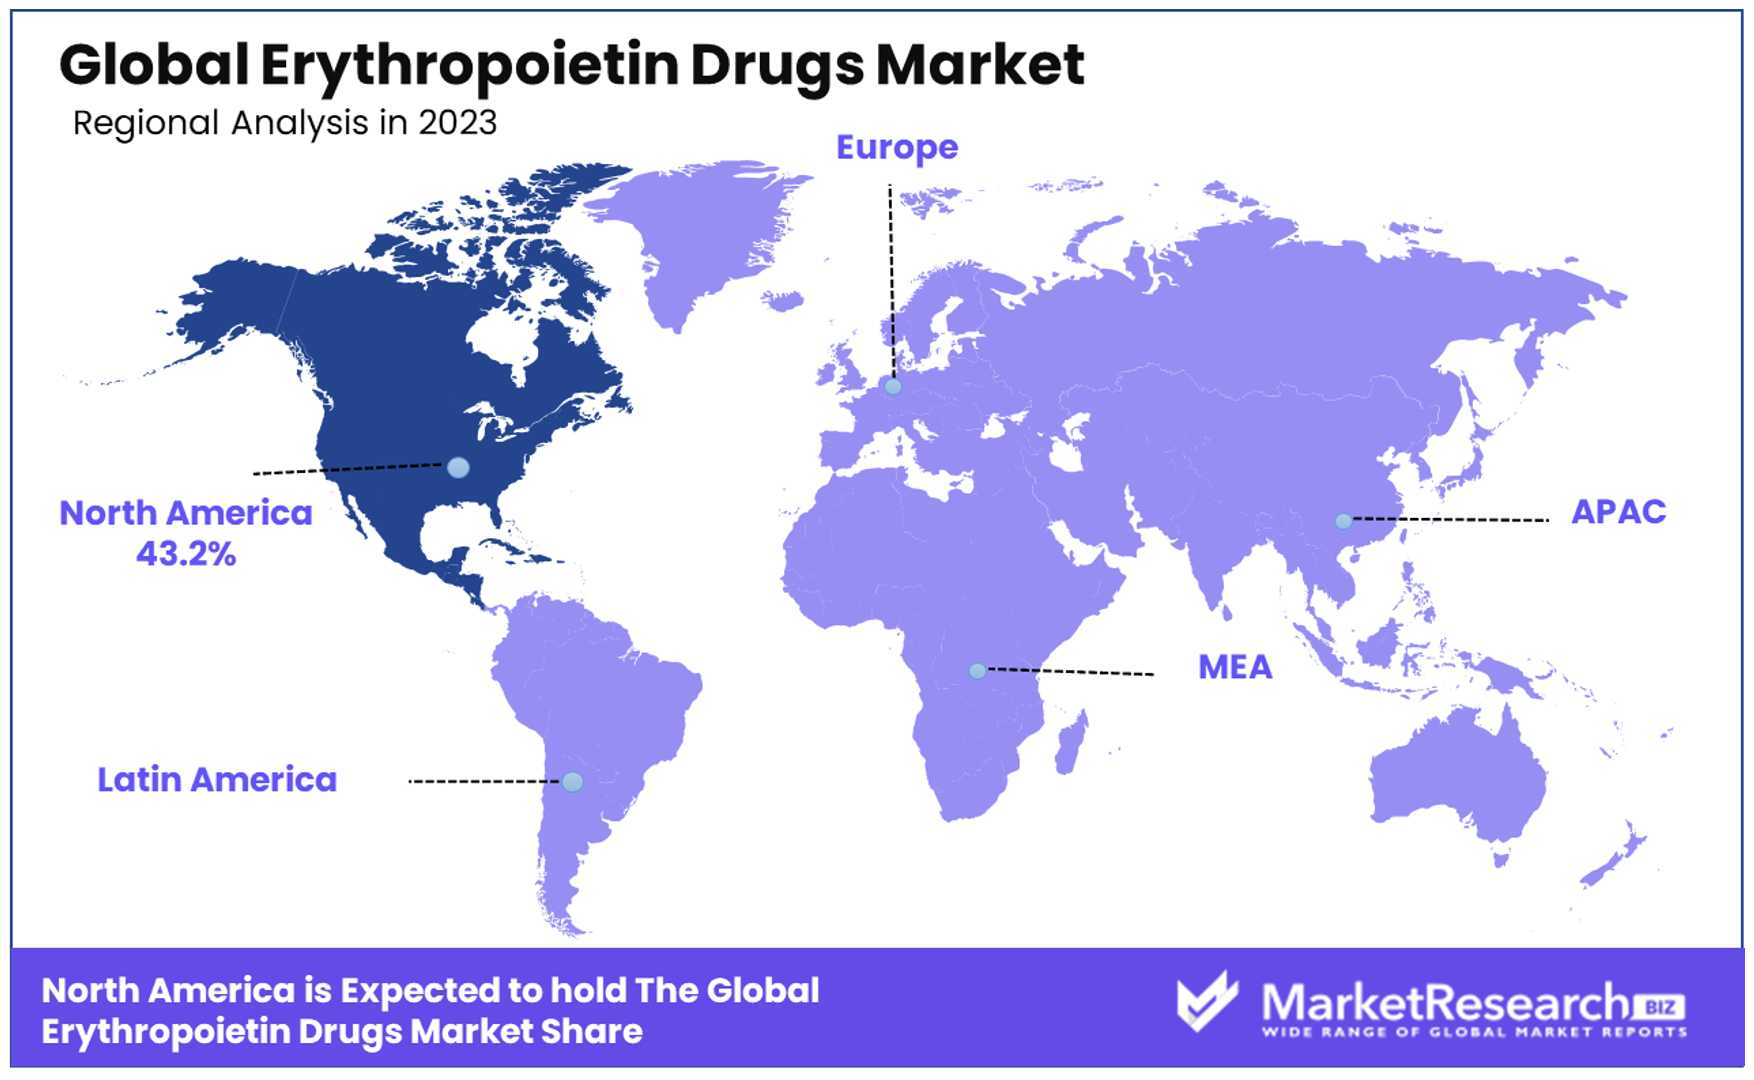
- Europe: Europe follows North America with a significant market share, attributed to advanced healthcare systems, increasing prevalence of chronic diseases, and strong support for biosimilars. Europe's emphasis on healthcare accessibility and cost-effectiveness promotes the adoption of EPO drugs.
- Asia Pacific: This region is experiencing rapid growth in the Erythropoietin Drugs Market, driven by economic development, expanding healthcare infrastructure, and rising healthcare awareness. The Asia Pacific market benefits from a large patient population and increasing healthcare expenditures in the forecast period.
- Middle East & Africa: While holding a smaller share of the global market, the Middle East & Africa region shows potential for growth. Factors such as improving healthcare facilities, rising chronic disease prevalence, and government initiatives to enhance healthcare accessibility contribute to the market's expansion in this region.
- Latin America: Latin America's market share is growing due to improving healthcare access, increased public health initiatives, and a rising burden of chronic diseases. The region's focus on healthcare reform and investment in healthcare infrastructure supports the market growth of EPO drugs.
Key Regions and Countries
- North America
- The US
- Canada
- Mexico
- Western Europe
- Germany
- France
- The UK
- Spain
- Italy
- Portugal
- Ireland
- Austria
- Switzerland
- Benelux
- Nordic
- Rest of Western Europe
- Eastern Europe
- Russia
- Poland
- The Czech Republic
- Greece
- Rest of Eastern Europe
- APAC
- China
- Japan
- South Korea
- India
- Australia & New Zealand
- Indonesia
- Malaysia
- Philippines
- Singapore
- Thailand
- Vietnam
- Rest of APAC
- Latin America
- Brazil
- Colombia
- Chile
- Argentina
- Costa Rica
- Rest of Latin America
- Middle East & Africa
- Algeria
- Egypt
- Israel
- Kuwait
- Nigeria
- Saudi Arabia
- South Africa
- Turkey
- United Arab Emirates
- Rest of MEA
Key Players Analysis
In the Erythropoietin Drugs Market, key players typically exhibit strong research and development capabilities, contributing to the advancement of both biologics and biosimilars. These companies often have a strategic initiatives and global presence, enabling them to navigate diverse regulatory environments and market their products across different regions effectively. Market influence is exerted through innovation in drug formulations, delivery methods, and patient-centric approaches, enhancing treatment efficacy and user convenience.
Amgen, Johnson & Johnson, and Roche Ltd. are prominent contenders, leveraging their established market presence and extensive resources to maintain significant market share. These companies often lead in research, development, and distribution.
Pfizer, Biocon, Teva Pharmaceutical Industries Ltd., and Kyowa Kirin follow closely, strategically positioning themselves through innovation and strategic partnerships. They continuously seek to expand their product portfolios and strengthen their market influence.
LG Life, Thermo Fisher Scientific, and F. Hoffmann La Roche contribute with their expertise in biotechnology and pharmaceuticals, enhancing the overall growth and development of the market.
Sandoz International GmbH, 3SBio Inc., Probiomed, Intas Pharmaceuticals, Dr. Reddy's Laboratories, and Celltrion Inc. are notable players known for their focus on biosimilars, offering cost-effective alternatives and driving competition within the market.
Hospira Inc., Watson Pharmaceuticals, GlycoMimetics Inc., and Akebia Therapeutics also play significant roles, contributing to market dynamics through their specialized offerings and strategic maneuvers.
Market Key Players
- Amgen Inc.
- Johnson & Johnson
- F. Hoffmann-La Roche Ltd.
- Pfizer
- Biocon
- Teva Pharmaceutical Industries Ltd.
- Kyowa Kirin
- LG Life Sciences Ltd.
- Thermo Fisher Scientific
- Sandoz International GmbH
- 3SBio Inc.
- Probiomed
- Intas Pharmaceuticals Ltd.
- Dr. Reddy's Laboratories
- Celltrion Inc.
- Hospira Inc.
- Watson Pharmaceuticals
- GlycoMimetics Inc.
- Akebia Therapeutics
Recent Developments
- On March 2022, Zydus Lifesciences Ltd has received approval from the Drug Controller General of India (DCGI) for OxemiaTM (Desidustat), an oral drug designed to treat anemia associated with chronic kidney diseases (CKD). This approval marks a significant milestone as OxemiaTM is the first-of-its-kind oral treatment in India for this condition.
- On October 2023, Genexine and KGbio received the first market approval for a novel long-acting Erythropoietin, Efepoetin alfa, from The Indonesian Food and Drug Authority (BPOM) as reported by various sources. Efepoetin alfa is a recombinant human erythropoietin that has been co-developed by Genexine and KGbio for CKD patients in both non-dialysis and dialysis settings.
- On February 2023, the U.S. Food and Drug Administration (FDA) approved Jesduvroq tablets (daprodustat) as the first oral treatment for anemia caused by chronic kidney disease in adults on dialysis. Jesduvroq works by increasing erythropoietin levels in patients with chronic kidney disease on dialysis, addressing the reduced red blood cell production caused by this condition.
Report Scope
Report Features Description Market Value (2023) USD 7.6 Billion Forecast Revenue (2033) USD 12.5 Billion CAGR (2024-2033) 5.20% Base Year for Estimation 2023 Historic Period 2018-2023 Forecast Period 2024-2033 Report Coverage Revenue Forecast, Market Dynamics, Competitive Landscape, Recent Developments Segments Covered By Type (Biologics, Biosimilars), By Product (Erythropoietin, Darbepoetin-alfa), By Application (Renal Diseases, Cancer, Neurology, Others) Regional Analysis North America - The US, Canada, & Mexico; Western Europe - Germany, France, The UK, Spain, Italy, Portugal, Ireland, Austria, Switzerland, Benelux, Nordic, & Rest of Western Europe; Eastern Europe - Russia, Poland, The Czech Republic, Greece, & Rest of Eastern Europe; APAC - China, Japan, South Korea, India, Australia & New Zealand, Indonesia, Malaysia, Philippines, Singapore, Thailand, Vietnam, & Rest of APAC; Latin America - Brazil, Colombia, Chile, Argentina, Costa Rica, & Rest of Latin America; Middle East & Africa - Algeria, Egypt, Israel, Kuwait, Nigeria, Saudi Arabia, South Africa, Turkey, United Arab Emirates, & Rest of MEA Competitive Landscape Amgen, Johnson & Johnson, Roche Ltd., Pfizer, Biocon, Teva Pharmaceutical, Kyowa Kirin, LG Life, Thermo Fisher Scientific, F. Hoffmann La Roche, Sandoz International GmbH, 3SBio Inc., Probiomed, Intas Pharmaceuticals, Dr. Reddy's Laboratories, Celltrion Inc., Hospira Inc., Watson Pharmaceuticals, GlycoMimetics Inc., Akebia Therapeutics Customization Scope Customization for segments, region/country-level will be provided. Moreover, additional customization can be done based on the requirements. Purchase Options We have three licenses to opt for: Single User License, Multi-User License (Up to 5 Users), Corporate Use License (Unlimited User and Printable PDF) -
-
- Amgen Inc.
- Johnson & Johnson
- F. Hoffmann-La Roche Ltd.
- Pfizer
- Biocon
- Teva Pharmaceutical Industries Ltd.
- Kyowa Kirin
- LG Life Sciences Ltd.
- Thermo Fisher Scientific
- F. Hoffmann La Roche
- Sandoz International GmbH
- 3SBio Inc.
- Probiomed
- Intas Pharmaceuticals Ltd.
- Dr. Reddy's Laboratories
- Celltrion Inc.
- Hospira Inc.
- Watson Pharmaceuticals
- GlycoMimetics Inc.
- Akebia Therapeutics
Our Clients


View Our Licence Options
