Global Electric Cars Market By Product Technology(Hybrid electric vehicles, Battery electric vehicles), By Components(Motor, Battery, Fuel stack, Power Conditioner, Fuel processor, On board charge, Other), By Vehicle Type(Passenger cars, Commercial vehicles), By Class(Low price, Medium price, Luxury), By Speed(More than 125MPH, Less than 125MPH), By Drive Type(Front wheel drive, Rear wheel drive), By Charging Point(Normal charging, High charging), By Connectivity(V2X, V2V, V2G), By Propulsion(PHEV, BEV, FCEV), By Application(Consumer Electronics, Mi
-
13630
-
July 2024
-
300
-


-
This report was compiled by Kalyani Khudsange Kalyani Khudsange is a Research Analyst at Prudour Pvt. Ltd. with 2.5 years of experience in market research and a strong technical background in Chemical Engineering and manufacturing. Correspondence Sr. Research Analyst Linkedin | Detailed Market research Methodology Our methodology involves a mix of primary research, including interviews with leading mental health experts, and secondary research from reputable medical journals and databases. View Detailed Methodology Page
-
Quick Navigation
- Report Overview
- Key Takeaways
- Driving factors
- Restraining Factors
- By Product Technology Analysis
- By Components Analysis
- By Vehicle Type Analysis
- By Class Analysis
- By Speed Analysis
- By Drive Type Analysis
- By Charging Point Analysis
- By Connectivity Analysis
- By Propulsion Analysis
- By Application Analysis
- By End User Analysis
- Key Market Segments
- Growth Opportunity
- Latest Trends
- Regional Analysis
- Key Players Analysis
- Recent Development
- Report Scope
Report Overview
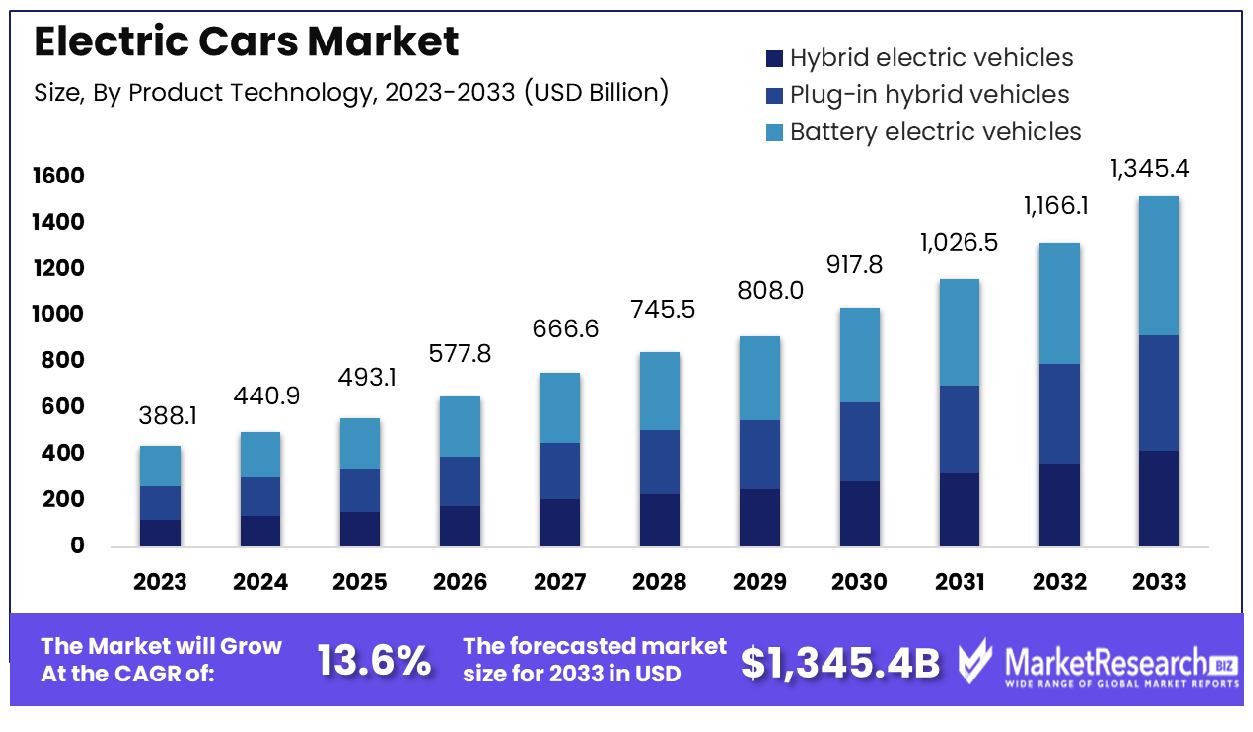
The Global Electric Cars Market was valued at USD 388.1 billion in 2023. It is expected to reach USD 1,345.4 billion by 2033, with a CAGR of 13.6% during the forecast period from 2024 to 2033.
The Electric Cars Market encompasses the design, manufacturing, and sale of electric vehicles (EVs). This sector has experienced significant growth due to increasing environmental concerns, advancements in battery technology, and supportive governmental policies. Market participants range from established automotive giants to innovative startups, all competing to capture consumer interest and expand infrastructure capabilities.
Key factors driving market expansion include consumer demand for sustainable transportation solutions, technological innovations, and evolving regulatory landscapes. As the market continues to mature, strategic insights into consumer preferences, technological trends, and competitive dynamics are crucial for stakeholders aiming to capitalize on the burgeoning opportunities within this transformative industry.
The Electric car market is rapidly evolving, underscored by significant adoption rates in regions like Norway, Sweden, and Iceland, where the fleet share of electric vehicles reached 90.5%, 60.7%, and 60.4% respectively in 2023. This substantial market penetration is supported by the cost-efficiency of electric vehicles, which are approximately £150 cheaper to maintain annually compared to their petrol and diesel counterparts.
Moreover, the financial accessibility of electric cars, exemplified by an average price of £40,248 for a new vehicle in the UK, is propelling consumer adoption. However, the high initial cost remains a barrier for some potential buyers. As the market continues to expand, strategic investments in technology and infrastructure, coupled with governmental incentives, will be critical to sustaining growth.
Key Takeaways
- Market Growth: The Global Electric Cars Market was valued at USD 388.1 billion in 2023. It is expected to reach USD 1,345.4 billion by 2033, with a CAGR of 13.6% during the forecast period from 2024 to 2033.
- By Product Technology: Battery electric vehicles dominated the market at 49%.
- By Components: Battery components held a significant 40% market dominance.
- By Vehicle Type: Passenger cars led the vehicle type segment at 72%.
- By Class: Medium-priced electric cars dominated with a 55% share.
- By Speed: Vehicles under 125MPH speed dominated by 80%.
- By Drive Type: Front-wheel drive was the predominant choice at 60%.
- By Charging Point: Normal charging points led to a 65% market share.
- By Connectivity: Vehicle-to-everything connectivity dominated at 40%.
- By Propulsion: Battery Electric Vehicles (BEV) propulsion led with 65%.
- By Application: Public transportation applications captured a 30% market share.
- By End User: Private fleets were the major end-users at 58%.
- Regional Dominance: Europe dominates the Electric Cars Market, holding a substantial 70.3% share.
Driving factors
Government Incentives Bolster Electric Vehicle Adoption
Increasing government incentives and support play a pivotal role in the growth of the Electric Cars Market. Policies such as tax rebates, grants for EV purchases, and investment in charging infrastructure significantly lower the barriers to electric vehicle adoption.
These incentives not only make EVs more affordable for consumers but also encourage manufacturers to scale production and invest in new technologies. As a result, these measures are directly correlated with increasing sales volumes in regions where they are implemented, demonstrating the effectiveness of policy intervention in accelerating market expansion.
Environmental Awareness Fuels Market Demand
Growing environmental awareness among consumers and businesses is driving the demand for sustainable transportation solutions. As public concern over environmental issues such as air pollution and climate change intensifies, more consumers are turning to electric vehicles as a cleaner alternative to traditional petrol and diesel cars.
This shift is supported by the broader societal move towards sustainability, which is becoming increasingly important to customer purchase decisions. The demand for electric vehicles is thus not only a reflection of changing consumer preferences but also an alignment with global sustainability goals.
Technological Advancements Enhance Market Viability
Advancements in battery technology are crucial in enhancing the range and efficiency of electric vehicles, addressing one of the most significant hurdles to consumer adoption—range anxiety. Improved battery technology has led to longer driving ranges and shorter charging times, making EVs more practical for the average consumer.
Furthermore, as these technologies advance, the cost of batteries continues to decline, thereby reducing the overall cost of electric vehicles and making them more accessible to a broader audience. This technological progression is essential for the continued growth of the Electric car market, as it directly impacts the usability and economic feasibility of EVs.
Restraining Factors
High Initial Cost Limits Consumer Adoption
The high initial purchase cost of electric vehicles (EVs) compared to traditional gasoline vehicles remains a significant barrier to broader market penetration. Despite the lower operational and maintenance costs associated with EVs—estimated to be around £150 cheaper annually—the upfront investment can deter potential buyers.
This pricing disparity is particularly pronounced in markets without substantial government incentives or subsidies, which can offset some of the initial financial burden. As a result, the economic accessibility of electric vehicles is crucial for their adoption rates. Market expansion will likely remain constrained as long as significant price differences persist between EVs and their gasoline counterparts.
Charging Infrastructure Deficiency Stalls Market Growth
Insufficient charging infrastructure is another major restraining factor impeding the growth of the Electric Cars Market. Many regions still lack the necessary charging stations to support the widespread adoption of electric vehicles, creating a challenge for EV owners and potential buyers. The availability of convenient and fast charging options is essential for making EVs a viable option for daily use, particularly for long-distance travel.
In regions where infrastructure is underdeveloped, consumer hesitation increases, slowing down the adoption rate of electric vehicles. Strategic investments in charging infrastructure are essential to remove this barrier, facilitating a smoother transition for consumers switching from gasoline to electric vehicles. This combined narrative of high costs and inadequate infrastructure underscores the critical areas where improvements are necessary to foster sustained growth in the electric vehicle market.
By Product Technology Analysis
Battery electric vehicles (BEVs) commanded a significant 49% share of the market by product technology.
In 2023, Battery electric vehicles held a dominant market position in the "By Product Technology" segment of the Electric Cars Market, capturing more than a 49% share. This segment is further categorized into Hybrid Electric Vehicles (HEVs), Plug-in Hybrid Electric Vehicles (PHEVs), and Battery Electric Vehicles (BEVs). The ascendance of BEVs can be attributed to several key factors including advancements in battery technology, increased consumer awareness of environmental issues, and supportive governmental policies fostering low-emission transportation solutions.
Hybrid electric vehicles and plug-in hybrid vehicles also retained significant market shares, although they did not experience growth at the same rate as battery electric vehicles. HEVs accounted for approximately 26% of the market, supported by consumers who prefer a combination of traditional and electric engines. PHEVs, offering the ability to recharge batteries both through regenerative braking and external sources, constituted around 25% of the market. The versatility of PHEVs remains appealing to consumers not fully prepared to transition to fully electric alternatives.
The market dynamics are influenced by technological enhancements that have progressively reduced the cost of electric vehicle batteries while simultaneously increasing their efficiency and lifespan. Government incentives, such as tax reductions and grants for electric vehicle purchasers, have further bolstered the market growth. Additionally, the expansion of charging infrastructure has enhanced the practicality of owning an electric vehicle, thereby influencing consumer preferences towards BEVs.
As environmental regulations become stricter and technology advances, the shift towards electric vehicles is expected to intensify, with battery electric vehicles projected to continue their market dominance. This trend is supported by the increasing commitment of automotive manufacturers to expand their electric vehicle portfolios in response to consumer demand and regulatory mandates.
By Components Analysis
In the components category, batteries emerged as the most dominant, securing a 40% market share.
In 2023, the Battery component held a dominant market position in the "By Components" segment of the Electric Cars Market, capturing more than a 40% share. The segmentation within this market includes Motor, Battery, Fuel Stack, Controlling Unit, Humidifier, Industrial Air Compressor, Power Conditioner, Fuel Processor, Onboard Charger, and Other components. The prominence of the Battery component is driven by its critical role in the functionality and performance of electric vehicles (EVs), influencing both the vehicle's range and efficiency.
Motors, which convert electrical energy into mechanical energy, also represent a significant portion of the market, given their integral role in propulsion. The controlling unit, which manages the operation of the motor and battery to optimize efficiency, along with onboard chargers that facilitate battery recharging, are other key components that have seen substantial investment and development.
Advancements in battery technology, including higher energy densities and faster charging capabilities, have been pivotal in increasing the adoption of electric vehicles. The development of more efficient and compact power conditioners and fuel processors has also contributed to the robust growth of the electric car component market.
Government incentives to promote sustainable energy practices and reduce greenhouse gas emissions have bolstered the demand for electric cars, thereby driving the growth of the components market. As regulations become stricter and technology advances, the trend toward electrification is expected to further escalate, with batteries continuing to play a pivotal role in this transformative era of automotive technology. This trend is supported by ongoing research and development aimed at reducing costs and improving the performance of EV batteries.
By Vehicle Type Analysis
Passenger cars led the vehicle type segment, accounting for an overwhelming 72% of the market.
In 2023, Passenger cars held a dominant market position in the "By Vehicle Type" segment of the Electric Cars Market, capturing more than a 72% share. This category encompasses two primary vehicle types: Passenger cars and Commercial vehicles. The overwhelming preference for electric passenger cars can be attributed to several factors, including increased consumer demand driven by environmental concerns, advancements in electric vehicle (EV) technology, and substantial governmental incentives aimed at promoting sustainable transportation.
Commercial vehicles, while holding a smaller portion of the market share, are gradually gaining traction due to the rising interest in eco-friendly logistics and transportation solutions. Companies are increasingly adopting electric commercial vehicles to reduce operational costs and comply with stringent emissions regulations.
The growth of the electric passenger car segment is further propelled by the expanding availability of a wide range of models, from economy to luxury vehicles, catering to a diverse consumer base. Enhancements in battery technology have significantly increased the driving range of these vehicles, making them more appealing to the average consumer. Additionally, the development of charging infrastructure has improved, easing concerns about the range and accessibility of charging facilities.
As governments continue to implement stricter emissions regulations and provide incentives for EV purchases, the shift toward electric vehicles is expected to accelerate. This trend is also supported by the automotive industry’s ongoing commitment to invest in and expand its offerings of electric vehicles, ensuring that electric passenger cars maintain their dominant position in the market.
By Class Analysis
Medium-priced electric cars dominated the class category, capturing a majority share of 55%.
In 2023, the Medium price range held a dominant market position in the "By Class" segment of the Electric Cars Market, capturing more than a 55% share. This segment is categorized into three primary classes: Low price, Medium price, and Luxury. The substantial market share of Medium price electric vehicles (EVs) underscores their appeal as a balanced option offering advanced features and performance at a cost-effective price, making them accessible to a broader demographic.
Low price electric vehicles, while essential for penetrating price-sensitive markets and expanding the consumer base, accounted for a smaller portion of the market. These vehicles typically cater to consumers making their initial transition to electric mobility, offering basic features and lower range compared to their medium and luxury counterparts.
Luxury electric vehicles, representing the high-end market, also hold a significant share, driven by affluent consumers attracted to premium brands, superior performance, cutting-edge technology, and exclusive design elements. However, the higher cost of these vehicles limits their market penetration compared to medium-priced models.
The dominance of medium-priced electric cars is bolstered by continuous improvements in battery technology, which have enhanced vehicle range and reduced charging times, making them more practical for daily use. Additionally, the expansion of government incentives for electric vehicles and the broadening of charging infrastructure have made owning an EV increasingly viable for middle-income consumers. As technology continues to advance and economies of scale are achieved, the medium-price segment is expected to maintain its market leadership, supported by growing consumer demand for a blend of affordability, quality, and sustainability.
By Speed Analysis
Vehicles with speeds less than 125MPH dominated the speed segment, representing 80% of the market.
In 2023, vehicles capable of speeds Less than 125MPH held a dominant market position in the "By Speed" segment of the Electric Cars Market, capturing more than an 80% share. This segment is differentiated into two categories: More than 125MPH and Less than 125MPH. The predominance of electric vehicles (EVs) in the less than 125MPH category is primarily due to their alignment with the needs and safety concerns of the average consumer, who prioritizes practicality, affordability, and efficiency over high-speed performance.
Electric vehicles designed to operate at speeds more than 125MPH cater to a niche market that values performance and sportiness. These typically fall into the luxury or performance categories and are less concerned with maximizing range than with delivering high-speed capabilities. However, the demand for such high-speed EVs is comparatively lower due to their higher price points and the limited daily utility for average drivers.
The substantial market share of EVs with speeds less than 125MPH can also be attributed to the widespread urban use of these vehicles, where speed limits and driving conditions rarely necessitate higher speeds. Additionally, vehicles in this speed range are often more energy-efficient, offering longer ranges per charge, which is a critical selling point for consumers.
Moreover, regulatory environments across many regions, which increasingly favor sustainability and safety, further drive the demand for these more practical speed ranges in EVs. As infrastructure for electric vehicles continues to develop and consumer preferences increasingly lean towards sustainability and cost-effectiveness, the market for EVs with speeds less than 125MPH is expected to maintain its dominance.
By Drive Type Analysis
Front-wheel drive configurations were most common, holding a dominant 60% share by drive type.
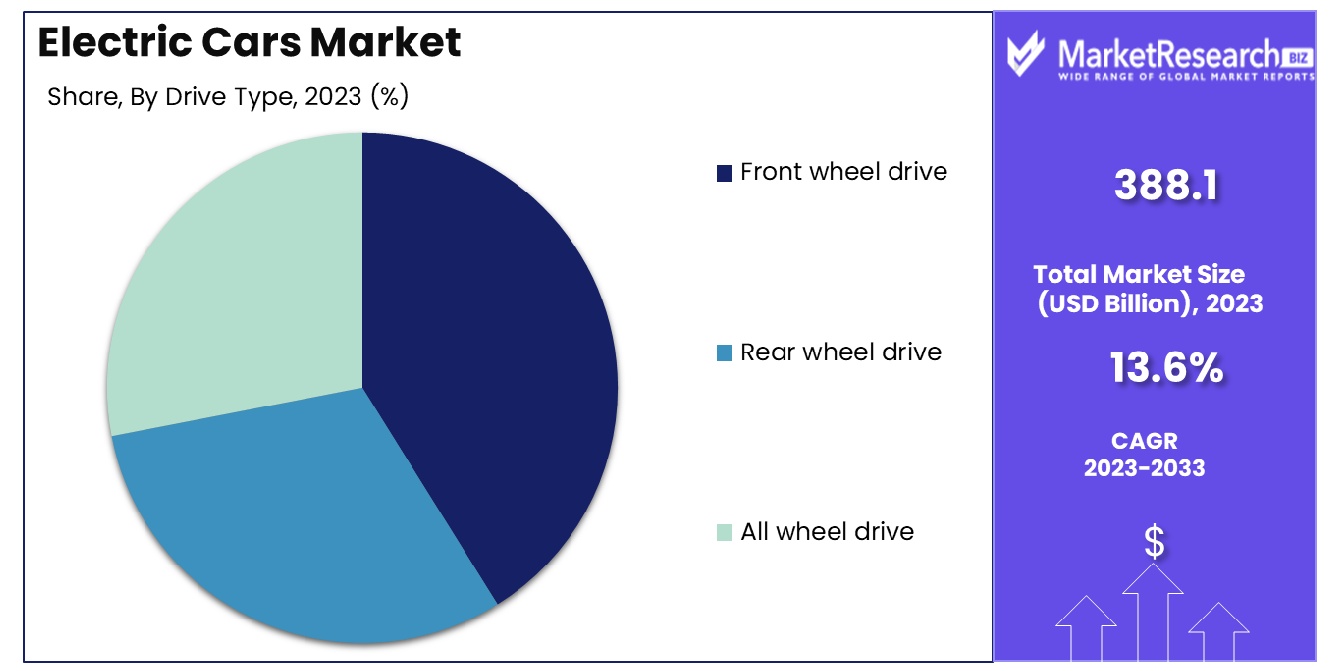
In 2023, Front wheel drive held a dominant market position in the "By Drive Type" segment of the Electric Cars Market, capturing more than a 60% share. This segment comprises Front Wheel Drive (FWD), Rear Wheel Drive (RWD), and All Wheel Drive (AWD) configurations. The predominance of FWD in electric vehicles (EVs) can be attributed to its cost-effectiveness, simplicity in manufacturing, and efficient use of space, which is particularly beneficial in compact vehicle designs.
Rear wheel drive, traditionally favored for its performance and handling characteristics, commands a substantial segment but is generally less common in electric vehicles compared to FWD. RWD is often found in higher-end models where driving dynamics are a priority.
All wheel drive systems, which provide power to all four wheels, offer enhanced traction and stability, particularly in adverse weather conditions. While AWD systems are increasingly popular in premium and high-performance electric vehicles, their higher cost and more complex drivetrains contribute to a smaller market share compared to FWD.
The substantial share of FWD electric cars is also driven by their appeal to the mass market, where consumers prioritize practicality, affordability, and energy efficiency. FWD layouts are particularly advantageous in electric vehicles as they allow for maximum cabin space due to the absence of a propeller shaft. Additionally, the integration of motor and drivetrain components is more straightforward, reducing production costs and enhancing vehicle affordability.
As technology advances and consumer preferences evolve, the distribution of market shares among FWD, RWD, and AWD may shift, but for 2023, front wheel drive continues to lead due to its broad appeal and economic advantages.
By Charging Point Analysis
Normal charging points were the preferred choice, dominating the charging point category with 65%.
In 2023, Normal charging held a dominant market position in the "By Charging Point" segment of the Electric Cars Market, capturing more than a 65% share. The segment is categorized into two types: Normal Charging and High Charging. The significant prevalence of Normal charging stations is primarily attributed to their widespread installation and ease of integration into existing electrical infrastructure, which does not typically require extensive upgrades.
Normal charging, also known as Level 1 and Level 2 charging, typically provides a convenient, albeit slower, charging option that is well-suited for overnight use or long-duration parking, such as at home or at work. This method supports the daily usage patterns of the majority of consumers, who charge their vehicles during nighttime hours.
In contrast, High charging, which includes Level 3 or DC fast charging, offers much quicker charging times and is ideal for long-distance travel requiring rapid battery top-ups. However, the higher installation and maintenance costs associated with High charging stations, coupled with their higher power demands, contribute to their less widespread deployment compared to Normal charging points.
The dominance of Normal charging is also reinforced by government incentives aimed at expanding the charging infrastructure, which often favor the more cost-effective and less resource-intensive Normal charging solutions. As EV adoption increases and the demand for more convenient and faster charging solutions grows, there may be an increase in the deployment of High-charging stations. However, for 2023, Normal charging continues to lead the market due to its accessibility, affordability, and alignment with the typical daily use case of electric vehicles.
By Connectivity Analysis
Vehicle-to-everything (V2X) connectivity led its segment, holding a notable 40% share in the market.
In 2023, Vehicle-to-Everything (V2X) held a dominant market position in the "By Connectivity" segment of the Electric Cars Market, capturing more than a 40% share. This segment includes various types of connectivity technologies: Vehicle-to-Vehicle (V2V), Vehicle-to-Grid (V2G), and Vehicle-to-Building or Vehicle-to-Home (V2B/V2H). V2X technology, encompassing all these aspects, has gained the upper hand due to its comprehensive approach to improving vehicle intelligence, safety, and energy efficiency.
V2X technology allows vehicles to communicate with each other and with infrastructure, enhancing road safety and traffic efficiency by sharing information about road conditions, traffic, and accidents in real time. This connectivity extends to interacting with traffic lights and other urban infrastructural elements, contributing to smoother traffic flows and reduced congestion.
V2V connectivity, a subset of V2X, enables direct communication between vehicles to prevent accidents and coordinate movements, especially in complex driving scenarios such as highway systems. Meanwhile, V2G technology, another component of V2X, allows electric vehicles to return energy to the power grid, which is particularly valuable during peak demand times or outages, providing a dynamic balance between energy supply and demand.
V2B or V2H technologies, which enable electric vehicles to communicate and potentially supply power to buildings or homes, also contribute to the practical applications of EVs beyond transportation, further underlining the utility of V2X technologies.
As more cities and countries invest in smart infrastructure and as the automotive industry continues to innovate with more connected and autonomous vehicles, the relevance and market share of V2X is expected to grow. This technology's ability to integrate multiple connectivity solutions under one umbrella gives it a significant edge in the market, promising enhanced vehicle utility and smarter, safer driving experiences.
By Propulsion Analysis
BEV propulsion systems were particularly popular, dominating the propulsion category with a 65% share.
In 2023, Battery Electric Vehicles (BEV) held a dominant market position in the "By Propulsion" segment of the Electric Cars Market, capturing more than a 65% share. This segment includes three main types of propulsion systems: Plug-in Hybrid Electric Vehicles (PHEV), Battery Electric Vehicles (BEV), and Fuel Cell Electric Vehicles (FCEV). The dominance of BEVs can be primarily attributed to their environmental efficiency, lower operational costs, and growing consumer preference for fully electric solutions without reliance on fossil fuels.
PHEVs, which combine a battery-powered electric motor with a traditional internal combustion engine, offer versatility by allowing drivers to use electric power for short trips and gasoline for longer journeys. Despite their flexibility, PHEVs have seen slower growth compared to BEVs due to the increasing availability of BEV models with extended ranges, reducing the need for hybrid solutions.
FCEVs, which utilize hydrogen fuel cells to generate electricity, represent a smaller portion of the market. While they offer rapid refueling and long range—similar to conventional vehicles—their growth is hindered by limited hydrogen refueling infrastructure and higher vehicle costs.
The significant market share of BEVs is bolstered by ongoing advancements in battery technology, which have continuously improved range and reduced charging times. Additionally, government incentives for electric vehicles, including subsidies and tax breaks, have predominantly favored BEVs, enhancing their affordability and attractiveness to consumers. As the global push towards sustainability intensifies and technology advances, BEVs are expected to maintain their lead in the market, driven by consumer demands for cleaner and more efficient vehicles.
By Application Analysis
Public transportation applications of electric vehicles accounted for 30% of the market by application.
In 2023, Public transportation held a dominant market position in the "By Application" segment of the Electric Cars Market, capturing more than a 30% share. This diverse segment includes applications across Consumer Electronics, Military, Public Transportation, Aviation, Electricity Grid, Spaceflight, and Wearable Technology. The prominence of Public Transportation in this segment reflects the increasing adoption of electric vehicles (EVs) in municipal and regional transit systems, aimed at reducing carbon emissions and enhancing urban air quality.
Public transportation systems around the globe are integrating electric buses, trams, and taxis into their fleets as part of broader sustainability initiatives. This shift is supported by improvements in EV technology, including longer battery life and shorter charging times, which are critical for the high-use demands of public transit.
Other significant areas within the segment include Consumer Electronics and Military, where electric vehicles are being explored for logistics and operational efficiency. However, these applications have not experienced the same rate of adoption as public transportation due to different operational requirements and slower shifts in policy and infrastructure.
The growth in the Electric Cars Market for public transportation is also fueled by substantial investments from governments and private sectors in charging infrastructure and incentives for green vehicle purchases. As urban centers continue to grow and face environmental challenges, the role of electric vehicles in public transportation is expected to expand, further driving innovation and market growth in this sector.
By End User Analysis
Private fleets were the primary end users, dominating this segment with a substantial 58% share.
In 2023, Private Fleets held a dominant market position in the "By End User" segment of the Electric Cars Market, capturing more than a 58% share. This segment is broadly categorized into two types: Commercial Fleets and Private Fleets. The significant market share held by Private Fleets underscores the increasing transition of individual and family vehicle ownership towards electric vehicles (EVs), driven by a combination of environmental awareness, economic incentives, and advancements in EV technology.
Private fleets typically consist of vehicles owned by households or used for personal transportation, reflecting a shift in consumer preferences towards more sustainable and cost-effective driving options. This trend is supported by an expansion in the availability of electric vehicle models, ranging from economy to luxury vehicles, catering to a diverse consumer base.
Commercial Fleets, which include vehicles used for business operations such as logistics, service delivery, or employee commuting, also form a substantial part of the market. However, the adoption rate in this subsegment has been slightly slower compared to private fleets due to higher initial investment costs and the need for more robust charging infrastructure to support intensive usage patterns.
The dominance of Private Fleets is further reinforced by governmental policies aimed at reducing urban air pollution and dependency on fossil fuels, which often include subsidies for EV purchases, tax benefits, and investment in charging infrastructure. As technology continues to advance and economies of scale reduce costs, the penetration of electric vehicles in private fleets is expected to grow, continually reshaping the automotive landscape.
Key Market Segments
By Product Technology
- Hybrid electric vehicles
- Plug-in hybrid vehicles
- Battery electric vehicles
By Components
- Motor
- Battery
- Fuel stack
- Controlling unit
- Humidifier
- Air Compressor
- Power Conditioner
- Fuel processor
- On board charge
- Other
By Vehicle Type
- Passenger cars
- Commercial vehicles
By Class
- Low price
- Medium price
- Luxury
By Speed
- More than 125MPH
- Less than 125MPH
By Drive Type
- Front wheel drive
- Rear wheel drive
- All wheel drive
By Charging Point
- Normal charging
- High charging
By Connectivity
- V2X
- V2V
- V2G
- V2B or V2H
By Propulsion
- PHEV
- BEV
- FCEV
By Application
- Consumer Electronics
- Military
- Public transportation
- Aviation
- Electricity grid
- Spaceflight
- Military
- Wearable technology
By End User
- Commercial Fleets
- Private Fleets
Growth Opportunity
Expansion of EV Infrastructure Spurs Market Growth
The expansion of electric vehicle (EV) infrastructure, particularly the development of fast-charging stations, presents a significant growth opportunity for the global Electric Cars Market in 2023. As governments and private entities invest in enhancing the charging landscape, the perceived inconvenience of long charging times and limited range is rapidly diminishing.
The strategic deployment of fast-charging stations along major transportation routes and in urban centers is essential to making EVs a practical choice for a broader audience. This infrastructure development not only caters to current EV owners but also serves as a critical persuasive factor for potential buyers sitting on the fence due to range anxiety. As these facilities become more ubiquitous, the barrier to EV adoption lowers, directly contributing to an increase in market growth.
Emerging Markets Drive New Adoption Frontiers
Emerging markets represent a burgeoning frontier for the adoption of electric vehicles, driven by increasing urbanization, rising disposable incomes, and growing environmental consciousness. Countries in Asia, Africa, and Latin America are seeing a shift in consumer preferences towards more sustainable transportation solutions. Moreover, local governments are beginning to implement policies that favor EVs through incentives and regulations aimed at reducing carbon emissions.
This shift offers substantial growth opportunities for EV manufacturers by expanding their global footprint into new markets that have previously been untapped. The development and customization of EV products that cater to the unique needs and conditions of these markets are crucial, as they offer the dual benefits of environmental sustainability and economic growth.
Latest Trends
Integration of Advanced Technologies Enhances EV Appeal
In 2023, the global Electric Cars Market is witnessing a significant trend with the integration of advanced driver-assistance systems (ADAS) and enhanced connectivity features. These technological advancements are transforming electric vehicles into highly sophisticated, connected mobile platforms that offer not only eco-friendly transportation but also an elevated driving experience.
Features such as adaptive cruise control, lane-keeping assistance, and emergency braking enhance safety, making EVs more attractive to safety-conscious consumers. Additionally, connectivity features that allow for vehicle-to-everything (V2X) communication are improving the overall utility of electric cars by enabling them to interact with traffic signals and other infrastructure, thus optimizing travel efficiency and safety. This trend is crucial in distinguishing EV offerings and stimulating consumer demand in a competitive market.
Autonomous Electric Vehicles Propel Industry Innovation
The shift towards autonomous electric vehicles marks another major trend shaping the 2023 landscape of the Electric Cars Market. Increased investment in research and development by major automotive companies is accelerating this evolution. Autonomous technologies not only promise to redefine the driving experience but also align closely with the environmental and efficiency goals of electric vehicles.
As these technologies advance, they are expected to reduce accidents caused by human error and optimize energy usage, enhancing the appeal of electric vehicles. The proactive engagement of traditional automotive giants and new entrants in R&D activities is setting the stage for a future where electric and autonomous technologies converge, heralding a new era of mobility that promises significant market growth opportunities.
Regional Analysis
The Electric Cars Market in Europe commands a dominant 70.3% share, driven by strong policy support and infrastructure.
Europe stands as the dominant region, commanding a substantial 70.3% share of the market. This leadership is largely driven by aggressive environmental policies, substantial investments in EV infrastructure, and high consumer awareness. Countries like Norway, Sweden, and the Netherlands showcase some of the highest EV adoption rates globally, supported by strong governmental incentives and an extensive network of charging stations.
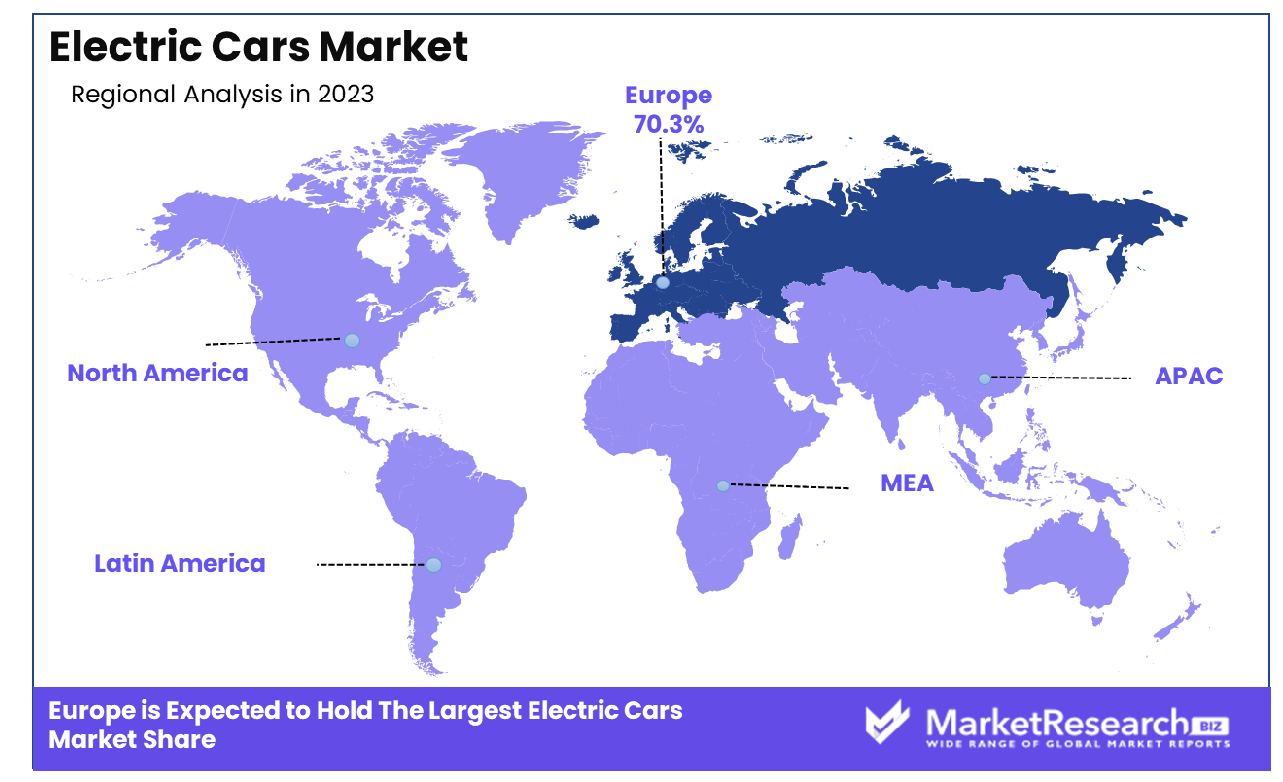
North America, while trailing Europe, shows robust growth, particularly in the United States and Canada, where state-level incentives and a growing cultural shift towards sustainability are fostering market expansion. The presence of major EV manufacturers and tech companies pushes forward innovations in vehicle technology and infrastructure.
The Asia Pacific region is witnessing rapid growth due to rising environmental concerns and increasing economic capacity to adopt new technologies, especially in China, Japan, and South Korea. These countries are heavily investing in battery technology and manufacturing capabilities, positioning Asia Pacific as a critical player in the global market.
Conversely, the Electric Cars Market in the Middle East & Africa, and Latin America is still nascent but showing growth potential. These regions face challenges such as limited infrastructure and economic barriers but are gradually adopting EVs through government-led initiatives aimed at reducing carbon emissions and developing local automotive sectors.
Key Regions and Countries
North America
- The US
- Canada
- Rest of North America
Europe
- Germany
- France
- The UK
- Spain
- Netherlands
- Russia
- Italy
- Rest of Europe
Asia-Pacific
- China
- Japan
- Singapore
- Thailand
- South Korea
- Vietnam
- India
- New Zealand
- Rest of Asia Pacific
Latin America
- Mexico
- Brazil
- Rest of Latin America
Middle East & Africa
- Saudi Arabia
- South Africa
- UAE
- Rest of Middle East & Africa
Key Players Analysis
In 2023, the global Electric Cars Market continues to be shaped by the strategic movements and innovations of key players. Companies such as Tesla, Inc. and Volkswagen AG are leading with significant market shares due to their advanced technology and comprehensive EV line-ups. Tesla remains a frontrunner, emphasizing innovation in battery technology and autonomous driving features, which significantly attract a global consumer base. Volkswagen has been rapidly expanding its electric fleet, capitalizing on its existing brand reputation and extensive manufacturing capabilities to scale up production across Europe.
Asian manufacturers like BYD Company Limited, Hyundai Motor Company, and Nissan Motors Co., Ltd. are also pivotal, driven by strong domestic markets and increasing global outreach. BYD, in particular, has seen substantial growth, supported by China’s aggressive EV policies and its vertical integration strategy that spans battery production and vehicle assembly.
In the United States, General Motors and Ford Motor are accelerating their EV strategies to catch up with Tesla. Both companies are investing heavily in new models and battery technologies, aiming to broaden their market reach and meet the stringent emissions regulations set by various governments.
European players like BMW AG and Daimler AG continue to leverage their brand strength and engineering expertise to enhance their electric vehicle offerings, focusing on luxury segments and high-performance models.
New entrants like Lucid Group Inc. and established players in emerging markets, such as Tata Motors and Mahindra Electric Mobility Limited from India, are vital contributors, introducing competitively priced models tailored to local needs and exporting expertise to global markets. Collectively, these companies are driving forward the Electric car market with a focus on innovation, customer satisfaction, and sustainable practices.
Market Key Players
- BMW AG (Germany)
- BYD Company Limited (China)
- Daimler AG (Germany)
- Energica Motor Company (Italy)
- Ford Motor (US)
- General Motors (US)
- Hyundai Motor Company (South Korea)
- Karma Automotive (China)
- Kia Corporation (South Korea)
- Lucid Group Inc. (US)
- Mahindra Electric Mobility Limited (India)
- Nissan Motors Co., Ltd. (Japan)
- Tata Motors (India)
- Tesla, Inc. (US)
- Toyota Motor Corporation (Japan)
- Volkswagen AG (Germany)
- WM Motor (China)
- Xiaopeng Motors (China)
Recent Development
- In July 2024, BMW announced a $1 billion investment in a new battery production facility in Germany. This move aims to enhance their electric vehicle (EV) range and reduce production costs.
- In July 2024, BYD unveiled its new electric sedan, the BYD Han, which boasts a range of 600 kilometers on a single charge. The company also secured $500 million in funding to expand its production capacity and develop next-generation battery technology.
- In July 2024, Ford Motor, a major American automaker, announced a $2 billion investment in its electric vehicle production facilities in the US in July 2024. This investment aims to increase the production capacity of the popular Ford Mustang Mach-E and the upcoming Ford F-150 Lightning electric pickup truck. Ford also reported a 40% increase in electric vehicle sales in the first half of 2024.
Report Scope
Report Features Description Market Value (2023) USD 388.1 Billion Forecast Revenue (2033) USD 1,345.4 Billion CAGR (2024-2032) 13.6% Base Year for Estimation 2023 Historic Period 2016-2023 Forecast Period 2024-2033 Report Coverage Revenue Forecast, Market Dynamics, COVID-19 Impact, Competitive Landscape, Recent Developments Segments Covered By Product Technology(Hybrid electric vehicles, Plug-in hybrid vehicles, Battery electric vehicles), By Components(Motor, Battery, Fuel stack, Controlling unit, Humidifier, Air Compressor, Power Conditioner, Fuel processor, On board charge, Other), By Vehicle Type(Passenger cars, Commercial vehicles), By Class(Low price, Medium price, Luxury), By Speed(More than 125MPH, Less than 125MPH), By Drive Type(Front wheel drive, Rear wheel drive, All wheel drive), By Charging Point(Normal charging, High charging), By Connectivity(V2X, V2V, V2G, V2B or V2H), By Propulsion(PHEV, BEV, FCEV), By Application(Consumer Electronics, Military, Public transportation, Aviation, Electricity grid, Spaceflight, Military, Wearable technology), By End User(Commercial Fleets, Private Fleets) Regional Analysis North America - The US, Canada, Rest of North America, Europe - Germany, France, The UK, Spain, Italy, Russia, Netherlands, Rest of Europe, Asia-Pacific - China, Japan, South Korea, India, New Zealand, Singapore, Thailand, Vietnam, Rest of Asia Pacific, Latin America - Brazil, Mexico, Rest of Latin America, Middle East & Africa - South Africa, Saudi Arabia, UAE, Rest of Middle East & Africa Competitive Landscape BMW AG (Germany), BYD Company Limited (China), Daimler AG (Germany), Energica Motor Company (Italy), Ford Motor (US), General Motors (US), Hyundai Motor Company (South Korea), Karma Automotive (China), Kia Corporation (South Korea), Lucid Group Inc. (US), Mahindra Electric Mobility Limited (India) , Nissan Motors Co., Ltd. (Japan), Tata Motors (India), Tesla, Inc. (US), Toyota Motor Corporation (Japan), Volkswagen AG (Germany), WM Motor (China), Xiaopeng Motors (China) Customization Scope Customization for segments, region/country-level will be provided. Moreover, additional customization can be done based on the requirements. Purchase Options We have three licenses to opt for Single User License, Multi-User License (Up to 5 Users), Corporate Use License (Unlimited User and Printable PDF) -
- 1. Executive Summary
- 1.1. Definition
- 1.2. Taxonomy
- 1.3. Research Scope
- 1.4. Key Analysis
- 1.5. Key Findings by Major Segments
- 1.6. Top strategies by Major Players
- 2. Global Electric Cars Market Overview
- 2.1. Electric Cars Market Dynamics
- 2.1.1. Drivers
- 2.1.2. Opportunities
- 2.1.3. Restraints
- 2.1.4. Challenges
- 2.2. Macro-economic Factors
- 2.3. Regulatory Framework
- 2.4. Market Investment Feasibility Index
- 2.5. PEST Analysis
- 2.6. PORTER’S Five Force Analysis
- 2.7. Drivers & Restraints Impact Analysis
- 2.8. Industry Chain Analysis
- 2.9. Cost Structure Analysis
- 2.10. Marketing Strategy
- 2.11. Russia-Ukraine War Impact Analysis
- 2.12. Opportunity Map Analysis
- 2.13. Market Competition Scenario Analysis
- 2.14. Product Life Cycle Analysis
- 2.15. Opportunity Orbits
- 2.16. Manufacturer Intensity Map
- 2.17. Major Companies sales by Value & Volume
- 2.1. Electric Cars Market Dynamics
- 3. Global Electric Cars Market Analysis, Opportunity and Forecast, 2016-2032
- 3.1. Global Electric Cars Market Analysis, 2016-2021
- 3.2. Global Electric Cars Market Opportunity and Forecast, 2023-2032
- 3.3. Global Electric Cars Market Analysis, Opportunity and Forecast, By By Product Technology, 2016-2032
- 3.3.1. Global Electric Cars Market Analysis by By Product Technology: Introduction
- 3.3.2. Market Size Absolute $ Opportunity Analysis and Forecast, By By Product Technology, 2016-2032
- 3.3.3. Hybrid electric vehicles
- 3.3.4. Plug-in hybrid vehicles
- 3.3.5. Battery electric vehicles
- 3.4. Global Electric Cars Market Analysis, Opportunity and Forecast, By By Components, 2016-2032
- 3.4.1. Global Electric Cars Market Analysis by By Components: Introduction
- 3.4.2. Market Size Absolute $ Opportunity Analysis and Forecast, By By Components, 2016-2032
- 3.4.3. Motor
- 3.4.4. Battery
- 3.4.5. Fuel stack
- 3.4.6. Controlling unit
- 3.4.7. Humidifier
- 3.4.8. Air Compressor
- 3.4.9. Power Conditioner
- 3.4.10. Fuel processor
- 3.4.11. On board charge
- 3.4.12. Other
- 3.5. Global Electric Cars Market Analysis, Opportunity and Forecast, By By Vehicle Type, 2016-2032
- 3.5.1. Global Electric Cars Market Analysis by By Vehicle Type: Introduction
- 3.5.2. Market Size Absolute $ Opportunity Analysis and Forecast, By By Vehicle Type, 2016-2032
- 3.5.3. Passenger cars
- 3.5.4. Commercial vehicles
- 3.6. Global Electric Cars Market Analysis, Opportunity and Forecast, By By Class , 2016-2032
- 3.6.1. Global Electric Cars Market Analysis by By Class : Introduction
- 3.6.2. Market Size Absolute $ Opportunity Analysis and Forecast, By By Class , 2016-2032
- 3.6.3. Low price
- 3.6.4. Medium price
- 3.6.5. Luxury
- 3.7. Global Electric Cars Market Analysis, Opportunity and Forecast, By By Speed, 2016-2032
- 3.7.1. Global Electric Cars Market Analysis by By Speed: Introduction
- 3.7.2. Market Size Absolute $ Opportunity Analysis and Forecast, By By Speed, 2016-2032
- 3.7.3. More than 125MPH
- 3.7.4. Less than 125MPH
- 3.8. Global Electric Cars Market Analysis, Opportunity and Forecast, By By Drive Type, 2016-2032
- 3.8.1. Global Electric Cars Market Analysis by By Drive Type: Introduction
- 3.8.2. Market Size Absolute $ Opportunity Analysis and Forecast, By By Drive Type, 2016-2032
- 3.8.3. Front wheel drive
- 3.8.4. Rear wheel drive
- 3.8.5. All wheel drive
- 4. North America Electric Cars Market Analysis, Opportunity and Forecast, 2016-2032
- 4.1. North America Electric Cars Market Analysis, 2016-2021
- 4.2. North America Electric Cars Market Opportunity and Forecast, 2023-2032
- 4.3. North America Electric Cars Market Analysis, Opportunity and Forecast, By By Product Technology, 2016-2032
- 4.3.1. North America Electric Cars Market Analysis by By Product Technology: Introduction
- 4.3.2. Market Size Absolute $ Opportunity Analysis and Forecast, By By Product Technology, 2016-2032
- 4.3.3. Hybrid electric vehicles
- 4.3.4. Plug-in hybrid vehicles
- 4.3.5. Battery electric vehicles
- 4.4. North America Electric Cars Market Analysis, Opportunity and Forecast, By By Components, 2016-2032
- 4.4.1. North America Electric Cars Market Analysis by By Components: Introduction
- 4.4.2. Market Size Absolute $ Opportunity Analysis and Forecast, By By Components, 2016-2032
- 4.4.3. Motor
- 4.4.4. Battery
- 4.4.5. Fuel stack
- 4.4.6. Controlling unit
- 4.4.7. Humidifier
- 4.4.8. Air Compressor
- 4.4.9. Power Conditioner
- 4.4.10. Fuel processor
- 4.4.11. On board charge
- 4.4.12. Other
- 4.5. North America Electric Cars Market Analysis, Opportunity and Forecast, By By Vehicle Type, 2016-2032
- 4.5.1. North America Electric Cars Market Analysis by By Vehicle Type: Introduction
- 4.5.2. Market Size Absolute $ Opportunity Analysis and Forecast, By By Vehicle Type, 2016-2032
- 4.5.3. Passenger cars
- 4.5.4. Commercial vehicles
- 4.6. North America Electric Cars Market Analysis, Opportunity and Forecast, By By Class , 2016-2032
- 4.6.1. North America Electric Cars Market Analysis by By Class : Introduction
- 4.6.2. Market Size Absolute $ Opportunity Analysis and Forecast, By By Class , 2016-2032
- 4.6.3. Low price
- 4.6.4. Medium price
- 4.6.5. Luxury
- 4.7. North America Electric Cars Market Analysis, Opportunity and Forecast, By By Speed, 2016-2032
- 4.7.1. North America Electric Cars Market Analysis by By Speed: Introduction
- 4.7.2. Market Size Absolute $ Opportunity Analysis and Forecast, By By Speed, 2016-2032
- 4.7.3. More than 125MPH
- 4.7.4. Less than 125MPH
- 4.8. North America Electric Cars Market Analysis, Opportunity and Forecast, By By Drive Type, 2016-2032
- 4.8.1. North America Electric Cars Market Analysis by By Drive Type: Introduction
- 4.8.2. Market Size Absolute $ Opportunity Analysis and Forecast, By By Drive Type, 2016-2032
- 4.8.3. Front wheel drive
- 4.8.4. Rear wheel drive
- 4.8.5. All wheel drive
- 4.9. North America Electric Cars Market Analysis, Opportunity and Forecast, By Country , 2016-2032
- 4.9.1. North America Electric Cars Market Analysis by Country : Introduction
- 4.9.2. Market Size Absolute $ Opportunity Analysis and Forecast, Country , 2016-2032
- 4.9.2.1. The US
- 4.9.2.2. Canada
- 4.9.2.3. Mexico
- 5. Western Europe Electric Cars Market Analysis, Opportunity and Forecast, 2016-2032
- 5.1. Western Europe Electric Cars Market Analysis, 2016-2021
- 5.2. Western Europe Electric Cars Market Opportunity and Forecast, 2023-2032
- 5.3. Western Europe Electric Cars Market Analysis, Opportunity and Forecast, By By Product Technology, 2016-2032
- 5.3.1. Western Europe Electric Cars Market Analysis by By Product Technology: Introduction
- 5.3.2. Market Size Absolute $ Opportunity Analysis and Forecast, By By Product Technology, 2016-2032
- 5.3.3. Hybrid electric vehicles
- 5.3.4. Plug-in hybrid vehicles
- 5.3.5. Battery electric vehicles
- 5.4. Western Europe Electric Cars Market Analysis, Opportunity and Forecast, By By Components, 2016-2032
- 5.4.1. Western Europe Electric Cars Market Analysis by By Components: Introduction
- 5.4.2. Market Size Absolute $ Opportunity Analysis and Forecast, By By Components, 2016-2032
- 5.4.3. Motor
- 5.4.4. Battery
- 5.4.5. Fuel stack
- 5.4.6. Controlling unit
- 5.4.7. Humidifier
- 5.4.8. Air Compressor
- 5.4.9. Power Conditioner
- 5.4.10. Fuel processor
- 5.4.11. On board charge
- 5.4.12. Other
- 5.5. Western Europe Electric Cars Market Analysis, Opportunity and Forecast, By By Vehicle Type, 2016-2032
- 5.5.1. Western Europe Electric Cars Market Analysis by By Vehicle Type: Introduction
- 5.5.2. Market Size Absolute $ Opportunity Analysis and Forecast, By By Vehicle Type, 2016-2032
- 5.5.3. Passenger cars
- 5.5.4. Commercial vehicles
- 5.6. Western Europe Electric Cars Market Analysis, Opportunity and Forecast, By By Class , 2016-2032
- 5.6.1. Western Europe Electric Cars Market Analysis by By Class : Introduction
- 5.6.2. Market Size Absolute $ Opportunity Analysis and Forecast, By By Class , 2016-2032
- 5.6.3. Low price
- 5.6.4. Medium price
- 5.6.5. Luxury
- 5.7. Western Europe Electric Cars Market Analysis, Opportunity and Forecast, By By Speed, 2016-2032
- 5.7.1. Western Europe Electric Cars Market Analysis by By Speed: Introduction
- 5.7.2. Market Size Absolute $ Opportunity Analysis and Forecast, By By Speed, 2016-2032
- 5.7.3. More than 125MPH
- 5.7.4. Less than 125MPH
- 5.8. Western Europe Electric Cars Market Analysis, Opportunity and Forecast, By By Drive Type, 2016-2032
- 5.8.1. Western Europe Electric Cars Market Analysis by By Drive Type: Introduction
- 5.8.2. Market Size Absolute $ Opportunity Analysis and Forecast, By By Drive Type, 2016-2032
- 5.8.3. Front wheel drive
- 5.8.4. Rear wheel drive
- 5.8.5. All wheel drive
- 5.9. Western Europe Electric Cars Market Analysis, Opportunity and Forecast, By Country , 2016-2032
- 5.9.1. Western Europe Electric Cars Market Analysis by Country : Introduction
- 5.9.2. Market Size Absolute $ Opportunity Analysis and Forecast, Country , 2016-2032
- 5.9.2.1. Germany
- 5.9.2.2. France
- 5.9.2.3. The UK
- 5.9.2.4. Spain
- 5.9.2.5. Italy
- 5.9.2.6. Portugal
- 5.9.2.7. Ireland
- 5.9.2.8. Austria
- 5.9.2.9. Switzerland
- 5.9.2.10. Benelux
- 5.9.2.11. Nordic
- 5.9.2.12. Rest of Western Europe
- 6. Eastern Europe Electric Cars Market Analysis, Opportunity and Forecast, 2016-2032
- 6.1. Eastern Europe Electric Cars Market Analysis, 2016-2021
- 6.2. Eastern Europe Electric Cars Market Opportunity and Forecast, 2023-2032
- 6.3. Eastern Europe Electric Cars Market Analysis, Opportunity and Forecast, By By Product Technology, 2016-2032
- 6.3.1. Eastern Europe Electric Cars Market Analysis by By Product Technology: Introduction
- 6.3.2. Market Size Absolute $ Opportunity Analysis and Forecast, By By Product Technology, 2016-2032
- 6.3.3. Hybrid electric vehicles
- 6.3.4. Plug-in hybrid vehicles
- 6.3.5. Battery electric vehicles
- 6.4. Eastern Europe Electric Cars Market Analysis, Opportunity and Forecast, By By Components, 2016-2032
- 6.4.1. Eastern Europe Electric Cars Market Analysis by By Components: Introduction
- 6.4.2. Market Size Absolute $ Opportunity Analysis and Forecast, By By Components, 2016-2032
- 6.4.3. Motor
- 6.4.4. Battery
- 6.4.5. Fuel stack
- 6.4.6. Controlling unit
- 6.4.7. Humidifier
- 6.4.8. Air Compressor
- 6.4.9. Power Conditioner
- 6.4.10. Fuel processor
- 6.4.11. On board charge
- 6.4.12. Other
- 6.5. Eastern Europe Electric Cars Market Analysis, Opportunity and Forecast, By By Vehicle Type, 2016-2032
- 6.5.1. Eastern Europe Electric Cars Market Analysis by By Vehicle Type: Introduction
- 6.5.2. Market Size Absolute $ Opportunity Analysis and Forecast, By By Vehicle Type, 2016-2032
- 6.5.3. Passenger cars
- 6.5.4. Commercial vehicles
- 6.6. Eastern Europe Electric Cars Market Analysis, Opportunity and Forecast, By By Class , 2016-2032
- 6.6.1. Eastern Europe Electric Cars Market Analysis by By Class : Introduction
- 6.6.2. Market Size Absolute $ Opportunity Analysis and Forecast, By By Class , 2016-2032
- 6.6.3. Low price
- 6.6.4. Medium price
- 6.6.5. Luxury
- 6.7. Eastern Europe Electric Cars Market Analysis, Opportunity and Forecast, By By Speed, 2016-2032
- 6.7.1. Eastern Europe Electric Cars Market Analysis by By Speed: Introduction
- 6.7.2. Market Size Absolute $ Opportunity Analysis and Forecast, By By Speed, 2016-2032
- 6.7.3. More than 125MPH
- 6.7.4. Less than 125MPH
- 6.8. Eastern Europe Electric Cars Market Analysis, Opportunity and Forecast, By By Drive Type, 2016-2032
- 6.8.1. Eastern Europe Electric Cars Market Analysis by By Drive Type: Introduction
- 6.8.2. Market Size Absolute $ Opportunity Analysis and Forecast, By By Drive Type, 2016-2032
- 6.8.3. Front wheel drive
- 6.8.4. Rear wheel drive
- 6.8.5. All wheel drive
- 6.9. Eastern Europe Electric Cars Market Analysis, Opportunity and Forecast, By Country , 2016-2032
- 6.9.1. Eastern Europe Electric Cars Market Analysis by Country : Introduction
- 6.9.2. Market Size Absolute $ Opportunity Analysis and Forecast, Country , 2016-2032
- 6.9.2.1. Russia
- 6.9.2.2. Poland
- 6.9.2.3. The Czech Republic
- 6.9.2.4. Greece
- 6.9.2.5. Rest of Eastern Europe
- 7. APAC Electric Cars Market Analysis, Opportunity and Forecast, 2016-2032
- 7.1. APAC Electric Cars Market Analysis, 2016-2021
- 7.2. APAC Electric Cars Market Opportunity and Forecast, 2023-2032
- 7.3. APAC Electric Cars Market Analysis, Opportunity and Forecast, By By Product Technology, 2016-2032
- 7.3.1. APAC Electric Cars Market Analysis by By Product Technology: Introduction
- 7.3.2. Market Size Absolute $ Opportunity Analysis and Forecast, By By Product Technology, 2016-2032
- 7.3.3. Hybrid electric vehicles
- 7.3.4. Plug-in hybrid vehicles
- 7.3.5. Battery electric vehicles
- 7.4. APAC Electric Cars Market Analysis, Opportunity and Forecast, By By Components, 2016-2032
- 7.4.1. APAC Electric Cars Market Analysis by By Components: Introduction
- 7.4.2. Market Size Absolute $ Opportunity Analysis and Forecast, By By Components, 2016-2032
- 7.4.3. Motor
- 7.4.4. Battery
- 7.4.5. Fuel stack
- 7.4.6. Controlling unit
- 7.4.7. Humidifier
- 7.4.8. Air Compressor
- 7.4.9. Power Conditioner
- 7.4.10. Fuel processor
- 7.4.11. On board charge
- 7.4.12. Other
- 7.5. APAC Electric Cars Market Analysis, Opportunity and Forecast, By By Vehicle Type, 2016-2032
- 7.5.1. APAC Electric Cars Market Analysis by By Vehicle Type: Introduction
- 7.5.2. Market Size Absolute $ Opportunity Analysis and Forecast, By By Vehicle Type, 2016-2032
- 7.5.3. Passenger cars
- 7.5.4. Commercial vehicles
- 7.6. APAC Electric Cars Market Analysis, Opportunity and Forecast, By By Class , 2016-2032
- 7.6.1. APAC Electric Cars Market Analysis by By Class : Introduction
- 7.6.2. Market Size Absolute $ Opportunity Analysis and Forecast, By By Class , 2016-2032
- 7.6.3. Low price
- 7.6.4. Medium price
- 7.6.5. Luxury
- 7.7. APAC Electric Cars Market Analysis, Opportunity and Forecast, By By Speed, 2016-2032
- 7.7.1. APAC Electric Cars Market Analysis by By Speed: Introduction
- 7.7.2. Market Size Absolute $ Opportunity Analysis and Forecast, By By Speed, 2016-2032
- 7.7.3. More than 125MPH
- 7.7.4. Less than 125MPH
- 7.8. APAC Electric Cars Market Analysis, Opportunity and Forecast, By By Drive Type, 2016-2032
- 7.8.1. APAC Electric Cars Market Analysis by By Drive Type: Introduction
- 7.8.2. Market Size Absolute $ Opportunity Analysis and Forecast, By By Drive Type, 2016-2032
- 7.8.3. Front wheel drive
- 7.8.4. Rear wheel drive
- 7.8.5. All wheel drive
- 7.9. APAC Electric Cars Market Analysis, Opportunity and Forecast, By Country , 2016-2032
- 7.9.1. APAC Electric Cars Market Analysis by Country : Introduction
- 7.9.2. Market Size Absolute $ Opportunity Analysis and Forecast, Country , 2016-2032
- 7.9.2.1. China
- 7.9.2.2. Japan
- 7.9.2.3. South Korea
- 7.9.2.4. India
- 7.9.2.5. Australia & New Zeland
- 7.9.2.6. Indonesia
- 7.9.2.7. Malaysia
- 7.9.2.8. Philippines
- 7.9.2.9. Singapore
- 7.9.2.10. Thailand
- 7.9.2.11. Vietnam
- 7.9.2.12. Rest of APAC
- 8. Latin America Electric Cars Market Analysis, Opportunity and Forecast, 2016-2032
- 8.1. Latin America Electric Cars Market Analysis, 2016-2021
- 8.2. Latin America Electric Cars Market Opportunity and Forecast, 2023-2032
- 8.3. Latin America Electric Cars Market Analysis, Opportunity and Forecast, By By Product Technology, 2016-2032
- 8.3.1. Latin America Electric Cars Market Analysis by By Product Technology: Introduction
- 8.3.2. Market Size Absolute $ Opportunity Analysis and Forecast, By By Product Technology, 2016-2032
- 8.3.3. Hybrid electric vehicles
- 8.3.4. Plug-in hybrid vehicles
- 8.3.5. Battery electric vehicles
- 8.4. Latin America Electric Cars Market Analysis, Opportunity and Forecast, By By Components, 2016-2032
- 8.4.1. Latin America Electric Cars Market Analysis by By Components: Introduction
- 8.4.2. Market Size Absolute $ Opportunity Analysis and Forecast, By By Components, 2016-2032
- 8.4.3. Motor
- 8.4.4. Battery
- 8.4.5. Fuel stack
- 8.4.6. Controlling unit
- 8.4.7. Humidifier
- 8.4.8. Air Compressor
- 8.4.9. Power Conditioner
- 8.4.10. Fuel processor
- 8.4.11. On board charge
- 8.4.12. Other
- 8.5. Latin America Electric Cars Market Analysis, Opportunity and Forecast, By By Vehicle Type, 2016-2032
- 8.5.1. Latin America Electric Cars Market Analysis by By Vehicle Type: Introduction
- 8.5.2. Market Size Absolute $ Opportunity Analysis and Forecast, By By Vehicle Type, 2016-2032
- 8.5.3. Passenger cars
- 8.5.4. Commercial vehicles
- 8.6. Latin America Electric Cars Market Analysis, Opportunity and Forecast, By By Class , 2016-2032
- 8.6.1. Latin America Electric Cars Market Analysis by By Class : Introduction
- 8.6.2. Market Size Absolute $ Opportunity Analysis and Forecast, By By Class , 2016-2032
- 8.6.3. Low price
- 8.6.4. Medium price
- 8.6.5. Luxury
- 8.7. Latin America Electric Cars Market Analysis, Opportunity and Forecast, By By Speed, 2016-2032
- 8.7.1. Latin America Electric Cars Market Analysis by By Speed: Introduction
- 8.7.2. Market Size Absolute $ Opportunity Analysis and Forecast, By By Speed, 2016-2032
- 8.7.3. More than 125MPH
- 8.7.4. Less than 125MPH
- 8.8. Latin America Electric Cars Market Analysis, Opportunity and Forecast, By By Drive Type, 2016-2032
- 8.8.1. Latin America Electric Cars Market Analysis by By Drive Type: Introduction
- 8.8.2. Market Size Absolute $ Opportunity Analysis and Forecast, By By Drive Type, 2016-2032
- 8.8.3. Front wheel drive
- 8.8.4. Rear wheel drive
- 8.8.5. All wheel drive
- 8.9. Latin America Electric Cars Market Analysis, Opportunity and Forecast, By Country , 2016-2032
- 8.9.1. Latin America Electric Cars Market Analysis by Country : Introduction
- 8.9.2. Market Size Absolute $ Opportunity Analysis and Forecast, Country , 2016-2032
- 8.9.2.1. Brazil
- 8.9.2.2. Colombia
- 8.9.2.3. Chile
- 8.9.2.4. Argentina
- 8.9.2.5. Costa Rica
- 8.9.2.6. Rest of Latin America
- 9. Middle East & Africa Electric Cars Market Analysis, Opportunity and Forecast, 2016-2032
- 9.1. Middle East & Africa Electric Cars Market Analysis, 2016-2021
- 9.2. Middle East & Africa Electric Cars Market Opportunity and Forecast, 2023-2032
- 9.3. Middle East & Africa Electric Cars Market Analysis, Opportunity and Forecast, By By Product Technology, 2016-2032
- 9.3.1. Middle East & Africa Electric Cars Market Analysis by By Product Technology: Introduction
- 9.3.2. Market Size Absolute $ Opportunity Analysis and Forecast, By By Product Technology, 2016-2032
- 9.3.3. Hybrid electric vehicles
- 9.3.4. Plug-in hybrid vehicles
- 9.3.5. Battery electric vehicles
- 9.4. Middle East & Africa Electric Cars Market Analysis, Opportunity and Forecast, By By Components, 2016-2032
- 9.4.1. Middle East & Africa Electric Cars Market Analysis by By Components: Introduction
- 9.4.2. Market Size Absolute $ Opportunity Analysis and Forecast, By By Components, 2016-2032
- 9.4.3. Motor
- 9.4.4. Battery
- 9.4.5. Fuel stack
- 9.4.6. Controlling unit
- 9.4.7. Humidifier
- 9.4.8. Air Compressor
- 9.4.9. Power Conditioner
- 9.4.10. Fuel processor
- 9.4.11. On board charge
- 9.4.12. Other
- 9.5. Middle East & Africa Electric Cars Market Analysis, Opportunity and Forecast, By By Vehicle Type, 2016-2032
- 9.5.1. Middle East & Africa Electric Cars Market Analysis by By Vehicle Type: Introduction
- 9.5.2. Market Size Absolute $ Opportunity Analysis and Forecast, By By Vehicle Type, 2016-2032
- 9.5.3. Passenger cars
- 9.5.4. Commercial vehicles
- 9.6. Middle East & Africa Electric Cars Market Analysis, Opportunity and Forecast, By By Class , 2016-2032
- 9.6.1. Middle East & Africa Electric Cars Market Analysis by By Class : Introduction
- 9.6.2. Market Size Absolute $ Opportunity Analysis and Forecast, By By Class , 2016-2032
- 9.6.3. Low price
- 9.6.4. Medium price
- 9.6.5. Luxury
- 9.7. Middle East & Africa Electric Cars Market Analysis, Opportunity and Forecast, By By Speed, 2016-2032
- 9.7.1. Middle East & Africa Electric Cars Market Analysis by By Speed: Introduction
- 9.7.2. Market Size Absolute $ Opportunity Analysis and Forecast, By By Speed, 2016-2032
- 9.7.3. More than 125MPH
- 9.7.4. Less than 125MPH
- 9.8. Middle East & Africa Electric Cars Market Analysis, Opportunity and Forecast, By By Drive Type, 2016-2032
- 9.8.1. Middle East & Africa Electric Cars Market Analysis by By Drive Type: Introduction
- 9.8.2. Market Size Absolute $ Opportunity Analysis and Forecast, By By Drive Type, 2016-2032
- 9.8.3. Front wheel drive
- 9.8.4. Rear wheel drive
- 9.8.5. All wheel drive
- 9.9. Middle East & Africa Electric Cars Market Analysis, Opportunity and Forecast, By Country , 2016-2032
- 9.9.1. Middle East & Africa Electric Cars Market Analysis by Country : Introduction
- 9.9.2. Market Size Absolute $ Opportunity Analysis and Forecast, Country , 2016-2032
- 9.9.2.1. Algeria
- 9.9.2.2. Egypt
- 9.9.2.3. Israel
- 9.9.2.4. Kuwait
- 9.9.2.5. Nigeria
- 9.9.2.6. Saudi Arabia
- 9.9.2.7. South Africa
- 9.9.2.8. Turkey
- 9.9.2.9. The UAE
- 9.9.2.10. Rest of MEA
- 10. Global Electric Cars Market Analysis, Opportunity and Forecast, By Region , 2016-2032
- 10.1. Global Electric Cars Market Analysis by Region : Introduction
- 10.2. Market Size Absolute $ Opportunity Analysis and Forecast, By Region , 2016-2032
- 10.2.1. North America
- 10.2.2. Western Europe
- 10.2.3. Eastern Europe
- 10.2.4. APAC
- 10.2.5. Latin America
- 10.2.6. Middle East & Africa
- 11. Global Electric Cars Market Competitive Landscape, Market Share Analysis, and Company Profiles
- 11.1. Market Share Analysis
- 11.2. Company Profiles
- 11.3. BMW AG (Germany)
- 11.3.1. Company Overview
- 11.3.2. Financial Highlights
- 11.3.3. Product Portfolio
- 11.3.4. SWOT Analysis
- 11.3.5. Key Strategies and Developments
- 11.4. BYD Company Limited (China)
- 11.4.1. Company Overview
- 11.4.2. Financial Highlights
- 11.4.3. Product Portfolio
- 11.4.4. SWOT Analysis
- 11.4.5. Key Strategies and Developments
- 11.5. Daimler AG (Germany)
- 11.5.1. Company Overview
- 11.5.2. Financial Highlights
- 11.5.3. Product Portfolio
- 11.5.4. SWOT Analysis
- 11.5.5. Key Strategies and Developments
- 11.6. Energica Motor Company (Italy)
- 11.6.1. Company Overview
- 11.6.2. Financial Highlights
- 11.6.3. Product Portfolio
- 11.6.4. SWOT Analysis
- 11.6.5. Key Strategies and Developments
- 11.7. Ford Motor (US)
- 11.7.1. Company Overview
- 11.7.2. Financial Highlights
- 11.7.3. Product Portfolio
- 11.7.4. SWOT Analysis
- 11.7.5. Key Strategies and Developments
- 11.8. General Motors (US)
- 11.8.1. Company Overview
- 11.8.2. Financial Highlights
- 11.8.3. Product Portfolio
- 11.8.4. SWOT Analysis
- 11.8.5. Key Strategies and Developments
- 11.9. Hyundai Motor Company (South Korea)
- 11.9.1. Company Overview
- 11.9.2. Financial Highlights
- 11.9.3. Product Portfolio
- 11.9.4. SWOT Analysis
- 11.9.5. Key Strategies and Developments
- 11.10. Karma Automotive (China)
- 11.10.1. Company Overview
- 11.10.2. Financial Highlights
- 11.10.3. Product Portfolio
- 11.10.4. SWOT Analysis
- 11.10.5. Key Strategies and Developments
- 11.11. Kia Corporation (South Korea)
- 11.11.1. Company Overview
- 11.11.2. Financial Highlights
- 11.11.3. Product Portfolio
- 11.11.4. SWOT Analysis
- 11.11.5. Key Strategies and Developments
- 11.12. Lucid Group Inc. (US)
- 11.12.1. Company Overview
- 11.12.2. Financial Highlights
- 11.12.3. Product Portfolio
- 11.12.4. SWOT Analysis
- 11.12.5. Key Strategies and Developments
- 11.13.1. Company Overview
- 11.13.2. Financial Highlights
- 11.13.3. Product Portfolio
- 11.13.4. SWOT Analysis
- 11.13.5. Key Strategies and Developments
- 11.14. Mahindra Electric Mobility Limited (India)
- 11.14.1. Company Overview
- 11.14.2. Financial Highlights
- 11.14.3. Product Portfolio
- 11.14.4. SWOT Analysis
- 11.14.5. Key Strategies and Developments
- 11.15. Tata Motors (India)
- 11.15.1. Company Overview
- 11.15.2. Financial Highlights
- 11.15.3. Product Portfolio
- 11.15.4. SWOT Analysis
- 11.15.5. Key Strategies and Developments
- 11.16. Tesla, Inc. (US)
- 11.16.1. Company Overview
- 11.16.2. Financial Highlights
- 11.16.3. Product Portfolio
- 11.16.4. SWOT Analysis
- 11.16.5. Key Strategies and Developments
- 11.17. Toyota Motor Corporation (Japan)
- 11.17.1. Company Overview
- 11.17.2. Financial Highlights
- 11.17.3. Product Portfolio
- 11.17.4. SWOT Analysis
- 11.17.5. Key Strategies and Developments
- 11.18. Volkswagen AG (Germany)
- 11.18.1. Company Overview
- 11.18.2. Financial Highlights
- 11.18.3. Product Portfolio
- 11.18.4. SWOT Analysis
- 11.18.5. Key Strategies and Developments
- 11.19. WM Motor (China)
- 11.19.1. Company Overview
- 11.19.2. Financial Highlights
- 11.19.3. Product Portfolio
- 11.19.4. SWOT Analysis
- 11.19.5. Key Strategies and Developments
- 11.20. Xiaopeng Motors (China)
- 11.20.1. Company Overview
- 11.20.2. Financial Highlights
- 11.20.3. Product Portfolio
- 11.20.4. SWOT Analysis
- 11.20.5. Key Strategies and Developments
- 12. Assumptions and Acronyms
- 13. Research Methodology
- 14. Contact
"
- List of Figures
- "
- Figure 1: Global Electric Cars Market Revenue (US$ Mn) Market Share by By Product Technology in 2022
- Figure 2: Global Electric Cars Market Market Attractiveness Analysis by By Product Technology, 2016-2032
- Figure 3: Global Electric Cars Market Revenue (US$ Mn) Market Share by By Componentsin 2022
- Figure 4: Global Electric Cars Market Market Attractiveness Analysis by By Components, 2016-2032
- Figure 5: Global Electric Cars Market Revenue (US$ Mn) Market Share by By Vehicle Typein 2022
- Figure 6: Global Electric Cars Market Market Attractiveness Analysis by By Vehicle Type, 2016-2032
- Figure 7: Global Electric Cars Market Revenue (US$ Mn) Market Share by By Class in 2022
- Figure 8: Global Electric Cars Market Market Attractiveness Analysis by By Class , 2016-2032
- Figure 9: Global Electric Cars Market Revenue (US$ Mn) Market Share by By Speedin 2022
- Figure 10: Global Electric Cars Market Market Attractiveness Analysis by By Speed, 2016-2032
- Figure 11: Global Electric Cars Market Revenue (US$ Mn) Market Share by By Drive Typein 2022
- Figure 12: Global Electric Cars Market Market Attractiveness Analysis by By Drive Type, 2016-2032
- Figure 13: Global Electric Cars Market Revenue (US$ Mn) Market Share by Region in 2022
- Figure 14: Global Electric Cars Market Market Attractiveness Analysis by Region, 2016-2032
- Figure 15: Global Electric Cars Market Market Revenue (US$ Mn) (2016-2032)
- Figure 16: Global Electric Cars Market Market Revenue (US$ Mn) Comparison by Region (2016-2032)
- Figure 17: Global Electric Cars Market Market Revenue (US$ Mn) Comparison by By Product Technology (2016-2032)
- Figure 18: Global Electric Cars Market Market Revenue (US$ Mn) Comparison by By Components (2016-2032)
- Figure 19: Global Electric Cars Market Market Revenue (US$ Mn) Comparison by By Vehicle Type (2016-2032)
- Figure 20: Global Electric Cars Market Market Revenue (US$ Mn) Comparison by By Class (2016-2032)
- Figure 21: Global Electric Cars Market Market Revenue (US$ Mn) Comparison by By Speed (2016-2032)
- Figure 22: Global Electric Cars Market Market Revenue (US$ Mn) Comparison by By Drive Type (2016-2032)
- Figure 23: Global Electric Cars Market Market Y-o-Y Growth Rate Comparison by Region (2016-2032)
- Figure 24: Global Electric Cars Market Market Y-o-Y Growth Rate Comparison by By Product Technology (2016-2032)
- Figure 25: Global Electric Cars Market Market Y-o-Y Growth Rate Comparison by By Components (2016-2032)
- Figure 26: Global Electric Cars Market Market Y-o-Y Growth Rate Comparison by By Vehicle Type (2016-2032)
- Figure 27: Global Electric Cars Market Market Y-o-Y Growth Rate Comparison by By Class (2016-2032)
- Figure 28: Global Electric Cars Market Market Y-o-Y Growth Rate Comparison by By Speed (2016-2032)
- Figure 29: Global Electric Cars Market Market Y-o-Y Growth Rate Comparison by By Drive Type (2016-2032)
- Figure 30: Global Electric Cars Market Market Share Comparison by Region (2016-2032)
- Figure 31: Global Electric Cars Market Market Share Comparison by By Product Technology (2016-2032)
- Figure 32: Global Electric Cars Market Market Share Comparison by By Components (2016-2032)
- Figure 33: Global Electric Cars Market Market Share Comparison by By Vehicle Type (2016-2032)
- Figure 34: Global Electric Cars Market Market Share Comparison by By Class (2016-2032)
- Figure 35: Global Electric Cars Market Market Share Comparison by By Speed (2016-2032)
- Figure 36: Global Electric Cars Market Market Share Comparison by By Drive Type (2016-2032)
- Figure 37: North America Electric Cars Market Revenue (US$ Mn) Market Share by By Product Technologyin 2022
- Figure 38: North America Electric Cars Market Market Attractiveness Analysis by By Product Technology, 2016-2032
- Figure 39: North America Electric Cars Market Revenue (US$ Mn) Market Share by By Componentsin 2022
- Figure 40: North America Electric Cars Market Market Attractiveness Analysis by By Components, 2016-2032
- Figure 41: North America Electric Cars Market Revenue (US$ Mn) Market Share by By Vehicle Typein 2022
- Figure 42: North America Electric Cars Market Market Attractiveness Analysis by By Vehicle Type, 2016-2032
- Figure 43: North America Electric Cars Market Revenue (US$ Mn) Market Share by By Class in 2022
- Figure 44: North America Electric Cars Market Market Attractiveness Analysis by By Class , 2016-2032
- Figure 45: North America Electric Cars Market Revenue (US$ Mn) Market Share by By Speedin 2022
- Figure 46: North America Electric Cars Market Market Attractiveness Analysis by By Speed, 2016-2032
- Figure 47: North America Electric Cars Market Revenue (US$ Mn) Market Share by By Drive Typein 2022
- Figure 48: North America Electric Cars Market Market Attractiveness Analysis by By Drive Type, 2016-2032
- Figure 49: North America Electric Cars Market Revenue (US$ Mn) Market Share by Country in 2022
- Figure 50: North America Electric Cars Market Market Attractiveness Analysis by Country, 2016-2032
- Figure 51: North America Electric Cars Market Market Revenue (US$ Mn) (2016-2032)
- Figure 52: North America Electric Cars Market Market Revenue (US$ Mn) Comparison by Country (2016-2032)
- Figure 53: North America Electric Cars Market Market Revenue (US$ Mn) Comparison by By Product Technology (2016-2032)
- Figure 54: North America Electric Cars Market Market Revenue (US$ Mn) Comparison by By Components (2016-2032)
- Figure 55: North America Electric Cars Market Market Revenue (US$ Mn) Comparison by By Vehicle Type (2016-2032)
- Figure 56: North America Electric Cars Market Market Revenue (US$ Mn) Comparison by By Class (2016-2032)
- Figure 57: North America Electric Cars Market Market Revenue (US$ Mn) Comparison by By Speed (2016-2032)
- Figure 58: North America Electric Cars Market Market Revenue (US$ Mn) Comparison by By Drive Type (2016-2032)
- Figure 59: North America Electric Cars Market Market Y-o-Y Growth Rate Comparison by Country (2016-2032)
- Figure 60: North America Electric Cars Market Market Y-o-Y Growth Rate Comparison by By Product Technology (2016-2032)
- Figure 61: North America Electric Cars Market Market Y-o-Y Growth Rate Comparison by By Components (2016-2032)
- Figure 62: North America Electric Cars Market Market Y-o-Y Growth Rate Comparison by By Vehicle Type (2016-2032)
- Figure 63: North America Electric Cars Market Market Y-o-Y Growth Rate Comparison by By Class (2016-2032)
- Figure 64: North America Electric Cars Market Market Y-o-Y Growth Rate Comparison by By Speed (2016-2032)
- Figure 65: North America Electric Cars Market Market Y-o-Y Growth Rate Comparison by By Drive Type (2016-2032)
- Figure 66: North America Electric Cars Market Market Share Comparison by Country (2016-2032)
- Figure 67: North America Electric Cars Market Market Share Comparison by By Product Technology (2016-2032)
- Figure 68: North America Electric Cars Market Market Share Comparison by By Components (2016-2032)
- Figure 69: North America Electric Cars Market Market Share Comparison by By Vehicle Type (2016-2032)
- Figure 70: North America Electric Cars Market Market Share Comparison by By Class (2016-2032)
- Figure 71: North America Electric Cars Market Market Share Comparison by By Speed (2016-2032)
- Figure 72: North America Electric Cars Market Market Share Comparison by By Drive Type (2016-2032)
- Figure 73: Western Europe Electric Cars Market Revenue (US$ Mn) Market Share by By Product Technologyin 2022
- Figure 74: Western Europe Electric Cars Market Market Attractiveness Analysis by By Product Technology, 2016-2032
- Figure 75: Western Europe Electric Cars Market Revenue (US$ Mn) Market Share by By Componentsin 2022
- Figure 76: Western Europe Electric Cars Market Market Attractiveness Analysis by By Components, 2016-2032
- Figure 77: Western Europe Electric Cars Market Revenue (US$ Mn) Market Share by By Vehicle Typein 2022
- Figure 78: Western Europe Electric Cars Market Market Attractiveness Analysis by By Vehicle Type, 2016-2032
- Figure 79: Western Europe Electric Cars Market Revenue (US$ Mn) Market Share by By Class in 2022
- Figure 80: Western Europe Electric Cars Market Market Attractiveness Analysis by By Class , 2016-2032
- Figure 81: Western Europe Electric Cars Market Revenue (US$ Mn) Market Share by By Speedin 2022
- Figure 82: Western Europe Electric Cars Market Market Attractiveness Analysis by By Speed, 2016-2032
- Figure 83: Western Europe Electric Cars Market Revenue (US$ Mn) Market Share by By Drive Typein 2022
- Figure 84: Western Europe Electric Cars Market Market Attractiveness Analysis by By Drive Type, 2016-2032
- Figure 85: Western Europe Electric Cars Market Revenue (US$ Mn) Market Share by Country in 2022
- Figure 86: Western Europe Electric Cars Market Market Attractiveness Analysis by Country, 2016-2032
- Figure 87: Western Europe Electric Cars Market Market Revenue (US$ Mn) (2016-2032)
- Figure 88: Western Europe Electric Cars Market Market Revenue (US$ Mn) Comparison by Country (2016-2032)
- Figure 89: Western Europe Electric Cars Market Market Revenue (US$ Mn) Comparison by By Product Technology (2016-2032)
- Figure 90: Western Europe Electric Cars Market Market Revenue (US$ Mn) Comparison by By Components (2016-2032)
- Figure 91: Western Europe Electric Cars Market Market Revenue (US$ Mn) Comparison by By Vehicle Type (2016-2032)
- Figure 92: Western Europe Electric Cars Market Market Revenue (US$ Mn) Comparison by By Class (2016-2032)
- Figure 93: Western Europe Electric Cars Market Market Revenue (US$ Mn) Comparison by By Speed (2016-2032)
- Figure 94: Western Europe Electric Cars Market Market Revenue (US$ Mn) Comparison by By Drive Type (2016-2032)
- Figure 95: Western Europe Electric Cars Market Market Y-o-Y Growth Rate Comparison by Country (2016-2032)
- Figure 96: Western Europe Electric Cars Market Market Y-o-Y Growth Rate Comparison by By Product Technology (2016-2032)
- Figure 97: Western Europe Electric Cars Market Market Y-o-Y Growth Rate Comparison by By Components (2016-2032)
- Figure 98: Western Europe Electric Cars Market Market Y-o-Y Growth Rate Comparison by By Vehicle Type (2016-2032)
- Figure 99: Western Europe Electric Cars Market Market Y-o-Y Growth Rate Comparison by By Class (2016-2032)
- Figure 100: Western Europe Electric Cars Market Market Y-o-Y Growth Rate Comparison by By Speed (2016-2032)
- Figure 101: Western Europe Electric Cars Market Market Y-o-Y Growth Rate Comparison by By Drive Type (2016-2032)
- Figure 102: Western Europe Electric Cars Market Market Share Comparison by Country (2016-2032)
- Figure 103: Western Europe Electric Cars Market Market Share Comparison by By Product Technology (2016-2032)
- Figure 104: Western Europe Electric Cars Market Market Share Comparison by By Components (2016-2032)
- Figure 105: Western Europe Electric Cars Market Market Share Comparison by By Vehicle Type (2016-2032)
- Figure 106: Western Europe Electric Cars Market Market Share Comparison by By Class (2016-2032)
- Figure 107: Western Europe Electric Cars Market Market Share Comparison by By Speed (2016-2032)
- Figure 108: Western Europe Electric Cars Market Market Share Comparison by By Drive Type (2016-2032)
- Figure 109: Eastern Europe Electric Cars Market Revenue (US$ Mn) Market Share by By Product Technologyin 2022
- Figure 110: Eastern Europe Electric Cars Market Market Attractiveness Analysis by By Product Technology, 2016-2032
- Figure 111: Eastern Europe Electric Cars Market Revenue (US$ Mn) Market Share by By Componentsin 2022
- Figure 112: Eastern Europe Electric Cars Market Market Attractiveness Analysis by By Components, 2016-2032
- Figure 113: Eastern Europe Electric Cars Market Revenue (US$ Mn) Market Share by By Vehicle Typein 2022
- Figure 114: Eastern Europe Electric Cars Market Market Attractiveness Analysis by By Vehicle Type, 2016-2032
- Figure 115: Eastern Europe Electric Cars Market Revenue (US$ Mn) Market Share by By Class in 2022
- Figure 116: Eastern Europe Electric Cars Market Market Attractiveness Analysis by By Class , 2016-2032
- Figure 117: Eastern Europe Electric Cars Market Revenue (US$ Mn) Market Share by By Speedin 2022
- Figure 118: Eastern Europe Electric Cars Market Market Attractiveness Analysis by By Speed, 2016-2032
- Figure 119: Eastern Europe Electric Cars Market Revenue (US$ Mn) Market Share by By Drive Typein 2022
- Figure 120: Eastern Europe Electric Cars Market Market Attractiveness Analysis by By Drive Type, 2016-2032
- Figure 121: Eastern Europe Electric Cars Market Revenue (US$ Mn) Market Share by Country in 2022
- Figure 122: Eastern Europe Electric Cars Market Market Attractiveness Analysis by Country, 2016-2032
- Figure 123: Eastern Europe Electric Cars Market Market Revenue (US$ Mn) (2016-2032)
- Figure 124: Eastern Europe Electric Cars Market Market Revenue (US$ Mn) Comparison by Country (2016-2032)
- Figure 125: Eastern Europe Electric Cars Market Market Revenue (US$ Mn) Comparison by By Product Technology (2016-2032)
- Figure 126: Eastern Europe Electric Cars Market Market Revenue (US$ Mn) Comparison by By Components (2016-2032)
- Figure 127: Eastern Europe Electric Cars Market Market Revenue (US$ Mn) Comparison by By Vehicle Type (2016-2032)
- Figure 128: Eastern Europe Electric Cars Market Market Revenue (US$ Mn) Comparison by By Class (2016-2032)
- Figure 129: Eastern Europe Electric Cars Market Market Revenue (US$ Mn) Comparison by By Speed (2016-2032)
- Figure 130: Eastern Europe Electric Cars Market Market Revenue (US$ Mn) Comparison by By Drive Type (2016-2032)
- Figure 131: Eastern Europe Electric Cars Market Market Y-o-Y Growth Rate Comparison by Country (2016-2032)
- Figure 132: Eastern Europe Electric Cars Market Market Y-o-Y Growth Rate Comparison by By Product Technology (2016-2032)
- Figure 133: Eastern Europe Electric Cars Market Market Y-o-Y Growth Rate Comparison by By Components (2016-2032)
- Figure 134: Eastern Europe Electric Cars Market Market Y-o-Y Growth Rate Comparison by By Vehicle Type (2016-2032)
- Figure 135: Eastern Europe Electric Cars Market Market Y-o-Y Growth Rate Comparison by By Class (2016-2032)
- Figure 136: Eastern Europe Electric Cars Market Market Y-o-Y Growth Rate Comparison by By Speed (2016-2032)
- Figure 137: Eastern Europe Electric Cars Market Market Y-o-Y Growth Rate Comparison by By Drive Type (2016-2032)
- Figure 138: Eastern Europe Electric Cars Market Market Share Comparison by Country (2016-2032)
- Figure 139: Eastern Europe Electric Cars Market Market Share Comparison by By Product Technology (2016-2032)
- Figure 140: Eastern Europe Electric Cars Market Market Share Comparison by By Components (2016-2032)
- Figure 141: Eastern Europe Electric Cars Market Market Share Comparison by By Vehicle Type (2016-2032)
- Figure 142: Eastern Europe Electric Cars Market Market Share Comparison by By Class (2016-2032)
- Figure 143: Eastern Europe Electric Cars Market Market Share Comparison by By Speed (2016-2032)
- Figure 144: Eastern Europe Electric Cars Market Market Share Comparison by By Drive Type (2016-2032)
- Figure 145: APAC Electric Cars Market Revenue (US$ Mn) Market Share by By Product Technologyin 2022
- Figure 146: APAC Electric Cars Market Market Attractiveness Analysis by By Product Technology, 2016-2032
- Figure 147: APAC Electric Cars Market Revenue (US$ Mn) Market Share by By Componentsin 2022
- Figure 148: APAC Electric Cars Market Market Attractiveness Analysis by By Components, 2016-2032
- Figure 149: APAC Electric Cars Market Revenue (US$ Mn) Market Share by By Vehicle Typein 2022
- Figure 150: APAC Electric Cars Market Market Attractiveness Analysis by By Vehicle Type, 2016-2032
- Figure 151: APAC Electric Cars Market Revenue (US$ Mn) Market Share by By Class in 2022
- Figure 152: APAC Electric Cars Market Market Attractiveness Analysis by By Class , 2016-2032
- Figure 153: APAC Electric Cars Market Revenue (US$ Mn) Market Share by By Speedin 2022
- Figure 154: APAC Electric Cars Market Market Attractiveness Analysis by By Speed, 2016-2032
- Figure 155: APAC Electric Cars Market Revenue (US$ Mn) Market Share by By Drive Typein 2022
- Figure 156: APAC Electric Cars Market Market Attractiveness Analysis by By Drive Type, 2016-2032
- Figure 157: APAC Electric Cars Market Revenue (US$ Mn) Market Share by Country in 2022
- Figure 158: APAC Electric Cars Market Market Attractiveness Analysis by Country, 2016-2032
- Figure 159: APAC Electric Cars Market Market Revenue (US$ Mn) (2016-2032)
- Figure 160: APAC Electric Cars Market Market Revenue (US$ Mn) Comparison by Country (2016-2032)
- Figure 161: APAC Electric Cars Market Market Revenue (US$ Mn) Comparison by By Product Technology (2016-2032)
- Figure 162: APAC Electric Cars Market Market Revenue (US$ Mn) Comparison by By Components (2016-2032)
- Figure 163: APAC Electric Cars Market Market Revenue (US$ Mn) Comparison by By Vehicle Type (2016-2032)
- Figure 164: APAC Electric Cars Market Market Revenue (US$ Mn) Comparison by By Class (2016-2032)
- Figure 165: APAC Electric Cars Market Market Revenue (US$ Mn) Comparison by By Speed (2016-2032)
- Figure 166: APAC Electric Cars Market Market Revenue (US$ Mn) Comparison by By Drive Type (2016-2032)
- Figure 167: APAC Electric Cars Market Market Y-o-Y Growth Rate Comparison by Country (2016-2032)
- Figure 168: APAC Electric Cars Market Market Y-o-Y Growth Rate Comparison by By Product Technology (2016-2032)
- Figure 169: APAC Electric Cars Market Market Y-o-Y Growth Rate Comparison by By Components (2016-2032)
- Figure 170: APAC Electric Cars Market Market Y-o-Y Growth Rate Comparison by By Vehicle Type (2016-2032)
- Figure 171: APAC Electric Cars Market Market Y-o-Y Growth Rate Comparison by By Class (2016-2032)
- Figure 172: APAC Electric Cars Market Market Y-o-Y Growth Rate Comparison by By Speed (2016-2032)
- Figure 173: APAC Electric Cars Market Market Y-o-Y Growth Rate Comparison by By Drive Type (2016-2032)
- Figure 174: APAC Electric Cars Market Market Share Comparison by Country (2016-2032)
- Figure 175: APAC Electric Cars Market Market Share Comparison by By Product Technology (2016-2032)
- Figure 176: APAC Electric Cars Market Market Share Comparison by By Components (2016-2032)
- Figure 177: APAC Electric Cars Market Market Share Comparison by By Vehicle Type (2016-2032)
- Figure 178: APAC Electric Cars Market Market Share Comparison by By Class (2016-2032)
- Figure 179: APAC Electric Cars Market Market Share Comparison by By Speed (2016-2032)
- Figure 180: APAC Electric Cars Market Market Share Comparison by By Drive Type (2016-2032)
- Figure 181: Latin America Electric Cars Market Revenue (US$ Mn) Market Share by By Product Technologyin 2022
- Figure 182: Latin America Electric Cars Market Market Attractiveness Analysis by By Product Technology, 2016-2032
- Figure 183: Latin America Electric Cars Market Revenue (US$ Mn) Market Share by By Componentsin 2022
- Figure 184: Latin America Electric Cars Market Market Attractiveness Analysis by By Components, 2016-2032
- Figure 185: Latin America Electric Cars Market Revenue (US$ Mn) Market Share by By Vehicle Typein 2022
- Figure 186: Latin America Electric Cars Market Market Attractiveness Analysis by By Vehicle Type, 2016-2032
- Figure 187: Latin America Electric Cars Market Revenue (US$ Mn) Market Share by By Class in 2022
- Figure 188: Latin America Electric Cars Market Market Attractiveness Analysis by By Class , 2016-2032
- Figure 189: Latin America Electric Cars Market Revenue (US$ Mn) Market Share by By Speedin 2022
- Figure 190: Latin America Electric Cars Market Market Attractiveness Analysis by By Speed, 2016-2032
- Figure 191: Latin America Electric Cars Market Revenue (US$ Mn) Market Share by By Drive Typein 2022
- Figure 192: Latin America Electric Cars Market Market Attractiveness Analysis by By Drive Type, 2016-2032
- Figure 193: Latin America Electric Cars Market Revenue (US$ Mn) Market Share by Country in 2022
- Figure 194: Latin America Electric Cars Market Market Attractiveness Analysis by Country, 2016-2032
- Figure 195: Latin America Electric Cars Market Market Revenue (US$ Mn) (2016-2032)
- Figure 196: Latin America Electric Cars Market Market Revenue (US$ Mn) Comparison by Country (2016-2032)
- Figure 197: Latin America Electric Cars Market Market Revenue (US$ Mn) Comparison by By Product Technology (2016-2032)
- Figure 198: Latin America Electric Cars Market Market Revenue (US$ Mn) Comparison by By Components (2016-2032)
- Figure 199: Latin America Electric Cars Market Market Revenue (US$ Mn) Comparison by By Vehicle Type (2016-2032)
- Figure 200: Latin America Electric Cars Market Market Revenue (US$ Mn) Comparison by By Class (2016-2032)
- Figure 201: Latin America Electric Cars Market Market Revenue (US$ Mn) Comparison by By Speed (2016-2032)
- Figure 202: Latin America Electric Cars Market Market Revenue (US$ Mn) Comparison by By Drive Type (2016-2032)
- Figure 203: Latin America Electric Cars Market Market Y-o-Y Growth Rate Comparison by Country (2016-2032)
- Figure 204: Latin America Electric Cars Market Market Y-o-Y Growth Rate Comparison by By Product Technology (2016-2032)
- Figure 205: Latin America Electric Cars Market Market Y-o-Y Growth Rate Comparison by By Components (2016-2032)
- Figure 206: Latin America Electric Cars Market Market Y-o-Y Growth Rate Comparison by By Vehicle Type (2016-2032)
- Figure 207: Latin America Electric Cars Market Market Y-o-Y Growth Rate Comparison by By Class (2016-2032)
- Figure 208: Latin America Electric Cars Market Market Y-o-Y Growth Rate Comparison by By Speed (2016-2032)
- Figure 209: Latin America Electric Cars Market Market Y-o-Y Growth Rate Comparison by By Drive Type (2016-2032)
- Figure 210: Latin America Electric Cars Market Market Share Comparison by Country (2016-2032)
- Figure 211: Latin America Electric Cars Market Market Share Comparison by By Product Technology (2016-2032)
- Figure 212: Latin America Electric Cars Market Market Share Comparison by By Components (2016-2032)
- Figure 213: Latin America Electric Cars Market Market Share Comparison by By Vehicle Type (2016-2032)
- Figure 214: Latin America Electric Cars Market Market Share Comparison by By Class (2016-2032)
- Figure 215: Latin America Electric Cars Market Market Share Comparison by By Speed (2016-2032)
- Figure 216: Latin America Electric Cars Market Market Share Comparison by By Drive Type (2016-2032)
- Figure 217: Middle East & Africa Electric Cars Market Revenue (US$ Mn) Market Share by By Product Technologyin 2022
- Figure 218: Middle East & Africa Electric Cars Market Market Attractiveness Analysis by By Product Technology, 2016-2032
- Figure 219: Middle East & Africa Electric Cars Market Revenue (US$ Mn) Market Share by By Componentsin 2022
- Figure 220: Middle East & Africa Electric Cars Market Market Attractiveness Analysis by By Components, 2016-2032
- Figure 221: Middle East & Africa Electric Cars Market Revenue (US$ Mn) Market Share by By Vehicle Typein 2022
- Figure 222: Middle East & Africa Electric Cars Market Market Attractiveness Analysis by By Vehicle Type, 2016-2032
- Figure 223: Middle East & Africa Electric Cars Market Revenue (US$ Mn) Market Share by By Class in 2022
- Figure 224: Middle East & Africa Electric Cars Market Market Attractiveness Analysis by By Class , 2016-2032
- Figure 225: Middle East & Africa Electric Cars Market Revenue (US$ Mn) Market Share by By Speedin 2022
- Figure 226: Middle East & Africa Electric Cars Market Market Attractiveness Analysis by By Speed, 2016-2032
- Figure 227: Middle East & Africa Electric Cars Market Revenue (US$ Mn) Market Share by By Drive Typein 2022
- Figure 228: Middle East & Africa Electric Cars Market Market Attractiveness Analysis by By Drive Type, 2016-2032
- Figure 229: Middle East & Africa Electric Cars Market Revenue (US$ Mn) Market Share by Country in 2022
- Figure 230: Middle East & Africa Electric Cars Market Market Attractiveness Analysis by Country, 2016-2032
- Figure 231: Middle East & Africa Electric Cars Market Market Revenue (US$ Mn) (2016-2032)
- Figure 232: Middle East & Africa Electric Cars Market Market Revenue (US$ Mn) Comparison by Country (2016-2032)
- Figure 233: Middle East & Africa Electric Cars Market Market Revenue (US$ Mn) Comparison by By Product Technology (2016-2032)
- Figure 234: Middle East & Africa Electric Cars Market Market Revenue (US$ Mn) Comparison by By Components (2016-2032)
- Figure 235: Middle East & Africa Electric Cars Market Market Revenue (US$ Mn) Comparison by By Vehicle Type (2016-2032)
- Figure 236: Middle East & Africa Electric Cars Market Market Revenue (US$ Mn) Comparison by By Class (2016-2032)
- Figure 237: Middle East & Africa Electric Cars Market Market Revenue (US$ Mn) Comparison by By Speed (2016-2032)
- Figure 238: Middle East & Africa Electric Cars Market Market Revenue (US$ Mn) Comparison by By Drive Type (2016-2032)
- Figure 239: Middle East & Africa Electric Cars Market Market Y-o-Y Growth Rate Comparison by Country (2016-2032)
- Figure 240: Middle East & Africa Electric Cars Market Market Y-o-Y Growth Rate Comparison by By Product Technology (2016-2032)
- Figure 241: Middle East & Africa Electric Cars Market Market Y-o-Y Growth Rate Comparison by By Components (2016-2032)
- Figure 242: Middle East & Africa Electric Cars Market Market Y-o-Y Growth Rate Comparison by By Vehicle Type (2016-2032)
- Figure 243: Middle East & Africa Electric Cars Market Market Y-o-Y Growth Rate Comparison by By Class (2016-2032)
- Figure 244: Middle East & Africa Electric Cars Market Market Y-o-Y Growth Rate Comparison by By Speed (2016-2032)
- Figure 245: Middle East & Africa Electric Cars Market Market Y-o-Y Growth Rate Comparison by By Drive Type (2016-2032)
- Figure 246: Middle East & Africa Electric Cars Market Market Share Comparison by Country (2016-2032)
- Figure 247: Middle East & Africa Electric Cars Market Market Share Comparison by By Product Technology (2016-2032)
- Figure 248: Middle East & Africa Electric Cars Market Market Share Comparison by By Components (2016-2032)
- Figure 249: Middle East & Africa Electric Cars Market Market Share Comparison by By Vehicle Type (2016-2032)
- Figure 250: Middle East & Africa Electric Cars Market Market Share Comparison by By Class (2016-2032)
- Figure 251: Middle East & Africa Electric Cars Market Market Share Comparison by By Speed (2016-2032)
- Figure 252: Middle East & Africa Electric Cars Market Market Share Comparison by By Drive Type (2016-2032)
"
- List of Tables
- "
- Table 1: Global Electric Cars Market Market Comparison by By Product Technology (2016-2032)
- Table 2: Global Electric Cars Market Market Comparison by By Components (2016-2032)
- Table 3: Global Electric Cars Market Market Comparison by By Vehicle Type (2016-2032)
- Table 4: Global Electric Cars Market Market Comparison by By Class (2016-2032)
- Table 5: Global Electric Cars Market Market Comparison by By Speed (2016-2032)
- Table 6: Global Electric Cars Market Market Comparison by By Drive Type (2016-2032)
- Table 7: Global Electric Cars Market Revenue (US$ Mn) Comparison by Region (2016-2032)
- Table 8: Global Electric Cars Market Market Revenue (US$ Mn) (2016-2032)
- Table 9: Global Electric Cars Market Market Revenue (US$ Mn) Comparison by Region (2016-2032)
- Table 10: Global Electric Cars Market Market Revenue (US$ Mn) Comparison by By Product Technology (2016-2032)
- Table 11: Global Electric Cars Market Market Revenue (US$ Mn) Comparison by By Components (2016-2032)
- Table 12: Global Electric Cars Market Market Revenue (US$ Mn) Comparison by By Vehicle Type (2016-2032)
- Table 13: Global Electric Cars Market Market Revenue (US$ Mn) Comparison by By Class (2016-2032)
- Table 14: Global Electric Cars Market Market Revenue (US$ Mn) Comparison by By Speed (2016-2032)
- Table 15: Global Electric Cars Market Market Revenue (US$ Mn) Comparison by By Drive Type (2016-2032)
- Table 16: Global Electric Cars Market Market Y-o-Y Growth Rate Comparison by Region (2016-2032)
- Table 17: Global Electric Cars Market Market Y-o-Y Growth Rate Comparison by By Product Technology (2016-2032)
- Table 18: Global Electric Cars Market Market Y-o-Y Growth Rate Comparison by By Components (2016-2032)
- Table 19: Global Electric Cars Market Market Y-o-Y Growth Rate Comparison by By Vehicle Type (2016-2032)
- Table 20: Global Electric Cars Market Market Y-o-Y Growth Rate Comparison by By Class (2016-2032)
- Table 21: Global Electric Cars Market Market Y-o-Y Growth Rate Comparison by By Speed (2016-2032)
- Table 22: Global Electric Cars Market Market Y-o-Y Growth Rate Comparison by By Drive Type (2016-2032)
- Table 23: Global Electric Cars Market Market Share Comparison by Region (2016-2032)
- Table 24: Global Electric Cars Market Market Share Comparison by By Product Technology (2016-2032)
- Table 25: Global Electric Cars Market Market Share Comparison by By Components (2016-2032)
- Table 26: Global Electric Cars Market Market Share Comparison by By Vehicle Type (2016-2032)
- Table 27: Global Electric Cars Market Market Share Comparison by By Class (2016-2032)
- Table 28: Global Electric Cars Market Market Share Comparison by By Speed (2016-2032)
- Table 29: Global Electric Cars Market Market Share Comparison by By Drive Type (2016-2032)
- Table 30: North America Electric Cars Market Market Comparison by By Components (2016-2032)
- Table 31: North America Electric Cars Market Market Comparison by By Vehicle Type (2016-2032)
- Table 32: North America Electric Cars Market Market Comparison by By Class (2016-2032)
- Table 33: North America Electric Cars Market Market Comparison by By Speed (2016-2032)
- Table 34: North America Electric Cars Market Market Comparison by By Drive Type (2016-2032)
- Table 35: North America Electric Cars Market Revenue (US$ Mn) Comparison by Country (2016-2032)
- Table 36: North America Electric Cars Market Market Revenue (US$ Mn) (2016-2032)
- Table 37: North America Electric Cars Market Market Revenue (US$ Mn) Comparison by Country (2016-2032)
- Table 38: North America Electric Cars Market Market Revenue (US$ Mn) Comparison by By Product Technology (2016-2032)
- Table 39: North America Electric Cars Market Market Revenue (US$ Mn) Comparison by By Components (2016-2032)
- Table 40: North America Electric Cars Market Market Revenue (US$ Mn) Comparison by By Vehicle Type (2016-2032)
- Table 41: North America Electric Cars Market Market Revenue (US$ Mn) Comparison by By Class (2016-2032)
- Table 42: North America Electric Cars Market Market Revenue (US$ Mn) Comparison by By Speed (2016-2032)
- Table 43: North America Electric Cars Market Market Revenue (US$ Mn) Comparison by By Drive Type (2016-2032)
- Table 44: North America Electric Cars Market Market Y-o-Y Growth Rate Comparison by Country (2016-2032)
- Table 45: North America Electric Cars Market Market Y-o-Y Growth Rate Comparison by By Product Technology (2016-2032)
- Table 46: North America Electric Cars Market Market Y-o-Y Growth Rate Comparison by By Components (2016-2032)
- Table 47: North America Electric Cars Market Market Y-o-Y Growth Rate Comparison by By Vehicle Type (2016-2032)
- Table 48: North America Electric Cars Market Market Y-o-Y Growth Rate Comparison by By Class (2016-2032)
- Table 49: North America Electric Cars Market Market Y-o-Y Growth Rate Comparison by By Speed (2016-2032)
- Table 50: North America Electric Cars Market Market Y-o-Y Growth Rate Comparison by By Drive Type (2016-2032)
- Table 51: North America Electric Cars Market Market Share Comparison by Country (2016-2032)
- Table 52: North America Electric Cars Market Market Share Comparison by By Product Technology (2016-2032)
- Table 53: North America Electric Cars Market Market Share Comparison by By Components (2016-2032)
- Table 54: North America Electric Cars Market Market Share Comparison by By Vehicle Type (2016-2032)
- Table 55: North America Electric Cars Market Market Share Comparison by By Class (2016-2032)
- Table 56: North America Electric Cars Market Market Share Comparison by By Speed (2016-2032)
- Table 57: North America Electric Cars Market Market Share Comparison by By Drive Type (2016-2032)
- Table 58: Western Europe Electric Cars Market Market Comparison by By Product Technology (2016-2032)
- Table 59: Western Europe Electric Cars Market Market Comparison by By Components (2016-2032)
- Table 60: Western Europe Electric Cars Market Market Comparison by By Vehicle Type (2016-2032)
- Table 61: Western Europe Electric Cars Market Market Comparison by By Class (2016-2032)
- Table 62: Western Europe Electric Cars Market Market Comparison by By Speed (2016-2032)
- Table 63: Western Europe Electric Cars Market Market Comparison by By Drive Type (2016-2032)
- Table 64: Western Europe Electric Cars Market Revenue (US$ Mn) Comparison by Country (2016-2032)
- Table 65: Western Europe Electric Cars Market Market Revenue (US$ Mn) (2016-2032)
- Table 66: Western Europe Electric Cars Market Market Revenue (US$ Mn) Comparison by Country (2016-2032)
- Table 67: Western Europe Electric Cars Market Market Revenue (US$ Mn) Comparison by By Product Technology (2016-2032)
- Table 68: Western Europe Electric Cars Market Market Revenue (US$ Mn) Comparison by By Components (2016-2032)
- Table 69: Western Europe Electric Cars Market Market Revenue (US$ Mn) Comparison by By Vehicle Type (2016-2032)
- Table 70: Western Europe Electric Cars Market Market Revenue (US$ Mn) Comparison by By Class (2016-2032)
- Table 71: Western Europe Electric Cars Market Market Revenue (US$ Mn) Comparison by By Speed (2016-2032)
- Table 72: Western Europe Electric Cars Market Market Revenue (US$ Mn) Comparison by By Drive Type (2016-2032)
- Table 73: Western Europe Electric Cars Market Market Y-o-Y Growth Rate Comparison by Country (2016-2032)
- Table 74: Western Europe Electric Cars Market Market Y-o-Y Growth Rate Comparison by By Product Technology (2016-2032)
- Table 75: Western Europe Electric Cars Market Market Y-o-Y Growth Rate Comparison by By Components (2016-2032)
- Table 76: Western Europe Electric Cars Market Market Y-o-Y Growth Rate Comparison by By Vehicle Type (2016-2032)
- Table 77: Western Europe Electric Cars Market Market Y-o-Y Growth Rate Comparison by By Class (2016-2032)
- Table 78: Western Europe Electric Cars Market Market Y-o-Y Growth Rate Comparison by By Speed (2016-2032)
- Table 79: Western Europe Electric Cars Market Market Y-o-Y Growth Rate Comparison by By Drive Type (2016-2032)
- Table 80: Western Europe Electric Cars Market Market Share Comparison by Country (2016-2032)
- Table 81: Western Europe Electric Cars Market Market Share Comparison by By Product Technology (2016-2032)
- Table 82: Western Europe Electric Cars Market Market Share Comparison by By Components (2016-2032)
- Table 83: Western Europe Electric Cars Market Market Share Comparison by By Vehicle Type (2016-2032)
- Table 84: Western Europe Electric Cars Market Market Share Comparison by By Class (2016-2032)
- Table 85: Western Europe Electric Cars Market Market Share Comparison by By Speed (2016-2032)
- Table 86: Western Europe Electric Cars Market Market Share Comparison by By Drive Type (2016-2032)
- Table 87: Eastern Europe Electric Cars Market Market Comparison by By Product Technology (2016-2032)
- Table 88: Eastern Europe Electric Cars Market Market Comparison by By Components (2016-2032)
- Table 89: Eastern Europe Electric Cars Market Market Comparison by By Vehicle Type (2016-2032)
- Table 90: Eastern Europe Electric Cars Market Market Comparison by By Class (2016-2032)
- Table 91: Eastern Europe Electric Cars Market Market Comparison by By Speed (2016-2032)
- Table 92: Eastern Europe Electric Cars Market Market Comparison by By Drive Type (2016-2032)
- Table 93: Eastern Europe Electric Cars Market Revenue (US$ Mn) Comparison by Country (2016-2032)
- Table 94: Eastern Europe Electric Cars Market Market Revenue (US$ Mn) (2016-2032)
- Table 95: Eastern Europe Electric Cars Market Market Revenue (US$ Mn) Comparison by Country (2016-2032)
- Table 96: Eastern Europe Electric Cars Market Market Revenue (US$ Mn) Comparison by By Product Technology (2016-2032)
- Table 97: Eastern Europe Electric Cars Market Market Revenue (US$ Mn) Comparison by By Components (2016-2032)
- Table 98: Eastern Europe Electric Cars Market Market Revenue (US$ Mn) Comparison by By Vehicle Type (2016-2032)
- Table 99: Eastern Europe Electric Cars Market Market Revenue (US$ Mn) Comparison by By Class (2016-2032)
- Table 100: Eastern Europe Electric Cars Market Market Revenue (US$ Mn) Comparison by By Speed (2016-2032)
- Table 101: Eastern Europe Electric Cars Market Market Revenue (US$ Mn) Comparison by By Drive Type (2016-2032)
- Table 102: Eastern Europe Electric Cars Market Market Y-o-Y Growth Rate Comparison by Country (2016-2032)
- Table 103: Eastern Europe Electric Cars Market Market Y-o-Y Growth Rate Comparison by By Product Technology (2016-2032)
- Table 104: Eastern Europe Electric Cars Market Market Y-o-Y Growth Rate Comparison by By Components (2016-2032)
- Table 105: Eastern Europe Electric Cars Market Market Y-o-Y Growth Rate Comparison by By Vehicle Type (2016-2032)
- Table 106: Eastern Europe Electric Cars Market Market Y-o-Y Growth Rate Comparison by By Class (2016-2032)
- Table 107: Eastern Europe Electric Cars Market Market Y-o-Y Growth Rate Comparison by By Speed (2016-2032)
- Table 108: Eastern Europe Electric Cars Market Market Y-o-Y Growth Rate Comparison by By Drive Type (2016-2032)
- Table 109: Eastern Europe Electric Cars Market Market Share Comparison by Country (2016-2032)
- Table 110: Eastern Europe Electric Cars Market Market Share Comparison by By Product Technology (2016-2032)
- Table 111: Eastern Europe Electric Cars Market Market Share Comparison by By Components (2016-2032)
- Table 112: Eastern Europe Electric Cars Market Market Share Comparison by By Vehicle Type (2016-2032)
- Table 113: Eastern Europe Electric Cars Market Market Share Comparison by By Class (2016-2032)
- Table 114: Eastern Europe Electric Cars Market Market Share Comparison by By Speed (2016-2032)
- Table 115: Eastern Europe Electric Cars Market Market Share Comparison by By Drive Type (2016-2032)
- Table 116: APAC Electric Cars Market Market Comparison by By Product Technology (2016-2032)
- Table 117: APAC Electric Cars Market Market Comparison by By Components (2016-2032)
- Table 118: APAC Electric Cars Market Market Comparison by By Vehicle Type (2016-2032)
- Table 119: APAC Electric Cars Market Market Comparison by By Class (2016-2032)
- Table 120: APAC Electric Cars Market Market Comparison by By Speed (2016-2032)
- Table 121: APAC Electric Cars Market Market Comparison by By Drive Type (2016-2032)
- Table 122: APAC Electric Cars Market Revenue (US$ Mn) Comparison by Country (2016-2032)
- Table 123: APAC Electric Cars Market Market Revenue (US$ Mn) (2016-2032)
- Table 124: APAC Electric Cars Market Market Revenue (US$ Mn) Comparison by Country (2016-2032)
- Table 125: APAC Electric Cars Market Market Revenue (US$ Mn) Comparison by By Product Technology (2016-2032)
- Table 126: APAC Electric Cars Market Market Revenue (US$ Mn) Comparison by By Components (2016-2032)
- Table 127: APAC Electric Cars Market Market Revenue (US$ Mn) Comparison by By Vehicle Type (2016-2032)
- Table 128: APAC Electric Cars Market Market Revenue (US$ Mn) Comparison by By Class (2016-2032)
- Table 129: APAC Electric Cars Market Market Revenue (US$ Mn) Comparison by By Speed (2016-2032)
- Table 130: APAC Electric Cars Market Market Revenue (US$ Mn) Comparison by By Drive Type (2016-2032)
- Table 131: APAC Electric Cars Market Market Y-o-Y Growth Rate Comparison by Country (2016-2032)
- Table 132: APAC Electric Cars Market Market Y-o-Y Growth Rate Comparison by By Product Technology (2016-2032)
- Table 133: APAC Electric Cars Market Market Y-o-Y Growth Rate Comparison by By Components (2016-2032)
- Table 134: APAC Electric Cars Market Market Y-o-Y Growth Rate Comparison by By Vehicle Type (2016-2032)
- Table 135: APAC Electric Cars Market Market Y-o-Y Growth Rate Comparison by By Class (2016-2032)
- Table 136: APAC Electric Cars Market Market Y-o-Y Growth Rate Comparison by By Speed (2016-2032)
- Table 137: APAC Electric Cars Market Market Y-o-Y Growth Rate Comparison by By Drive Type (2016-2032)
- Table 138: APAC Electric Cars Market Market Share Comparison by Country (2016-2032)
- Table 139: APAC Electric Cars Market Market Share Comparison by By Product Technology (2016-2032)
- Table 140: APAC Electric Cars Market Market Share Comparison by By Components (2016-2032)
- Table 141: APAC Electric Cars Market Market Share Comparison by By Vehicle Type (2016-2032)
- Table 142: APAC Electric Cars Market Market Share Comparison by By Class (2016-2032)
- Table 143: APAC Electric Cars Market Market Share Comparison by By Speed (2016-2032)
- Table 144: APAC Electric Cars Market Market Share Comparison by By Drive Type (2016-2032)
- Table 145: Latin America Electric Cars Market Market Comparison by By Product Technology (2016-2032)
- Table 146: Latin America Electric Cars Market Market Comparison by By Components (2016-2032)
- Table 147: Latin America Electric Cars Market Market Comparison by By Vehicle Type (2016-2032)
- Table 148: Latin America Electric Cars Market Market Comparison by By Class (2016-2032)
- Table 149: Latin America Electric Cars Market Market Comparison by By Speed (2016-2032)
- Table 150: Latin America Electric Cars Market Market Comparison by By Drive Type (2016-2032)
- Table 151: Latin America Electric Cars Market Revenue (US$ Mn) Comparison by Country (2016-2032)
- Table 152: Latin America Electric Cars Market Market Revenue (US$ Mn) (2016-2032)
- Table 153: Latin America Electric Cars Market Market Revenue (US$ Mn) Comparison by Country (2016-2032)
- Table 154: Latin America Electric Cars Market Market Revenue (US$ Mn) Comparison by By Product Technology (2016-2032)
- Table 155: Latin America Electric Cars Market Market Revenue (US$ Mn) Comparison by By Components (2016-2032)
- Table 156: Latin America Electric Cars Market Market Revenue (US$ Mn) Comparison by By Vehicle Type (2016-2032)
- Table 157: Latin America Electric Cars Market Market Revenue (US$ Mn) Comparison by By Class (2016-2032)
- Table 158: Latin America Electric Cars Market Market Revenue (US$ Mn) Comparison by By Speed (2016-2032)
- Table 159: Latin America Electric Cars Market Market Revenue (US$ Mn) Comparison by By Drive Type (2016-2032)
- Table 160: Latin America Electric Cars Market Market Y-o-Y Growth Rate Comparison by Country (2016-2032)
- Table 161: Latin America Electric Cars Market Market Y-o-Y Growth Rate Comparison by By Product Technology (2016-2032)
- Table 162: Latin America Electric Cars Market Market Y-o-Y Growth Rate Comparison by By Components (2016-2032)
- Table 163: Latin America Electric Cars Market Market Y-o-Y Growth Rate Comparison by By Vehicle Type (2016-2032)
- Table 164: Latin America Electric Cars Market Market Y-o-Y Growth Rate Comparison by By Class (2016-2032)
- Table 165: Latin America Electric Cars Market Market Y-o-Y Growth Rate Comparison by By Speed (2016-2032)
- Table 166: Latin America Electric Cars Market Market Y-o-Y Growth Rate Comparison by By Drive Type (2016-2032)
- Table 167: Latin America Electric Cars Market Market Share Comparison by Country (2016-2032)
- Table 168: Latin America Electric Cars Market Market Share Comparison by By Product Technology (2016-2032)
- Table 169: Latin America Electric Cars Market Market Share Comparison by By Components (2016-2032)
- Table 170: Latin America Electric Cars Market Market Share Comparison by By Vehicle Type (2016-2032)
- Table 171: Latin America Electric Cars Market Market Share Comparison by By Class (2016-2032)
- Table 172: Latin America Electric Cars Market Market Share Comparison by By Speed (2016-2032)
- Table 173: Latin America Electric Cars Market Market Share Comparison by By Drive Type (2016-2032)
- Table 174: Middle East & Africa Electric Cars Market Market Comparison by By Product Technology (2016-2032)
- Table 175: Middle East & Africa Electric Cars Market Market Comparison by By Components (2016-2032)
- Table 176: Middle East & Africa Electric Cars Market Market Comparison by By Vehicle Type (2016-2032)
- Table 177: Middle East & Africa Electric Cars Market Market Comparison by By Class (2016-2032)
- Table 178: Middle East & Africa Electric Cars Market Market Comparison by By Speed (2016-2032)
- Table 179: Middle East & Africa Electric Cars Market Market Comparison by By Drive Type (2016-2032)
- Table 180: Middle East & Africa Electric Cars Market Revenue (US$ Mn) Comparison by Country (2016-2032)
- Table 181: Middle East & Africa Electric Cars Market Market Revenue (US$ Mn) (2016-2032)
- Table 182: Middle East & Africa Electric Cars Market Market Revenue (US$ Mn) Comparison by Country (2016-2032)
- Table 183: Middle East & Africa Electric Cars Market Market Revenue (US$ Mn) Comparison by By Product Technology (2016-2032)
- Table 184: Middle East & Africa Electric Cars Market Market Revenue (US$ Mn) Comparison by By Components (2016-2032)
- Table 185: Middle East & Africa Electric Cars Market Market Revenue (US$ Mn) Comparison by By Vehicle Type (2016-2032)
- Table 186: Middle East & Africa Electric Cars Market Market Revenue (US$ Mn) Comparison by By Class (2016-2032)
- Table 187: Middle East & Africa Electric Cars Market Market Revenue (US$ Mn) Comparison by By Speed (2016-2032)
- Table 188: Middle East & Africa Electric Cars Market Market Revenue (US$ Mn) Comparison by By Drive Type (2016-2032)
- Table 189: Middle East & Africa Electric Cars Market Market Y-o-Y Growth Rate Comparison by Country (2016-2032)
- Table 190: Middle East & Africa Electric Cars Market Market Y-o-Y Growth Rate Comparison by By Product Technology (2016-2032)
- Table 191: Middle East & Africa Electric Cars Market Market Y-o-Y Growth Rate Comparison by By Components (2016-2032)
- Table 192: Middle East & Africa Electric Cars Market Market Y-o-Y Growth Rate Comparison by By Vehicle Type (2016-2032)
- Table 193: Middle East & Africa Electric Cars Market Market Y-o-Y Growth Rate Comparison by By Class (2016-2032)
- Table 194: Middle East & Africa Electric Cars Market Market Y-o-Y Growth Rate Comparison by By Speed (2016-2032)
- Table 195: Middle East & Africa Electric Cars Market Market Y-o-Y Growth Rate Comparison by By Drive Type (2016-2032)
- Table 196: Middle East & Africa Electric Cars Market Market Share Comparison by Country (2016-2032)
- Table 197: Middle East & Africa Electric Cars Market Market Share Comparison by By Product Technology (2016-2032)
- Table 198: Middle East & Africa Electric Cars Market Market Share Comparison by By Components (2016-2032)
- Table 199: Middle East & Africa Electric Cars Market Market Share Comparison by By Vehicle Type (2016-2032)
- Table 200: Middle East & Africa Electric Cars Market Market Share Comparison by By Class (2016-2032)
- Table 201: Middle East & Africa Electric Cars Market Market Share Comparison by By Speed (2016-2032)
- Table 202: Middle East & Africa Electric Cars Market Market Share Comparison by By Drive Type (2016-2032)
- 1. Executive Summary
-
- BMW AG (Germany)
- BYD Company Limited (China)
- Daimler AG (Germany)
- Energica Motor Company (Italy)
- Ford Motor (US)
- General Motors (US)
- Hyundai Motor Company (South Korea)
- Karma Automotive (China)
- Kia Corporation (South Korea)
- Lucid Group Inc. (US)
- Mahindra Electric Mobility Limited (India)
- Nissan Motors Co., Ltd. (Japan)
- Tata Motors (India)
- Tesla, Inc. (US)
- Toyota Motor Corporation (Japan)
- Volkswagen AG (Germany)
- WM Motor (China)
- Xiaopeng Motors (China)
Our Clients


View Our Licence Options
