
Eco-Friendly Furniture Market By Application(Residential, Commercial), By Distribution Channel(Offline, Online), By Region And Companies - Industry Segment Outlook, Market Assessment, Competition Scenario, Trends, And Forecast 2024-2033
-
16479
-
March 2024
-
188
-


-
This report was compiled by Research Team Research team of over 50 passionate professionals leverages advanced research methodologies and analytical expertise to deliver insightful, data-driven market intelligence that empowers businesses across diverse industries to make strategic, well-informed Correspondence Research Team Linkedin | Detailed Market research Methodology Our methodology involves a mix of primary research, including interviews with leading mental health experts, and secondary research from reputable medical journals and databases. View Detailed Methodology Page
-
Quick Navigation
Report Overview
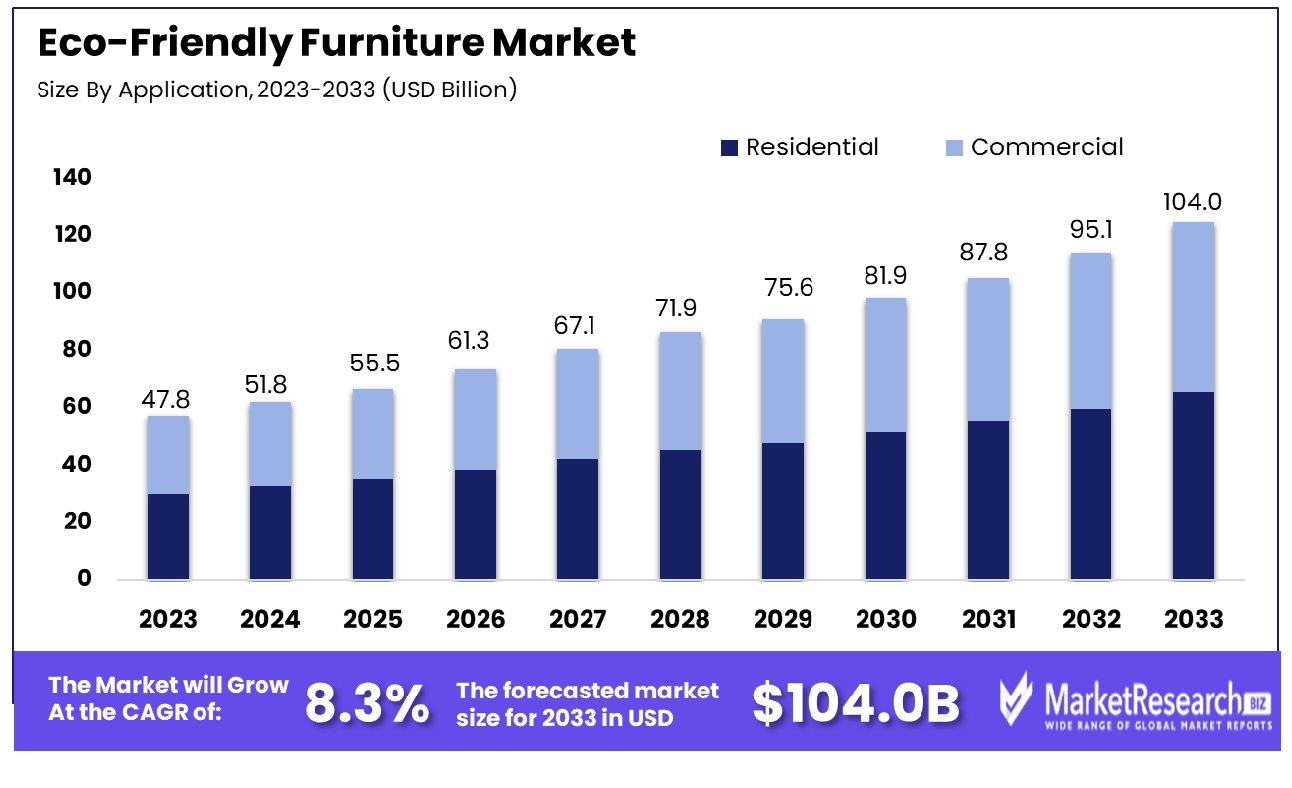
The eco-friendly furniture market was valued at USD 47.8 billion in 2023. It is expected to reach USD 104.0 billion by 2033, with a CAGR of 8.3% during the forecast period from 2024 to 2033. The surge in demand for eco-friendly products, rise in customer awareness regarding environmental awareness, and change in customer preferences are some of the main key driving factors for the eco-friendly furniture market.
Eco-friendly furniture is also known as sustainable or green furniture that is designed with a main focus on decreasing the environmental effect throughout its lifestyle. Such furnishing is designed by using sustainably responsible materials like domestic wood, biodegradable metal and plastics, and bamboo. The manufacturing technique aims to decrease water, energy consumption, and harmful emissions. The sustainable or eco-friendly furniture industry often provides features that are non-toxic finishes and adhesives that contribute to indoor air quality.
Moreover, it may be built for durability and convenience to disassembly, by promoting biodegradable and decreased landfill waste. The usage of certified eco-friendly wood sources, sustainable conscious material, and water-based stains are some of the general practices. By opting for eco-friendly, customers support eco-friendly tactics by conserving natural resources and contributing to a more sustainable conscious, and responsible product approach to the furniture industry.
Furniture news in April 2022, highlights that furniture production causes huge global carbon footprints. Every piece of furniture produces an average of 47kg of CO2 equivalents. It is the exact amount of greenhouse gases that is caused by burning 2ol of petrol. Every year, 10 million tonnes of furniture are either destroyed in landfills in the EU regions alone. Moreover, currently, every industrial leader must be environmentally aware. Customers are becoming subtler to the concerns associated with ecology. There are 98% of the furnishing where customers use environmentally friendly practices and 60% of the consumers are prepared to pay more for furnishing that protects or harms less to the environment.
Adopting eco-friendly furniture brings several advantages along with it that comprises of decrease in carbon footprints, as such furnishings are designed with eco-friendly option materials and energy-efficient manufacturing methods. They often contribute to good quality of air by using non-toxic finishes. Additionally, eco-friendly furniture promotes responsible environmental methods by helping to conserve natural habitats.
Customers are choosing such furniture to support ethical and sustainable conscious businesses by supporting a change towards more sustainable tactics in the furniture industry, ultimately contributing to a healthier and greener planet. The demand for eco-friendly furniture will increase due to its sustainable practices that cause less harm to the environment and the customer's urge to have eco-friendly materials that will help in market expansion in the coming years.
Key Takeaways
- Market Growth: Eco-Friendly Furniture Market was valued at USD 47.8 billion in 2023. It is expected to reach USD 104.0 billion by 2033, with a CAGR of 8.3% during the forecast period from 2024 to 2033.
- By Application: In the eco-friendly furniture market, the residential sector commands a 55.2% share, reflecting predominant consumer demand.
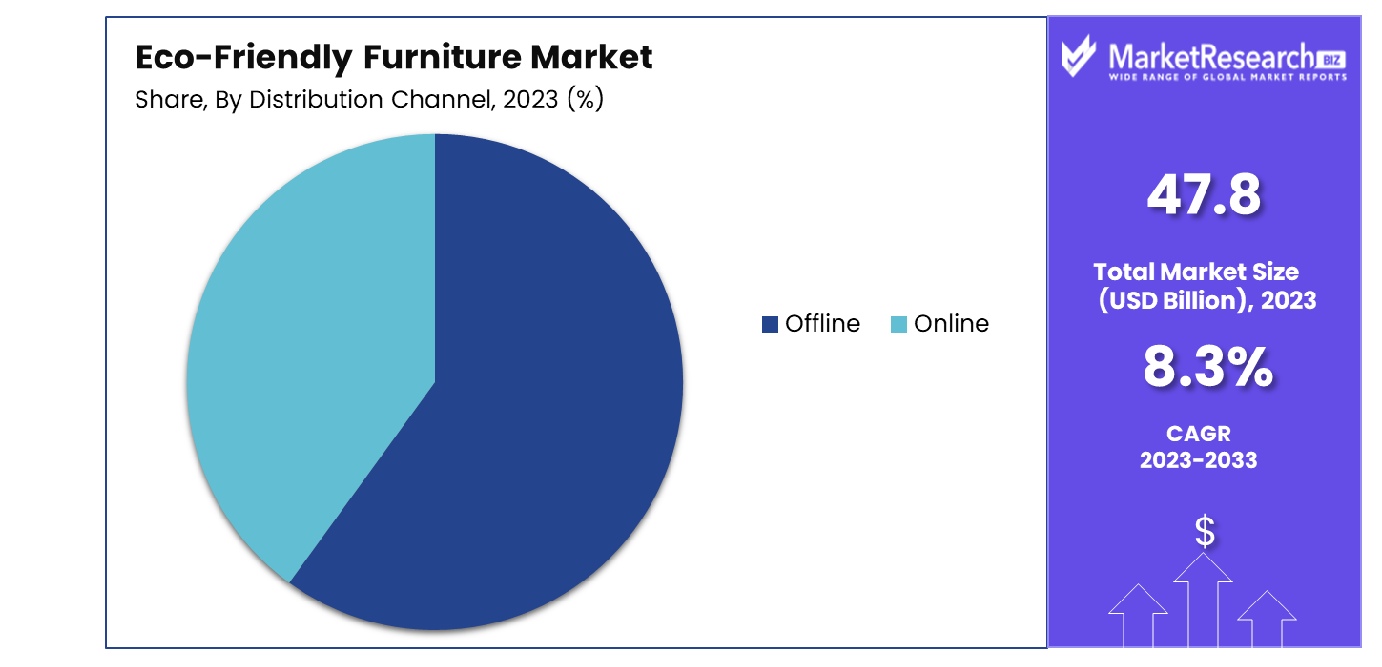
- By Distribution Channel: Offline distribution channels hold a 65.7% market share, underscoring traditional retail's continued dominance in sales.
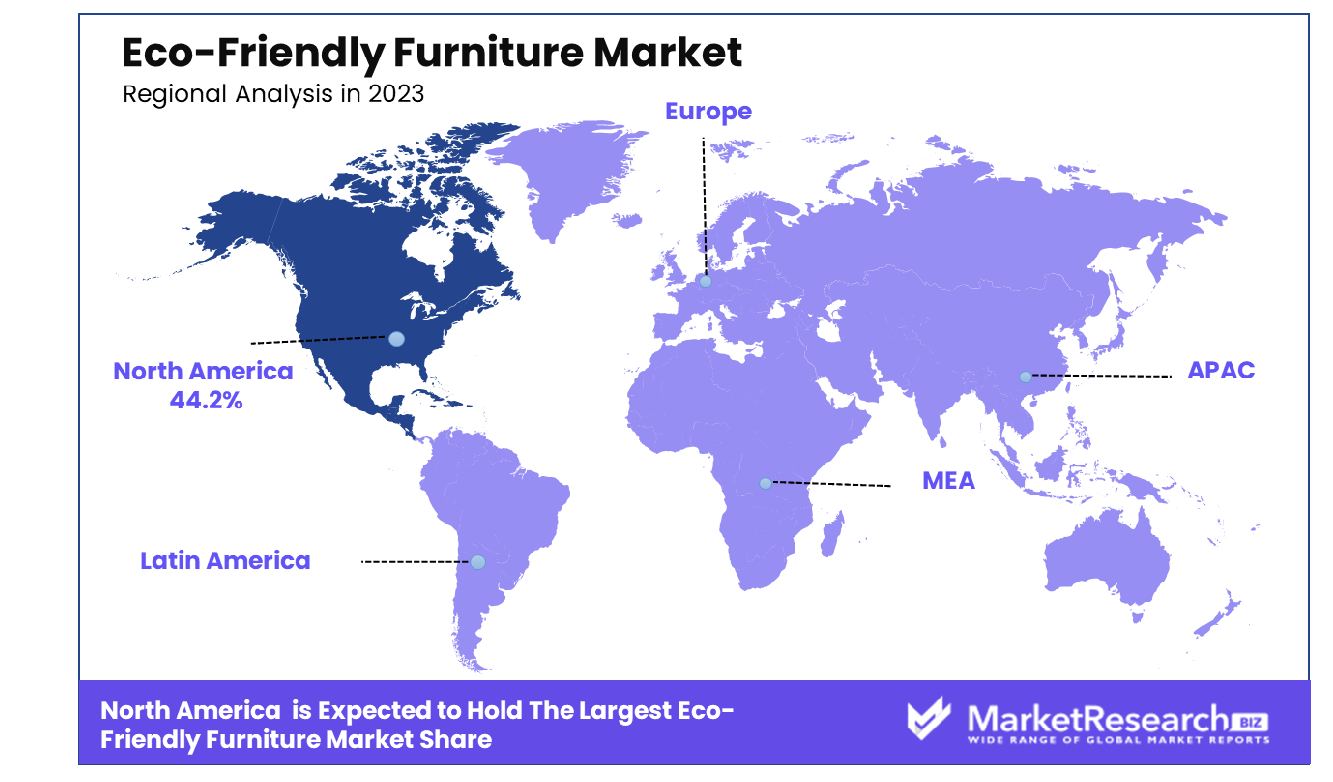
- Regional Dominance: North America leads with a 44.2% share in the eco-friendly furniture market.
- Growth Opportunity: The eco-friendly furniture market is set for growth in 2023, driven by rising consumer environmental consciousness and a shift towards sustainable production and recyclable materials, offering significant opportunities for manufacturers and retailers.
Driving factors
Enhanced Consumer Demand for Sustainable Materials
The eco-friendly furniture market is experiencing significant growth, largely propelled by increasing consumer demand for sustainable materials such as reclaimed wood, bamboo furniture products, and rattan. These materials are sought after for their minimal environmental impact, as they often involve recycling or sustainable harvesting practices that reduce deforestation and carbon emissions. The preference for these materials reflects a broader consumer shift towards sustainability, influenced by an understanding of the environmental costs associated with conventional furniture materials.
Awareness and Health Concerns Driving Market Shifts
Growing awareness of health issues associated with traditional furniture materials, such as VOC emissions from synthetic finishes, has further catalyzed the market's expansion. Consumers are increasingly prioritizing health and environmental wellness within their living spaces, leading to a heightened demand for furniture made from natural, non-toxic materials. This trend is not only driven by personal health considerations but also by a collective consciousness towards reducing harmful environmental impacts.
Governmental Support Bolstering Sustainable Practices
Government initiatives and regulations aimed at promoting sustainability have significantly contributed to the growth of the eco-friendly packaging market. By enforcing standards and providing incentives for the use of sustainable materials and production processes, governments worldwide are facilitating a shift towards greener alternatives. These policies are instrumental in fostering an environment where eco-friendly practices become the norm, rather than the exception, encouraging both manufacturers and consumers to make more environmentally responsible product choices.
Restraining Factors
The Price Barrier: Impact of Higher Costs on Market Expansion
The growth of the eco-friendly packaging market is significantly challenged by the higher costs associated with sustainable materials, ethical manufacturing practices, and obtaining necessary certifications. These elevated expenses are often passed on to the consumer, making eco-friendly furniture options more expensive than their conventional counterparts. This price disparity can act as a substantial barrier to entry for a large segment of the market, particularly price-sensitive consumers who might otherwise be inclined toward sustainable choices. The cost factor thus restricts the market's potential to scale, as the higher price points limit accessibility and reduce the overall consumer base willing or able to invest in eco-friendly furniture.
Availability Constraints Diminishing Market Reach
The limited availability of sustainable materials further restrains the growth of the eco-friendly furniture market. The scarcity of resources like reclaimed wood, bamboo products, and rattan not only restricts the diversity and range of eco-friendly furniture products available but also leads to extended production and delivery times. This limitation impacts consumer satisfaction and can deter potential buyers, who may turn to more readily available conventional options instead. Moreover, the niche nature of the market exacerbates these challenges, as limited consumer access to a broad range of products can hinder the market's growth and its appeal to a wider audience.
By Application Analysis
Residential applications dominate with a 55.2% market share in the eco-friendly furniture market.
In 2023, the Eco-Friendly Furniture Market was segmented into two primary application categories: Residential and Commercial sectors. The Residential segment held a dominant market position, capturing more than a 55.2% share. This predominance can be attributed to the increasing consumer awareness regarding environmental sustainability and the growing demand for eco-friendly living spaces. The shift towards green living practices has significantly influenced purchasing decisions, with a notable preference for furniture that minimizes environmental impact.
Moreover, the trend towards eco-consciousness among homeowners, coupled with the rise in residential construction activities globally, has further propelled the growth of the Residential segment within the Eco-Friendly Furniture Market. The demand for sustainable product furniture materials, such as bamboo products, reclaimed wood, and recycled plastics, has surged, underlining the sector's commitment to reducing carbon footprints and promoting circular economy principles.
On the other hand, the Commercial segment also witnessed substantial growth, driven by corporate social responsibility initiatives and the increasing adoption of green practices in office spaces, hospitality industries, and educational institutions. However, the market share of this segment remained below that of the Residential segment, reflecting a more pronounced consumer demand in the latter for eco-friendly furniture options.
The growth of the Eco-Friendly Furniture Market in the Residential segment underscores a broader societal shift towards sustainability and environmental stewardship, highlighting the potential for continued expansion in this sector. As consumers increasingly prioritize green products, the market is expected to witness further segmentation, innovation, and diversification, catering to the evolving needs of environmentally conscious consumers.
By Distribution Channel Analysis
Offline distribution channels hold a 65.7% market share in eco-friendly furniture sales.
In 2023, the Eco-Friendly Furniture Market was analyzed through two primary distribution channels: Offline and Online. The Offline channel held a dominant market position, capturing more than a 65.7% share. This significant market share is attributed to the strong consumer preference for experiencing the physical quality and aesthetic appeal of eco-friendly furniture before purchase. Brick-and-mortar stores, including specialty eco-friendly furniture outlets, department stores, and direct-to-consumer showrooms, played a pivotal role in facilitating this consumer behavior.
The tactile nature of furniture shopping, combined with the ability to offer personalized services and immediate takeaway options, reinforced the Offline channel's appeal. Furthermore, the trust associated with established retail brands and the opportunity for consumers to receive expert advice on sustainable living practices contributed to the Offline channel's dominance.
Conversely, the Online distribution channel also experienced growth, driven by the convenience of e-commerce, the expansion of digital marketing strategies by eco-friendly furniture brands, and the increasing consumer reliance on online shopping. The online channel's growth was facilitated by improvements in logistics, the availability of detailed product information, and the provision of virtual reality (VR) and augmented reality (AR) tools to simulate the in-store experience. However, despite these advancements, the Online channel's market share remained below that of the Offline channel.
The dominance of the Offline distribution channel within the Eco-Friendly Furniture Market in 2023 highlights the continued importance of physical retail experiences in consumer purchasing decisions. However, the growing significance of the Online channel indicates a shift towards digitalization, suggesting a balanced growth trajectory for both channels as market dynamics evolve.
Key Market Segments
By Application
- Residential
- Commercial
By Distribution Channel
- Offline
- Online
Growth Opportunity
Leveraging Consumer Consciousness for Market Expansion
The global eco-friendly furniture market is poised for significant growth in 2023, primarily fueled by a notable increase in consumer consciousness regarding the environmental impact of their purchasing decisions. This heightened awareness is driving demand for furniture that not only aligns with sustainable living principles but also contributes positively to environmental conservation efforts.
Consumers are increasingly seeking out products that reflect their values, including sustainability and responsibility towards the planet, which in turn propels the eco-friendly furniture market forward. This trend offers a substantial opportunity for manufacturers and retailers to cater to a growing segment of environmentally conscious consumers, expanding their market presence and fostering customer loyalty through shared values.
Sustainable Production and Materials as a Market Catalyst
Parallel to the rise in consumer consciousness is the growing awareness of the importance of sustainable furniture production and the preference for recyclable, environmentally friendly materials. This awareness influences consumer behavior, with more people prioritizing products made from materials that have a lower environmental footprint.
The demand for furniture crafted from recyclable and sustainably sourced materials is not just a trend but a shift in consumer preferences that represents a long-term growth opportunity for the eco-friendly furniture sector market. Manufacturers who invest in sustainable production practices and innovative use of recyclable materials are well-positioned to capitalize on this shift, distinguishing themselves in a competitive market and attracting a broader base of eco-conscious customers.
Latest Trends
Multifunctional Furniture: Meeting Modern Needs
In 2023, the global eco-friendly furniture market is witnessing a surge in demand for multifunctional furniture. This trend is largely driven by the evolving consumer lifestyle and housing trends, particularly in urban areas where living spaces are becoming more compact. Multifunctional furniture, which can serve multiple purposes and adapt to different spaces and needs, aligns perfectly with the minimalist and sustainable living ethos.
Consumers are increasingly looking for products that not only minimize environmental impact through materials and production methods but also offer versatile functionality to enhance their living spaces efficiently. This trend presents a significant growth opportunity for eco-friendly furniture manufacturers to innovate and expand their product lines with designs that are both sustainable and multifunctionally appealing.
Circular Economy Principles: Shaping Future Markets
The emphasis on circular economy principles is another prominent trend shaping the eco-friendly furniture market's major players in 2023. This approach focuses on reducing waste, extending the lifecycle of products, and recycling materials at the end of their life. Furniture companies adopting these principles are not only contributing to a more sustainable environment but are also resonating with the growing consumer demand for brands that prioritize ecological responsibility.
The circular economy model in the furniture industry encourages the use of renewable materials, promotes recycling and upcycling, and advocates for manufacturing processes that are designed for disassembly and reuse. This trend is gaining momentum, with consumers increasingly favoring products and brands that commit to circular economy practices, thereby driving the eco-friendly furniture market towards more sustainable growth paths.
Regional Analysis
North America dominates the eco-friendly furniture market, holding a significant 44.2% share of the global industry.
The global eco-friendly furniture market is segmented into key regions: North America, Europe, Asia Pacific, Middle East & Africa, and Latin America, each displaying unique growth dynamics and opportunities based on consumer awareness, regulatory frameworks, and local market conditions.
North America dominates the eco-friendly furniture major players, accounting for 44.2% of the global share, driven by heightened environmental awareness, advanced sustainability practices, and robust regulatory support. The U.S. and Canada are at the forefront, with consumers increasingly preferring sustainable and responsibly sourced furniture options, thus spurring innovation and expansion among manufacturers.
Europe follows closely, with a significant emphasis on circular economy principles and stringent EU regulations promoting the use of sustainable materials and recycling. Countries such as Germany, the UK, and Scandinavia lead the market players, with high consumer demand for eco-friendly furniture reflecting the region's strong commitment to environmental sustainability and ethical manufacturing practices.
The Asia Pacific region presents a rapidly growing segment, fueled by expanding economic growth, urbanization, and a burgeoning middle class. Increasing environmental consciousness among consumers in countries like China, Japan, and India is driving demand for sustainable furniture options, although the market players are still in their developmental phase compared to their Western counterparts.
Middle East & Africa and Latin America are emerging markets for eco-friendly furniture, characterized by growing awareness and gradually increasing demand. These regions represent untapped potential, with efforts to promote sustainability and eco-friendly products gaining momentum among a niche but growing consumer base.
Key Regions and Countries
North America
- The US
- Canada
- Rest of North America
Europe
- Germany
- France
- The UK
- Spain
- Netherlands
- Russia
- Italy
- Rest of Europe
Asia-Pacific
- China
- Japan
- Singapore
- Thailand
- South Korea
- Vietnam
- India
- New Zealand
- Rest of Asia Pacific
Latin America
- Mexico
- Brazil
- Rest of Latin America
Middle East & Africa
- Saudi Arabia
- South Africa
- UAE
- Rest of Middle East & Africa
Key Players Analysis
The global eco-friendly furniture market in 2023 is characterized by the dynamic contributions of key players, each bringing unique strengths and innovations to the forefront. Vermont Woods Studios stands out for its commitment to handcrafted furniture using sustainable practices, emphasizing the use of local hardwoods. Cisco Brothers Corporation is renowned for its use of organic compounds and sustainable raw materials, offering stylish, eco-conscious designs that appeal to a broad demographic.
Sabai and Greenington have carved niches by focusing on sustainability and innovation, with Sabai offering easily recyclable designs and Greenington utilizing rapidly renewable bamboo. Lee Industries, Inc., with its focus on eco-friendly manufacturing processes, and Williams-Sonoma, Inc., through its commitment to responsible product sourcing and sustainability initiatives, both contribute significantly to the market's growth.
La-Z-Boy Inc. and Vestre highlight the integration of sustainability into mainstream furniture, showcasing how traditional companies can innovate toward eco-friendliness. KING Furniture Pty Ltd and Maiden Home are recognized for their sustainable manufacturing practices and use of non-toxic recycled materials, appealing to health-conscious consumers.
Ashley Furniture Industries, Inc., and Ethan Allen Global, Inc., two of the industry's giants, have begun incorporating more sustainable practices and biodegradable materials, indicating a significant shift in the industry's approach. Roche Bobois and Inter IKEA Systems B.V. exemplify global reach with a focus on sustainable innovation, offering recycled materials and modular designs that cater to a global audience seeking sustainability without compromising style.
Market Key Players
- Vermont Woods Studios
- Cisco Brothers Corporation
- Sabai
- Greenington
- Lee Industries, Inc.
- Williams-Sonoma, Inc.
- La-Z-Boy Inc.
- Vestre
- KING Furniture Pty Ltd
- Maiden Home
- Ashley Furniture Industries, Inc.
- Ethan Allen Global, Inc.
- Roche Bobois
- Inter IKEA Systems B.V.
Recent Development
- In March 2024, TrueHomeStyles.com unveils innovative home decor solutions: multifunctional furniture, sustainable decor, and smart home integration. Committed to customer satisfaction, they offer personalized assistance and expert guidance for creating inspiring living spaces.
- In March 2024, Relso, India's leading furniture cloud factory, secures $840K funding co-led by Ventures Catalysts and Inflection Point Ventures. Founded in 2023, Relso focuses on the 'Make in India and Sell Globally' strategy, aiming for global furniture market leadership.
- In March 2024, Kronospan, a UK-based wood panel manufacturer, emphasizes sustainability, offering a wide range of eco-friendly products with a negative carbon footprint. It pioneers recycled timber use, ensuring minimal environmental impact.
Report Scope
Report Features Description Market Value (2023) USD 47.8 Billion Forecast Revenue (2033) USD 104.0 Billion CAGR (2024-2032) 8.3% Base Year for Estimation 2023 Historic Period 2016-2023 Forecast Period 2024-2033 Report Coverage Revenue Forecast, Market Dynamics, COVID-19 Impact, Competitive Landscape, Recent Developments Segments Covered By Application(Residential, Commercial), By Distribution Channel(Offline, Online) Regional Analysis North America - The US, Canada, Rest of North America, Europe - Germany, France, The UK, Spain, Italy, Russia, Netherlands, Rest of Europe, Asia-Pacific - China, Japan, South Korea, India, New Zealand, Singapore, Thailand, Vietnam, Rest of Asia Pacific, Latin America - Brazil, Mexico, Rest of Latin America, Middle East & Africa - South Africa, Saudi Arabia, UAE, Rest of Middle East & Africa Competitive Landscape Vermont Woods Studios, Cisco Brothers Corporation, Sabai, Greenington, Lee Industries, Inc., Williams-Sonoma, Inc., La-Z-Boy Inc., Vestre, KING Furniture Pty Ltd, Maiden Home, Ashley Furniture Industries, Inc., Ethan Allen Global, Inc., Roche Bobois, Inter IKEA Systems B.V. Customization Scope Customization for segments, region/country-level will be provided. Moreover, additional customization can be done based on the requirements. Purchase Options We have three licenses to opt for Single User License, Multi-User License (Up to 5 Users), Corporate Use License (Unlimited User and Printable PDF) -
-
- Vermont Woods Studios
- Cisco Brothers Corporation
- Sabai
- Greenington
- Lee Industries, Inc.
- Williams-Sonoma, Inc.
- La-Z-Boy Inc.
- Vestre
- KING Furniture Pty Ltd
- Maiden Home
- Ashley Furniture Industries, Inc.
- Ethan Allen Global, Inc.
- Roche Bobois
- Inter IKEA Systems B.V.
Our Clients


View Our Licence Options
