Drug Discovery Services Market By Process (Target Selection, Target Validation, Hit-To-Lead-Identification, Lead Optimization), By Drug Type (Small Molecules Drug and Biologics Drug), By Type, By Therapeutics Area, By End User, By Distribution Channel, By Region and Companies - Industry Segment Outlook, Market Assessment, Competition Scenario, Trends, and Forecast 2023-2032
-
25056
-
March 2023
-
190
-


-
This report was compiled by Trishita Deb Trishita Deb is an experienced market research and consulting professional with over 7 years of expertise across healthcare, consumer goods, and materials, contributing to over 400 healthcare-related reports. Correspondence Team Lead- Healthcare Linkedin | Detailed Market research Methodology Our methodology involves a mix of primary research, including interviews with leading mental health experts, and secondary research from reputable medical journals and databases. View Detailed Methodology Page
-
Quick Navigation
Report Overview
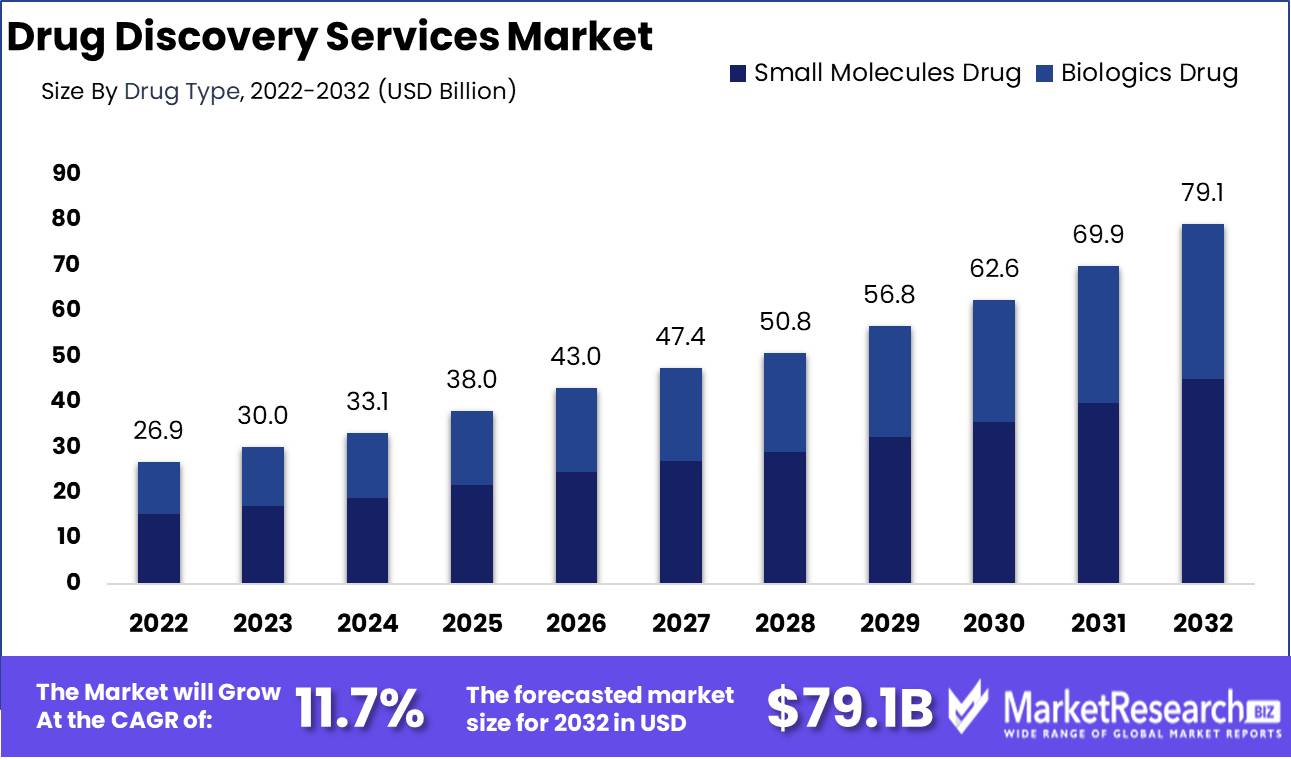
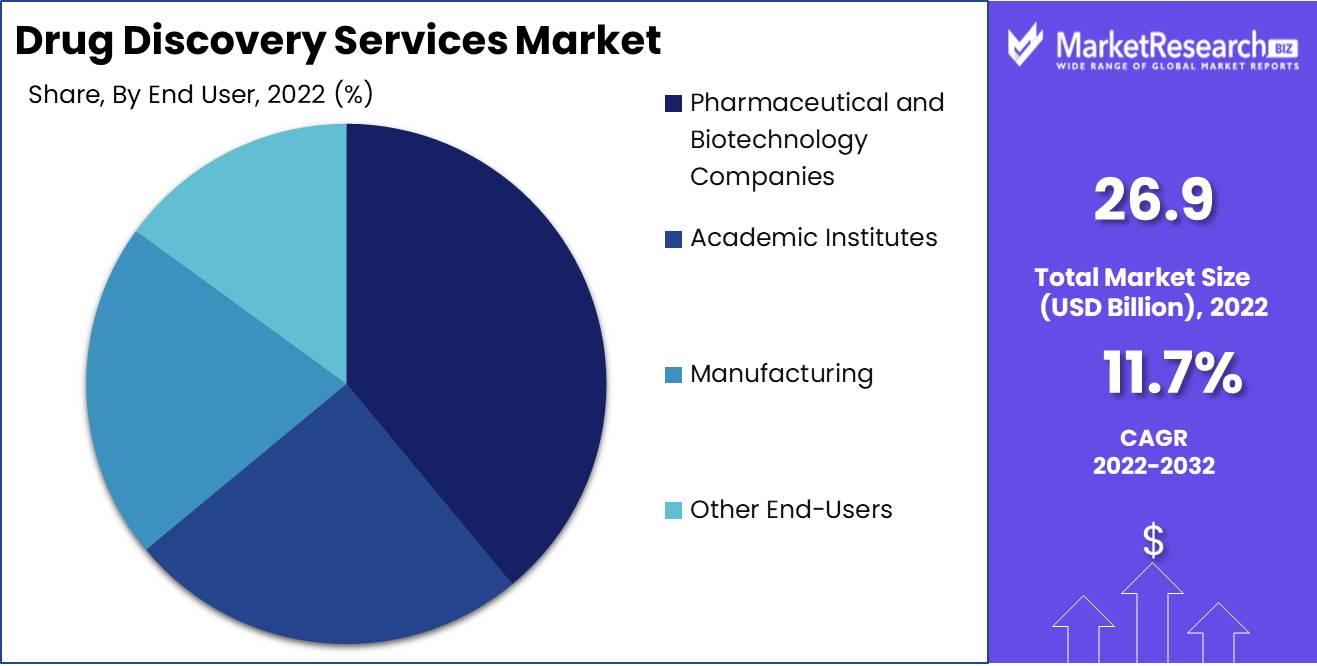
Drug Discovery Services Market size is expected to be worth around USD 79.1 Bn by 2032 from USD 26.9 Bn in 2022, growing at a CAGR of 11.7% during the forecast period from 2023 to 2032.
The global drug discovery services market is experiencing increased R&D spending in the pharmaceutical and biopharmaceutical industries. Moreover, factors include increased demand for analytical testing services and initiatives to research rare diseases. However, strict animal use and drug discovery regulations are expected to limit drug discovery services market growth. Providers of drug discovery services face a problem with a shortage of skilled professionals.
Driving factors
Growing R &D Expenditure In The Pharma And Biopharma Companies
Pharmaceutical companies are investing heavily in research and development activities. This is primarily to develop new drugs and therapies for various diseases, which is driving the demand for drug discovery services. The number of procedures in North America has increased significantly over the past few years. These procedures are in high demand in developing countries due to the increased purchasing power and dual-income households.
Moreover, the advent of advanced technologies like artificial intelligence (AI), machine learning (ML), and big data analytics in the field of drug discovery has significantly improved the efficiency and speed of drug discovery processes. Several pharmaceutical and biotechnology companies are outsourcing their drug discovery processes to specialized service providers. This is due to the high cost associated with in-house drug discovery processes and the need to reduce the time to drug discovery services market.
Restraining Factors
Stringent Regulations Governing Drug Discovery and Animal Usage
Regulatory authorities are focused on drug approval. These approaches are important for ensuring the quality of products before launching in the market. However, they can significantly increase the cost of drug research and the final product. This factor can significantly impact the acceptance of certain drugs in price-sensitive emerging drug discovery services market. Other than this, manufacturing costs can be increased by various laws that guarantee the quality of the product (such as GMP).
There are strict guidelines regarding the use of animals for drug discovery. The most commonly used animals in drug discovery research are mice, rats, fish, and amphibians. Governments have introduced legislation to ensure animal safety and use. This poses several problems for drug discovery research. Companies have had to find other ways to reduce animal use. Novo Nordisk, for example, uses biosimulation, a method that simulates human biology using computer models. All the companies in the industry still need to adopt this.
Type Analysis
Chemistry Services Segment Dominate The Market
The largest drug discovery services market share for drug discovery services is expected to be held by the medicinal chemistry services segment. This segment has a significant market share due to many factors, including the widespread use of medicinal chemistry. Preclinical and clinical laboratory tests are essential phases in the development of new drugs. Segmental services are crucial in the development of drug candidates.
They help to understand properties like target selectivity, compound stability, solubility, and in-vivo studies. These factors all contribute to the market's growth. The increased use of medicinal chemistry in academia, biotechnology companies, and pharmaceutical companies has also positively affected the drug discovery services market.
Process Analysis
Due to Time and Cost Efficiency, Lead Identification and Candidate Optimization Dominate The Market
Based on the process, the global drug discovery services market is segmented into target selection, target validation, hit-to-lead identification, lead optimization, and candidate validation. With a revenue share of 33.0%, lead identification and candidate optimization dominated the process segment. It is an essential stage in early drug discovery. This has been proven to improve efficiency and scale for drug developers.
The segment growth is supported by the introduction of in-silico technologies to improve lead identification processes, such as Computer-Aided Drug Discovery (CADD) and structure-based drug designs. Lead identification services are increasingly being outsourced as a result of the high cost of integrating the most recent computation technology and the rising demand for skilled individuals with expertise in both metabolic and analytical chemistry.
It is anticipated that the other associated services sector, which includes regulatory assistance, cell line development, upstream and downstream processes, analytical/bioanalytical methods, formulations and quality assessment, and other related services, will experience rapid expansion in the upcoming years. This is because of the high investment in drug discovery, research, and development and the rising use of outsourcing services.
Drug Type Analysis
Due To Small Molecules, The Development Of Advanced Treatments Is Possible, as Such Small Molecule Applications Account For Half Of All Specialty Medicine Sales.
Based on drug types, the global drug discovery services market is segmented into small molecule and biologics drugs. With a share of over 77.3%, the small molecules and pharmaceuticals segment is expected to grow at the fastest CAGR over the forecast period. Depending on the drug, there are two types of markets. Small molecules play a significant role in developing new and advanced treatments for patients across the globe. Recent approval trends also show their significance. In 2019, the FDA approved 48 brand-new medications, 79% of which were small molecules. Small molecules are crucial in creating treatments for the following four primary therapeutic areas: cardiology and oncology.
Small molecules can potentially be a significant part of the pharmaceutical portfolio due to their high-quality components and increased importance. This is why the small molecules market accounted for the most significant percentage of the overall drug discovery services market. The advantages of smaller molecules over larger molecules have led to increased investment in this field, particularly in cancer research. Because small molecules can be administered orally, particularly for chronic diseases, so that they can be easily manufactured and less expensive than larger molecules, they can also be used in combination with intracellular targets. Ongoing research will influence segment growth to develop and test novel therapeutics for different indications.
Therapeutic Area Analysis
The Increased Prevalence of Different Types of Cancer Among the Population Has Fostered the Growth of the Oncology Segment
Based on therapeutic areas, the global drug discovery services market is segmented into respiratory systems, neurology, oncology, cardiology, infectious and immune system diseases, digestive system diseases, and other therapeutic areas. The respiratory systems emerged as the dominant segment in the global drug discovery services market in 2022, commanding a significant share of 15.0% of the total revenue. This substantial growth is attributed to the escalating prevalence of respiratory disorders, including bronchitis, tuberculosis, Chronic Obstructive Pulmonary Diseases (COPD), and asthma. Additionally, the surge in drug resistance cases has further fueled the expansion of this segment.
The oncology segment emerged as the dominant force in the drug discovery services market, and it is anticipated to maintain its momentum as the fastest-growing segment throughout the forecast period, spanning from 2023 to 2032. The escalating incidence of cancer cases has prompted pharmaceutical companies to intensify their efforts in developing treatments for malignancies. Notably, lung and breast cancer is the most prevalent types of cancer, with the World Health Organization (WHO) reporting over 2.21 million and 2.26 million cases, respectively.
End-User Analysis
Based on End-Users, the global drug discovery services market is segmented into Pharmaceutical and Biotechnology Companies, Academic Institutes, Manufacturing, and Other End-Users. One of the most common strategies observed among players is international collaboration. In addition, in the fast-moving drug development industry, agility is essential in a fragmented business like pharmaceuticals, which can provide high-quality service offerings and a wide range of capabilities. Collaborations with Contract Development and Manufacturing Organizations (CDMOs) are preferred over CMO collaborations.
Key Market Segments
Based on Process
- Target Selection
- Target Validation
- Hit-To-Lead-Identification
- Lead Optimization
- Candidate Validation
Based On Drug Type
- Small Molecules Drug
- Biologics Drug
Based On Type
- Chemistry Services
- Biology Services
Based on Therapeutics Area
- Respiratory System
- Neurology
- Oncology
- Cardiology
- Infectious and Immune System Diseases
- Digestive System Diseases
- Other Therapeutic Area
Based On End User
- Pharmaceutical and Biotechnology Companies
- Academic Institutes
- Manufacturing
- Other End-Users
Growth Opportunity
Growth In Drugs and Biologics Market Despite Of Covid-19 Pandemic
The field of personalized medicine is proliferating. It involves developing therapies tailored to individual patients' genetic and health profiles. This presents a significant opportunity for drug discovery services to develop more targeted and effective treatments. Integrating advanced technologies like AI, ML, and big data in drug discovery can lead to more effective and efficient drug discovery processes. This presents a significant opportunity for service providers in drug discovery services market.
There is a growing demand for biologics and biosimilars due to their effectiveness in treating various chronic and autoimmune diseases. This presents an opportunity for drug discovery services focused on biologics. Moreover, small-molecule drugs dominate the global pharmaceutical market, and hence, shares of biologics, biosimilars, and large-molecule drugs are increasing. This is due to the launch of new biologic-based medicines and the increased revenue from existing biologics. Specialty testing is required at every stage of biosimilars and biologics, which require more services than for small molecules. In the next few years, drug discovery services market is expected to grow because of the increasing demand to outsource these services to CROs.
Latest Trends
Preclinical research's increasing demand for innovative formulation strategies has been predicted to catalyze innovation.
There has been an increase in contract research organizations in emerging countries in recent years. This is likely to be a cost-saving factor for researchers in pharmaceutical industries. The market's growing demand for innovative formulation strategies in preclinical research has also been predicted to catalyze innovation. These factors will also boost the sales opportunities for drug discovery services during the forecast period. The field of drug discovery informatics is experiencing significant changes. There is also an increase in the use of computational methods to assist candidates. These factors will likely increase the growth opportunities for drug discovery services.
Regional Analysis
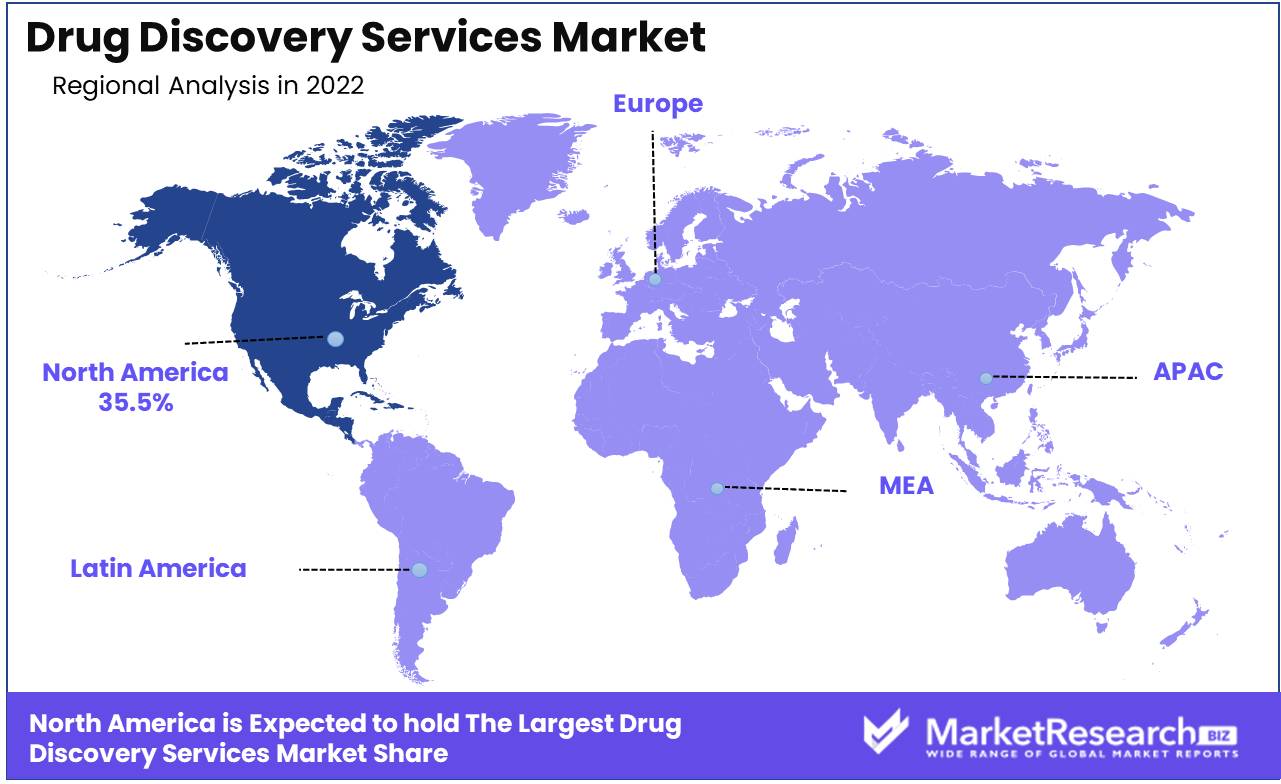
North America Region Dominates The Drug Discovery Services Market
North America was the dominant drug discovery services market, accounting for 35.5% of global revenue. The market's growth can be attributed primarily to technological advances, the presence of key players, well-established research infrastructure, and higher investments in drug discovery R&D. Asia is expected to experience the highest CAGR over the forecast period. Due to the availability of a skilled workforce, low costs, favorable regulatory environments, and high-quality data, the region is becoming a hub for drug discovery outsourcing activities.
Japan is the third largest pharmaceutical market globally and will provide strong opportunities for CROs to drive the market. Japan's revised Pharmaceutical Affairs Law will support tissue diagnosis and cancer research, which is expected to boost drug discovery services market growth. Japan Agency for Medical Research and Development was created to manage clinical trial and investigation data, improve R&D infrastructure, and promote international strategies. This agency exemplifies the various initiatives taken to increase Japan's market growth.
Key Regions and Countries
North America
- US
- Canada
- Mexico
Western Europe
- Germany
- France
- The UK
- Spain
- Italy
- Portugal
- Ireland
- Austria
- Switzerland
- Benelux
- Nordic
- Rest of Western Europe
Eastern Europe
- Russia
- Poland
- The Czech Republic
- Greece
- Rest of Eastern Europe
APAC
- China
- Japan
- South Korea
- India
- Australia & New Zealand
- Indonesia
- Malaysia
- Philippines
- Singapore
- Thailand
- Vietnam
- Rest of APAC
Latin America
- Brazil
- Colombia
- Chile
- Argentina
- Costa Rica
- Rest of Latin America
Middle East & Africa
- Algeria
- Egypt
- Israel
- Kuwait
- Nigeria
- Saudi Arabia
- South Africa
- Turkey
- United Arab Emirates
- Rest of MEA
Key Players Analysis
Emerging market players are focusing on various strategies to develop their respective businesses in domestic and international markets. Players increasingly embrace international partnerships as a strategic move to expand their product’s presence. CROs from the U.K., for instance, are more likely to collaborate with Swiss players in the pharmaceutical sector. A fragmented industry such as pharmaceutical requires agility. This can be achieved by offering quality services and a wide range of capabilities. Partnerships with contract development and manufacturing organizations are preferred to contract manufacturing organizations.
With the presence of many local and regional players, the market for companion diagnostics is fragmented. Market players are subject to intense competition from top market players, particularly those with strong brand recognition and high distribution networks. Companies have gained various expansion strategies, such as partnerships and product launches, to stay in the market.
Top Key Players in Drug Discovery Services Market
- Albany Molecular Research Inc.
- EVOTEC SE
- Laboratory Corporation of America Holdings
- GenScript ProBio
- Pharmaceutical Product Development, LLC
- Charles River Laboratories
- WuXi AppTec
- Merck & Co., Inc.
- Thermo Fisher Scientific Inc.
- Dalton Pharma Services
- Oncodesign Services
- Jubilant Biosys
- DiscoverX Corp.
- QIAGEN
- Eurofins SE
- Syngene International Limited
- Reddy Laboratories Ltd.
- Pharmaron Beijing Co., Ltd.
- TCG Lifesciences Pvt Ltd.
- Domainex Ltd.
- Other Key Players
Recent Development
- In January 2022: Boehringer Ingelheim and Evotec worked on a drug development collaboration which was focusing on iPSC-based disease modeling for ophthalmologic illnesses.
- In October 2022: Verge Genomics is a biotechnology company that has reached the clinical stage and uses technology to enable drug discovery. It announced the dosing of the first subject in the Phase 1 clinical trial for VRG50635.
- In October 2022: Topline results from the CATALINA Phase 2 Trial of NGM621 in patients with geographic atrophy (GA) caused by age-related macular degeneration were released by NGM Bio.
Report Scope:
Report Features Description Market Value (2022) USD 26.9 Bn Forecast Revenue (2032) USD 79.1 Bn CAGR (2023-2032) 11.7% Base Year for Estimation 2022 Historic Period 2016-2022 Forecast Period 2023-2032 Report Coverage Revenue Forecast, Market Dynamics, COVID-19 Impact, Competitive Landscape, Recent Developments Segments Covered By Process- Target Selection, Target Validation, Hit-To-Lead-Identification, Lead Optimization, Candidate Validation; By Drug Type- Small Molecules Drug, Biologics Drug; By Type- Chemistry Services, Biology Services; By Therapeutics Area- Respiratory System, Neurology, Oncology, Cardiology, Infectious and Immune System Diseases, Digestive System Diseases, and Other Therapeutic Area; By End User- Pharmaceutical and Biotechnology Companies, Academic Institutes, Manufacturing, and Other End-Users Regional Analysis North America – The US, Canada, & Mexico; Western Europe – Germany, France, The UK, Spain, Italy, Portugal, Ireland, Austria, Switzerland, Benelux, Nordic, & Rest of Western Europe; Eastern Europe – Russia, Poland, The Czech Republic, Greece, & Rest of Eastern Europe; APAC – China, Japan, South Korea, India, Australia & New Zealand, Indonesia, Malaysia, Philippines, Singapore, Thailand, Vietnam, & Rest of APAC; Latin America – Brazil, Colombia, Chile, Argentina, Costa Rica, & Rest of Latin America; Middle East & Africa – Algeria, Egypt, Israel, Kuwait, Nigeria, Saudi Arabia, South Africa, Turkey, United Arab Emirates, & Rest of MEA Competitive Landscape Albany Molecular Research Inc., EVOTEC A.G., Laboratory Corporation of America Holdings, GenScript ProBio, Pharmaceutical Product Development, LLC, Charles River Laboratories, WuXi AppTec, Merck & Co., Inc., Thermo Fisher Scientific Inc., Dalton Pharma Services, Oncodesign Services, Jubilant Biosys, DiscoverX Corp., QIAGEN, Eurofins SE, Syngene International Limited, Dr. Reddy Laboratories Ltd., Pharmaron Beijing Co., Ltd., TCG Lifesciences Pvt Ltd., Domainex Ltd., and Other Key Players Customization Scope Customization for segments, region/country-level will be provided. Moreover, additional customization can be done based on the requirements. Purchase Options We have three licenses to opt for: Single User License, Multi-User License (Up to 5 Users), Corporate Use License (Unlimited User and Printable PDF) -
- 1. Executive Summary
- 1.1. Definition
- 1.2. Taxonomy
- 1.3. Research Scope
- 1.4. Key Analysis
- 1.5. Key Findings by Major Segments
- 1.6. Top strategies by Major Players
- 2. Global Drug Discovery Services Market Overview
- 2.1. Drug Discovery Services Market Dynamics
- 2.1.1. Drivers
- 2.1.2. Opportunities
- 2.1.3. Restraints
- 2.1.4. Challenges
- 2.2. Macro-economic Factors
- 2.3. Regulatory Framework
- 2.4. Market Investment Feasibility Index
- 2.5. PEST Analysis
- 2.6. PORTER’S Five Force Analysis
- 2.7. Drivers & Restraints Impact Analysis
- 2.8. Industry Chain Analysis
- 2.9. Cost Structure Analysis
- 2.10. Marketing Strategy
- 2.11. Russia-Ukraine War Impact Analysis
- 2.12. Opportunity Map Analysis
- 2.13. Market Competition Scenario Analysis
- 2.14. Product Life Cycle Analysis
- 2.15. Opportunity Orbits
- 2.16. Manufacturer Intensity Map
- 2.17. Major Companies sales by Value & Volume
- 2.1. Drug Discovery Services Market Dynamics
- 3. Global Drug Discovery Services Market Analysis, Opportunity and Forecast, 2016-2032
- 3.1. Global Drug Discovery Services Market Analysis, 2016-2021
- 3.2. Global Drug Discovery Services Market Opportunity and Forecast, 2023-2032
- 3.3. Global Drug Discovery Services Market Analysis, Opportunity and Forecast, By By Process, 2016-2032
- 3.3.1. Global Drug Discovery Services Market Analysis by By Process: Introduction
- 3.3.2. Market Size Absolute $ Opportunity Analysis and Forecast, By By Process, 2016-2032
- 3.3.3. Target Selection
- 3.3.4. Target Validation
- 3.3.5. Hit-To-Lead-Identification
- 3.3.6. Lead Optimization
- 3.3.7. Candidate Validation
- 3.4. Global Drug Discovery Services Market Analysis, Opportunity and Forecast, By By Drug Type, 2016-2032
- 3.4.1. Global Drug Discovery Services Market Analysis by By Drug Type: Introduction
- 3.4.2. Market Size Absolute $ Opportunity Analysis and Forecast, By By Drug Type, 2016-2032
- 3.4.3. Small Molecules Drug
- 3.4.4. Biologics Drug
- 3.5. Global Drug Discovery Services Market Analysis, Opportunity and Forecast, By By Type, 2016-2032
- 3.5.1. Global Drug Discovery Services Market Analysis by By Type: Introduction
- 3.5.2. Market Size Absolute $ Opportunity Analysis and Forecast, By By Type, 2016-2032
- 3.5.3. Chemistry Services
- 3.5.4. Biology Services
- 3.6. Global Drug Discovery Services Market Analysis, Opportunity and Forecast, By By Therapeutics Area, 2016-2032
- 3.6.1. Global Drug Discovery Services Market Analysis by By Therapeutics Area: Introduction
- 3.6.2. Market Size Absolute $ Opportunity Analysis and Forecast, By By Therapeutics Area, 2016-2032
- 3.6.3. Neurology
- 3.6.4. Oncology
- 3.6.5. Cardiology
- 3.6.6. Infectious and Immune System Diseases
- 3.6.7. Digestive System Diseases
- 3.6.8. Other Therapeutic Area
- 3.7. Global Drug Discovery Services Market Analysis, Opportunity and Forecast, By By End-Users, 2016-2032
- 3.7.1. Global Drug Discovery Services Market Analysis by By End-Users: Introduction
- 3.7.2. Market Size Absolute $ Opportunity Analysis and Forecast, By By End-Users, 2016-2032
- 3.7.3. Pharmaceutical and Biotechnology Companies
- 3.7.4. Academic Institutes
- 3.7.5. Manufacturing
- 3.7.6. Other End-Users
- 4. North America Drug Discovery Services Market Analysis, Opportunity and Forecast, 2016-2032
- 4.1. North America Drug Discovery Services Market Analysis, 2016-2021
- 4.2. North America Drug Discovery Services Market Opportunity and Forecast, 2023-2032
- 4.3. North America Drug Discovery Services Market Analysis, Opportunity and Forecast, By By Process, 2016-2032
- 4.3.1. North America Drug Discovery Services Market Analysis by By Process: Introduction
- 4.3.2. Market Size Absolute $ Opportunity Analysis and Forecast, By By Process, 2016-2032
- 4.3.3. Target Selection
- 4.3.4. Target Validation
- 4.3.5. Hit-To-Lead-Identification
- 4.3.6. Lead Optimization
- 4.3.7. Candidate Validation
- 4.4. North America Drug Discovery Services Market Analysis, Opportunity and Forecast, By By Drug Type, 2016-2032
- 4.4.1. North America Drug Discovery Services Market Analysis by By Drug Type: Introduction
- 4.4.2. Market Size Absolute $ Opportunity Analysis and Forecast, By By Drug Type, 2016-2032
- 4.4.3. Small Molecules Drug
- 4.4.4. Biologics Drug
- 4.5. North America Drug Discovery Services Market Analysis, Opportunity and Forecast, By By Type, 2016-2032
- 4.5.1. North America Drug Discovery Services Market Analysis by By Type: Introduction
- 4.5.2. Market Size Absolute $ Opportunity Analysis and Forecast, By By Type, 2016-2032
- 4.5.3. Chemistry Services
- 4.5.4. Biology Services
- 4.6. North America Drug Discovery Services Market Analysis, Opportunity and Forecast, By By Therapeutics Area, 2016-2032
- 4.6.1. North America Drug Discovery Services Market Analysis by By Therapeutics Area: Introduction
- 4.6.2. Market Size Absolute $ Opportunity Analysis and Forecast, By By Therapeutics Area, 2016-2032
- 4.6.3. Neurology
- 4.6.4. Oncology
- 4.6.5. Cardiology
- 4.6.6. Infectious and Immune System Diseases
- 4.6.7. Digestive System Diseases
- 4.6.8. Other Therapeutic Area
- 4.7. North America Drug Discovery Services Market Analysis, Opportunity and Forecast, By By End-Users, 2016-2032
- 4.7.1. North America Drug Discovery Services Market Analysis by By End-Users: Introduction
- 4.7.2. Market Size Absolute $ Opportunity Analysis and Forecast, By By End-Users, 2016-2032
- 4.7.3. Pharmaceutical and Biotechnology Companies
- 4.7.4. Academic Institutes
- 4.7.5. Manufacturing
- 4.7.6. Other End-Users
- 4.8. North America Drug Discovery Services Market Analysis, Opportunity and Forecast, By Country , 2016-2032
- 4.8.1. North America Drug Discovery Services Market Analysis by Country : Introduction
- 4.8.2. Market Size Absolute $ Opportunity Analysis and Forecast, Country , 2016-2032
- 4.8.2.1. The US
- 4.8.2.2. Canada
- 4.8.2.3. Mexico
- 5. Western Europe Drug Discovery Services Market Analysis, Opportunity and Forecast, 2016-2032
- 5.1. Western Europe Drug Discovery Services Market Analysis, 2016-2021
- 5.2. Western Europe Drug Discovery Services Market Opportunity and Forecast, 2023-2032
- 5.3. Western Europe Drug Discovery Services Market Analysis, Opportunity and Forecast, By By Process, 2016-2032
- 5.3.1. Western Europe Drug Discovery Services Market Analysis by By Process: Introduction
- 5.3.2. Market Size Absolute $ Opportunity Analysis and Forecast, By By Process, 2016-2032
- 5.3.3. Target Selection
- 5.3.4. Target Validation
- 5.3.5. Hit-To-Lead-Identification
- 5.3.6. Lead Optimization
- 5.3.7. Candidate Validation
- 5.4. Western Europe Drug Discovery Services Market Analysis, Opportunity and Forecast, By By Drug Type, 2016-2032
- 5.4.1. Western Europe Drug Discovery Services Market Analysis by By Drug Type: Introduction
- 5.4.2. Market Size Absolute $ Opportunity Analysis and Forecast, By By Drug Type, 2016-2032
- 5.4.3. Small Molecules Drug
- 5.4.4. Biologics Drug
- 5.5. Western Europe Drug Discovery Services Market Analysis, Opportunity and Forecast, By By Type, 2016-2032
- 5.5.1. Western Europe Drug Discovery Services Market Analysis by By Type: Introduction
- 5.5.2. Market Size Absolute $ Opportunity Analysis and Forecast, By By Type, 2016-2032
- 5.5.3. Chemistry Services
- 5.5.4. Biology Services
- 5.6. Western Europe Drug Discovery Services Market Analysis, Opportunity and Forecast, By By Therapeutics Area, 2016-2032
- 5.6.1. Western Europe Drug Discovery Services Market Analysis by By Therapeutics Area: Introduction
- 5.6.2. Market Size Absolute $ Opportunity Analysis and Forecast, By By Therapeutics Area, 2016-2032
- 5.6.3. Neurology
- 5.6.4. Oncology
- 5.6.5. Cardiology
- 5.6.6. Infectious and Immune System Diseases
- 5.6.7. Digestive System Diseases
- 5.6.8. Other Therapeutic Area
- 5.7. Western Europe Drug Discovery Services Market Analysis, Opportunity and Forecast, By By End-Users, 2016-2032
- 5.7.1. Western Europe Drug Discovery Services Market Analysis by By End-Users: Introduction
- 5.7.2. Market Size Absolute $ Opportunity Analysis and Forecast, By By End-Users, 2016-2032
- 5.7.3. Pharmaceutical and Biotechnology Companies
- 5.7.4. Academic Institutes
- 5.7.5. Manufacturing
- 5.7.6. Other End-Users
- 5.8. Western Europe Drug Discovery Services Market Analysis, Opportunity and Forecast, By Country , 2016-2032
- 5.8.1. Western Europe Drug Discovery Services Market Analysis by Country : Introduction
- 5.8.2. Market Size Absolute $ Opportunity Analysis and Forecast, Country , 2016-2032
- 5.8.2.1. Germany
- 5.8.2.2. France
- 5.8.2.3. The UK
- 5.8.2.4. Spain
- 5.8.2.5. Italy
- 5.8.2.6. Portugal
- 5.8.2.7. Ireland
- 5.8.2.8. Austria
- 5.8.2.9. Switzerland
- 5.8.2.10. Benelux
- 5.8.2.11. Nordic
- 5.8.2.12. Rest of Western Europe
- 6. Eastern Europe Drug Discovery Services Market Analysis, Opportunity and Forecast, 2016-2032
- 6.1. Eastern Europe Drug Discovery Services Market Analysis, 2016-2021
- 6.2. Eastern Europe Drug Discovery Services Market Opportunity and Forecast, 2023-2032
- 6.3. Eastern Europe Drug Discovery Services Market Analysis, Opportunity and Forecast, By By Process, 2016-2032
- 6.3.1. Eastern Europe Drug Discovery Services Market Analysis by By Process: Introduction
- 6.3.2. Market Size Absolute $ Opportunity Analysis and Forecast, By By Process, 2016-2032
- 6.3.3. Target Selection
- 6.3.4. Target Validation
- 6.3.5. Hit-To-Lead-Identification
- 6.3.6. Lead Optimization
- 6.3.7. Candidate Validation
- 6.4. Eastern Europe Drug Discovery Services Market Analysis, Opportunity and Forecast, By By Drug Type, 2016-2032
- 6.4.1. Eastern Europe Drug Discovery Services Market Analysis by By Drug Type: Introduction
- 6.4.2. Market Size Absolute $ Opportunity Analysis and Forecast, By By Drug Type, 2016-2032
- 6.4.3. Small Molecules Drug
- 6.4.4. Biologics Drug
- 6.5. Eastern Europe Drug Discovery Services Market Analysis, Opportunity and Forecast, By By Type, 2016-2032
- 6.5.1. Eastern Europe Drug Discovery Services Market Analysis by By Type: Introduction
- 6.5.2. Market Size Absolute $ Opportunity Analysis and Forecast, By By Type, 2016-2032
- 6.5.3. Chemistry Services
- 6.5.4. Biology Services
- 6.6. Eastern Europe Drug Discovery Services Market Analysis, Opportunity and Forecast, By By Therapeutics Area, 2016-2032
- 6.6.1. Eastern Europe Drug Discovery Services Market Analysis by By Therapeutics Area: Introduction
- 6.6.2. Market Size Absolute $ Opportunity Analysis and Forecast, By By Therapeutics Area, 2016-2032
- 6.6.3. Neurology
- 6.6.4. Oncology
- 6.6.5. Cardiology
- 6.6.6. Infectious and Immune System Diseases
- 6.6.7. Digestive System Diseases
- 6.6.8. Other Therapeutic Area
- 6.7. Eastern Europe Drug Discovery Services Market Analysis, Opportunity and Forecast, By By End-Users, 2016-2032
- 6.7.1. Eastern Europe Drug Discovery Services Market Analysis by By End-Users: Introduction
- 6.7.2. Market Size Absolute $ Opportunity Analysis and Forecast, By By End-Users, 2016-2032
- 6.7.3. Pharmaceutical and Biotechnology Companies
- 6.7.4. Academic Institutes
- 6.7.5. Manufacturing
- 6.7.6. Other End-Users
- 6.8. Eastern Europe Drug Discovery Services Market Analysis, Opportunity and Forecast, By Country , 2016-2032
- 6.8.1. Eastern Europe Drug Discovery Services Market Analysis by Country : Introduction
- 6.8.2. Market Size Absolute $ Opportunity Analysis and Forecast, Country , 2016-2032
- 6.8.2.1. Russia
- 6.8.2.2. Poland
- 6.8.2.3. The Czech Republic
- 6.8.2.4. Greece
- 6.8.2.5. Rest of Eastern Europe
- 7. APAC Drug Discovery Services Market Analysis, Opportunity and Forecast, 2016-2032
- 7.1. APAC Drug Discovery Services Market Analysis, 2016-2021
- 7.2. APAC Drug Discovery Services Market Opportunity and Forecast, 2023-2032
- 7.3. APAC Drug Discovery Services Market Analysis, Opportunity and Forecast, By By Process, 2016-2032
- 7.3.1. APAC Drug Discovery Services Market Analysis by By Process: Introduction
- 7.3.2. Market Size Absolute $ Opportunity Analysis and Forecast, By By Process, 2016-2032
- 7.3.3. Target Selection
- 7.3.4. Target Validation
- 7.3.5. Hit-To-Lead-Identification
- 7.3.6. Lead Optimization
- 7.3.7. Candidate Validation
- 7.4. APAC Drug Discovery Services Market Analysis, Opportunity and Forecast, By By Drug Type, 2016-2032
- 7.4.1. APAC Drug Discovery Services Market Analysis by By Drug Type: Introduction
- 7.4.2. Market Size Absolute $ Opportunity Analysis and Forecast, By By Drug Type, 2016-2032
- 7.4.3. Small Molecules Drug
- 7.4.4. Biologics Drug
- 7.5. APAC Drug Discovery Services Market Analysis, Opportunity and Forecast, By By Type, 2016-2032
- 7.5.1. APAC Drug Discovery Services Market Analysis by By Type: Introduction
- 7.5.2. Market Size Absolute $ Opportunity Analysis and Forecast, By By Type, 2016-2032
- 7.5.3. Chemistry Services
- 7.5.4. Biology Services
- 7.6. APAC Drug Discovery Services Market Analysis, Opportunity and Forecast, By By Therapeutics Area, 2016-2032
- 7.6.1. APAC Drug Discovery Services Market Analysis by By Therapeutics Area: Introduction
- 7.6.2. Market Size Absolute $ Opportunity Analysis and Forecast, By By Therapeutics Area, 2016-2032
- 7.6.3. Neurology
- 7.6.4. Oncology
- 7.6.5. Cardiology
- 7.6.6. Infectious and Immune System Diseases
- 7.6.7. Digestive System Diseases
- 7.6.8. Other Therapeutic Area
- 7.7. APAC Drug Discovery Services Market Analysis, Opportunity and Forecast, By By End-Users, 2016-2032
- 7.7.1. APAC Drug Discovery Services Market Analysis by By End-Users: Introduction
- 7.7.2. Market Size Absolute $ Opportunity Analysis and Forecast, By By End-Users, 2016-2032
- 7.7.3. Pharmaceutical and Biotechnology Companies
- 7.7.4. Academic Institutes
- 7.7.5. Manufacturing
- 7.7.6. Other End-Users
- 7.8. APAC Drug Discovery Services Market Analysis, Opportunity and Forecast, By Country , 2016-2032
- 7.8.1. APAC Drug Discovery Services Market Analysis by Country : Introduction
- 7.8.2. Market Size Absolute $ Opportunity Analysis and Forecast, Country , 2016-2032
- 7.8.2.1. China
- 7.8.2.2. Japan
- 7.8.2.3. South Korea
- 7.8.2.4. India
- 7.8.2.5. Australia & New Zeland
- 7.8.2.6. Indonesia
- 7.8.2.7. Malaysia
- 7.8.2.8. Philippines
- 7.8.2.9. Singapore
- 7.8.2.10. Thailand
- 7.8.2.11. Vietnam
- 7.8.2.12. Rest of APAC
- 8. Latin America Drug Discovery Services Market Analysis, Opportunity and Forecast, 2016-2032
- 8.1. Latin America Drug Discovery Services Market Analysis, 2016-2021
- 8.2. Latin America Drug Discovery Services Market Opportunity and Forecast, 2023-2032
- 8.3. Latin America Drug Discovery Services Market Analysis, Opportunity and Forecast, By By Process, 2016-2032
- 8.3.1. Latin America Drug Discovery Services Market Analysis by By Process: Introduction
- 8.3.2. Market Size Absolute $ Opportunity Analysis and Forecast, By By Process, 2016-2032
- 8.3.3. Target Selection
- 8.3.4. Target Validation
- 8.3.5. Hit-To-Lead-Identification
- 8.3.6. Lead Optimization
- 8.3.7. Candidate Validation
- 8.4. Latin America Drug Discovery Services Market Analysis, Opportunity and Forecast, By By Drug Type, 2016-2032
- 8.4.1. Latin America Drug Discovery Services Market Analysis by By Drug Type: Introduction
- 8.4.2. Market Size Absolute $ Opportunity Analysis and Forecast, By By Drug Type, 2016-2032
- 8.4.3. Small Molecules Drug
- 8.4.4. Biologics Drug
- 8.5. Latin America Drug Discovery Services Market Analysis, Opportunity and Forecast, By By Type, 2016-2032
- 8.5.1. Latin America Drug Discovery Services Market Analysis by By Type: Introduction
- 8.5.2. Market Size Absolute $ Opportunity Analysis and Forecast, By By Type, 2016-2032
- 8.5.3. Chemistry Services
- 8.5.4. Biology Services
- 8.6. Latin America Drug Discovery Services Market Analysis, Opportunity and Forecast, By By Therapeutics Area, 2016-2032
- 8.6.1. Latin America Drug Discovery Services Market Analysis by By Therapeutics Area: Introduction
- 8.6.2. Market Size Absolute $ Opportunity Analysis and Forecast, By By Therapeutics Area, 2016-2032
- 8.6.3. Neurology
- 8.6.4. Oncology
- 8.6.5. Cardiology
- 8.6.6. Infectious and Immune System Diseases
- 8.6.7. Digestive System Diseases
- 8.6.8. Other Therapeutic Area
- 8.7. Latin America Drug Discovery Services Market Analysis, Opportunity and Forecast, By By End-Users, 2016-2032
- 8.7.1. Latin America Drug Discovery Services Market Analysis by By End-Users: Introduction
- 8.7.2. Market Size Absolute $ Opportunity Analysis and Forecast, By By End-Users, 2016-2032
- 8.7.3. Pharmaceutical and Biotechnology Companies
- 8.7.4. Academic Institutes
- 8.7.5. Manufacturing
- 8.7.6. Other End-Users
- 8.8. Latin America Drug Discovery Services Market Analysis, Opportunity and Forecast, By Country , 2016-2032
- 8.8.1. Latin America Drug Discovery Services Market Analysis by Country : Introduction
- 8.8.2. Market Size Absolute $ Opportunity Analysis and Forecast, Country , 2016-2032
- 8.8.2.1. Brazil
- 8.8.2.2. Colombia
- 8.8.2.3. Chile
- 8.8.2.4. Argentina
- 8.8.2.5. Costa Rica
- 8.8.2.6. Rest of Latin America
- 9. Middle East & Africa Drug Discovery Services Market Analysis, Opportunity and Forecast, 2016-2032
- 9.1. Middle East & Africa Drug Discovery Services Market Analysis, 2016-2021
- 9.2. Middle East & Africa Drug Discovery Services Market Opportunity and Forecast, 2023-2032
- 9.3. Middle East & Africa Drug Discovery Services Market Analysis, Opportunity and Forecast, By By Process, 2016-2032
- 9.3.1. Middle East & Africa Drug Discovery Services Market Analysis by By Process: Introduction
- 9.3.2. Market Size Absolute $ Opportunity Analysis and Forecast, By By Process, 2016-2032
- 9.3.3. Target Selection
- 9.3.4. Target Validation
- 9.3.5. Hit-To-Lead-Identification
- 9.3.6. Lead Optimization
- 9.3.7. Candidate Validation
- 9.4. Middle East & Africa Drug Discovery Services Market Analysis, Opportunity and Forecast, By By Drug Type, 2016-2032
- 9.4.1. Middle East & Africa Drug Discovery Services Market Analysis by By Drug Type: Introduction
- 9.4.2. Market Size Absolute $ Opportunity Analysis and Forecast, By By Drug Type, 2016-2032
- 9.4.3. Small Molecules Drug
- 9.4.4. Biologics Drug
- 9.5. Middle East & Africa Drug Discovery Services Market Analysis, Opportunity and Forecast, By By Type, 2016-2032
- 9.5.1. Middle East & Africa Drug Discovery Services Market Analysis by By Type: Introduction
- 9.5.2. Market Size Absolute $ Opportunity Analysis and Forecast, By By Type, 2016-2032
- 9.5.3. Chemistry Services
- 9.5.4. Biology Services
- 9.6. Middle East & Africa Drug Discovery Services Market Analysis, Opportunity and Forecast, By By Therapeutics Area, 2016-2032
- 9.6.1. Middle East & Africa Drug Discovery Services Market Analysis by By Therapeutics Area: Introduction
- 9.6.2. Market Size Absolute $ Opportunity Analysis and Forecast, By By Therapeutics Area, 2016-2032
- 9.6.3. Neurology
- 9.6.4. Oncology
- 9.6.5. Cardiology
- 9.6.6. Infectious and Immune System Diseases
- 9.6.7. Digestive System Diseases
- 9.6.8. Other Therapeutic Area
- 9.7. Middle East & Africa Drug Discovery Services Market Analysis, Opportunity and Forecast, By By End-Users, 2016-2032
- 9.7.1. Middle East & Africa Drug Discovery Services Market Analysis by By End-Users: Introduction
- 9.7.2. Market Size Absolute $ Opportunity Analysis and Forecast, By By End-Users, 2016-2032
- 9.7.3. Pharmaceutical and Biotechnology Companies
- 9.7.4. Academic Institutes
- 9.7.5. Manufacturing
- 9.7.6. Other End-Users
- 9.8. Middle East & Africa Drug Discovery Services Market Analysis, Opportunity and Forecast, By Country , 2016-2032
- 9.8.1. Middle East & Africa Drug Discovery Services Market Analysis by Country : Introduction
- 9.8.2. Market Size Absolute $ Opportunity Analysis and Forecast, Country , 2016-2032
- 9.8.2.1. Algeria
- 9.8.2.2. Egypt
- 9.8.2.3. Israel
- 9.8.2.4. Kuwait
- 9.8.2.5. Nigeria
- 9.8.2.6. Saudi Arabia
- 9.8.2.7. South Africa
- 9.8.2.8. Turkey
- 9.8.2.9. The UAE
- 9.8.2.10. Rest of MEA
- 10. Global Drug Discovery Services Market Analysis, Opportunity and Forecast, By Region , 2016-2032
- 10.1. Global Drug Discovery Services Market Analysis by Region : Introduction
- 10.2. Market Size Absolute $ Opportunity Analysis and Forecast, By Region , 2016-2032
- 10.2.1. North America
- 10.2.2. Western Europe
- 10.2.3. Eastern Europe
- 10.2.4. APAC
- 10.2.5. Latin America
- 10.2.6. Middle East & Africa
- 11. Global Drug Discovery Services Market Competitive Landscape, Market Share Analysis, and Company Profiles
- 11.1. Market Share Analysis
- 11.2. Company Profiles
- 11.3. Albany Molecular Research Inc.
- 11.3.1. Company Overview
- 11.3.2. Financial Highlights
- 11.3.3. Product Portfolio
- 11.3.4. SWOT Analysis
- 11.3.5. Key Strategies and Developments
- 11.4. EVOTEC SE
- 11.4.1. Company Overview
- 11.4.2. Financial Highlights
- 11.4.3. Product Portfolio
- 11.4.4. SWOT Analysis
- 11.4.5. Key Strategies and Developments
- 11.5. Laboratory Corporation of America Holdings
- 11.5.1. Company Overview
- 11.5.2. Financial Highlights
- 11.5.3. Product Portfolio
- 11.5.4. SWOT Analysis
- 11.5.5. Key Strategies and Developments
- 11.6. GenScript ProBio
- 11.6.1. Company Overview
- 11.6.2. Financial Highlights
- 11.6.3. Product Portfolio
- 11.6.4. SWOT Analysis
- 11.6.5. Key Strategies and Developments
- 11.7. Pharmaceutical Product Development, LLC
- 11.7.1. Company Overview
- 11.7.2. Financial Highlights
- 11.7.3. Product Portfolio
- 11.7.4. SWOT Analysis
- 11.7.5. Key Strategies and Developments
- 11.8. Charles River Laboratories
- 11.8.1. Company Overview
- 11.8.2. Financial Highlights
- 11.8.3. Product Portfolio
- 11.8.4. SWOT Analysis
- 11.8.5. Key Strategies and Developments
- 11.9. WuXi AppTec
- 11.9.1. Company Overview
- 11.9.2. Financial Highlights
- 11.9.3. Product Portfolio
- 11.9.4. SWOT Analysis
- 11.9.5. Key Strategies and Developments
- 11.10. Merck & Co., Inc.
- 11.10.1. Company Overview
- 11.10.2. Financial Highlights
- 11.10.3. Product Portfolio
- 11.10.4. SWOT Analysis
- 11.10.5. Key Strategies and Developments
- 11.11. Thermo Fisher Scientific Inc.
- 11.11.1. Company Overview
- 11.11.2. Financial Highlights
- 11.11.3. Product Portfolio
- 11.11.4. SWOT Analysis
- 11.11.5. Key Strategies and Developments
- 11.12. Other Key Players
- 11.12.1. Company Overview
- 11.12.2. Financial Highlights
- 11.12.3. Product Portfolio
- 11.12.4. SWOT Analysis
- 11.12.5. Key Strategies and Developments
- 12. Assumptions and Acronyms
- 13. Research Methodology
- 14. Contact
- List of Figures
- Figure 1: Global Drug Discovery Services Market Revenue (US$ Mn) Market Share by By Process in 2022
- Figure 2: Global Drug Discovery Services Market Attractiveness Analysis by By Process, 2016-2032
- Figure 3: Global Drug Discovery Services Market Revenue (US$ Mn) Market Share by By Drug Typein 2022
- Figure 4: Global Drug Discovery Services Market Attractiveness Analysis by By Drug Type, 2016-2032
- Figure 5: Global Drug Discovery Services Market Revenue (US$ Mn) Market Share by By Typein 2022
- Figure 6: Global Drug Discovery Services Market Attractiveness Analysis by By Type, 2016-2032
- Figure 7: Global Drug Discovery Services Market Revenue (US$ Mn) Market Share by By Therapeutics Areain 2022
- Figure 8: Global Drug Discovery Services Market Attractiveness Analysis by By Therapeutics Area, 2016-2032
- Figure 9: Global Drug Discovery Services Market Revenue (US$ Mn) Market Share by By End-Usersin 2022
- Figure 10: Global Drug Discovery Services Market Attractiveness Analysis by By End-Users, 2016-2032
- Figure 11: Global Drug Discovery Services Market Revenue (US$ Mn) Market Share by Region in 2022
- Figure 12: Global Drug Discovery Services Market Attractiveness Analysis by Region, 2016-2032
- Figure 13: Global Drug Discovery Services Market Revenue (US$ Mn) (2016-2032)
- Figure 14: Global Drug Discovery Services Market Revenue (US$ Mn) Comparison by Region (2016-2032)
- Figure 15: Global Drug Discovery Services Market Revenue (US$ Mn) Comparison by By Process (2016-2032)
- Figure 16: Global Drug Discovery Services Market Revenue (US$ Mn) Comparison by By Drug Type (2016-2032)
- Figure 17: Global Drug Discovery Services Market Revenue (US$ Mn) Comparison by By Type (2016-2032)
- Figure 18: Global Drug Discovery Services Market Revenue (US$ Mn) Comparison by By Therapeutics Area (2016-2032)
- Figure 19: Global Drug Discovery Services Market Revenue (US$ Mn) Comparison by By End-Users (2016-2032)
- Figure 20: Global Drug Discovery Services Market Y-o-Y Growth Rate Comparison by Region (2016-2032)
- Figure 21: Global Drug Discovery Services Market Y-o-Y Growth Rate Comparison by By Process (2016-2032)
- Figure 22: Global Drug Discovery Services Market Y-o-Y Growth Rate Comparison by By Drug Type (2016-2032)
- Figure 23: Global Drug Discovery Services Market Y-o-Y Growth Rate Comparison by By Type (2016-2032)
- Figure 24: Global Drug Discovery Services Market Y-o-Y Growth Rate Comparison by By Therapeutics Area (2016-2032)
- Figure 25: Global Drug Discovery Services Market Y-o-Y Growth Rate Comparison by By End-Users (2016-2032)
- Figure 26: Global Drug Discovery Services Market Share Comparison by Region (2016-2032)
- Figure 27: Global Drug Discovery Services Market Share Comparison by By Process (2016-2032)
- Figure 28: Global Drug Discovery Services Market Share Comparison by By Drug Type (2016-2032)
- Figure 29: Global Drug Discovery Services Market Share Comparison by By Type (2016-2032)
- Figure 30: Global Drug Discovery Services Market Share Comparison by By Therapeutics Area (2016-2032)
- Figure 31: Global Drug Discovery Services Market Share Comparison by By End-Users (2016-2032)
- Figure 32: North America Drug Discovery Services Market Revenue (US$ Mn) Market Share by By Processin 2022
- Figure 33: North America Drug Discovery Services Market Attractiveness Analysis by By Process, 2016-2032
- Figure 34: North America Drug Discovery Services Market Revenue (US$ Mn) Market Share by By Drug Typein 2022
- Figure 35: North America Drug Discovery Services Market Attractiveness Analysis by By Drug Type, 2016-2032
- Figure 36: North America Drug Discovery Services Market Revenue (US$ Mn) Market Share by By Typein 2022
- Figure 37: North America Drug Discovery Services Market Attractiveness Analysis by By Type, 2016-2032
- Figure 38: North America Drug Discovery Services Market Revenue (US$ Mn) Market Share by By Therapeutics Areain 2022
- Figure 39: North America Drug Discovery Services Market Attractiveness Analysis by By Therapeutics Area, 2016-2032
- Figure 40: North America Drug Discovery Services Market Revenue (US$ Mn) Market Share by By End-Usersin 2022
- Figure 41: North America Drug Discovery Services Market Attractiveness Analysis by By End-Users, 2016-2032
- Figure 42: North America Drug Discovery Services Market Revenue (US$ Mn) Market Share by Country in 2022
- Figure 43: North America Drug Discovery Services Market Attractiveness Analysis by Country, 2016-2032
- Figure 44: North America Drug Discovery Services Market Revenue (US$ Mn) (2016-2032)
- Figure 45: North America Drug Discovery Services Market Revenue (US$ Mn) Comparison by Country (2016-2032)
- Figure 46: North America Drug Discovery Services Market Revenue (US$ Mn) Comparison by By Process (2016-2032)
- Figure 47: North America Drug Discovery Services Market Revenue (US$ Mn) Comparison by By Drug Type (2016-2032)
- Figure 48: North America Drug Discovery Services Market Revenue (US$ Mn) Comparison by By Type (2016-2032)
- Figure 49: North America Drug Discovery Services Market Revenue (US$ Mn) Comparison by By Therapeutics Area (2016-2032)
- Figure 50: North America Drug Discovery Services Market Revenue (US$ Mn) Comparison by By End-Users (2016-2032)
- Figure 51: North America Drug Discovery Services Market Y-o-Y Growth Rate Comparison by Country (2016-2032)
- Figure 52: North America Drug Discovery Services Market Y-o-Y Growth Rate Comparison by By Process (2016-2032)
- Figure 53: North America Drug Discovery Services Market Y-o-Y Growth Rate Comparison by By Drug Type (2016-2032)
- Figure 54: North America Drug Discovery Services Market Y-o-Y Growth Rate Comparison by By Type (2016-2032)
- Figure 55: North America Drug Discovery Services Market Y-o-Y Growth Rate Comparison by By Therapeutics Area (2016-2032)
- Figure 56: North America Drug Discovery Services Market Y-o-Y Growth Rate Comparison by By End-Users (2016-2032)
- Figure 57: North America Drug Discovery Services Market Share Comparison by Country (2016-2032)
- Figure 58: North America Drug Discovery Services Market Share Comparison by By Process (2016-2032)
- Figure 59: North America Drug Discovery Services Market Share Comparison by By Drug Type (2016-2032)
- Figure 60: North America Drug Discovery Services Market Share Comparison by By Type (2016-2032)
- Figure 61: North America Drug Discovery Services Market Share Comparison by By Therapeutics Area (2016-2032)
- Figure 62: North America Drug Discovery Services Market Share Comparison by By End-Users (2016-2032)
- Figure 63: Western Europe Drug Discovery Services Market Revenue (US$ Mn) Market Share by By Processin 2022
- Figure 64: Western Europe Drug Discovery Services Market Attractiveness Analysis by By Process, 2016-2032
- Figure 65: Western Europe Drug Discovery Services Market Revenue (US$ Mn) Market Share by By Drug Typein 2022
- Figure 66: Western Europe Drug Discovery Services Market Attractiveness Analysis by By Drug Type, 2016-2032
- Figure 67: Western Europe Drug Discovery Services Market Revenue (US$ Mn) Market Share by By Typein 2022
- Figure 68: Western Europe Drug Discovery Services Market Attractiveness Analysis by By Type, 2016-2032
- Figure 69: Western Europe Drug Discovery Services Market Revenue (US$ Mn) Market Share by By Therapeutics Areain 2022
- Figure 70: Western Europe Drug Discovery Services Market Attractiveness Analysis by By Therapeutics Area, 2016-2032
- Figure 71: Western Europe Drug Discovery Services Market Revenue (US$ Mn) Market Share by By End-Usersin 2022
- Figure 72: Western Europe Drug Discovery Services Market Attractiveness Analysis by By End-Users, 2016-2032
- Figure 73: Western Europe Drug Discovery Services Market Revenue (US$ Mn) Market Share by Country in 2022
- Figure 74: Western Europe Drug Discovery Services Market Attractiveness Analysis by Country, 2016-2032
- Figure 75: Western Europe Drug Discovery Services Market Revenue (US$ Mn) (2016-2032)
- Figure 76: Western Europe Drug Discovery Services Market Revenue (US$ Mn) Comparison by Country (2016-2032)
- Figure 77: Western Europe Drug Discovery Services Market Revenue (US$ Mn) Comparison by By Process (2016-2032)
- Figure 78: Western Europe Drug Discovery Services Market Revenue (US$ Mn) Comparison by By Drug Type (2016-2032)
- Figure 79: Western Europe Drug Discovery Services Market Revenue (US$ Mn) Comparison by By Type (2016-2032)
- Figure 80: Western Europe Drug Discovery Services Market Revenue (US$ Mn) Comparison by By Therapeutics Area (2016-2032)
- Figure 81: Western Europe Drug Discovery Services Market Revenue (US$ Mn) Comparison by By End-Users (2016-2032)
- Figure 82: Western Europe Drug Discovery Services Market Y-o-Y Growth Rate Comparison by Country (2016-2032)
- Figure 83: Western Europe Drug Discovery Services Market Y-o-Y Growth Rate Comparison by By Process (2016-2032)
- Figure 84: Western Europe Drug Discovery Services Market Y-o-Y Growth Rate Comparison by By Drug Type (2016-2032)
- Figure 85: Western Europe Drug Discovery Services Market Y-o-Y Growth Rate Comparison by By Type (2016-2032)
- Figure 86: Western Europe Drug Discovery Services Market Y-o-Y Growth Rate Comparison by By Therapeutics Area (2016-2032)
- Figure 87: Western Europe Drug Discovery Services Market Y-o-Y Growth Rate Comparison by By End-Users (2016-2032)
- Figure 88: Western Europe Drug Discovery Services Market Share Comparison by Country (2016-2032)
- Figure 89: Western Europe Drug Discovery Services Market Share Comparison by By Process (2016-2032)
- Figure 90: Western Europe Drug Discovery Services Market Share Comparison by By Drug Type (2016-2032)
- Figure 91: Western Europe Drug Discovery Services Market Share Comparison by By Type (2016-2032)
- Figure 92: Western Europe Drug Discovery Services Market Share Comparison by By Therapeutics Area (2016-2032)
- Figure 93: Western Europe Drug Discovery Services Market Share Comparison by By End-Users (2016-2032)
- Figure 94: Eastern Europe Drug Discovery Services Market Revenue (US$ Mn) Market Share by By Processin 2022
- Figure 95: Eastern Europe Drug Discovery Services Market Attractiveness Analysis by By Process, 2016-2032
- Figure 96: Eastern Europe Drug Discovery Services Market Revenue (US$ Mn) Market Share by By Drug Typein 2022
- Figure 97: Eastern Europe Drug Discovery Services Market Attractiveness Analysis by By Drug Type, 2016-2032
- Figure 98: Eastern Europe Drug Discovery Services Market Revenue (US$ Mn) Market Share by By Typein 2022
- Figure 99: Eastern Europe Drug Discovery Services Market Attractiveness Analysis by By Type, 2016-2032
- Figure 100: Eastern Europe Drug Discovery Services Market Revenue (US$ Mn) Market Share by By Therapeutics Areain 2022
- Figure 101: Eastern Europe Drug Discovery Services Market Attractiveness Analysis by By Therapeutics Area, 2016-2032
- Figure 102: Eastern Europe Drug Discovery Services Market Revenue (US$ Mn) Market Share by By End-Usersin 2022
- Figure 103: Eastern Europe Drug Discovery Services Market Attractiveness Analysis by By End-Users, 2016-2032
- Figure 104: Eastern Europe Drug Discovery Services Market Revenue (US$ Mn) Market Share by Country in 2022
- Figure 105: Eastern Europe Drug Discovery Services Market Attractiveness Analysis by Country, 2016-2032
- Figure 106: Eastern Europe Drug Discovery Services Market Revenue (US$ Mn) (2016-2032)
- Figure 107: Eastern Europe Drug Discovery Services Market Revenue (US$ Mn) Comparison by Country (2016-2032)
- Figure 108: Eastern Europe Drug Discovery Services Market Revenue (US$ Mn) Comparison by By Process (2016-2032)
- Figure 109: Eastern Europe Drug Discovery Services Market Revenue (US$ Mn) Comparison by By Drug Type (2016-2032)
- Figure 110: Eastern Europe Drug Discovery Services Market Revenue (US$ Mn) Comparison by By Type (2016-2032)
- Figure 111: Eastern Europe Drug Discovery Services Market Revenue (US$ Mn) Comparison by By Therapeutics Area (2016-2032)
- Figure 112: Eastern Europe Drug Discovery Services Market Revenue (US$ Mn) Comparison by By End-Users (2016-2032)
- Figure 113: Eastern Europe Drug Discovery Services Market Y-o-Y Growth Rate Comparison by Country (2016-2032)
- Figure 114: Eastern Europe Drug Discovery Services Market Y-o-Y Growth Rate Comparison by By Process (2016-2032)
- Figure 115: Eastern Europe Drug Discovery Services Market Y-o-Y Growth Rate Comparison by By Drug Type (2016-2032)
- Figure 116: Eastern Europe Drug Discovery Services Market Y-o-Y Growth Rate Comparison by By Type (2016-2032)
- Figure 117: Eastern Europe Drug Discovery Services Market Y-o-Y Growth Rate Comparison by By Therapeutics Area (2016-2032)
- Figure 118: Eastern Europe Drug Discovery Services Market Y-o-Y Growth Rate Comparison by By End-Users (2016-2032)
- Figure 119: Eastern Europe Drug Discovery Services Market Share Comparison by Country (2016-2032)
- Figure 120: Eastern Europe Drug Discovery Services Market Share Comparison by By Process (2016-2032)
- Figure 121: Eastern Europe Drug Discovery Services Market Share Comparison by By Drug Type (2016-2032)
- Figure 122: Eastern Europe Drug Discovery Services Market Share Comparison by By Type (2016-2032)
- Figure 123: Eastern Europe Drug Discovery Services Market Share Comparison by By Therapeutics Area (2016-2032)
- Figure 124: Eastern Europe Drug Discovery Services Market Share Comparison by By End-Users (2016-2032)
- Figure 125: APAC Drug Discovery Services Market Revenue (US$ Mn) Market Share by By Processin 2022
- Figure 126: APAC Drug Discovery Services Market Attractiveness Analysis by By Process, 2016-2032
- Figure 127: APAC Drug Discovery Services Market Revenue (US$ Mn) Market Share by By Drug Typein 2022
- Figure 128: APAC Drug Discovery Services Market Attractiveness Analysis by By Drug Type, 2016-2032
- Figure 129: APAC Drug Discovery Services Market Revenue (US$ Mn) Market Share by By Typein 2022
- Figure 130: APAC Drug Discovery Services Market Attractiveness Analysis by By Type, 2016-2032
- Figure 131: APAC Drug Discovery Services Market Revenue (US$ Mn) Market Share by By Therapeutics Areain 2022
- Figure 132: APAC Drug Discovery Services Market Attractiveness Analysis by By Therapeutics Area, 2016-2032
- Figure 133: APAC Drug Discovery Services Market Revenue (US$ Mn) Market Share by By End-Usersin 2022
- Figure 134: APAC Drug Discovery Services Market Attractiveness Analysis by By End-Users, 2016-2032
- Figure 135: APAC Drug Discovery Services Market Revenue (US$ Mn) Market Share by Country in 2022
- Figure 136: APAC Drug Discovery Services Market Attractiveness Analysis by Country, 2016-2032
- Figure 137: APAC Drug Discovery Services Market Revenue (US$ Mn) (2016-2032)
- Figure 138: APAC Drug Discovery Services Market Revenue (US$ Mn) Comparison by Country (2016-2032)
- Figure 139: APAC Drug Discovery Services Market Revenue (US$ Mn) Comparison by By Process (2016-2032)
- Figure 140: APAC Drug Discovery Services Market Revenue (US$ Mn) Comparison by By Drug Type (2016-2032)
- Figure 141: APAC Drug Discovery Services Market Revenue (US$ Mn) Comparison by By Type (2016-2032)
- Figure 142: APAC Drug Discovery Services Market Revenue (US$ Mn) Comparison by By Therapeutics Area (2016-2032)
- Figure 143: APAC Drug Discovery Services Market Revenue (US$ Mn) Comparison by By End-Users (2016-2032)
- Figure 144: APAC Drug Discovery Services Market Y-o-Y Growth Rate Comparison by Country (2016-2032)
- Figure 145: APAC Drug Discovery Services Market Y-o-Y Growth Rate Comparison by By Process (2016-2032)
- Figure 146: APAC Drug Discovery Services Market Y-o-Y Growth Rate Comparison by By Drug Type (2016-2032)
- Figure 147: APAC Drug Discovery Services Market Y-o-Y Growth Rate Comparison by By Type (2016-2032)
- Figure 148: APAC Drug Discovery Services Market Y-o-Y Growth Rate Comparison by By Therapeutics Area (2016-2032)
- Figure 149: APAC Drug Discovery Services Market Y-o-Y Growth Rate Comparison by By End-Users (2016-2032)
- Figure 150: APAC Drug Discovery Services Market Share Comparison by Country (2016-2032)
- Figure 151: APAC Drug Discovery Services Market Share Comparison by By Process (2016-2032)
- Figure 152: APAC Drug Discovery Services Market Share Comparison by By Drug Type (2016-2032)
- Figure 153: APAC Drug Discovery Services Market Share Comparison by By Type (2016-2032)
- Figure 154: APAC Drug Discovery Services Market Share Comparison by By Therapeutics Area (2016-2032)
- Figure 155: APAC Drug Discovery Services Market Share Comparison by By End-Users (2016-2032)
- Figure 156: Latin America Drug Discovery Services Market Revenue (US$ Mn) Market Share by By Processin 2022
- Figure 157: Latin America Drug Discovery Services Market Attractiveness Analysis by By Process, 2016-2032
- Figure 158: Latin America Drug Discovery Services Market Revenue (US$ Mn) Market Share by By Drug Typein 2022
- Figure 159: Latin America Drug Discovery Services Market Attractiveness Analysis by By Drug Type, 2016-2032
- Figure 160: Latin America Drug Discovery Services Market Revenue (US$ Mn) Market Share by By Typein 2022
- Figure 161: Latin America Drug Discovery Services Market Attractiveness Analysis by By Type, 2016-2032
- Figure 162: Latin America Drug Discovery Services Market Revenue (US$ Mn) Market Share by By Therapeutics Areain 2022
- Figure 163: Latin America Drug Discovery Services Market Attractiveness Analysis by By Therapeutics Area, 2016-2032
- Figure 164: Latin America Drug Discovery Services Market Revenue (US$ Mn) Market Share by By End-Usersin 2022
- Figure 165: Latin America Drug Discovery Services Market Attractiveness Analysis by By End-Users, 2016-2032
- Figure 166: Latin America Drug Discovery Services Market Revenue (US$ Mn) Market Share by Country in 2022
- Figure 167: Latin America Drug Discovery Services Market Attractiveness Analysis by Country, 2016-2032
- Figure 168: Latin America Drug Discovery Services Market Revenue (US$ Mn) (2016-2032)
- Figure 169: Latin America Drug Discovery Services Market Revenue (US$ Mn) Comparison by Country (2016-2032)
- Figure 170: Latin America Drug Discovery Services Market Revenue (US$ Mn) Comparison by By Process (2016-2032)
- Figure 171: Latin America Drug Discovery Services Market Revenue (US$ Mn) Comparison by By Drug Type (2016-2032)
- Figure 172: Latin America Drug Discovery Services Market Revenue (US$ Mn) Comparison by By Type (2016-2032)
- Figure 173: Latin America Drug Discovery Services Market Revenue (US$ Mn) Comparison by By Therapeutics Area (2016-2032)
- Figure 174: Latin America Drug Discovery Services Market Revenue (US$ Mn) Comparison by By End-Users (2016-2032)
- Figure 175: Latin America Drug Discovery Services Market Y-o-Y Growth Rate Comparison by Country (2016-2032)
- Figure 176: Latin America Drug Discovery Services Market Y-o-Y Growth Rate Comparison by By Process (2016-2032)
- Figure 177: Latin America Drug Discovery Services Market Y-o-Y Growth Rate Comparison by By Drug Type (2016-2032)
- Figure 178: Latin America Drug Discovery Services Market Y-o-Y Growth Rate Comparison by By Type (2016-2032)
- Figure 179: Latin America Drug Discovery Services Market Y-o-Y Growth Rate Comparison by By Therapeutics Area (2016-2032)
- Figure 180: Latin America Drug Discovery Services Market Y-o-Y Growth Rate Comparison by By End-Users (2016-2032)
- Figure 181: Latin America Drug Discovery Services Market Share Comparison by Country (2016-2032)
- Figure 182: Latin America Drug Discovery Services Market Share Comparison by By Process (2016-2032)
- Figure 183: Latin America Drug Discovery Services Market Share Comparison by By Drug Type (2016-2032)
- Figure 184: Latin America Drug Discovery Services Market Share Comparison by By Type (2016-2032)
- Figure 185: Latin America Drug Discovery Services Market Share Comparison by By Therapeutics Area (2016-2032)
- Figure 186: Latin America Drug Discovery Services Market Share Comparison by By End-Users (2016-2032)
- Figure 187: Middle East & Africa Drug Discovery Services Market Revenue (US$ Mn) Market Share by By Processin 2022
- Figure 188: Middle East & Africa Drug Discovery Services Market Attractiveness Analysis by By Process, 2016-2032
- Figure 189: Middle East & Africa Drug Discovery Services Market Revenue (US$ Mn) Market Share by By Drug Typein 2022
- Figure 190: Middle East & Africa Drug Discovery Services Market Attractiveness Analysis by By Drug Type, 2016-2032
- Figure 191: Middle East & Africa Drug Discovery Services Market Revenue (US$ Mn) Market Share by By Typein 2022
- Figure 192: Middle East & Africa Drug Discovery Services Market Attractiveness Analysis by By Type, 2016-2032
- Figure 193: Middle East & Africa Drug Discovery Services Market Revenue (US$ Mn) Market Share by By Therapeutics Areain 2022
- Figure 194: Middle East & Africa Drug Discovery Services Market Attractiveness Analysis by By Therapeutics Area, 2016-2032
- Figure 195: Middle East & Africa Drug Discovery Services Market Revenue (US$ Mn) Market Share by By End-Usersin 2022
- Figure 196: Middle East & Africa Drug Discovery Services Market Attractiveness Analysis by By End-Users, 2016-2032
- Figure 197: Middle East & Africa Drug Discovery Services Market Revenue (US$ Mn) Market Share by Country in 2022
- Figure 198: Middle East & Africa Drug Discovery Services Market Attractiveness Analysis by Country, 2016-2032
- Figure 199: Middle East & Africa Drug Discovery Services Market Revenue (US$ Mn) (2016-2032)
- Figure 200: Middle East & Africa Drug Discovery Services Market Revenue (US$ Mn) Comparison by Country (2016-2032)
- Figure 201: Middle East & Africa Drug Discovery Services Market Revenue (US$ Mn) Comparison by By Process (2016-2032)
- Figure 202: Middle East & Africa Drug Discovery Services Market Revenue (US$ Mn) Comparison by By Drug Type (2016-2032)
- Figure 203: Middle East & Africa Drug Discovery Services Market Revenue (US$ Mn) Comparison by By Type (2016-2032)
- Figure 204: Middle East & Africa Drug Discovery Services Market Revenue (US$ Mn) Comparison by By Therapeutics Area (2016-2032)
- Figure 205: Middle East & Africa Drug Discovery Services Market Revenue (US$ Mn) Comparison by By End-Users (2016-2032)
- Figure 206: Middle East & Africa Drug Discovery Services Market Y-o-Y Growth Rate Comparison by Country (2016-2032)
- Figure 207: Middle East & Africa Drug Discovery Services Market Y-o-Y Growth Rate Comparison by By Process (2016-2032)
- Figure 208: Middle East & Africa Drug Discovery Services Market Y-o-Y Growth Rate Comparison by By Drug Type (2016-2032)
- Figure 209: Middle East & Africa Drug Discovery Services Market Y-o-Y Growth Rate Comparison by By Type (2016-2032)
- Figure 210: Middle East & Africa Drug Discovery Services Market Y-o-Y Growth Rate Comparison by By Therapeutics Area (2016-2032)
- Figure 211: Middle East & Africa Drug Discovery Services Market Y-o-Y Growth Rate Comparison by By End-Users (2016-2032)
- Figure 212: Middle East & Africa Drug Discovery Services Market Share Comparison by Country (2016-2032)
- Figure 213: Middle East & Africa Drug Discovery Services Market Share Comparison by By Process (2016-2032)
- Figure 214: Middle East & Africa Drug Discovery Services Market Share Comparison by By Drug Type (2016-2032)
- Figure 215: Middle East & Africa Drug Discovery Services Market Share Comparison by By Type (2016-2032)
- Figure 216: Middle East & Africa Drug Discovery Services Market Share Comparison by By Therapeutics Area (2016-2032)
- Figure 217: Middle East & Africa Drug Discovery Services Market Share Comparison by By End-Users (2016-2032)
- List of Tables
- Table 1: Global Drug Discovery Services Market Comparison by By Process (2016-2032)
- Table 2: Global Drug Discovery Services Market Comparison by By Drug Type (2016-2032)
- Table 3: Global Drug Discovery Services Market Comparison by By Type (2016-2032)
- Table 4: Global Drug Discovery Services Market Comparison by By Therapeutics Area (2016-2032)
- Table 5: Global Drug Discovery Services Market Comparison by By End-Users (2016-2032)
- Table 6: Global Drug Discovery Services Market Revenue (US$ Mn) Comparison by Region (2016-2032)
- Table 7: Global Drug Discovery Services Market Revenue (US$ Mn) (2016-2032)
- Table 8: Global Drug Discovery Services Market Revenue (US$ Mn) Comparison by Region (2016-2032)
- Table 9: Global Drug Discovery Services Market Revenue (US$ Mn) Comparison by By Process (2016-2032)
- Table 10: Global Drug Discovery Services Market Revenue (US$ Mn) Comparison by By Drug Type (2016-2032)
- Table 11: Global Drug Discovery Services Market Revenue (US$ Mn) Comparison by By Type (2016-2032)
- Table 12: Global Drug Discovery Services Market Revenue (US$ Mn) Comparison by By Therapeutics Area (2016-2032)
- Table 13: Global Drug Discovery Services Market Revenue (US$ Mn) Comparison by By End-Users (2016-2032)
- Table 14: Global Drug Discovery Services Market Y-o-Y Growth Rate Comparison by Region (2016-2032)
- Table 15: Global Drug Discovery Services Market Y-o-Y Growth Rate Comparison by By Process (2016-2032)
- Table 16: Global Drug Discovery Services Market Y-o-Y Growth Rate Comparison by By Drug Type (2016-2032)
- Table 17: Global Drug Discovery Services Market Y-o-Y Growth Rate Comparison by By Type (2016-2032)
- Table 18: Global Drug Discovery Services Market Y-o-Y Growth Rate Comparison by By Therapeutics Area (2016-2032)
- Table 19: Global Drug Discovery Services Market Y-o-Y Growth Rate Comparison by By End-Users (2016-2032)
- Table 20: Global Drug Discovery Services Market Share Comparison by Region (2016-2032)
- Table 21: Global Drug Discovery Services Market Share Comparison by By Process (2016-2032)
- Table 22: Global Drug Discovery Services Market Share Comparison by By Drug Type (2016-2032)
- Table 23: Global Drug Discovery Services Market Share Comparison by By Type (2016-2032)
- Table 24: Global Drug Discovery Services Market Share Comparison by By Therapeutics Area (2016-2032)
- Table 25: Global Drug Discovery Services Market Share Comparison by By End-Users (2016-2032)
- Table 26: North America Drug Discovery Services Market Comparison by By Drug Type (2016-2032)
- Table 27: North America Drug Discovery Services Market Comparison by By Type (2016-2032)
- Table 28: North America Drug Discovery Services Market Comparison by By Therapeutics Area (2016-2032)
- Table 29: North America Drug Discovery Services Market Comparison by By End-Users (2016-2032)
- Table 30: North America Drug Discovery Services Market Revenue (US$ Mn) Comparison by Country (2016-2032)
- Table 31: North America Drug Discovery Services Market Revenue (US$ Mn) (2016-2032)
- Table 32: North America Drug Discovery Services Market Revenue (US$ Mn) Comparison by Country (2016-2032)
- Table 33: North America Drug Discovery Services Market Revenue (US$ Mn) Comparison by By Process (2016-2032)
- Table 34: North America Drug Discovery Services Market Revenue (US$ Mn) Comparison by By Drug Type (2016-2032)
- Table 35: North America Drug Discovery Services Market Revenue (US$ Mn) Comparison by By Type (2016-2032)
- Table 36: North America Drug Discovery Services Market Revenue (US$ Mn) Comparison by By Therapeutics Area (2016-2032)
- Table 37: North America Drug Discovery Services Market Revenue (US$ Mn) Comparison by By End-Users (2016-2032)
- Table 38: North America Drug Discovery Services Market Y-o-Y Growth Rate Comparison by Country (2016-2032)
- Table 39: North America Drug Discovery Services Market Y-o-Y Growth Rate Comparison by By Process (2016-2032)
- Table 40: North America Drug Discovery Services Market Y-o-Y Growth Rate Comparison by By Drug Type (2016-2032)
- Table 41: North America Drug Discovery Services Market Y-o-Y Growth Rate Comparison by By Type (2016-2032)
- Table 42: North America Drug Discovery Services Market Y-o-Y Growth Rate Comparison by By Therapeutics Area (2016-2032)
- Table 43: North America Drug Discovery Services Market Y-o-Y Growth Rate Comparison by By End-Users (2016-2032)
- Table 44: North America Drug Discovery Services Market Share Comparison by Country (2016-2032)
- Table 45: North America Drug Discovery Services Market Share Comparison by By Process (2016-2032)
- Table 46: North America Drug Discovery Services Market Share Comparison by By Drug Type (2016-2032)
- Table 47: North America Drug Discovery Services Market Share Comparison by By Type (2016-2032)
- Table 48: North America Drug Discovery Services Market Share Comparison by By Therapeutics Area (2016-2032)
- Table 49: North America Drug Discovery Services Market Share Comparison by By End-Users (2016-2032)
- Table 50: Western Europe Drug Discovery Services Market Comparison by By Process (2016-2032)
- Table 51: Western Europe Drug Discovery Services Market Comparison by By Drug Type (2016-2032)
- Table 52: Western Europe Drug Discovery Services Market Comparison by By Type (2016-2032)
- Table 53: Western Europe Drug Discovery Services Market Comparison by By Therapeutics Area (2016-2032)
- Table 54: Western Europe Drug Discovery Services Market Comparison by By End-Users (2016-2032)
- Table 55: Western Europe Drug Discovery Services Market Revenue (US$ Mn) Comparison by Country (2016-2032)
- Table 56: Western Europe Drug Discovery Services Market Revenue (US$ Mn) (2016-2032)
- Table 57: Western Europe Drug Discovery Services Market Revenue (US$ Mn) Comparison by Country (2016-2032)
- Table 58: Western Europe Drug Discovery Services Market Revenue (US$ Mn) Comparison by By Process (2016-2032)
- Table 59: Western Europe Drug Discovery Services Market Revenue (US$ Mn) Comparison by By Drug Type (2016-2032)
- Table 60: Western Europe Drug Discovery Services Market Revenue (US$ Mn) Comparison by By Type (2016-2032)
- Table 61: Western Europe Drug Discovery Services Market Revenue (US$ Mn) Comparison by By Therapeutics Area (2016-2032)
- Table 62: Western Europe Drug Discovery Services Market Revenue (US$ Mn) Comparison by By End-Users (2016-2032)
- Table 63: Western Europe Drug Discovery Services Market Y-o-Y Growth Rate Comparison by Country (2016-2032)
- Table 64: Western Europe Drug Discovery Services Market Y-o-Y Growth Rate Comparison by By Process (2016-2032)
- Table 65: Western Europe Drug Discovery Services Market Y-o-Y Growth Rate Comparison by By Drug Type (2016-2032)
- Table 66: Western Europe Drug Discovery Services Market Y-o-Y Growth Rate Comparison by By Type (2016-2032)
- Table 67: Western Europe Drug Discovery Services Market Y-o-Y Growth Rate Comparison by By Therapeutics Area (2016-2032)
- Table 68: Western Europe Drug Discovery Services Market Y-o-Y Growth Rate Comparison by By End-Users (2016-2032)
- Table 69: Western Europe Drug Discovery Services Market Share Comparison by Country (2016-2032)
- Table 70: Western Europe Drug Discovery Services Market Share Comparison by By Process (2016-2032)
- Table 71: Western Europe Drug Discovery Services Market Share Comparison by By Drug Type (2016-2032)
- Table 72: Western Europe Drug Discovery Services Market Share Comparison by By Type (2016-2032)
- Table 73: Western Europe Drug Discovery Services Market Share Comparison by By Therapeutics Area (2016-2032)
- Table 74: Western Europe Drug Discovery Services Market Share Comparison by By End-Users (2016-2032)
- Table 75: Eastern Europe Drug Discovery Services Market Comparison by By Process (2016-2032)
- Table 76: Eastern Europe Drug Discovery Services Market Comparison by By Drug Type (2016-2032)
- Table 77: Eastern Europe Drug Discovery Services Market Comparison by By Type (2016-2032)
- Table 78: Eastern Europe Drug Discovery Services Market Comparison by By Therapeutics Area (2016-2032)
- Table 79: Eastern Europe Drug Discovery Services Market Comparison by By End-Users (2016-2032)
- Table 80: Eastern Europe Drug Discovery Services Market Revenue (US$ Mn) Comparison by Country (2016-2032)
- Table 81: Eastern Europe Drug Discovery Services Market Revenue (US$ Mn) (2016-2032)
- Table 82: Eastern Europe Drug Discovery Services Market Revenue (US$ Mn) Comparison by Country (2016-2032)
- Table 83: Eastern Europe Drug Discovery Services Market Revenue (US$ Mn) Comparison by By Process (2016-2032)
- Table 84: Eastern Europe Drug Discovery Services Market Revenue (US$ Mn) Comparison by By Drug Type (2016-2032)
- Table 85: Eastern Europe Drug Discovery Services Market Revenue (US$ Mn) Comparison by By Type (2016-2032)
- Table 86: Eastern Europe Drug Discovery Services Market Revenue (US$ Mn) Comparison by By Therapeutics Area (2016-2032)
- Table 87: Eastern Europe Drug Discovery Services Market Revenue (US$ Mn) Comparison by By End-Users (2016-2032)
- Table 88: Eastern Europe Drug Discovery Services Market Y-o-Y Growth Rate Comparison by Country (2016-2032)
- Table 89: Eastern Europe Drug Discovery Services Market Y-o-Y Growth Rate Comparison by By Process (2016-2032)
- Table 90: Eastern Europe Drug Discovery Services Market Y-o-Y Growth Rate Comparison by By Drug Type (2016-2032)
- Table 91: Eastern Europe Drug Discovery Services Market Y-o-Y Growth Rate Comparison by By Type (2016-2032)
- Table 92: Eastern Europe Drug Discovery Services Market Y-o-Y Growth Rate Comparison by By Therapeutics Area (2016-2032)
- Table 93: Eastern Europe Drug Discovery Services Market Y-o-Y Growth Rate Comparison by By End-Users (2016-2032)
- Table 94: Eastern Europe Drug Discovery Services Market Share Comparison by Country (2016-2032)
- Table 95: Eastern Europe Drug Discovery Services Market Share Comparison by By Process (2016-2032)
- Table 96: Eastern Europe Drug Discovery Services Market Share Comparison by By Drug Type (2016-2032)
- Table 97: Eastern Europe Drug Discovery Services Market Share Comparison by By Type (2016-2032)
- Table 98: Eastern Europe Drug Discovery Services Market Share Comparison by By Therapeutics Area (2016-2032)
- Table 99: Eastern Europe Drug Discovery Services Market Share Comparison by By End-Users (2016-2032)
- Table 100: APAC Drug Discovery Services Market Comparison by By Process (2016-2032)
- Table 101: APAC Drug Discovery Services Market Comparison by By Drug Type (2016-2032)
- Table 102: APAC Drug Discovery Services Market Comparison by By Type (2016-2032)
- Table 103: APAC Drug Discovery Services Market Comparison by By Therapeutics Area (2016-2032)
- Table 104: APAC Drug Discovery Services Market Comparison by By End-Users (2016-2032)
- Table 105: APAC Drug Discovery Services Market Revenue (US$ Mn) Comparison by Country (2016-2032)
- Table 106: APAC Drug Discovery Services Market Revenue (US$ Mn) (2016-2032)
- Table 107: APAC Drug Discovery Services Market Revenue (US$ Mn) Comparison by Country (2016-2032)
- Table 108: APAC Drug Discovery Services Market Revenue (US$ Mn) Comparison by By Process (2016-2032)
- Table 109: APAC Drug Discovery Services Market Revenue (US$ Mn) Comparison by By Drug Type (2016-2032)
- Table 110: APAC Drug Discovery Services Market Revenue (US$ Mn) Comparison by By Type (2016-2032)
- Table 111: APAC Drug Discovery Services Market Revenue (US$ Mn) Comparison by By Therapeutics Area (2016-2032)
- Table 112: APAC Drug Discovery Services Market Revenue (US$ Mn) Comparison by By End-Users (2016-2032)
- Table 113: APAC Drug Discovery Services Market Y-o-Y Growth Rate Comparison by Country (2016-2032)
- Table 114: APAC Drug Discovery Services Market Y-o-Y Growth Rate Comparison by By Process (2016-2032)
- Table 115: APAC Drug Discovery Services Market Y-o-Y Growth Rate Comparison by By Drug Type (2016-2032)
- Table 116: APAC Drug Discovery Services Market Y-o-Y Growth Rate Comparison by By Type (2016-2032)
- Table 117: APAC Drug Discovery Services Market Y-o-Y Growth Rate Comparison by By Therapeutics Area (2016-2032)
- Table 118: APAC Drug Discovery Services Market Y-o-Y Growth Rate Comparison by By End-Users (2016-2032)
- Table 119: APAC Drug Discovery Services Market Share Comparison by Country (2016-2032)
- Table 120: APAC Drug Discovery Services Market Share Comparison by By Process (2016-2032)
- Table 121: APAC Drug Discovery Services Market Share Comparison by By Drug Type (2016-2032)
- Table 122: APAC Drug Discovery Services Market Share Comparison by By Type (2016-2032)
- Table 123: APAC Drug Discovery Services Market Share Comparison by By Therapeutics Area (2016-2032)
- Table 124: APAC Drug Discovery Services Market Share Comparison by By End-Users (2016-2032)
- Table 125: Latin America Drug Discovery Services Market Comparison by By Process (2016-2032)
- Table 126: Latin America Drug Discovery Services Market Comparison by By Drug Type (2016-2032)
- Table 127: Latin America Drug Discovery Services Market Comparison by By Type (2016-2032)
- Table 128: Latin America Drug Discovery Services Market Comparison by By Therapeutics Area (2016-2032)
- Table 129: Latin America Drug Discovery Services Market Comparison by By End-Users (2016-2032)
- Table 130: Latin America Drug Discovery Services Market Revenue (US$ Mn) Comparison by Country (2016-2032)
- Table 131: Latin America Drug Discovery Services Market Revenue (US$ Mn) (2016-2032)
- Table 132: Latin America Drug Discovery Services Market Revenue (US$ Mn) Comparison by Country (2016-2032)
- Table 133: Latin America Drug Discovery Services Market Revenue (US$ Mn) Comparison by By Process (2016-2032)
- Table 134: Latin America Drug Discovery Services Market Revenue (US$ Mn) Comparison by By Drug Type (2016-2032)
- Table 135: Latin America Drug Discovery Services Market Revenue (US$ Mn) Comparison by By Type (2016-2032)
- Table 136: Latin America Drug Discovery Services Market Revenue (US$ Mn) Comparison by By Therapeutics Area (2016-2032)
- Table 137: Latin America Drug Discovery Services Market Revenue (US$ Mn) Comparison by By End-Users (2016-2032)
- Table 138: Latin America Drug Discovery Services Market Y-o-Y Growth Rate Comparison by Country (2016-2032)
- Table 139: Latin America Drug Discovery Services Market Y-o-Y Growth Rate Comparison by By Process (2016-2032)
- Table 140: Latin America Drug Discovery Services Market Y-o-Y Growth Rate Comparison by By Drug Type (2016-2032)
- Table 141: Latin America Drug Discovery Services Market Y-o-Y Growth Rate Comparison by By Type (2016-2032)
- Table 142: Latin America Drug Discovery Services Market Y-o-Y Growth Rate Comparison by By Therapeutics Area (2016-2032)
- Table 143: Latin America Drug Discovery Services Market Y-o-Y Growth Rate Comparison by By End-Users (2016-2032)
- Table 144: Latin America Drug Discovery Services Market Share Comparison by Country (2016-2032)
- Table 145: Latin America Drug Discovery Services Market Share Comparison by By Process (2016-2032)
- Table 146: Latin America Drug Discovery Services Market Share Comparison by By Drug Type (2016-2032)
- Table 147: Latin America Drug Discovery Services Market Share Comparison by By Type (2016-2032)
- Table 148: Latin America Drug Discovery Services Market Share Comparison by By Therapeutics Area (2016-2032)
- Table 149: Latin America Drug Discovery Services Market Share Comparison by By End-Users (2016-2032)
- Table 150: Middle East & Africa Drug Discovery Services Market Comparison by By Process (2016-2032)
- Table 151: Middle East & Africa Drug Discovery Services Market Comparison by By Drug Type (2016-2032)
- Table 152: Middle East & Africa Drug Discovery Services Market Comparison by By Type (2016-2032)
- Table 153: Middle East & Africa Drug Discovery Services Market Comparison by By Therapeutics Area (2016-2032)
- Table 154: Middle East & Africa Drug Discovery Services Market Comparison by By End-Users (2016-2032)
- Table 155: Middle East & Africa Drug Discovery Services Market Revenue (US$ Mn) Comparison by Country (2016-2032)
- Table 156: Middle East & Africa Drug Discovery Services Market Revenue (US$ Mn) (2016-2032)
- Table 157: Middle East & Africa Drug Discovery Services Market Revenue (US$ Mn) Comparison by Country (2016-2032)
- Table 158: Middle East & Africa Drug Discovery Services Market Revenue (US$ Mn) Comparison by By Process (2016-2032)
- Table 159: Middle East & Africa Drug Discovery Services Market Revenue (US$ Mn) Comparison by By Drug Type (2016-2032)
- Table 160: Middle East & Africa Drug Discovery Services Market Revenue (US$ Mn) Comparison by By Type (2016-2032)
- Table 161: Middle East & Africa Drug Discovery Services Market Revenue (US$ Mn) Comparison by By Therapeutics Area (2016-2032)
- Table 162: Middle East & Africa Drug Discovery Services Market Revenue (US$ Mn) Comparison by By End-Users (2016-2032)
- Table 163: Middle East & Africa Drug Discovery Services Market Y-o-Y Growth Rate Comparison by Country (2016-2032)
- Table 164: Middle East & Africa Drug Discovery Services Market Y-o-Y Growth Rate Comparison by By Process (2016-2032)
- Table 165: Middle East & Africa Drug Discovery Services Market Y-o-Y Growth Rate Comparison by By Drug Type (2016-2032)
- Table 166: Middle East & Africa Drug Discovery Services Market Y-o-Y Growth Rate Comparison by By Type (2016-2032)
- Table 167: Middle East & Africa Drug Discovery Services Market Y-o-Y Growth Rate Comparison by By Therapeutics Area (2016-2032)
- Table 168: Middle East & Africa Drug Discovery Services Market Y-o-Y Growth Rate Comparison by By End-Users (2016-2032)
- Table 169: Middle East & Africa Drug Discovery Services Market Share Comparison by Country (2016-2032)
- Table 170: Middle East & Africa Drug Discovery Services Market Share Comparison by By Process (2016-2032)
- Table 171: Middle East & Africa Drug Discovery Services Market Share Comparison by By Drug Type (2016-2032)
- Table 172: Middle East & Africa Drug Discovery Services Market Share Comparison by By Type (2016-2032)
- Table 173: Middle East & Africa Drug Discovery Services Market Share Comparison by By Therapeutics Area (2016-2032)
- Table 174: Middle East & Africa Drug Discovery Services Market Share Comparison by By End-Users (2016-2032)
- 1. Executive Summary
-
- Albany Molecular Research Inc.
- EVOTEC SE
- Laboratory Corporation of America Holdings
- GenScript ProBio
- Pharmaceutical Product Development, LLC
- Charles River Laboratories
- WuXi AppTec
- Merck & Co., Inc.
- Thermo Fisher Scientific Inc.
- Dalton Pharma Services
- Oncodesign Services
- Jubilant Biosys
- DiscoverX Corp.
- QIAGEN
- Eurofins SE
- Syngene International Limited
- Reddy Laboratories Ltd.
- Pharmaron Beijing Co., Ltd.
- TCG Lifesciences Pvt Ltd.
- Domainex Ltd.
- Other Key Players
Our Clients


View Our Licence Options
