Dried Herbs Market By Product Type(Oregano, Rosemary, Other), By Form(Whole Herbs, Powdered Herbs), By Nature(Organic, Conventional), By Drying Method(Air Drying, Vacuum Drying), By End-User(Business to Business(B2B), Business to Customer (B2C)), By Region And Companies - Industry Segment Outlook, Market Assessment, Competition Scenario, Trends, And Forecast 2023-2032
-
10625
-
May 2023
-
175
-


-
This report was compiled by Correspondence Linkedin | Detailed Market research Methodology Our methodology involves a mix of primary research, including interviews with leading mental health experts, and secondary research from reputable medical journals and databases. View Detailed Methodology Page
-
Quick Navigation
Report Overview
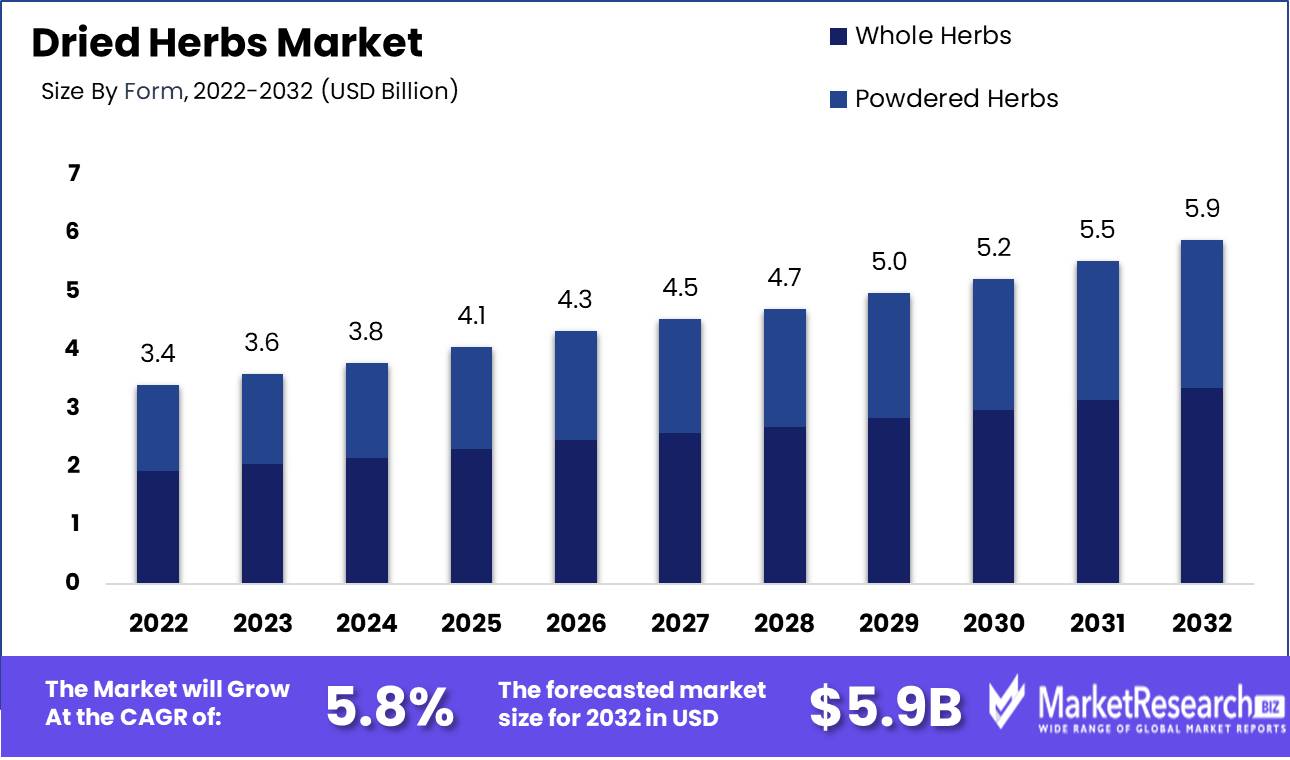
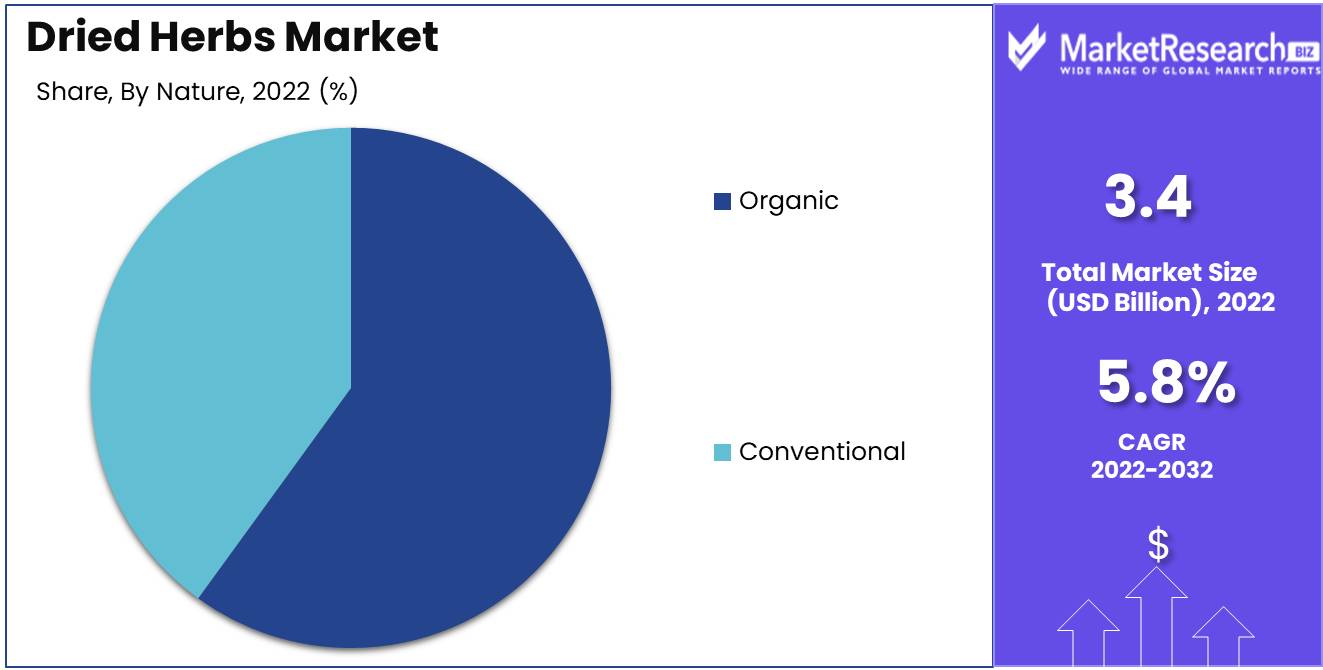
Dried Herbs Market size is expected to be worth around USD 5.9 Bn by 2032 from USD 3.4 Bn in 2022, growing at a CAGR of 5.8% during the forecast period from 2023 to 2032.
The significance of the dried herbs market cannot be overstated. It offers numerous advantages, making it a popular option among a large number of individuals. The first benefit is that dried herbs are widely available in supermarkets, specialty shops, and online marketplaces. They can be stored for longer without losing flavor or nutritional value, unlike raw herbs. This makes dried herbs a cost-effective option, especially for those who lack access to a wide variety of fresh herbs.
Recent years have witnessed notable innovations in the dried herbs market. Manufacturers have devised techniques to maintain the aroma, color, and flavor of dried herbs during the drying process. Additionally, technological advancements in packaging have contributed to the increased shelf life of dried herbs, thereby enhancing their allure to consumers.
Companies have made substantial investments in the dried herbs market, recognizing the industry's potential. Incorporating dried herbs into a variety of products and services has also contributed to its growth. Dried herbs are extensively used in the food industry to enhance flavor in sauces, dressings, soups, and marinades. Additionally, they are a prevalent component in the production of teas, herbal supplements, and natural remedies. Additionally, the beauty and cosmetics industry has incorporated dried herbs into skincare products and fragrances.
Driving factors
Demand for natural and organic food ingredients is growing.
Due to the increased preference for natural and organic food ingredients, the dried herbs market is experiencing a substantial increase in demand. Consumers are increasingly concerned with their health and well-being, and they search for products without artificial additives and preservatives.
A growing awareness of the potential health benefits of natural and organic ingredients is one of the most important factors driving this demand. People are increasingly aware of the harmful effects of synthetic compounds on the human body and are actively seeking alternatives. Dried herbs provide a convenient and accessible way to add natural flavors and fragrances to culinary creations.
The expansion of the culinary and seasonings industries
In recent years, the culinary and food seasoning industries have undertaken a substantial transformation, with an increased emphasis on using high-quality ingredients to enhance flavor profiles. This trend has been capitalized on by the dried herbs market, which now offers a variety of options to chefs, domestic cooks, and food manufacturers.
As the food industry becomes more competitive on a global scale, seasoning and flavoring have emerged as indispensable components for producing distinctive culinary experiences. The demand for dried herbs has skyrocketed in restaurants and ready-to-eat foods because they offer convenience, a long storage life, and consistent flavor profiles.
Technological Advancements in Drying and Preserving
Significant advancements in drying and preservation technologies have benefited the dried herbs market. These developments have enabled the production of dried herbs of superior quality that retain their natural flavors, colors, and nutritional value.
Historically, drying herbs was a time-consuming procedure that frequently led to flavor and potency loss. However, modern drying techniques, such as freeze-drying and air-drying, have transformed the industry, guaranteeing that dried herbs retain their original qualities.
These advancements have not only improved the quality of dried herbs but also increased their accessibility and year-round availability. Now that consumers can enjoy their beloved herbs and spices regardless of the season, the demand for dried herbs has increased.
Restraining Factors
Supply Chain and Procurement Difficulties
The potential supply chain and procurement difficulties are further factors restraining the dried herbs market. It is crucial to establish a dependable and effective supply chain network for dried herbs, as they are frequently sourced from various regions and countries worldwide. Maintaining strong relationships with suppliers and distributors is essential to ensuring timely deliveries and a constant supply of dried herbs. Businesses can surmount obstacles like transportation logistics, weather-related delays, and fluctuating market prices through collaboration and communication throughout the supply chain.
Compliance and Regulatory Requirements
The dried herbs market is no exception, as operating in any industry requires compliance with specific regulations and standards. Compliance with regulatory and compliance requirements is crucial for gaining consumer trust, establishing credibility, and avoiding legal consequences. Businesses operating in the market for dried herbs must ensure compliance with labeling and packaging regulations, appropriate handling and storage guidelines, and food safety requirements.
Product Type Analysis
Bay Leaves dominates the dried herbs market
Bay Leaves, a popular herb with a distinct flavor and aroma, has emerged as the dominant player in the dried herbs market. Numerous health benefits and culinary applications have led to a surge in demand for this versatile herb, which is utilized in a variety of cuisines around the globe. The growing understanding of the medicinal benefits of Bay Leaves has fueled its adoption among consumers and led to its market dominance.
In driving the adoption of Bay Leaves, the economic development of emerging economies has played a significant role. As a result of the accelerated growth and development of these economies, there has been a discernible shift in consumer preferences toward healthier and more natural ingredients. With its robust flavor and medicinal properties, Bay Leaves have emerged as a consumer favorite in these regions. Increasing discretionary income and altering lifestyles have also contributed to the growth of the Bay Leaves market.
Form Analysis
Whole Herbs dominate the dried herbs market
In the domain of dried herbs, whole herbs have emerged as the form that consumers prefer the most. Whole herbs provide a unique sensory experience by preserving the herbs' natural aroma, flavor, and aesthetic appeal. This form allows consumers to utilize the herbs in a variety of ways; they can be immersed in liquids, infused in oils, or used as garnish. The prevalence of whole herbs in the dried herbs market can be attributed to their versatility and culinary potential.
The economic development of emerging economies has had a significant impact on the adoption of whole herbs within the dried herbs market. Consumers are becoming increasingly interested in natural and organic ingredients as these economies experience growth and improvements in living standards. With minimal processing and the retention of essential oils and nutrients, whole herbs flawlessly satisfy this consumer preference. Changing consumer lifestyles and a rise in disposable income have led to a surge in demand for whole herbs.
Nature Analysis
The organic segment dominates the dried herbs market.
The organic segment has emerged as the dominant force in the dried herbs market. Consumers are more concerned than ever about the use of chemicals, pesticides, and genetically modified foods. They seek ingredients that are produced using environmentally responsible and sustainable methods. In recent years, the market share of organic dried herbs has surpassed that of conventional dried herbs, as a result of the organic segment's success in satisfying consumer demands.
The economic growth of emerging economies has played a significant role in driving the adoption of the organic segment of the dried herbs market. In tandem with the growth and expansion of these economies, there has been a rise in consumer awareness and demand for healthier and more sustainable options. Due to their belief that organic products are safer and more nutritious, consumers in emerging economies are willing to pay a premium for them. The growth of the organic segment of the dried herbs market has been fuelled by a rise in disposable income and shifting consumer preferences.
Key Market Segments
By Product Type
- Oregano
- Rosemary
- Sage
- Savoury
- Bay Leaves
- Other
By Form
- Whole Herbs
- Powdered Herbs
By Nature
- Organic
- Conventional
By Drying Method
- Air Drying
- Vacuum Drying
- Microwave Drying
By End-User
- Business to Business(B2B)
- Business to Customer (B2C)
Growth Opportunity
Utilizing Artificial Intelligence and Data Analytics
In the era of digital transformation, the incorporation of artificial intelligence (AI) and data analytics into the dried herbs market has the potential to revolutionize how businesses operate. By harnessing the power of AI, companies can optimize their herb cultivation practices, thereby assuring superior quality and increased yields. Farmers can cultivate premium dried herb varieties with ease thanks to AI-powered algorithms that can analyze a variety of factors including climate conditions, soil quality, and plant genetics.
In addition, data analytics can provide businesses with valuable insights into customer preferences, allowing them to tailor their offerings accordingly. Companies can identify trends and demands by analyzing customer behavior, previous purchases, and feedback, and then tailor their product offerings to effectively meet consumer expectations. This data-driven strategy not only improves customer satisfaction but also enables businesses to remain competitive.
Adopting Current Health and Wellness Trends
The increasing consumer preference for holistic health and wellness presents the dried herbs market with an unexplored growth opportunity. As more people pursue natural remedies for a variety of ailments, dried herbs have enormous potential as alternatives to conventional medicine. Dried herbs can establish a sizable presence in the holistic healthcare industry thanks to their extensive history in culinary and herbal medicinal traditions.
To capitalize on this growth opportunity, businesses can collaborate with healthcare professionals and key opinion leaders to promote the therapeutic properties of dried herbs. Investing in scientific research and clinical trials can also provide the necessary validation and proof of dried herbs' efficacy as natural remedies. Businesses can increase their consumer base and build brand loyalty by embracing health and wellness trends and positioning dried herbs as dependable alternatives to conventional medication.
Diversification into Functional and Nutraceutical Foods
Diversifying product offerings into nutraceuticals and functional foods represents a promising growth opportunity as consumer awareness of the health benefits associated with dried herbs continues to rise. Nutraceuticals, which combine the nutritional benefits of food with pharmaceutical properties, are acquiring market traction due to their potential to address particular health issues.
By incorporating dried herbs into nutraceutical formulations, businesses can develop novel products that target specific health conditions, such as immune support, digestive health, and stress management. In addition, collaboration with food manufacturers can facilitate the development of functional foods enriched with dried herbs that appeal to health-conscious consumers seeking convenient and nutrient-rich options.
Latest Trends
Organic and Sustainably Sourced Dried Herbs Expansion
With an ever-increasing emphasis on health, wellness, and sustainability, consumers seek products that reflect their values. This has led to a substantial increase in demand for organic and sustainably sourced dried herbs. Customers are more concerned than ever before about the origin of their food and its environmental impact during production. As a result, companies are prioritizing organic cultivation and sustainable sourcing methods to satisfy the increasing demand of consumers.
By selecting organic dried herbs, consumers can rest assured that the herbs they ingest are free of synthetic pesticides, herbicides, and other potentially dangerous chemicals. Additionally, sustainably sourced dried herbs support local communities and promote biodiversity, resulting in a more holistic approach to herb production. Incorporating organic and sustainably sourced dried herbs into your business's offerings can attract discerning customers seeking high-quality products that contribute to their health and the health of the planet.
Demand for Blends of Culinary Herbs and Seasonings
Individuals are embracing their inner chef and experimenting with flavors and fragrances in the kitchen, resulting in a surge in the popularity of the culinary arts. Consequently, the demand for culinary herb blends and seasonings that offer convenience, flavor diversity, and a dash of gourmet expertise has increased. These blends of dried herbs and spices have been meticulously selected to complement a variety of dishes and cuisines.
Culinary herb blends offer businesses a unique opportunity to add value to their products and cater to consumers' evolving preferences. By creating novel and flavorful blends, you can attract the interest of both amateur and professional cooks. This trend not only enables individuals to improve their cooking abilities but also opens the door to discovering new and exciting culinary possibilities.
Herbal Tea and Natural Remedies Utilizing Dried Herbs
Herbal infusions and natural remedies have been celebrated for their health benefits for centuries, and this has led to a growing interest in using dried herbs for their therapeutic properties. From calming chamomile to invigorating peppermint, numerous dried herbs contribute to the broad variety of herbal teas available today, which provide comfort and promote overall health.
In addition to teas, dried herbs have been incorporated into a number of natural remedies, including salves, tinctures, and poultices. To support their wellness journeys, consumers are increasingly turning to natural remedies as alternatives to conventional medication. By incorporating dried herbs into your product offerings, you capitalize on the rising demand for natural alternatives and position your business as a reliable provider of herbal wellness products.
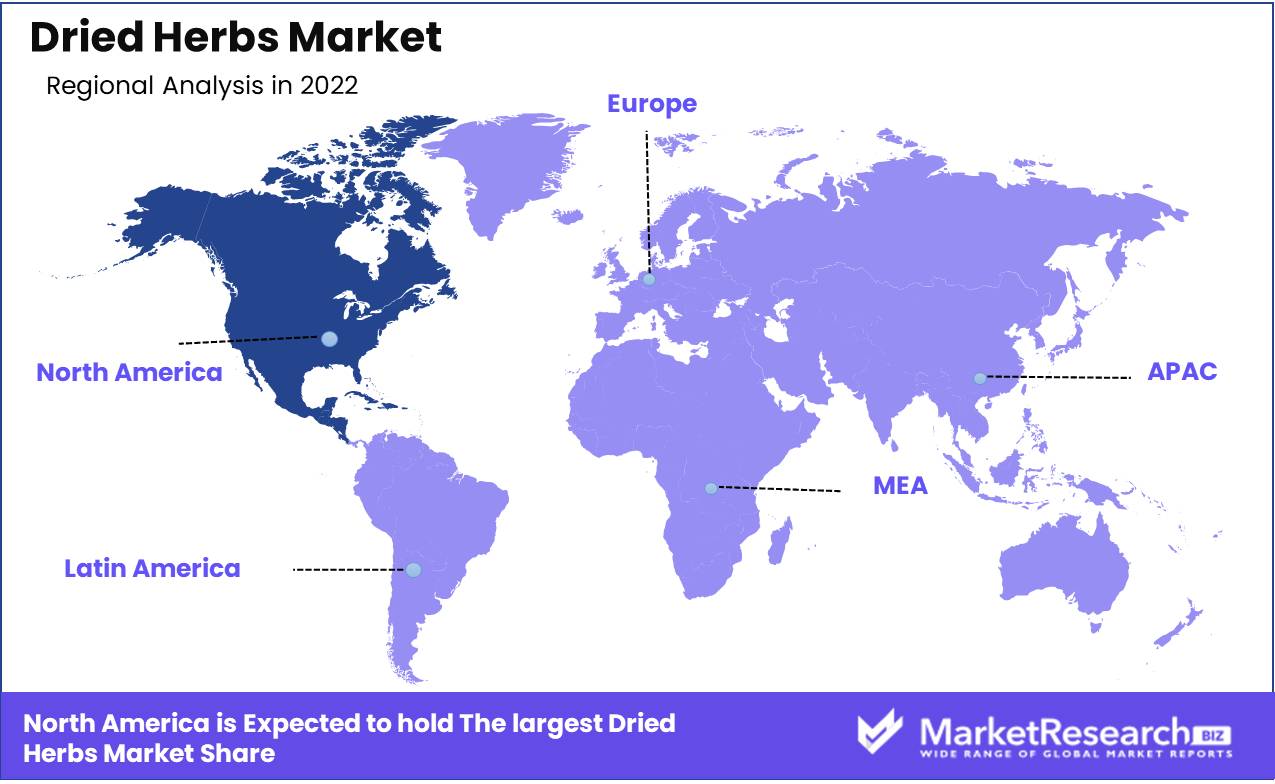
Regional Analysis
Asia-Pacific Region Dominates the Dried Herbs Market.
The culinary and pharmaceutical industries place a lot of emphasis on dried herbs because of their durability and intense flavors. Their versatility in heightening the flavor of a variety of dishes and use in herbal remedies has made them an in-demand commodity. In recent years, demand for these natural wonders has skyrocketed, and the Asia-Pacific region has taken advantage of this increasing interest.
One of the primary factors contributing to Asia-Pacific's dominance in the dried herbs and spices market is the region's extensive collection of indigenous herbs and spices. The region's abundant biodiversity, diverse climatic conditions, and fertile soils provide the ideal conditions for the cultivation of herbs. From aromatic spices like turmeric and cardamom to medicinal herbs like ginseng and ashwagandha, the region is home to a vast array of herbs with varying flavors and health benefits.
Additionally, the long-standing use of herbs in traditional medicine has contributed to the region's expertise in herb cultivation, refining, and knowledge of their medicinal properties. Since ancient times, Asian nations like China, India, and Japan have esteemed the use of herbs to promote general health and prevent disease. This knowledge has been handed down from generation to generation, resulting in a knowledgeable workforce that understands the nuances of herbal practices.
In addition to its abundant resources and traditional knowledge, the Asia-Pacific region has experienced economic expansion and a rise in per capita income. As consumers seek healthier lifestyles and natural remedies, the demand for organic and herbal products has increased. This shift in consumer preferences has resulted in the market for dried herbs experiencing unprecedented growth.
Key Regions and Countries
North America
- US
- Canada
- Mexico
Western Europe
- Germany
- France
- The UK
- Spain
- Italy
- Portugal
- Ireland
- Austria
- Switzerland
- Benelux
- Nordic
- Rest of Western Europe
Eastern Europe
- Russia
- Poland
- The Czech Republic
- Greece
- Rest of Eastern Europe
APAC
- China
- Japan
- South Korea
- India
- Australia & New Zealand
- Indonesia
- Malaysia
- Philippines
- Singapore
- Thailand
- Vietnam
- Rest of APAC
Latin America
- Brazil
- Colombia
- Chile
- Argentina
- Costa Rica
- Rest of Latin America
Middle East & Africa
- Algeria
- Egypt
- Israel
- Kuwait
- Nigeria
- Saudi Arabia
- South Africa
- Turkey
- United Arab Emirates
- Rest of MEA
Key Players Analysis
McCormick & Company, Inc. has established a solid reputation for delivering high-quality dried herbs and seasonings. With a diverse product line that caters to a variety of cuisines and dietary preferences, they have established themselves as a go-to provider for consumers around the globe.
German-based Dohler has been at the vanguard of innovation in the dried herbs industry. They specialize in the development of natural ingredients and flavors, offering unique and superior products to meet the market's fluctuating demands. Dohler's commitment to sustainability and environmentally favorable practices increases its appeal to environmentally conscious consumers.
Pacific Botanicals, a company based in the United States, is a market leader in organic dried herbs. They ensure that their products meet the highest standards by emphasizing sustainable agricultural practices and quality control. The company's commitment to organic cultivation not only benefits consumers but also promotes environmental health.
MOUNTAIN ROSE HERBS, a renowned company based in the United States, is committed to providing the highest quality organic dried herbs and seasonings. With a dedication to fair trade practices and ethical sourcing, they maintain strong relationships with producers and suppliers worldwide. Their extensive selection of products accommodates both culinary enthusiasts and those interested in holistic health.
Top Key Players in the Dried Herbs Market
- McCormick & Company Inc. (US)
- Döhler (Germany)
- Pacific Botanicals (US)
- MOUNTAIN ROSE HERBS (US)
- Van Drunen Farms (South Africa)
- British Pepper & Spice Co Ltd (UK)
- Synthite Industries Ltd. (India)
- I.T.S (UK)
- Cherry Valley Organics (US)
- Catz International (Netherlands)
- The Spice House (Netherlands)
- Vardhaman Exotic Herbs & Spices (India)
- Euroma (Netherlands)
- Sorich Organics (India)
- Holyland Marketing Private Limited (India)
- Hamps Bio Private Limited (India)
Recent Development
- In 2023, Frontier Natural Products announced its intention to launch an innovative line of dried herbs created with sustainability in mind. With an emphasis on ethical sourcing and packaging, the company aims to meet the market's demand for eco-friendly alternatives.
- In 2022, Mountain Rose Herbs recognize the growing demand for organic products and have thrilling news for herb enthusiasts. The company has recently announced the expansion of its portfolio of dried herbs, with an emphasis on offering a wider selection of organic herbs.
- In 2021, The Republic of Tea adopted a customer-centric approach and announced plans to launch a new line of reasonably priced dried herbs. This is in response to the demand for reasonably priced, high-quality dried herbs.
Report Scope
Report Features Description Market Value (2022) USD 3.4 Bn Forecast Revenue (2032) USD 6.0 Bn CAGR (2023-2032) 5.8% Base Year for Estimation 2022 Historic Period 2016-2022 Forecast Period 2023-2032 Report Coverage Revenue Forecast, Market Dynamics, COVID-19 Impact, Competitive Landscape, Recent Developments Segments Covered By Product Type(Oregano, Rosemary, Other), By Form(Whole Herbs, Powdered Herbs), By Nature(Organic, Conventional), By Drying Method(Air Drying, Vacuum Drying), By End-User(Business to Business(B2B), Business to Customer (B2C)) Regional Analysis North America – The US, Canada, & Mexico; Western Europe – Germany, France, The UK, Spain, Italy, Portugal, Ireland, Austria, Switzerland, Benelux, Nordic, & Rest of Western Europe; Eastern Europe – Russia, Poland, The Czech Republic, Greece, & Rest of Eastern Europe; APAC – China, Japan, South Korea, India, Australia & New Zealand, Indonesia, Malaysia, Philippines, Singapore, Thailand, Vietnam, & Rest of APAC; Latin America – Brazil, Colombia, Chile, Argentina, Costa Rica, & Rest of Latin America; Middle East & Africa – Algeria, Egypt, Israel, Kuwait, Nigeria, Saudi Arabia, South Africa, Turkey, United Arab Emirates, & Rest of MEA Competitive Landscape McCormick & Company Inc. (US), Döhler (Germany), Pacific Botanicals (US), MOUNTAIN ROSE HERBS (US), Van Drunen Farms (South Africa), British Pepper & Spice Co Ltd (UK), Synthite Industries Ltd. (India), I.T.S (UK), Cherry Valley Organics (US), Catz International (Netherlands), The Spice House (Netherlands), Vardhaman Exotic Herbs & Spices (India), Euroma (Netherlands), Sorich Organics (India), Holyland Marketing Private Limited (India), Hamps Bio Private Limited (India) Customization Scope Customization for segments, region/country-level will be provided. Moreover, additional customization can be done based on the requirements. Purchase Options We have three licenses to opt for: Single User License, Multi-User License (Up to 5 Users), Corporate Use License (Unlimited User and Printable PDF) -
- 1. Executive Summary
- 1.1. Definition
- 1.2. Taxonomy
- 1.3. Research Scope
- 1.4. Key Analysis
- 1.5. Key Findings by Major Segments
- 1.6. Top strategies by Major Players
- 2. Global Dried Herbs Market Overview
- 2.1. Dried Herbs Market Dynamics
- 2.1.1. Drivers
- 2.1.2. Opportunities
- 2.1.3. Restraints
- 2.1.4. Challenges
- 2.2. Macro-economic Factors
- 2.3. Regulatory Framework
- 2.4. Market Investment Feasibility Index
- 2.5. PEST Analysis
- 2.6. PORTER’S Five Force Analysis
- 2.7. Drivers & Restraints Impact Analysis
- 2.8. Industry Chain Analysis
- 2.9. Cost Structure Analysis
- 2.10. Marketing Strategy
- 2.11. Russia-Ukraine War Impact Analysis
- 2.12. Opportunity Map Analysis
- 2.13. Market Competition Scenario Analysis
- 2.14. Product Life Cycle Analysis
- 2.15. Opportunity Orbits
- 2.16. Manufacturer Intensity Map
- 2.17. Major Companies sales by Value & Volume
- 2.1. Dried Herbs Market Dynamics
- 3. Global Dried Herbs Market Analysis, Opportunity and Forecast, 2016-2032
- 3.1. Global Dried Herbs Market Analysis, 2016-2021
- 3.2. Global Dried Herbs Market Opportunity and Forecast, 2023-2032
- 3.3. Global Dried Herbs Market Analysis, Opportunity and Forecast, By By Product Type, 2016-2032
- 3.3.1. Global Dried Herbs Market Analysis by By Product Type: Introduction
- 3.3.2. Market Size Absolute $ Opportunity Analysis and Forecast, By By Product Type, 2016-2032
- 3.3.3. Oregano
- 3.3.4. Rosemary
- 3.3.5. Sage
- 3.3.6. Savoury
- 3.3.7. Bay Leaves
- 3.3.8. Other
- 3.4. Global Dried Herbs Market Analysis, Opportunity and Forecast, By By Form , 2016-2032
- 3.4.1. Global Dried Herbs Market Analysis by By Form : Introduction
- 3.4.2. Market Size Absolute $ Opportunity Analysis and Forecast, By By Form , 2016-2032
- 3.4.3. Whole Herbs
- 3.4.4. Powdered Herbs
- 3.5. Global Dried Herbs Market Analysis, Opportunity and Forecast, By By Nature, 2016-2032
- 3.5.1. Global Dried Herbs Market Analysis by By Nature: Introduction
- 3.5.2. Market Size Absolute $ Opportunity Analysis and Forecast, By By Nature, 2016-2032
- 3.5.3. Organic
- 3.5.4. Conventional
- 3.6. Global Dried Herbs Market Analysis, Opportunity and Forecast, By By Drying Method, 2016-2032
- 3.6.1. Global Dried Herbs Market Analysis by By Drying Method: Introduction
- 3.6.2. Market Size Absolute $ Opportunity Analysis and Forecast, By By Drying Method, 2016-2032
- 3.6.3. Air Drying
- 3.6.4. Vacuum Drying
- 3.6.5. Microwave Drying
- 3.7. Global Dried Herbs Market Analysis, Opportunity and Forecast, By By End-User, 2016-2032
- 3.7.1. Global Dried Herbs Market Analysis by By End-User: Introduction
- 3.7.2. Market Size Absolute $ Opportunity Analysis and Forecast, By By End-User, 2016-2032
- 3.7.3. Business to Business(B2B)
- 3.7.4. Business to Customer (B2C)
- 4. North America Dried Herbs Market Analysis, Opportunity and Forecast, 2016-2032
- 4.1. North America Dried Herbs Market Analysis, 2016-2021
- 4.2. North America Dried Herbs Market Opportunity and Forecast, 2023-2032
- 4.3. North America Dried Herbs Market Analysis, Opportunity and Forecast, By By Product Type, 2016-2032
- 4.3.1. North America Dried Herbs Market Analysis by By Product Type: Introduction
- 4.3.2. Market Size Absolute $ Opportunity Analysis and Forecast, By By Product Type, 2016-2032
- 4.3.3. Oregano
- 4.3.4. Rosemary
- 4.3.5. Sage
- 4.3.6. Savoury
- 4.3.7. Bay Leaves
- 4.3.8. Other
- 4.4. North America Dried Herbs Market Analysis, Opportunity and Forecast, By By Form , 2016-2032
- 4.4.1. North America Dried Herbs Market Analysis by By Form : Introduction
- 4.4.2. Market Size Absolute $ Opportunity Analysis and Forecast, By By Form , 2016-2032
- 4.4.3. Whole Herbs
- 4.4.4. Powdered Herbs
- 4.5. North America Dried Herbs Market Analysis, Opportunity and Forecast, By By Nature, 2016-2032
- 4.5.1. North America Dried Herbs Market Analysis by By Nature: Introduction
- 4.5.2. Market Size Absolute $ Opportunity Analysis and Forecast, By By Nature, 2016-2032
- 4.5.3. Organic
- 4.5.4. Conventional
- 4.6. North America Dried Herbs Market Analysis, Opportunity and Forecast, By By Drying Method, 2016-2032
- 4.6.1. North America Dried Herbs Market Analysis by By Drying Method: Introduction
- 4.6.2. Market Size Absolute $ Opportunity Analysis and Forecast, By By Drying Method, 2016-2032
- 4.6.3. Air Drying
- 4.6.4. Vacuum Drying
- 4.6.5. Microwave Drying
- 4.7. North America Dried Herbs Market Analysis, Opportunity and Forecast, By By End-User, 2016-2032
- 4.7.1. North America Dried Herbs Market Analysis by By End-User: Introduction
- 4.7.2. Market Size Absolute $ Opportunity Analysis and Forecast, By By End-User, 2016-2032
- 4.7.3. Business to Business(B2B)
- 4.7.4. Business to Customer (B2C)
- 4.8. North America Dried Herbs Market Analysis, Opportunity and Forecast, By Country , 2016-2032
- 4.8.1. North America Dried Herbs Market Analysis by Country : Introduction
- 4.8.2. Market Size Absolute $ Opportunity Analysis and Forecast, Country , 2016-2032
- 4.8.2.1. The US
- 4.8.2.2. Canada
- 4.8.2.3. Mexico
- 5. Western Europe Dried Herbs Market Analysis, Opportunity and Forecast, 2016-2032
- 5.1. Western Europe Dried Herbs Market Analysis, 2016-2021
- 5.2. Western Europe Dried Herbs Market Opportunity and Forecast, 2023-2032
- 5.3. Western Europe Dried Herbs Market Analysis, Opportunity and Forecast, By By Product Type, 2016-2032
- 5.3.1. Western Europe Dried Herbs Market Analysis by By Product Type: Introduction
- 5.3.2. Market Size Absolute $ Opportunity Analysis and Forecast, By By Product Type, 2016-2032
- 5.3.3. Oregano
- 5.3.4. Rosemary
- 5.3.5. Sage
- 5.3.6. Savoury
- 5.3.7. Bay Leaves
- 5.3.8. Other
- 5.4. Western Europe Dried Herbs Market Analysis, Opportunity and Forecast, By By Form , 2016-2032
- 5.4.1. Western Europe Dried Herbs Market Analysis by By Form : Introduction
- 5.4.2. Market Size Absolute $ Opportunity Analysis and Forecast, By By Form , 2016-2032
- 5.4.3. Whole Herbs
- 5.4.4. Powdered Herbs
- 5.5. Western Europe Dried Herbs Market Analysis, Opportunity and Forecast, By By Nature, 2016-2032
- 5.5.1. Western Europe Dried Herbs Market Analysis by By Nature: Introduction
- 5.5.2. Market Size Absolute $ Opportunity Analysis and Forecast, By By Nature, 2016-2032
- 5.5.3. Organic
- 5.5.4. Conventional
- 5.6. Western Europe Dried Herbs Market Analysis, Opportunity and Forecast, By By Drying Method, 2016-2032
- 5.6.1. Western Europe Dried Herbs Market Analysis by By Drying Method: Introduction
- 5.6.2. Market Size Absolute $ Opportunity Analysis and Forecast, By By Drying Method, 2016-2032
- 5.6.3. Air Drying
- 5.6.4. Vacuum Drying
- 5.6.5. Microwave Drying
- 5.7. Western Europe Dried Herbs Market Analysis, Opportunity and Forecast, By By End-User, 2016-2032
- 5.7.1. Western Europe Dried Herbs Market Analysis by By End-User: Introduction
- 5.7.2. Market Size Absolute $ Opportunity Analysis and Forecast, By By End-User, 2016-2032
- 5.7.3. Business to Business(B2B)
- 5.7.4. Business to Customer (B2C)
- 5.8. Western Europe Dried Herbs Market Analysis, Opportunity and Forecast, By Country , 2016-2032
- 5.8.1. Western Europe Dried Herbs Market Analysis by Country : Introduction
- 5.8.2. Market Size Absolute $ Opportunity Analysis and Forecast, Country , 2016-2032
- 5.8.2.1. Germany
- 5.8.2.2. France
- 5.8.2.3. The UK
- 5.8.2.4. Spain
- 5.8.2.5. Italy
- 5.8.2.6. Portugal
- 5.8.2.7. Ireland
- 5.8.2.8. Austria
- 5.8.2.9. Switzerland
- 5.8.2.10. Benelux
- 5.8.2.11. Nordic
- 5.8.2.12. Rest of Western Europe
- 6. Eastern Europe Dried Herbs Market Analysis, Opportunity and Forecast, 2016-2032
- 6.1. Eastern Europe Dried Herbs Market Analysis, 2016-2021
- 6.2. Eastern Europe Dried Herbs Market Opportunity and Forecast, 2023-2032
- 6.3. Eastern Europe Dried Herbs Market Analysis, Opportunity and Forecast, By By Product Type, 2016-2032
- 6.3.1. Eastern Europe Dried Herbs Market Analysis by By Product Type: Introduction
- 6.3.2. Market Size Absolute $ Opportunity Analysis and Forecast, By By Product Type, 2016-2032
- 6.3.3. Oregano
- 6.3.4. Rosemary
- 6.3.5. Sage
- 6.3.6. Savoury
- 6.3.7. Bay Leaves
- 6.3.8. Other
- 6.4. Eastern Europe Dried Herbs Market Analysis, Opportunity and Forecast, By By Form , 2016-2032
- 6.4.1. Eastern Europe Dried Herbs Market Analysis by By Form : Introduction
- 6.4.2. Market Size Absolute $ Opportunity Analysis and Forecast, By By Form , 2016-2032
- 6.4.3. Whole Herbs
- 6.4.4. Powdered Herbs
- 6.5. Eastern Europe Dried Herbs Market Analysis, Opportunity and Forecast, By By Nature, 2016-2032
- 6.5.1. Eastern Europe Dried Herbs Market Analysis by By Nature: Introduction
- 6.5.2. Market Size Absolute $ Opportunity Analysis and Forecast, By By Nature, 2016-2032
- 6.5.3. Organic
- 6.5.4. Conventional
- 6.6. Eastern Europe Dried Herbs Market Analysis, Opportunity and Forecast, By By Drying Method, 2016-2032
- 6.6.1. Eastern Europe Dried Herbs Market Analysis by By Drying Method: Introduction
- 6.6.2. Market Size Absolute $ Opportunity Analysis and Forecast, By By Drying Method, 2016-2032
- 6.6.3. Air Drying
- 6.6.4. Vacuum Drying
- 6.6.5. Microwave Drying
- 6.7. Eastern Europe Dried Herbs Market Analysis, Opportunity and Forecast, By By End-User, 2016-2032
- 6.7.1. Eastern Europe Dried Herbs Market Analysis by By End-User: Introduction
- 6.7.2. Market Size Absolute $ Opportunity Analysis and Forecast, By By End-User, 2016-2032
- 6.7.3. Business to Business(B2B)
- 6.7.4. Business to Customer (B2C)
- 6.8. Eastern Europe Dried Herbs Market Analysis, Opportunity and Forecast, By Country , 2016-2032
- 6.8.1. Eastern Europe Dried Herbs Market Analysis by Country : Introduction
- 6.8.2. Market Size Absolute $ Opportunity Analysis and Forecast, Country , 2016-2032
- 6.8.2.1. Russia
- 6.8.2.2. Poland
- 6.8.2.3. The Czech Republic
- 6.8.2.4. Greece
- 6.8.2.5. Rest of Eastern Europe
- 7. APAC Dried Herbs Market Analysis, Opportunity and Forecast, 2016-2032
- 7.1. APAC Dried Herbs Market Analysis, 2016-2021
- 7.2. APAC Dried Herbs Market Opportunity and Forecast, 2023-2032
- 7.3. APAC Dried Herbs Market Analysis, Opportunity and Forecast, By By Product Type, 2016-2032
- 7.3.1. APAC Dried Herbs Market Analysis by By Product Type: Introduction
- 7.3.2. Market Size Absolute $ Opportunity Analysis and Forecast, By By Product Type, 2016-2032
- 7.3.3. Oregano
- 7.3.4. Rosemary
- 7.3.5. Sage
- 7.3.6. Savoury
- 7.3.7. Bay Leaves
- 7.3.8. Other
- 7.4. APAC Dried Herbs Market Analysis, Opportunity and Forecast, By By Form , 2016-2032
- 7.4.1. APAC Dried Herbs Market Analysis by By Form : Introduction
- 7.4.2. Market Size Absolute $ Opportunity Analysis and Forecast, By By Form , 2016-2032
- 7.4.3. Whole Herbs
- 7.4.4. Powdered Herbs
- 7.5. APAC Dried Herbs Market Analysis, Opportunity and Forecast, By By Nature, 2016-2032
- 7.5.1. APAC Dried Herbs Market Analysis by By Nature: Introduction
- 7.5.2. Market Size Absolute $ Opportunity Analysis and Forecast, By By Nature, 2016-2032
- 7.5.3. Organic
- 7.5.4. Conventional
- 7.6. APAC Dried Herbs Market Analysis, Opportunity and Forecast, By By Drying Method, 2016-2032
- 7.6.1. APAC Dried Herbs Market Analysis by By Drying Method: Introduction
- 7.6.2. Market Size Absolute $ Opportunity Analysis and Forecast, By By Drying Method, 2016-2032
- 7.6.3. Air Drying
- 7.6.4. Vacuum Drying
- 7.6.5. Microwave Drying
- 7.7. APAC Dried Herbs Market Analysis, Opportunity and Forecast, By By End-User, 2016-2032
- 7.7.1. APAC Dried Herbs Market Analysis by By End-User: Introduction
- 7.7.2. Market Size Absolute $ Opportunity Analysis and Forecast, By By End-User, 2016-2032
- 7.7.3. Business to Business(B2B)
- 7.7.4. Business to Customer (B2C)
- 7.8. APAC Dried Herbs Market Analysis, Opportunity and Forecast, By Country , 2016-2032
- 7.8.1. APAC Dried Herbs Market Analysis by Country : Introduction
- 7.8.2. Market Size Absolute $ Opportunity Analysis and Forecast, Country , 2016-2032
- 7.8.2.1. China
- 7.8.2.2. Japan
- 7.8.2.3. South Korea
- 7.8.2.4. India
- 7.8.2.5. Australia & New Zeland
- 7.8.2.6. Indonesia
- 7.8.2.7. Malaysia
- 7.8.2.8. Philippines
- 7.8.2.9. Singapore
- 7.8.2.10. Thailand
- 7.8.2.11. Vietnam
- 7.8.2.12. Rest of APAC
- 8. Latin America Dried Herbs Market Analysis, Opportunity and Forecast, 2016-2032
- 8.1. Latin America Dried Herbs Market Analysis, 2016-2021
- 8.2. Latin America Dried Herbs Market Opportunity and Forecast, 2023-2032
- 8.3. Latin America Dried Herbs Market Analysis, Opportunity and Forecast, By By Product Type, 2016-2032
- 8.3.1. Latin America Dried Herbs Market Analysis by By Product Type: Introduction
- 8.3.2. Market Size Absolute $ Opportunity Analysis and Forecast, By By Product Type, 2016-2032
- 8.3.3. Oregano
- 8.3.4. Rosemary
- 8.3.5. Sage
- 8.3.6. Savoury
- 8.3.7. Bay Leaves
- 8.3.8. Other
- 8.4. Latin America Dried Herbs Market Analysis, Opportunity and Forecast, By By Form , 2016-2032
- 8.4.1. Latin America Dried Herbs Market Analysis by By Form : Introduction
- 8.4.2. Market Size Absolute $ Opportunity Analysis and Forecast, By By Form , 2016-2032
- 8.4.3. Whole Herbs
- 8.4.4. Powdered Herbs
- 8.5. Latin America Dried Herbs Market Analysis, Opportunity and Forecast, By By Nature, 2016-2032
- 8.5.1. Latin America Dried Herbs Market Analysis by By Nature: Introduction
- 8.5.2. Market Size Absolute $ Opportunity Analysis and Forecast, By By Nature, 2016-2032
- 8.5.3. Organic
- 8.5.4. Conventional
- 8.6. Latin America Dried Herbs Market Analysis, Opportunity and Forecast, By By Drying Method, 2016-2032
- 8.6.1. Latin America Dried Herbs Market Analysis by By Drying Method: Introduction
- 8.6.2. Market Size Absolute $ Opportunity Analysis and Forecast, By By Drying Method, 2016-2032
- 8.6.3. Air Drying
- 8.6.4. Vacuum Drying
- 8.6.5. Microwave Drying
- 8.7. Latin America Dried Herbs Market Analysis, Opportunity and Forecast, By By End-User, 2016-2032
- 8.7.1. Latin America Dried Herbs Market Analysis by By End-User: Introduction
- 8.7.2. Market Size Absolute $ Opportunity Analysis and Forecast, By By End-User, 2016-2032
- 8.7.3. Business to Business(B2B)
- 8.7.4. Business to Customer (B2C)
- 8.8. Latin America Dried Herbs Market Analysis, Opportunity and Forecast, By Country , 2016-2032
- 8.8.1. Latin America Dried Herbs Market Analysis by Country : Introduction
- 8.8.2. Market Size Absolute $ Opportunity Analysis and Forecast, Country , 2016-2032
- 8.8.2.1. Brazil
- 8.8.2.2. Colombia
- 8.8.2.3. Chile
- 8.8.2.4. Argentina
- 8.8.2.5. Costa Rica
- 8.8.2.6. Rest of Latin America
- 9. Middle East & Africa Dried Herbs Market Analysis, Opportunity and Forecast, 2016-2032
- 9.1. Middle East & Africa Dried Herbs Market Analysis, 2016-2021
- 9.2. Middle East & Africa Dried Herbs Market Opportunity and Forecast, 2023-2032
- 9.3. Middle East & Africa Dried Herbs Market Analysis, Opportunity and Forecast, By By Product Type, 2016-2032
- 9.3.1. Middle East & Africa Dried Herbs Market Analysis by By Product Type: Introduction
- 9.3.2. Market Size Absolute $ Opportunity Analysis and Forecast, By By Product Type, 2016-2032
- 9.3.3. Oregano
- 9.3.4. Rosemary
- 9.3.5. Sage
- 9.3.6. Savoury
- 9.3.7. Bay Leaves
- 9.3.8. Other
- 9.4. Middle East & Africa Dried Herbs Market Analysis, Opportunity and Forecast, By By Form , 2016-2032
- 9.4.1. Middle East & Africa Dried Herbs Market Analysis by By Form : Introduction
- 9.4.2. Market Size Absolute $ Opportunity Analysis and Forecast, By By Form , 2016-2032
- 9.4.3. Whole Herbs
- 9.4.4. Powdered Herbs
- 9.5. Middle East & Africa Dried Herbs Market Analysis, Opportunity and Forecast, By By Nature, 2016-2032
- 9.5.1. Middle East & Africa Dried Herbs Market Analysis by By Nature: Introduction
- 9.5.2. Market Size Absolute $ Opportunity Analysis and Forecast, By By Nature, 2016-2032
- 9.5.3. Organic
- 9.5.4. Conventional
- 9.6. Middle East & Africa Dried Herbs Market Analysis, Opportunity and Forecast, By By Drying Method, 2016-2032
- 9.6.1. Middle East & Africa Dried Herbs Market Analysis by By Drying Method: Introduction
- 9.6.2. Market Size Absolute $ Opportunity Analysis and Forecast, By By Drying Method, 2016-2032
- 9.6.3. Air Drying
- 9.6.4. Vacuum Drying
- 9.6.5. Microwave Drying
- 9.7. Middle East & Africa Dried Herbs Market Analysis, Opportunity and Forecast, By By End-User, 2016-2032
- 9.7.1. Middle East & Africa Dried Herbs Market Analysis by By End-User: Introduction
- 9.7.2. Market Size Absolute $ Opportunity Analysis and Forecast, By By End-User, 2016-2032
- 9.7.3. Business to Business(B2B)
- 9.7.4. Business to Customer (B2C)
- 9.8. Middle East & Africa Dried Herbs Market Analysis, Opportunity and Forecast, By Country , 2016-2032
- 9.8.1. Middle East & Africa Dried Herbs Market Analysis by Country : Introduction
- 9.8.2. Market Size Absolute $ Opportunity Analysis and Forecast, Country , 2016-2032
- 9.8.2.1. Algeria
- 9.8.2.2. Egypt
- 9.8.2.3. Israel
- 9.8.2.4. Kuwait
- 9.8.2.5. Nigeria
- 9.8.2.6. Saudi Arabia
- 9.8.2.7. South Africa
- 9.8.2.8. Turkey
- 9.8.2.9. The UAE
- 9.8.2.10. Rest of MEA
- 10. Global Dried Herbs Market Analysis, Opportunity and Forecast, By Region , 2016-2032
- 10.1. Global Dried Herbs Market Analysis by Region : Introduction
- 10.2. Market Size Absolute $ Opportunity Analysis and Forecast, By Region , 2016-2032
- 10.2.1. North America
- 10.2.2. Western Europe
- 10.2.3. Eastern Europe
- 10.2.4. APAC
- 10.2.5. Latin America
- 10.2.6. Middle East & Africa
- 11. Global Dried Herbs Market Competitive Landscape, Market Share Analysis, and Company Profiles
- 11.1. Market Share Analysis
- 11.2. Company Profiles
- 11.3. McCormick & Company Inc. (US)
- 11.3.1. Company Overview
- 11.3.2. Financial Highlights
- 11.3.3. Product Portfolio
- 11.3.4. SWOT Analysis
- 11.3.5. Key Strategies and Developments
- 11.4. Döhler (Germany)
- 11.4.1. Company Overview
- 11.4.2. Financial Highlights
- 11.4.3. Product Portfolio
- 11.4.4. SWOT Analysis
- 11.4.5. Key Strategies and Developments
- 11.5. Pacific Botanicals (US)
- 11.5.1. Company Overview
- 11.5.2. Financial Highlights
- 11.5.3. Product Portfolio
- 11.5.4. SWOT Analysis
- 11.5.5. Key Strategies and Developments
- 11.6. MOUNTAIN ROSE HERBS (US)
- 11.6.1. Company Overview
- 11.6.2. Financial Highlights
- 11.6.3. Product Portfolio
- 11.6.4. SWOT Analysis
- 11.6.5. Key Strategies and Developments
- 11.7. Van Drunen Farms (South Africa)
- 11.7.1. Company Overview
- 11.7.2. Financial Highlights
- 11.7.3. Product Portfolio
- 11.7.4. SWOT Analysis
- 11.7.5. Key Strategies and Developments
- 11.8. British Pepper & Spice Co Ltd (UK)
- 11.8.1. Company Overview
- 11.8.2. Financial Highlights
- 11.8.3. Product Portfolio
- 11.8.4. SWOT Analysis
- 11.8.5. Key Strategies and Developments
- 11.9. Synthite Industries Ltd. (India)
- 11.9.1. Company Overview
- 11.9.2. Financial Highlights
- 11.9.3. Product Portfolio
- 11.9.4. SWOT Analysis
- 11.9.5. Key Strategies and Developments
- 11.10. I.T.S (UK)
- 11.10.1. Company Overview
- 11.10.2. Financial Highlights
- 11.10.3. Product Portfolio
- 11.10.4. SWOT Analysis
- 11.10.5. Key Strategies and Developments
- 11.11. Cherry Valley Organics (US)
- 11.11.1. Company Overview
- 11.11.2. Financial Highlights
- 11.11.3. Product Portfolio
- 11.11.4. SWOT Analysis
- 11.11.5. Key Strategies and Developments
- 11.12. Catz International (Netherlands)
- 11.12.1. Company Overview
- 11.12.2. Financial Highlights
- 11.12.3. Product Portfolio
- 11.12.4. SWOT Analysis
- 11.12.5. Key Strategies and Developments
- 11.13. The Spice House (Netherlands)
- 11.13.1. Company Overview
- 11.13.2. Financial Highlights
- 11.13.3. Product Portfolio
- 11.13.4. SWOT Analysis
- 11.13.5. Key Strategies and Developments
- 11.14. Vardhaman Exotic Herbs & Spices (India)
- 11.14.1. Company Overview
- 11.14.2. Financial Highlights
- 11.14.3. Product Portfolio
- 11.14.4. SWOT Analysis
- 11.14.5. Key Strategies and Developments
- 11.15. Euroma (Netherlands)
- 11.15.1. Company Overview
- 11.15.2. Financial Highlights
- 11.15.3. Product Portfolio
- 11.15.4. SWOT Analysis
- 11.15.5. Key Strategies and Developments
- 11.16. Sorich Organics (India)
- 11.16.1. Company Overview
- 11.16.2. Financial Highlights
- 11.16.3. Product Portfolio
- 11.16.4. SWOT Analysis
- 11.16.5. Key Strategies and Developments
- 11.17. Holyland Marketing Private Limited (India)
- 11.17.1. Company Overview
- 11.17.2. Financial Highlights
- 11.17.3. Product Portfolio
- 11.17.4. SWOT Analysis
- 11.17.5. Key Strategies and Developments
- 11.18. Hamps Bio Private Limited (India)
- 11.18.1. Company Overview
- 11.18.2. Financial Highlights
- 11.18.3. Product Portfolio
- 11.18.4. SWOT Analysis
- 11.18.5. Key Strategies and Developments
- 12. Assumptions and Acronyms
- 13. Research Methodology
- 14. Contact
- List of Figures
- Figure 1: Global Dried Herbs Market Revenue (US$ Mn) Market Share by Product Type in 2022
- Figure 2: Global Dried Herbs Market Attractiveness Analysis by Product Type, 2016-2032
- Figure 3: Global Dried Herbs Market Revenue (US$ Mn) Market Share by Form in 2022
- Figure 4: Global Dried Herbs Market Attractiveness Analysis by Form , 2016-2032
- Figure 5: Global Dried Herbs Market Revenue (US$ Mn) Market Share by Naturein 2022
- Figure 6: Global Dried Herbs Market Attractiveness Analysis by Nature, 2016-2032
- Figure 7: Global Dried Herbs Market Revenue (US$ Mn) Market Share by Drying Methodin 2022
- Figure 8: Global Dried Herbs Market Attractiveness Analysis by Drying Method, 2016-2032
- Figure 9: Global Dried Herbs Market Revenue (US$ Mn) Market Share by End-Userin 2022
- Figure 10: Global Dried Herbs Market Attractiveness Analysis by End-User, 2016-2032
- Figure 11: Global Dried Herbs Market Revenue (US$ Mn) Market Share by Region in 2022
- Figure 12: Global Dried Herbs Market Attractiveness Analysis by Region, 2016-2032
- Figure 13: Global Dried Herbs Market Revenue (US$ Mn) (2016-2032)
- Figure 14: Global Dried Herbs Market Revenue (US$ Mn) Comparison by Region (2016-2032)
- Figure 15: Global Dried Herbs Market Revenue (US$ Mn) Comparison by Product Type (2016-2032)
- Figure 16: Global Dried Herbs Market Revenue (US$ Mn) Comparison by Form (2016-2032)
- Figure 17: Global Dried Herbs Market Revenue (US$ Mn) Comparison by Nature (2016-2032)
- Figure 18: Global Dried Herbs Market Revenue (US$ Mn) Comparison by Drying Method (2016-2032)
- Figure 19: Global Dried Herbs Market Revenue (US$ Mn) Comparison by End-User (2016-2032)
- Figure 20: Global Dried Herbs Market Y-o-Y Growth Rate Comparison by Region (2016-2032)
- Figure 21: Global Dried Herbs Market Y-o-Y Growth Rate Comparison by Product Type (2016-2032)
- Figure 22: Global Dried Herbs Market Y-o-Y Growth Rate Comparison by Form (2016-2032)
- Figure 23: Global Dried Herbs Market Y-o-Y Growth Rate Comparison by Nature (2016-2032)
- Figure 24: Global Dried Herbs Market Y-o-Y Growth Rate Comparison by Drying Method (2016-2032)
- Figure 25: Global Dried Herbs Market Y-o-Y Growth Rate Comparison by End-User (2016-2032)
- Figure 26: Global Dried Herbs Market Share Comparison by Region (2016-2032)
- Figure 27: Global Dried Herbs Market Share Comparison by Product Type (2016-2032)
- Figure 28: Global Dried Herbs Market Share Comparison by Form (2016-2032)
- Figure 29: Global Dried Herbs Market Share Comparison by Nature (2016-2032)
- Figure 30: Global Dried Herbs Market Share Comparison by Drying Method (2016-2032)
- Figure 31: Global Dried Herbs Market Share Comparison by End-User (2016-2032)
- Figure 32: North America Dried Herbs Market Revenue (US$ Mn) Market Share by Product Typein 2022
- Figure 33: North America Dried Herbs Market Attractiveness Analysis by Product Type, 2016-2032
- Figure 34: North America Dried Herbs Market Revenue (US$ Mn) Market Share by Form in 2022
- Figure 35: North America Dried Herbs Market Attractiveness Analysis by Form , 2016-2032
- Figure 36: North America Dried Herbs Market Revenue (US$ Mn) Market Share by Naturein 2022
- Figure 37: North America Dried Herbs Market Attractiveness Analysis by Nature, 2016-2032
- Figure 38: North America Dried Herbs Market Revenue (US$ Mn) Market Share by Drying Methodin 2022
- Figure 39: North America Dried Herbs Market Attractiveness Analysis by Drying Method, 2016-2032
- Figure 40: North America Dried Herbs Market Revenue (US$ Mn) Market Share by End-Userin 2022
- Figure 41: North America Dried Herbs Market Attractiveness Analysis by End-User, 2016-2032
- Figure 42: North America Dried Herbs Market Revenue (US$ Mn) Market Share by Country in 2022
- Figure 43: North America Dried Herbs Market Attractiveness Analysis by Country, 2016-2032
- Figure 44: North America Dried Herbs Market Revenue (US$ Mn) (2016-2032)
- Figure 45: North America Dried Herbs Market Revenue (US$ Mn) Comparison by Country (2016-2032)
- Figure 46: North America Dried Herbs Market Revenue (US$ Mn) Comparison by Product Type (2016-2032)
- Figure 47: North America Dried Herbs Market Revenue (US$ Mn) Comparison by Form (2016-2032)
- Figure 48: North America Dried Herbs Market Revenue (US$ Mn) Comparison by Nature (2016-2032)
- Figure 49: North America Dried Herbs Market Revenue (US$ Mn) Comparison by Drying Method (2016-2032)
- Figure 50: North America Dried Herbs Market Revenue (US$ Mn) Comparison by End-User (2016-2032)
- Figure 51: North America Dried Herbs Market Y-o-Y Growth Rate Comparison by Country (2016-2032)
- Figure 52: North America Dried Herbs Market Y-o-Y Growth Rate Comparison by Product Type (2016-2032)
- Figure 53: North America Dried Herbs Market Y-o-Y Growth Rate Comparison by Form (2016-2032)
- Figure 54: North America Dried Herbs Market Y-o-Y Growth Rate Comparison by Nature (2016-2032)
- Figure 55: North America Dried Herbs Market Y-o-Y Growth Rate Comparison by Drying Method (2016-2032)
- Figure 56: North America Dried Herbs Market Y-o-Y Growth Rate Comparison by End-User (2016-2032)
- Figure 57: North America Dried Herbs Market Share Comparison by Country (2016-2032)
- Figure 58: North America Dried Herbs Market Share Comparison by Product Type (2016-2032)
- Figure 59: North America Dried Herbs Market Share Comparison by Form (2016-2032)
- Figure 60: North America Dried Herbs Market Share Comparison by Nature (2016-2032)
- Figure 61: North America Dried Herbs Market Share Comparison by Drying Method (2016-2032)
- Figure 62: North America Dried Herbs Market Share Comparison by End-User (2016-2032)
- Figure 63: Western Europe Dried Herbs Market Revenue (US$ Mn) Market Share by Product Typein 2022
- Figure 64: Western Europe Dried Herbs Market Attractiveness Analysis by Product Type, 2016-2032
- Figure 65: Western Europe Dried Herbs Market Revenue (US$ Mn) Market Share by Form in 2022
- Figure 66: Western Europe Dried Herbs Market Attractiveness Analysis by Form , 2016-2032
- Figure 67: Western Europe Dried Herbs Market Revenue (US$ Mn) Market Share by Naturein 2022
- Figure 68: Western Europe Dried Herbs Market Attractiveness Analysis by Nature, 2016-2032
- Figure 69: Western Europe Dried Herbs Market Revenue (US$ Mn) Market Share by Drying Methodin 2022
- Figure 70: Western Europe Dried Herbs Market Attractiveness Analysis by Drying Method, 2016-2032
- Figure 71: Western Europe Dried Herbs Market Revenue (US$ Mn) Market Share by End-Userin 2022
- Figure 72: Western Europe Dried Herbs Market Attractiveness Analysis by End-User, 2016-2032
- Figure 73: Western Europe Dried Herbs Market Revenue (US$ Mn) Market Share by Country in 2022
- Figure 74: Western Europe Dried Herbs Market Attractiveness Analysis by Country, 2016-2032
- Figure 75: Western Europe Dried Herbs Market Revenue (US$ Mn) (2016-2032)
- Figure 76: Western Europe Dried Herbs Market Revenue (US$ Mn) Comparison by Country (2016-2032)
- Figure 77: Western Europe Dried Herbs Market Revenue (US$ Mn) Comparison by Product Type (2016-2032)
- Figure 78: Western Europe Dried Herbs Market Revenue (US$ Mn) Comparison by Form (2016-2032)
- Figure 79: Western Europe Dried Herbs Market Revenue (US$ Mn) Comparison by Nature (2016-2032)
- Figure 80: Western Europe Dried Herbs Market Revenue (US$ Mn) Comparison by Drying Method (2016-2032)
- Figure 81: Western Europe Dried Herbs Market Revenue (US$ Mn) Comparison by End-User (2016-2032)
- Figure 82: Western Europe Dried Herbs Market Y-o-Y Growth Rate Comparison by Country (2016-2032)
- Figure 83: Western Europe Dried Herbs Market Y-o-Y Growth Rate Comparison by Product Type (2016-2032)
- Figure 84: Western Europe Dried Herbs Market Y-o-Y Growth Rate Comparison by Form (2016-2032)
- Figure 85: Western Europe Dried Herbs Market Y-o-Y Growth Rate Comparison by Nature (2016-2032)
- Figure 86: Western Europe Dried Herbs Market Y-o-Y Growth Rate Comparison by Drying Method (2016-2032)
- Figure 87: Western Europe Dried Herbs Market Y-o-Y Growth Rate Comparison by End-User (2016-2032)
- Figure 88: Western Europe Dried Herbs Market Share Comparison by Country (2016-2032)
- Figure 89: Western Europe Dried Herbs Market Share Comparison by Product Type (2016-2032)
- Figure 90: Western Europe Dried Herbs Market Share Comparison by Form (2016-2032)
- Figure 91: Western Europe Dried Herbs Market Share Comparison by Nature (2016-2032)
- Figure 92: Western Europe Dried Herbs Market Share Comparison by Drying Method (2016-2032)
- Figure 93: Western Europe Dried Herbs Market Share Comparison by End-User (2016-2032)
- Figure 94: Eastern Europe Dried Herbs Market Revenue (US$ Mn) Market Share by Product Typein 2022
- Figure 95: Eastern Europe Dried Herbs Market Attractiveness Analysis by Product Type, 2016-2032
- Figure 96: Eastern Europe Dried Herbs Market Revenue (US$ Mn) Market Share by Form in 2022
- Figure 97: Eastern Europe Dried Herbs Market Attractiveness Analysis by Form , 2016-2032
- Figure 98: Eastern Europe Dried Herbs Market Revenue (US$ Mn) Market Share by Naturein 2022
- Figure 99: Eastern Europe Dried Herbs Market Attractiveness Analysis by Nature, 2016-2032
- Figure 100: Eastern Europe Dried Herbs Market Revenue (US$ Mn) Market Share by Drying Methodin 2022
- Figure 101: Eastern Europe Dried Herbs Market Attractiveness Analysis by Drying Method, 2016-2032
- Figure 102: Eastern Europe Dried Herbs Market Revenue (US$ Mn) Market Share by End-Userin 2022
- Figure 103: Eastern Europe Dried Herbs Market Attractiveness Analysis by End-User, 2016-2032
- Figure 104: Eastern Europe Dried Herbs Market Revenue (US$ Mn) Market Share by Country in 2022
- Figure 105: Eastern Europe Dried Herbs Market Attractiveness Analysis by Country, 2016-2032
- Figure 106: Eastern Europe Dried Herbs Market Revenue (US$ Mn) (2016-2032)
- Figure 107: Eastern Europe Dried Herbs Market Revenue (US$ Mn) Comparison by Country (2016-2032)
- Figure 108: Eastern Europe Dried Herbs Market Revenue (US$ Mn) Comparison by Product Type (2016-2032)
- Figure 109: Eastern Europe Dried Herbs Market Revenue (US$ Mn) Comparison by Form (2016-2032)
- Figure 110: Eastern Europe Dried Herbs Market Revenue (US$ Mn) Comparison by Nature (2016-2032)
- Figure 111: Eastern Europe Dried Herbs Market Revenue (US$ Mn) Comparison by Drying Method (2016-2032)
- Figure 112: Eastern Europe Dried Herbs Market Revenue (US$ Mn) Comparison by End-User (2016-2032)
- Figure 113: Eastern Europe Dried Herbs Market Y-o-Y Growth Rate Comparison by Country (2016-2032)
- Figure 114: Eastern Europe Dried Herbs Market Y-o-Y Growth Rate Comparison by Product Type (2016-2032)
- Figure 115: Eastern Europe Dried Herbs Market Y-o-Y Growth Rate Comparison by Form (2016-2032)
- Figure 116: Eastern Europe Dried Herbs Market Y-o-Y Growth Rate Comparison by Nature (2016-2032)
- Figure 117: Eastern Europe Dried Herbs Market Y-o-Y Growth Rate Comparison by Drying Method (2016-2032)
- Figure 118: Eastern Europe Dried Herbs Market Y-o-Y Growth Rate Comparison by End-User (2016-2032)
- Figure 119: Eastern Europe Dried Herbs Market Share Comparison by Country (2016-2032)
- Figure 120: Eastern Europe Dried Herbs Market Share Comparison by Product Type (2016-2032)
- Figure 121: Eastern Europe Dried Herbs Market Share Comparison by Form (2016-2032)
- Figure 122: Eastern Europe Dried Herbs Market Share Comparison by Nature (2016-2032)
- Figure 123: Eastern Europe Dried Herbs Market Share Comparison by Drying Method (2016-2032)
- Figure 124: Eastern Europe Dried Herbs Market Share Comparison by End-User (2016-2032)
- Figure 125: APAC Dried Herbs Market Revenue (US$ Mn) Market Share by Product Typein 2022
- Figure 126: APAC Dried Herbs Market Attractiveness Analysis by Product Type, 2016-2032
- Figure 127: APAC Dried Herbs Market Revenue (US$ Mn) Market Share by Form in 2022
- Figure 128: APAC Dried Herbs Market Attractiveness Analysis by Form , 2016-2032
- Figure 129: APAC Dried Herbs Market Revenue (US$ Mn) Market Share by Naturein 2022
- Figure 130: APAC Dried Herbs Market Attractiveness Analysis by Nature, 2016-2032
- Figure 131: APAC Dried Herbs Market Revenue (US$ Mn) Market Share by Drying Methodin 2022
- Figure 132: APAC Dried Herbs Market Attractiveness Analysis by Drying Method, 2016-2032
- Figure 133: APAC Dried Herbs Market Revenue (US$ Mn) Market Share by End-Userin 2022
- Figure 134: APAC Dried Herbs Market Attractiveness Analysis by End-User, 2016-2032
- Figure 135: APAC Dried Herbs Market Revenue (US$ Mn) Market Share by Country in 2022
- Figure 136: APAC Dried Herbs Market Attractiveness Analysis by Country, 2016-2032
- Figure 137: APAC Dried Herbs Market Revenue (US$ Mn) (2016-2032)
- Figure 138: APAC Dried Herbs Market Revenue (US$ Mn) Comparison by Country (2016-2032)
- Figure 139: APAC Dried Herbs Market Revenue (US$ Mn) Comparison by Product Type (2016-2032)
- Figure 140: APAC Dried Herbs Market Revenue (US$ Mn) Comparison by Form (2016-2032)
- Figure 141: APAC Dried Herbs Market Revenue (US$ Mn) Comparison by Nature (2016-2032)
- Figure 142: APAC Dried Herbs Market Revenue (US$ Mn) Comparison by Drying Method (2016-2032)
- Figure 143: APAC Dried Herbs Market Revenue (US$ Mn) Comparison by End-User (2016-2032)
- Figure 144: APAC Dried Herbs Market Y-o-Y Growth Rate Comparison by Country (2016-2032)
- Figure 145: APAC Dried Herbs Market Y-o-Y Growth Rate Comparison by Product Type (2016-2032)
- Figure 146: APAC Dried Herbs Market Y-o-Y Growth Rate Comparison by Form (2016-2032)
- Figure 147: APAC Dried Herbs Market Y-o-Y Growth Rate Comparison by Nature (2016-2032)
- Figure 148: APAC Dried Herbs Market Y-o-Y Growth Rate Comparison by Drying Method (2016-2032)
- Figure 149: APAC Dried Herbs Market Y-o-Y Growth Rate Comparison by End-User (2016-2032)
- Figure 150: APAC Dried Herbs Market Share Comparison by Country (2016-2032)
- Figure 151: APAC Dried Herbs Market Share Comparison by Product Type (2016-2032)
- Figure 152: APAC Dried Herbs Market Share Comparison by Form (2016-2032)
- Figure 153: APAC Dried Herbs Market Share Comparison by Nature (2016-2032)
- Figure 154: APAC Dried Herbs Market Share Comparison by Drying Method (2016-2032)
- Figure 155: APAC Dried Herbs Market Share Comparison by End-User (2016-2032)
- Figure 156: Latin America Dried Herbs Market Revenue (US$ Mn) Market Share by Product Typein 2022
- Figure 157: Latin America Dried Herbs Market Attractiveness Analysis by Product Type, 2016-2032
- Figure 158: Latin America Dried Herbs Market Revenue (US$ Mn) Market Share by Form in 2022
- Figure 159: Latin America Dried Herbs Market Attractiveness Analysis by Form , 2016-2032
- Figure 160: Latin America Dried Herbs Market Revenue (US$ Mn) Market Share by Naturein 2022
- Figure 161: Latin America Dried Herbs Market Attractiveness Analysis by Nature, 2016-2032
- Figure 162: Latin America Dried Herbs Market Revenue (US$ Mn) Market Share by Drying Methodin 2022
- Figure 163: Latin America Dried Herbs Market Attractiveness Analysis by Drying Method, 2016-2032
- Figure 164: Latin America Dried Herbs Market Revenue (US$ Mn) Market Share by End-Userin 2022
- Figure 165: Latin America Dried Herbs Market Attractiveness Analysis by End-User, 2016-2032
- Figure 166: Latin America Dried Herbs Market Revenue (US$ Mn) Market Share by Country in 2022
- Figure 167: Latin America Dried Herbs Market Attractiveness Analysis by Country, 2016-2032
- Figure 168: Latin America Dried Herbs Market Revenue (US$ Mn) (2016-2032)
- Figure 169: Latin America Dried Herbs Market Revenue (US$ Mn) Comparison by Country (2016-2032)
- Figure 170: Latin America Dried Herbs Market Revenue (US$ Mn) Comparison by Product Type (2016-2032)
- Figure 171: Latin America Dried Herbs Market Revenue (US$ Mn) Comparison by Form (2016-2032)
- Figure 172: Latin America Dried Herbs Market Revenue (US$ Mn) Comparison by Nature (2016-2032)
- Figure 173: Latin America Dried Herbs Market Revenue (US$ Mn) Comparison by Drying Method (2016-2032)
- Figure 174: Latin America Dried Herbs Market Revenue (US$ Mn) Comparison by End-User (2016-2032)
- Figure 175: Latin America Dried Herbs Market Y-o-Y Growth Rate Comparison by Country (2016-2032)
- Figure 176: Latin America Dried Herbs Market Y-o-Y Growth Rate Comparison by Product Type (2016-2032)
- Figure 177: Latin America Dried Herbs Market Y-o-Y Growth Rate Comparison by Form (2016-2032)
- Figure 178: Latin America Dried Herbs Market Y-o-Y Growth Rate Comparison by Nature (2016-2032)
- Figure 179: Latin America Dried Herbs Market Y-o-Y Growth Rate Comparison by Drying Method (2016-2032)
- Figure 180: Latin America Dried Herbs Market Y-o-Y Growth Rate Comparison by End-User (2016-2032)
- Figure 181: Latin America Dried Herbs Market Share Comparison by Country (2016-2032)
- Figure 182: Latin America Dried Herbs Market Share Comparison by Product Type (2016-2032)
- Figure 183: Latin America Dried Herbs Market Share Comparison by Form (2016-2032)
- Figure 184: Latin America Dried Herbs Market Share Comparison by Nature (2016-2032)
- Figure 185: Latin America Dried Herbs Market Share Comparison by Drying Method (2016-2032)
- Figure 186: Latin America Dried Herbs Market Share Comparison by End-User (2016-2032)
- Figure 187: Middle East & Africa Dried Herbs Market Revenue (US$ Mn) Market Share by Product Typein 2022
- Figure 188: Middle East & Africa Dried Herbs Market Attractiveness Analysis by Product Type, 2016-2032
- Figure 189: Middle East & Africa Dried Herbs Market Revenue (US$ Mn) Market Share by Form in 2022
- Figure 190: Middle East & Africa Dried Herbs Market Attractiveness Analysis by Form , 2016-2032
- Figure 191: Middle East & Africa Dried Herbs Market Revenue (US$ Mn) Market Share by Naturein 2022
- Figure 192: Middle East & Africa Dried Herbs Market Attractiveness Analysis by Nature, 2016-2032
- Figure 193: Middle East & Africa Dried Herbs Market Revenue (US$ Mn) Market Share by Drying Methodin 2022
- Figure 194: Middle East & Africa Dried Herbs Market Attractiveness Analysis by Drying Method, 2016-2032
- Figure 195: Middle East & Africa Dried Herbs Market Revenue (US$ Mn) Market Share by End-Userin 2022
- Figure 196: Middle East & Africa Dried Herbs Market Attractiveness Analysis by End-User, 2016-2032
- Figure 197: Middle East & Africa Dried Herbs Market Revenue (US$ Mn) Market Share by Country in 2022
- Figure 198: Middle East & Africa Dried Herbs Market Attractiveness Analysis by Country, 2016-2032
- Figure 199: Middle East & Africa Dried Herbs Market Revenue (US$ Mn) (2016-2032)
- Figure 200: Middle East & Africa Dried Herbs Market Revenue (US$ Mn) Comparison by Country (2016-2032)
- Figure 201: Middle East & Africa Dried Herbs Market Revenue (US$ Mn) Comparison by Product Type (2016-2032)
- Figure 202: Middle East & Africa Dried Herbs Market Revenue (US$ Mn) Comparison by Form (2016-2032)
- Figure 203: Middle East & Africa Dried Herbs Market Revenue (US$ Mn) Comparison by Nature (2016-2032)
- Figure 204: Middle East & Africa Dried Herbs Market Revenue (US$ Mn) Comparison by Drying Method (2016-2032)
- Figure 205: Middle East & Africa Dried Herbs Market Revenue (US$ Mn) Comparison by End-User (2016-2032)
- Figure 206: Middle East & Africa Dried Herbs Market Y-o-Y Growth Rate Comparison by Country (2016-2032)
- Figure 207: Middle East & Africa Dried Herbs Market Y-o-Y Growth Rate Comparison by Product Type (2016-2032)
- Figure 208: Middle East & Africa Dried Herbs Market Y-o-Y Growth Rate Comparison by Form (2016-2032)
- Figure 209: Middle East & Africa Dried Herbs Market Y-o-Y Growth Rate Comparison by Nature (2016-2032)
- Figure 210: Middle East & Africa Dried Herbs Market Y-o-Y Growth Rate Comparison by Drying Method (2016-2032)
- Figure 211: Middle East & Africa Dried Herbs Market Y-o-Y Growth Rate Comparison by End-User (2016-2032)
- Figure 212: Middle East & Africa Dried Herbs Market Share Comparison by Country (2016-2032)
- Figure 213: Middle East & Africa Dried Herbs Market Share Comparison by Product Type (2016-2032)
- Figure 214: Middle East & Africa Dried Herbs Market Share Comparison by Form (2016-2032)
- Figure 215: Middle East & Africa Dried Herbs Market Share Comparison by Nature (2016-2032)
- Figure 216: Middle East & Africa Dried Herbs Market Share Comparison by Drying Method (2016-2032)
- Figure 217: Middle East & Africa Dried Herbs Market Share Comparison by End-User (2016-2032)
List of Tables
- Table 1: Global Dried Herbs Market Comparison by Product Type (2016-2032)
- Table 2: Global Dried Herbs Market Comparison by Form (2016-2032)
- Table 3: Global Dried Herbs Market Comparison by Nature (2016-2032)
- Table 4: Global Dried Herbs Market Comparison by Drying Method (2016-2032)
- Table 5: Global Dried Herbs Market Comparison by End-User (2016-2032)
- Table 6: Global Dried Herbs Market Revenue (US$ Mn) Comparison by Region (2016-2032)
- Table 7: Global Dried Herbs Market Revenue (US$ Mn) (2016-2032)
- Table 8: Global Dried Herbs Market Revenue (US$ Mn) Comparison by Region (2016-2032)
- Table 9: Global Dried Herbs Market Revenue (US$ Mn) Comparison by Product Type (2016-2032)
- Table 10: Global Dried Herbs Market Revenue (US$ Mn) Comparison by Form (2016-2032)
- Table 11: Global Dried Herbs Market Revenue (US$ Mn) Comparison by Nature (2016-2032)
- Table 12: Global Dried Herbs Market Revenue (US$ Mn) Comparison by Drying Method (2016-2032)
- Table 13: Global Dried Herbs Market Revenue (US$ Mn) Comparison by End-User (2016-2032)
- Table 14: Global Dried Herbs Market Y-o-Y Growth Rate Comparison by Region (2016-2032)
- Table 15: Global Dried Herbs Market Y-o-Y Growth Rate Comparison by Product Type (2016-2032)
- Table 16: Global Dried Herbs Market Y-o-Y Growth Rate Comparison by Form (2016-2032)
- Table 17: Global Dried Herbs Market Y-o-Y Growth Rate Comparison by Nature (2016-2032)
- Table 18: Global Dried Herbs Market Y-o-Y Growth Rate Comparison by Drying Method (2016-2032)
- Table 19: Global Dried Herbs Market Y-o-Y Growth Rate Comparison by End-User (2016-2032)
- Table 20: Global Dried Herbs Market Share Comparison by Region (2016-2032)
- Table 21: Global Dried Herbs Market Share Comparison by Product Type (2016-2032)
- Table 22: Global Dried Herbs Market Share Comparison by Form (2016-2032)
- Table 23: Global Dried Herbs Market Share Comparison by Nature (2016-2032)
- Table 24: Global Dried Herbs Market Share Comparison by Drying Method (2016-2032)
- Table 25: Global Dried Herbs Market Share Comparison by End-User (2016-2032)
- Table 26: North America Dried Herbs Market Comparison by Form (2016-2032)
- Table 27: North America Dried Herbs Market Comparison by Nature (2016-2032)
- Table 28: North America Dried Herbs Market Comparison by Drying Method (2016-2032)
- Table 29: North America Dried Herbs Market Comparison by End-User (2016-2032)
- Table 30: North America Dried Herbs Market Revenue (US$ Mn) Comparison by Country (2016-2032)
- Table 31: North America Dried Herbs Market Revenue (US$ Mn) (2016-2032)
- Table 32: North America Dried Herbs Market Revenue (US$ Mn) Comparison by Country (2016-2032)
- Table 33: North America Dried Herbs Market Revenue (US$ Mn) Comparison by Product Type (2016-2032)
- Table 34: North America Dried Herbs Market Revenue (US$ Mn) Comparison by Form (2016-2032)
- Table 35: North America Dried Herbs Market Revenue (US$ Mn) Comparison by Nature (2016-2032)
- Table 36: North America Dried Herbs Market Revenue (US$ Mn) Comparison by Drying Method (2016-2032)
- Table 37: North America Dried Herbs Market Revenue (US$ Mn) Comparison by End-User (2016-2032)
- Table 38: North America Dried Herbs Market Y-o-Y Growth Rate Comparison by Country (2016-2032)
- Table 39: North America Dried Herbs Market Y-o-Y Growth Rate Comparison by Product Type (2016-2032)
- Table 40: North America Dried Herbs Market Y-o-Y Growth Rate Comparison by Form (2016-2032)
- Table 41: North America Dried Herbs Market Y-o-Y Growth Rate Comparison by Nature (2016-2032)
- Table 42: North America Dried Herbs Market Y-o-Y Growth Rate Comparison by Drying Method (2016-2032)
- Table 43: North America Dried Herbs Market Y-o-Y Growth Rate Comparison by End-User (2016-2032)
- Table 44: North America Dried Herbs Market Share Comparison by Country (2016-2032)
- Table 45: North America Dried Herbs Market Share Comparison by Product Type (2016-2032)
- Table 46: North America Dried Herbs Market Share Comparison by Form (2016-2032)
- Table 47: North America Dried Herbs Market Share Comparison by Nature (2016-2032)
- Table 48: North America Dried Herbs Market Share Comparison by Drying Method (2016-2032)
- Table 49: North America Dried Herbs Market Share Comparison by End-User (2016-2032)
- Table 50: Western Europe Dried Herbs Market Comparison by Product Type (2016-2032)
- Table 51: Western Europe Dried Herbs Market Comparison by Form (2016-2032)
- Table 52: Western Europe Dried Herbs Market Comparison by Nature (2016-2032)
- Table 53: Western Europe Dried Herbs Market Comparison by Drying Method (2016-2032)
- Table 54: Western Europe Dried Herbs Market Comparison by End-User (2016-2032)
- Table 55: Western Europe Dried Herbs Market Revenue (US$ Mn) Comparison by Country (2016-2032)
- Table 56: Western Europe Dried Herbs Market Revenue (US$ Mn) (2016-2032)
- Table 57: Western Europe Dried Herbs Market Revenue (US$ Mn) Comparison by Country (2016-2032)
- Table 58: Western Europe Dried Herbs Market Revenue (US$ Mn) Comparison by Product Type (2016-2032)
- Table 59: Western Europe Dried Herbs Market Revenue (US$ Mn) Comparison by Form (2016-2032)
- Table 60: Western Europe Dried Herbs Market Revenue (US$ Mn) Comparison by Nature (2016-2032)
- Table 61: Western Europe Dried Herbs Market Revenue (US$ Mn) Comparison by Drying Method (2016-2032)
- Table 62: Western Europe Dried Herbs Market Revenue (US$ Mn) Comparison by End-User (2016-2032)
- Table 63: Western Europe Dried Herbs Market Y-o-Y Growth Rate Comparison by Country (2016-2032)
- Table 64: Western Europe Dried Herbs Market Y-o-Y Growth Rate Comparison by Product Type (2016-2032)
- Table 65: Western Europe Dried Herbs Market Y-o-Y Growth Rate Comparison by Form (2016-2032)
- Table 66: Western Europe Dried Herbs Market Y-o-Y Growth Rate Comparison by Nature (2016-2032)
- Table 67: Western Europe Dried Herbs Market Y-o-Y Growth Rate Comparison by Drying Method (2016-2032)
- Table 68: Western Europe Dried Herbs Market Y-o-Y Growth Rate Comparison by End-User (2016-2032)
- Table 69: Western Europe Dried Herbs Market Share Comparison by Country (2016-2032)
- Table 70: Western Europe Dried Herbs Market Share Comparison by Product Type (2016-2032)
- Table 71: Western Europe Dried Herbs Market Share Comparison by Form (2016-2032)
- Table 72: Western Europe Dried Herbs Market Share Comparison by Nature (2016-2032)
- Table 73: Western Europe Dried Herbs Market Share Comparison by Drying Method (2016-2032)
- Table 74: Western Europe Dried Herbs Market Share Comparison by End-User (2016-2032)
- Table 75: Eastern Europe Dried Herbs Market Comparison by Product Type (2016-2032)
- Table 76: Eastern Europe Dried Herbs Market Comparison by Form (2016-2032)
- Table 77: Eastern Europe Dried Herbs Market Comparison by Nature (2016-2032)
- Table 78: Eastern Europe Dried Herbs Market Comparison by Drying Method (2016-2032)
- Table 79: Eastern Europe Dried Herbs Market Comparison by End-User (2016-2032)
- Table 80: Eastern Europe Dried Herbs Market Revenue (US$ Mn) Comparison by Country (2016-2032)
- Table 81: Eastern Europe Dried Herbs Market Revenue (US$ Mn) (2016-2032)
- Table 82: Eastern Europe Dried Herbs Market Revenue (US$ Mn) Comparison by Country (2016-2032)
- Table 83: Eastern Europe Dried Herbs Market Revenue (US$ Mn) Comparison by Product Type (2016-2032)
- Table 84: Eastern Europe Dried Herbs Market Revenue (US$ Mn) Comparison by Form (2016-2032)
- Table 85: Eastern Europe Dried Herbs Market Revenue (US$ Mn) Comparison by Nature (2016-2032)
- Table 86: Eastern Europe Dried Herbs Market Revenue (US$ Mn) Comparison by Drying Method (2016-2032)
- Table 87: Eastern Europe Dried Herbs Market Revenue (US$ Mn) Comparison by End-User (2016-2032)
- Table 88: Eastern Europe Dried Herbs Market Y-o-Y Growth Rate Comparison by Country (2016-2032)
- Table 89: Eastern Europe Dried Herbs Market Y-o-Y Growth Rate Comparison by Product Type (2016-2032)
- Table 90: Eastern Europe Dried Herbs Market Y-o-Y Growth Rate Comparison by Form (2016-2032)
- Table 91: Eastern Europe Dried Herbs Market Y-o-Y Growth Rate Comparison by Nature (2016-2032)
- Table 92: Eastern Europe Dried Herbs Market Y-o-Y Growth Rate Comparison by Drying Method (2016-2032)
- Table 93: Eastern Europe Dried Herbs Market Y-o-Y Growth Rate Comparison by End-User (2016-2032)
- Table 94: Eastern Europe Dried Herbs Market Share Comparison by Country (2016-2032)
- Table 95: Eastern Europe Dried Herbs Market Share Comparison by Product Type (2016-2032)
- Table 96: Eastern Europe Dried Herbs Market Share Comparison by Form (2016-2032)
- Table 97: Eastern Europe Dried Herbs Market Share Comparison by Nature (2016-2032)
- Table 98: Eastern Europe Dried Herbs Market Share Comparison by Drying Method (2016-2032)
- Table 99: Eastern Europe Dried Herbs Market Share Comparison by End-User (2016-2032)
- Table 100: APAC Dried Herbs Market Comparison by Product Type (2016-2032)
- Table 101: APAC Dried Herbs Market Comparison by Form (2016-2032)
- Table 102: APAC Dried Herbs Market Comparison by Nature (2016-2032)
- Table 103: APAC Dried Herbs Market Comparison by Drying Method (2016-2032)
- Table 104: APAC Dried Herbs Market Comparison by End-User (2016-2032)
- Table 105: APAC Dried Herbs Market Revenue (US$ Mn) Comparison by Country (2016-2032)
- Table 106: APAC Dried Herbs Market Revenue (US$ Mn) (2016-2032)
- Table 107: APAC Dried Herbs Market Revenue (US$ Mn) Comparison by Country (2016-2032)
- Table 108: APAC Dried Herbs Market Revenue (US$ Mn) Comparison by Product Type (2016-2032)
- Table 109: APAC Dried Herbs Market Revenue (US$ Mn) Comparison by Form (2016-2032)
- Table 110: APAC Dried Herbs Market Revenue (US$ Mn) Comparison by Nature (2016-2032)
- Table 111: APAC Dried Herbs Market Revenue (US$ Mn) Comparison by Drying Method (2016-2032)
- Table 112: APAC Dried Herbs Market Revenue (US$ Mn) Comparison by End-User (2016-2032)
- Table 113: APAC Dried Herbs Market Y-o-Y Growth Rate Comparison by Country (2016-2032)
- Table 114: APAC Dried Herbs Market Y-o-Y Growth Rate Comparison by Product Type (2016-2032)
- Table 115: APAC Dried Herbs Market Y-o-Y Growth Rate Comparison by Form (2016-2032)
- Table 116: APAC Dried Herbs Market Y-o-Y Growth Rate Comparison by Nature (2016-2032)
- Table 117: APAC Dried Herbs Market Y-o-Y Growth Rate Comparison by Drying Method (2016-2032)
- Table 118: APAC Dried Herbs Market Y-o-Y Growth Rate Comparison by End-User (2016-2032)
- Table 119: APAC Dried Herbs Market Share Comparison by Country (2016-2032)
- Table 120: APAC Dried Herbs Market Share Comparison by Product Type (2016-2032)
- Table 121: APAC Dried Herbs Market Share Comparison by Form (2016-2032)
- Table 122: APAC Dried Herbs Market Share Comparison by Nature (2016-2032)
- Table 123: APAC Dried Herbs Market Share Comparison by Drying Method (2016-2032)
- Table 124: APAC Dried Herbs Market Share Comparison by End-User (2016-2032)
- Table 125: Latin America Dried Herbs Market Comparison by Product Type (2016-2032)
- Table 126: Latin America Dried Herbs Market Comparison by Form (2016-2032)
- Table 127: Latin America Dried Herbs Market Comparison by Nature (2016-2032)
- Table 128: Latin America Dried Herbs Market Comparison by Drying Method (2016-2032)
- Table 129: Latin America Dried Herbs Market Comparison by End-User (2016-2032)
- Table 130: Latin America Dried Herbs Market Revenue (US$ Mn) Comparison by Country (2016-2032)
- Table 131: Latin America Dried Herbs Market Revenue (US$ Mn) (2016-2032)
- Table 132: Latin America Dried Herbs Market Revenue (US$ Mn) Comparison by Country (2016-2032)
- Table 133: Latin America Dried Herbs Market Revenue (US$ Mn) Comparison by Product Type (2016-2032)
- Table 134: Latin America Dried Herbs Market Revenue (US$ Mn) Comparison by Form (2016-2032)
- Table 135: Latin America Dried Herbs Market Revenue (US$ Mn) Comparison by Nature (2016-2032)
- Table 136: Latin America Dried Herbs Market Revenue (US$ Mn) Comparison by Drying Method (2016-2032)
- Table 137: Latin America Dried Herbs Market Revenue (US$ Mn) Comparison by End-User (2016-2032)
- Table 138: Latin America Dried Herbs Market Y-o-Y Growth Rate Comparison by Country (2016-2032)
- Table 139: Latin America Dried Herbs Market Y-o-Y Growth Rate Comparison by Product Type (2016-2032)
- Table 140: Latin America Dried Herbs Market Y-o-Y Growth Rate Comparison by Form (2016-2032)
- Table 141: Latin America Dried Herbs Market Y-o-Y Growth Rate Comparison by Nature (2016-2032)
- Table 142: Latin America Dried Herbs Market Y-o-Y Growth Rate Comparison by Drying Method (2016-2032)
- Table 143: Latin America Dried Herbs Market Y-o-Y Growth Rate Comparison by End-User (2016-2032)
- Table 144: Latin America Dried Herbs Market Share Comparison by Country (2016-2032)
- Table 145: Latin America Dried Herbs Market Share Comparison by Product Type (2016-2032)
- Table 146: Latin America Dried Herbs Market Share Comparison by Form (2016-2032)
- Table 147: Latin America Dried Herbs Market Share Comparison by Nature (2016-2032)
- Table 148: Latin America Dried Herbs Market Share Comparison by Drying Method (2016-2032)
- Table 149: Latin America Dried Herbs Market Share Comparison by End-User (2016-2032)
- Table 150: Middle East & Africa Dried Herbs Market Comparison by Product Type (2016-2032)
- Table 151: Middle East & Africa Dried Herbs Market Comparison by Form (2016-2032)
- Table 152: Middle East & Africa Dried Herbs Market Comparison by Nature (2016-2032)
- Table 153: Middle East & Africa Dried Herbs Market Comparison by Drying Method (2016-2032)
- Table 154: Middle East & Africa Dried Herbs Market Comparison by End-User (2016-2032)
- Table 155: Middle East & Africa Dried Herbs Market Revenue (US$ Mn) Comparison by Country (2016-2032)
- Table 156: Middle East & Africa Dried Herbs Market Revenue (US$ Mn) (2016-2032)
- Table 157: Middle East & Africa Dried Herbs Market Revenue (US$ Mn) Comparison by Country (2016-2032)
- Table 158: Middle East & Africa Dried Herbs Market Revenue (US$ Mn) Comparison by Product Type (2016-2032)
- Table 159: Middle East & Africa Dried Herbs Market Revenue (US$ Mn) Comparison by Form (2016-2032)
- Table 160: Middle East & Africa Dried Herbs Market Revenue (US$ Mn) Comparison by Nature (2016-2032)
- Table 161: Middle East & Africa Dried Herbs Market Revenue (US$ Mn) Comparison by Drying Method (2016-2032)
- Table 162: Middle East & Africa Dried Herbs Market Revenue (US$ Mn) Comparison by End-User (2016-2032)
- Table 163: Middle East & Africa Dried Herbs Market Y-o-Y Growth Rate Comparison by Country (2016-2032)
- Table 164: Middle East & Africa Dried Herbs Market Y-o-Y Growth Rate Comparison by Product Type (2016-2032)
- Table 165: Middle East & Africa Dried Herbs Market Y-o-Y Growth Rate Comparison by Form (2016-2032)
- Table 166: Middle East & Africa Dried Herbs Market Y-o-Y Growth Rate Comparison by Nature (2016-2032)
- Table 167: Middle East & Africa Dried Herbs Market Y-o-Y Growth Rate Comparison by Drying Method (2016-2032)
- Table 168: Middle East & Africa Dried Herbs Market Y-o-Y Growth Rate Comparison by End-User (2016-2032)
- Table 169: Middle East & Africa Dried Herbs Market Share Comparison by Country (2016-2032)
- Table 170: Middle East & Africa Dried Herbs Market Share Comparison by Product Type (2016-2032)
- Table 171: Middle East & Africa Dried Herbs Market Share Comparison by Form (2016-2032)
- Table 172: Middle East & Africa Dried Herbs Market Share Comparison by Nature (2016-2032)
- Table 173: Middle East & Africa Dried Herbs Market Share Comparison by Drying Method (2016-2032)
- Table 174: Middle East & Africa Dried Herbs Market Share Comparison by End-User (2016-2032)
- 1. Executive Summary
-
- McCormick & Company Inc. (US)
- Döhler (Germany)
- Pacific Botanicals (US)
- MOUNTAIN ROSE HERBS (US)
- Van Drunen Farms (South Africa)
- British Pepper & Spice Co Ltd (UK)
- Synthite Industries Ltd. (India)
- I.T.S (UK)
- Cherry Valley Organics (US)
- Catz International (Netherlands)
- The Spice House (Netherlands)
- Vardhaman Exotic Herbs & Spices (India)
- Euroma (Netherlands)
- Sorich Organics (India)
- Holyland Marketing Private Limited (India)
- Hamps Bio Private Limited (India)
Our Clients


View Our Licence Options
