
Digital Payment Market By Solution(Application Program Interface, Payment Gateway, Other), By Deployment Mode, (Cloud Based, On-Premise), By Mode of Payment, (Bank Cards, Digital Currencies, Other), By End-Use Industry, (BFSI, Healthcare, Other), By Region And Companies - Industry Segment Outlook, Market Assessment, Competition Scenario, Trends, And Forecast 2023-2032
-
7514
-
Jul 2023
-
179
-


-
This report was compiled by Vishwa Gaul Vishwa is an experienced market research and consulting professional with over 8 years of expertise in the ICT industry, contributing to over 700 reports across telecommunications, software, hardware, and digital solutions. Correspondence Team Lead- ICT Linkedin | Detailed Market research Methodology Our methodology involves a mix of primary research, including interviews with leading mental health experts, and secondary research from reputable medical journals and databases. View Detailed Methodology Page
-
Quick Navigation
Report Overview
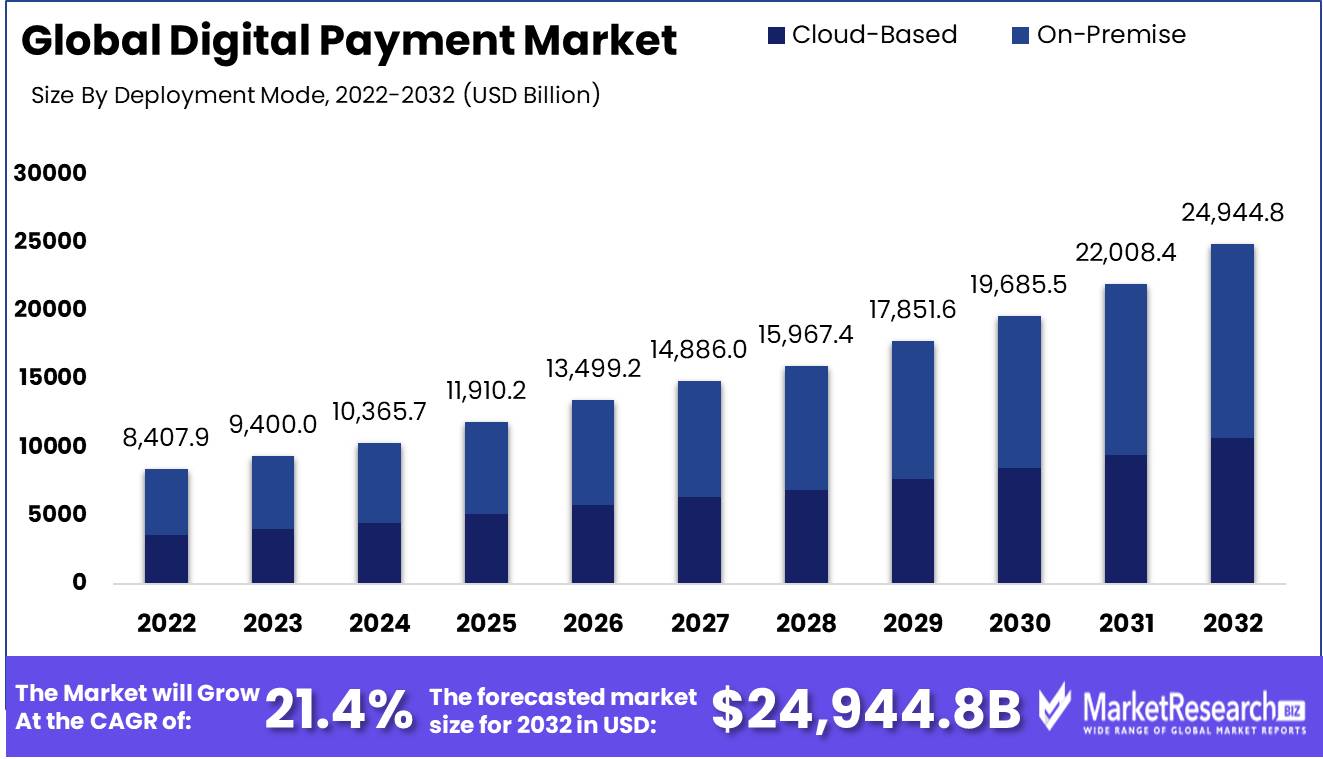
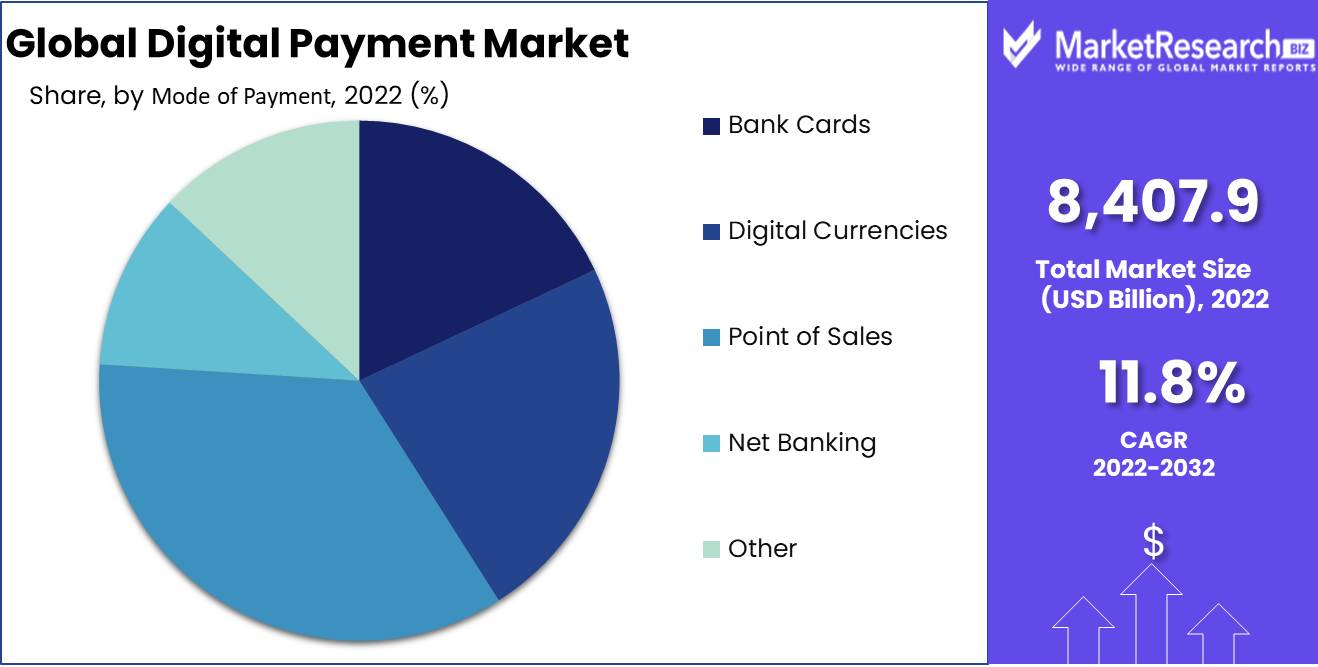
Digital Payment Market size is expected to be worth around USD 24,944.8 Bn by 2032 from USD 8,407.9 Bn in 2022, growing at a CAGR of 11.8% during the forecast period from 2023 to 2032.
The digital payment market encompasses a variety of financial technologies that facilitate secure and convenient electronic transactions for businesses and individuals. Its primary goal is to provide a seamless and efficient method for conducting financial transactions, thereby eliminating the need for tangible cash and conventional payment methods. This market encompasses a variety of digital payment methods, including mobile payments, online transactions, and contactless payments.
The importance of the digital payment market cannot be exaggerated, as it provides consumers and businesses with numerous benefits. The convenience it provides is a major advantage. With digital payments, individuals can conduct transactions on their mobile devices or computers at any time and in any location. This eliminates the need for carrying cash or credit cards and the inconvenience of lengthy lines. The instantaneous transmission of funds facilitated by digital payments promotes quicker and more efficient transactions.
There have been notable innovations in the digital payment market that have increased convenience and security. For instance, mobile wallets enable users to store their credit card information securely on their devices. This facilitates on-the-go payments with a simple tap or scan, expediting and simplifying transactions. In addition, the implementation of biometric authentication, such as fingerprint or facial recognition, has increased the security of digital payments and decreased the likelihood of fraudulent activities.
Significant investments have been made in the digital payment market, and it has been incorporated into a wide range of products and services. Companies acknowledge the potential of digital payments and are integrating them into their offerings to improve consumer experiences. In order to provide a hassle-free experience for their consumers, service-based businesses such as ride-sharing companies have embraced digital payments.
With applications expanding across various industries, the digital payment market has enormous growth potential. Several industries, including retail, hospitality, healthcare, and transportation, have made substantial investments in digital payment technologies. This increasing adoption is driven by a number of factors, including the pervasive use of smartphones, growing consumer awareness of the advantages of digital payments, and changing consumer behavior.
Driving factors
E-commerce and Online Transactions are Expanding
In tandem with the increasing adoption of smartphones and internet connectivity, the growth of e-commerce and online transactions has been a crucial factor driving the expansion of the digital payment market. E-commerce has revolutionized the way people shop and conduct business by providing worldwide consumers with convenience, accessibility, and a vast array of options. The rise of online purchasing platforms has increased the demand for streamlined and secure payment methods, leading to the development of innovative digital payment technologies.
Advancements in Mobile Payment Technologies
The rapid advancements in mobile payment technologies are another driving factor that has revolutionized the digital payment market. With the introduction of near-field communication (NFC), biometric authentication, and QR code scanning, mobile devices are now capable of facilitating secure and convenient digital payments. These advanced technologies have eliminated the need for traditional physical payment methods such as cash and credit cards, providing users with a more convenient and streamlined payment experience.
Expansion of Digital Banking and Financial Technology
The growth of digital banking and fintech solutions has been driving the expansion of the digital payment market. The digitization of financial processes has significantly transformed traditional banking services, allowing consumers to administer their accounts, transfer funds, and make payments online or via mobile applications. Digital banking's convenience and accessibility have attracted a large number of consumers, leading to an increase in demand for digital payment options.
Escalating Interest in Contactless and Secure Payment Options
The growing demand for contactless and secure payment options has been a major driving factor in the digital payment market. As consumers become more cognizant of the importance of security and pursue convenience in their transactions, the use of contactless payment methods has exploded in popularity. Contactless payments, facilitated by technologies such as NFC and QR codes, enable users to conduct transactions by tapping or scanning their mobile devices, eliminating the need for physical contact or the exchange of cash or cards.
Restraining Factors
Potential Compliance and Regulatory Requirements
Governments and regulatory agencies are acutely aware of the need to safeguard consumers and businesses from fraudulent activities and financial offenses. Different jurisdictions' stringent requirements can create entry barriers for digital payment service providers. Compliance with anti-money laundering (AML) and know-your-customer (KYC) regulations, for instance, may incur substantial administrative and operational expenses. These expenses can be passed on to users in the form of higher fees, which discourages adoption. To surmount these potential obstacles, industry participants should collaborate actively with regulatory bodies to develop policies that strike a balance between protecting users and fostering innovation.
Possible Infrastructure Restriction in Various Regions
In spite of the fact that digital payment technologies offer the promise of seamless transactions, infrastructure constraints in certain regions can hinder their widespread adoption. In developing nations and rural areas, insufficient internet connectivity and limited access to electricity can present significant obstacles.
To overcome these limitations, technological advances must be coupled with investments in infrastructure. In order to bridge the digital divide and enable the digital payment market to flourish in underserved areas, it is essential to construct broadband networks and expand the reach of electricity infrastructures. Collaboration with governments, telecommunications companies, and financial institutions is necessary to ensure the availability of the infrastructure required to support digital payment initiatives in all regions.
Solution Analysis
In recent years, the digital payment market has experienced significant growth, with the payment processing segment emerging as the industry's dominant force. This segment consists of various solutions that facilitate the authorization and processing of digital transactions. With a growing reliance on online purchasing and the widespread adoption of mobile payment applications, the payment processing segment has become an integral component of the digital payment ecosystem.
The economic development of emerging economies drives the adoption of payment processing solutions. These economies are growing rapidly and have a rapidly expanding middle class with rising disposable income. The demand for digital payment solutions, such as payment processing, has increased as these economies transition towards a cashless society. Government initiatives promoting digital transactions and financial inclusion in these regions provide additional support.
Deployment Mode Analysis
The payment processing segment dominates the digital payment market, but the on-premise segment is also a major participant in this industry. On-premise solutions are software and hardware installations that are managed and operated on the premises of an organization. Despite the development of cloud-based and SaaS (Software as a Service) solutions, many businesses still prefer on-premise deployments for their control and customization.
As businesses in these regions expand and scale their operations, they need payment solutions that are robust and scalable. On-premise deployments offer businesses the flexibility to tailor their payment infrastructure to their unique requirements while ensuring data security and compliance.
Mode of Payment Analysis
The point of sales (POS) segment dominates the digital payment market, offering solutions for in-person transactions. Card readers, mobile POS devices, and contactless payment terminals are included in these solutions. With the increasing integration of digital payment systems into brick-and-mortar stores, the POS segment has acquired considerable momentum.
The adoption of point-of-sale (POS) solutions is propelled by economic growth in emerging economies. As businesses in these regions expand and modernize their operations, they seek to provide customers with convenient payment methods. The incorporation of POS terminals enables seamless in-person transactions, eliminating the need for currency or conventional card payments.
Convenience and usability have a significant impact on consumer trends and behaviors toward POS solutions. In particular, contactless payments have gained widespread acceptance due to their rapidity and convenience. The ability to make payments by tapping a card or mobile device on a terminal has resonated with consumers all over the globe.
Key Market Segments
By Solution
- Application Program Interface
- Payment Gateway
- Payment Processing
- Payment Security & Fraud Management
- Other
By Deployment Mode
- Cloud-Based
- On-Premise
By Mode of Payment
- Bank Cards
- Digital Currencies
- Point of Sales
- Net Banking
- Other
By End-Use Industry
- BFSI
- Healthcare
- IT & Telecom
- Media & Entertainment
- Retail & E-commerce
- Other
Growth Opportunity
Implementation of Blockchain Technology for Safe and Efficient Transactions
In the financial sector, blockchain, the technology underlying cryptocurrencies, has surfaced as a game-changer. Blockchain has the potential to revolutionize digital payment by leveraging decentralization, transparency, and immutability. Integrating blockchain technology into digital payment solutions improves security, reduces transaction fees, eliminates middlemen, and facilitates settlements in near-real time. It has enormous potential for secure and efficient international transactions, particularly in emerging markets. With blockchain-based payment solutions, consumers and businesses can benefit from faster, more secure, and more cost-effective transactions, ultimately driving the growth of the digital payment market and further establishing it as the preferred method for conducting international transactions.
Adopting Artificial Intelligence and Machine Learning to Facilitate Personalized Payments
Artificial Intelligence (AI) and Machine Learning (ML) have become integral parts of many industries, including the digital payment industry. By leveraging the power of AI and ML algorithms, payment providers can offer personalized user experiences, individualized recommendations, and streamlined transaction processes. Utilizing these technologies, payment platforms are able to analyze immense quantities of consumer data, identify spending patterns, and provide relevant incentives and rewards. Additionally, AI-powered chatbots and voice-activated assistants facilitate customer service, expedite problem resolution, and increase user satisfaction.
Multi-factor Authentication and Biometrics Provide Enhanced Security
With cyberattacks and identity theft on the increase, it is crucial to implement robust security measures for digital payments. Advanced biometric technologies, such as fingerprint, facial recognition, and iris detection, are gradually replacing conventional password-based authentication methods. Biometric authentication increases security by supplying a unique, non-replicable identifier for each user. In addition, the combination of biometrics and multi-factor authentication adds an additional layer of security, making it considerably more difficult for fraudsters to compromise payment systems. By incorporating biometric authentication, digital payment providers can engender customer confidence, reduce fraud risk, and foster market growth as customers feel more secure conducting transactions.
Latest Trends
Demand for Contactless and Near Field Communication Payment Options
In recent years, contactless payment solutions have acquired significant traction and are experiencing unprecedented demand. With the rise of near-field communication (NFC) technology, consumers can now make payments by tapping their cards or mobile devices against contactless-enabled terminals. The ease and speed of contactless payments have increased their popularity, especially in retail settings where speedy transactions are essential.
NFC-based payments not only improve the user experience but also provide increased security. NFC technology employs encrypted communication, making it extremely secure and virtually impossible to counterfeit compared to traditional magnetic stripe cards, which can be easily duplicated. As a result, contactless payment solutions are gaining popularity among consumers and merchants around the globe.
Digital Payments Employing Blockchain and Cryptocurrencies
The use of blockchain technology in conjunction with traditional methods of payment, such as credit cards, is a growing trend. The decentralized and immutable nature of blockchain technology enhances the security, transparency, and efficacy of financial transactions. By eliminating the need for intermediaries, blockchain-based digital payments allow for speedier settlement times, lower costs, and improved privacy.
For digital transactions, cryptocurrencies such as Bitcoin and Ethereum have emerged as viable alternatives to traditional fiat currencies. These digital assets facilitate peer-to-peer transactions without the need for intermediaries, granting individuals greater financial autonomy.
Increase in QR Code and Scan-to-Pay Technologies
QR code payments have exploded in popularity, particularly in Asia, where they have become ubiquitous in daily transactions. By scanning a unique code displayed on a retailer's point-of-sale terminal, consumers can make payments using QR codes. This method eliminates the requirement for physical payment cards and simplifies the payment procedure for users.
Scan-to-pay methods offer numerous benefits, including usability, lower infrastructure requirements, and compatibility with a vast array of devices, such as smartphones and feature phones. In addition, QR code payments have made it possible for small businesses and street vendors to accept digital payments at a low cost, closing the financial inclusion gap and fostering economic development in developing economies.
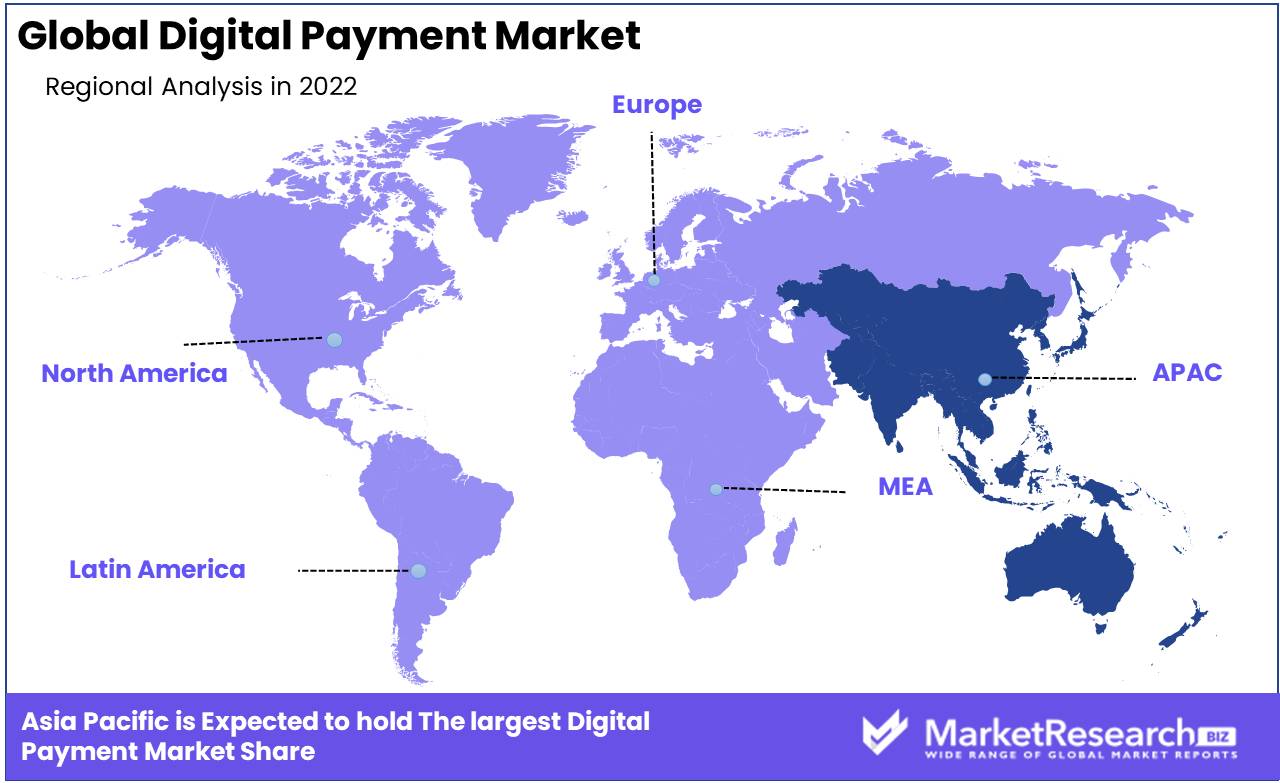
Regional Analysis
The Asia-Pacific region dominates the market for digital payments.
The Asia-Pacific region, which includes countries like China, Japan, India, Australia, and South Korea, is home to a large number of digitally literate consumers. As they offer convenience, security, and a seamless transaction experience, these consumers are increasingly employing digital payment methods. This change in consumer behavior has fueled the growth of digital payment providers, resulting in an increase in their market share.
The ubiquitous acceptance and usage of mobile wallets is one of the primary factors contributing to the dominance of the Asia-Pacific region's digital payment market. Mobile wallets have revolutionized the way in which individuals make payments, allowing them to complete transactions with their handsets with ease. The number of mobile wallet users in the region is staggering, with China dominating the pack. QR code payments, which have acquired immense popularity in China, have accelerated the adoption of mobile wallets in the country. The Asia-Pacific region has become a fertile ground for innovation and experimentation in the digital payment landscape due to its high mobile wallet penetration.
In addition to mobile wallets, the Asia-Pacific region is experiencing accelerated growth in the usage of other digital payment methods, such as online banking, peer-to-peer transfers, and contactless payments. Due to initiatives such as demonetization, countries like India have witnessed a significant transition from traditional cash-based transactions to digital payments. This has further accelerated the adoption of digital payment solutions, positioning the region as the global digital payment revolution's propelling force.
Moreover, government policies and initiatives geared at promoting cashless economies have been instrumental in propelling the Asia-Pacific region's dominance in the digital payment market. By providing incentives, subsidies, and tax benefits, governments throughout the region actively encourage businesses and consumers to adopt digital payment solutions. For instance, the Indian government's drive for a digital economy, through the introduction of initiatives like the Unified Payments Interface (UPI) and Aadhaar-enabled payment systems, has revolutionized the manner in which payments are made in the country. In addition to making digital payments more accessible, these efforts have created a thriving ecosystem for fintech startups, driving innovation and growth.
The dominance of digital payments in the Asia-Pacific region is strengthened by the presence of tech titans that are instrumental in influencing the market. Companies like Alibaba, Tencent, Samsung, and Google are actively investing and expanding their digital payment services in the region. The combination of their expertise and large user base has increased the adoption of digital payments and bolstered the region's position as a global leader.
Key Regions and Countries
North America
- US
- Canada
- Mexico
Western Europe
- Germany
- France
- The UK
- Spain
- Italy
- Portugal
- Ireland
- Austria
- Switzerland
- Benelux
- Nordic
- Rest of Western Europe
Eastern Europe
- Russia
- Poland
- The Czech Republic
- Greece
- Rest of Eastern Europe
APAC
- China
- Japan
- South Korea
- India
- Australia & New Zealand
- Indonesia
- Malaysia
- Philippines
- Singapore
- Thailand
- Vietnam
- Rest of APAC
Latin America
- Brazil
- Colombia
- Chile
- Argentina
- Costa Rica
- Rest of Latin America
Middle East & Africa
- Algeria
- Egypt
- Israel
- Kuwait
- Nigeria
- Saudi Arabia
- South Africa
- Turkey
- United Arab Emirates
- Rest of MEA
Key Players Analysis
The United States-based PayPal Holdings Inc is a global champion in online payment solutions. PayPal has established itself as a trusted and secure platform for digital transactions, with millions of active users and a strong presence in over 200 markets worldwide. Their platform enables users to transmit and receive online payments, facilitating transactions between businesses and individuals. Its dominance in the digital payment market can be attributed to PayPal's user-friendly interface, robust security measures, and expansive global reach.
Fiserv Inc., also headquartered in the United States, is a prominent provider of financial industry technology solutions. Fiserv has become a key participant in the digital payment market due to its vast array of offerings, which include digital payments, mobile banking, and electronic bill presentation. Their exhaustive suite of solutions is tailored to the requirements of financial institutions, enabling them to provide enhanced customer experiences and streamline payment processes.
Alipay, an Ant Group subsidiary, has emerged as one of China's dominant digital payment market participants. Alipay, which has a large user base and a strong presence in the largest consumer market in the world, has revolutionized the way transactions are conducted in China. Alipay provides a variety of services, including mobile payments, money transfers, and bill payments, through its user-friendly mobile app and seamless integration with numerous merchants.
Top Key Players in Digital Payment Market
- PayPal Holdings Inc (U.S.)
- Fiserv Inc (U.S.)
- Alipay (China)
- Apple Inc. (U.S.)
- LLC (U.S.)
- Visa (U.S.)
- Mastercard (U.S.)
- American Express (U.S.)
- Amazon Pay (U.S.)
- Aurus Inc. (U.S.)
- Adyen (Netherlands)
- Kakao Pay Corp (South Korea)
- Grab (India)
- Paytm (India)
- SAMSUNG (South Korea)
- UnionPay International (China)
- MercadoLibre S.R.L (Argentina)
- WeChat Pay (China)
- Financial Software and Systems Pvt. Ltd. (U.S.)
- Novatti Group Ltd (Australia)
Recent Development
- In 2023, Visa, one of the world's largest payment technology companies, announced its intention to acquire Plaid in a game-changing move. Plaid, a well-known provider of digital payment solutions, has risen to prominence due to its innovative technologies that facilitate secure connections between consumers' bank accounts and numerous digital applications.
- In 2022, Mastercard, a prominent global payment technology company, announced its plans to enhance its digital payment capabilities in an effort to capitalize on the immense potential of the Asia-Pacific region. With a continually expanding consumer base, accelerated digitization trends, and a growing middle class, the Asia-Pacific market presents Mastercard with a lucrative opportunity to expand its presence.
- In 2021, PayPal, the well-known digital payment platform, introduced a new product designed to empower businesses of all sizes. The launch of its new digital payment service seeks to provide a seamless and secure payment experience, catering specifically to the changing needs of merchants and businesses.
Report Scope:
Report Features Description Market Value (2022) USD 8,407.9 Bn Forecast Revenue (2032) USD 24,944.8 Bn CAGR (2023-2032) 11.8% Base Year for Estimation 2022 Historic Period 2016-2022 Forecast Period 2023-2032 Report Coverage Revenue Forecast, Market Dynamics, COVID-19 Impact, Competitive Landscape, Recent Developments Segments Covered By Solution(Application Program Interface, Payment Gateway, Other), By Deployment Mode, (Cloud Based, On-Premise), By Mode of Payment, (Bank Cards, Digital Currencies, Other), By End-Use Industry, (BFSI, Healthcare, Other) Regional Analysis North America – The US, Canada, & Mexico; Western Europe – Germany, France, The UK, Spain, Italy, Portugal, Ireland, Austria, Switzerland, Benelux, Nordic, & Rest of Western Europe; Eastern Europe – Russia, Poland, The Czech Republic, Greece, & Rest of Eastern Europe; APAC – China, Japan, South Korea, India, Australia & New Zealand, Indonesia, Malaysia, Philippines, Singapore, Thailand, Vietnam, & Rest of APAC; Latin America – Brazil, Colombia, Chile, Argentina, Costa Rica, & Rest of Latin America; Middle East & Africa – Algeria, Egypt, Israel, Kuwait, Nigeria, Saudi Arabia, South Africa, Turkey, United Arab Emirates, & Rest of MEA Competitive Landscape PayPal Holdings Inc (U.S.), Fiserv Inc (U.S.), Alipay (China), Apple Inc. (U.S.), Google, LLC (U.S.), Visa (U.S.), Mastercard (U.S.), American Express (U.S.), Amazon Pay (U.S.), Aurus Inc. (U.S.), Adyen (Netherlands), Kakao Pay Corp (South Korea), Grab (India), Paytm (India), SAMSUNG (South Korea), UnionPay International (China), MercadoLibre S.R.L (Argentina), WeChat Pay (China), Financial Software and Systems Pvt. Ltd. (U.S.), Novatti Group Ltd (Australia) Customization Scope Customization for segments, region/country-level will be provided. Moreover, additional customization can be done based on the requirements. Purchase Options We have three licenses to opt for: Single User License, Multi-User License (Up to 5 Users), Corporate Use License (Unlimited User and Printable PDF) -
- 1. Executive Summary
- 1.1. Definition
- 1.2. Taxonomy
- 1.3. Research Scope
- 1.4. Key Analysis
- 1.5. Key Findings by Major Segments
- 1.6. Top strategies by Major Players
- 2. Global Digital Payment Market Overview
- 2.1. Digital Payment Market Dynamics
- 2.1.1. Drivers
- 2.1.2. Opportunities
- 2.1.3. Restraints
- 2.1.4. Challenges
- 2.2. Macro-economic Factors
- 2.3. Regulatory Framework
- 2.4. Market Investment Feasibility Index
- 2.5. PEST Analysis
- 2.6. PORTER’S Five Force Analysis
- 2.7. Drivers & Restraints Impact Analysis
- 2.8. Industry Chain Analysis
- 2.9. Cost Structure Analysis
- 2.10. Marketing Strategy
- 2.11. Russia-Ukraine War Impact Analysis
- 2.12. Opportunity Map Analysis
- 2.13. Market Competition Scenario Analysis
- 2.14. Product Life Cycle Analysis
- 2.15. Opportunity Orbits
- 2.16. Manufacturer Intensity Map
- 2.17. Major Companies sales by Value & Volume
- 2.1. Digital Payment Market Dynamics
- 3. Global Digital Payment Market Analysis, Opportunity and Forecast, 2016-2032
- 3.1. Global Digital Payment Market Analysis, 2016-2021
- 3.2. Global Digital Payment Market Opportunity and Forecast, 2023-2032
- 3.3. Global Digital Payment Market Analysis, Opportunity and Forecast, By By Solution, 2016-2032
- 3.3.1. Global Digital Payment Market Analysis by By Solution: Introduction
- 3.3.2. Market Size Absolute $ Opportunity Analysis and Forecast, By By Solution, 2016-2032
- 3.3.3. Application Program Interface
- 3.3.4. Payment Gateway
- 3.3.5. Payment Processing
- 3.3.6. Payment Security & Fraud Management
- 3.3.7. Other
- 3.4. Global Digital Payment Market Analysis, Opportunity and Forecast, By By Deployment Mode, 2016-2032
- 3.4.1. Global Digital Payment Market Analysis by By Deployment Mode: Introduction
- 3.4.2. Market Size Absolute $ Opportunity Analysis and Forecast, By By Deployment Mode, 2016-2032
- 3.4.3. Cloud-Based
- 3.4.4. On-Premise
- 3.5. Global Digital Payment Market Analysis, Opportunity and Forecast, By By Mode of Payment, 2016-2032
- 3.5.1. Global Digital Payment Market Analysis by By Mode of Payment: Introduction
- 3.5.2. Market Size Absolute $ Opportunity Analysis and Forecast, By By Mode of Payment, 2016-2032
- 3.5.3. Bank Cards
- 3.5.4. Digital Currencies
- 3.5.5. Point of Sales
- 3.5.6. Net Banking
- 3.5.7. Other
- 3.6. Global Digital Payment Market Analysis, Opportunity and Forecast, By By End-Use Industry, 2016-2032
- 3.6.1. Global Digital Payment Market Analysis by By End-Use Industry: Introduction
- 3.6.2. Market Size Absolute $ Opportunity Analysis and Forecast, By By End-Use Industry, 2016-2032
- 3.6.3. BFSI
- 3.6.4. Healthcare
- 3.6.5. IT & Telecom
- 3.6.6. Media & Entertainment
- 3.6.7. Retail & E-commerce
- 3.6.8. Other
- 4. North America Digital Payment Market Analysis, Opportunity and Forecast, 2016-2032
- 4.1. North America Digital Payment Market Analysis, 2016-2021
- 4.2. North America Digital Payment Market Opportunity and Forecast, 2023-2032
- 4.3. North America Digital Payment Market Analysis, Opportunity and Forecast, By By Solution, 2016-2032
- 4.3.1. North America Digital Payment Market Analysis by By Solution: Introduction
- 4.3.2. Market Size Absolute $ Opportunity Analysis and Forecast, By By Solution, 2016-2032
- 4.3.3. Application Program Interface
- 4.3.4. Payment Gateway
- 4.3.5. Payment Processing
- 4.3.6. Payment Security & Fraud Management
- 4.3.7. Other
- 4.4. North America Digital Payment Market Analysis, Opportunity and Forecast, By By Deployment Mode, 2016-2032
- 4.4.1. North America Digital Payment Market Analysis by By Deployment Mode: Introduction
- 4.4.2. Market Size Absolute $ Opportunity Analysis and Forecast, By By Deployment Mode, 2016-2032
- 4.4.3. Cloud-Based
- 4.4.4. On-Premise
- 4.5. North America Digital Payment Market Analysis, Opportunity and Forecast, By By Mode of Payment, 2016-2032
- 4.5.1. North America Digital Payment Market Analysis by By Mode of Payment: Introduction
- 4.5.2. Market Size Absolute $ Opportunity Analysis and Forecast, By By Mode of Payment, 2016-2032
- 4.5.3. Bank Cards
- 4.5.4. Digital Currencies
- 4.5.5. Point of Sales
- 4.5.6. Net Banking
- 4.5.7. Other
- 4.6. North America Digital Payment Market Analysis, Opportunity and Forecast, By By End-Use Industry, 2016-2032
- 4.6.1. North America Digital Payment Market Analysis by By End-Use Industry: Introduction
- 4.6.2. Market Size Absolute $ Opportunity Analysis and Forecast, By By End-Use Industry, 2016-2032
- 4.6.3. BFSI
- 4.6.4. Healthcare
- 4.6.5. IT & Telecom
- 4.6.6. Media & Entertainment
- 4.6.7. Retail & E-commerce
- 4.6.8. Other
- 4.7. North America Digital Payment Market Analysis, Opportunity and Forecast, By Country , 2016-2032
- 4.7.1. North America Digital Payment Market Analysis by Country : Introduction
- 4.7.2. Market Size Absolute $ Opportunity Analysis and Forecast, Country , 2016-2032
- 4.7.2.1. The US
- 4.7.2.2. Canada
- 4.7.2.3. Mexico
- 5. Western Europe Digital Payment Market Analysis, Opportunity and Forecast, 2016-2032
- 5.1. Western Europe Digital Payment Market Analysis, 2016-2021
- 5.2. Western Europe Digital Payment Market Opportunity and Forecast, 2023-2032
- 5.3. Western Europe Digital Payment Market Analysis, Opportunity and Forecast, By By Solution, 2016-2032
- 5.3.1. Western Europe Digital Payment Market Analysis by By Solution: Introduction
- 5.3.2. Market Size Absolute $ Opportunity Analysis and Forecast, By By Solution, 2016-2032
- 5.3.3. Application Program Interface
- 5.3.4. Payment Gateway
- 5.3.5. Payment Processing
- 5.3.6. Payment Security & Fraud Management
- 5.3.7. Other
- 5.4. Western Europe Digital Payment Market Analysis, Opportunity and Forecast, By By Deployment Mode, 2016-2032
- 5.4.1. Western Europe Digital Payment Market Analysis by By Deployment Mode: Introduction
- 5.4.2. Market Size Absolute $ Opportunity Analysis and Forecast, By By Deployment Mode, 2016-2032
- 5.4.3. Cloud-Based
- 5.4.4. On-Premise
- 5.5. Western Europe Digital Payment Market Analysis, Opportunity and Forecast, By By Mode of Payment, 2016-2032
- 5.5.1. Western Europe Digital Payment Market Analysis by By Mode of Payment: Introduction
- 5.5.2. Market Size Absolute $ Opportunity Analysis and Forecast, By By Mode of Payment, 2016-2032
- 5.5.3. Bank Cards
- 5.5.4. Digital Currencies
- 5.5.5. Point of Sales
- 5.5.6. Net Banking
- 5.5.7. Other
- 5.6. Western Europe Digital Payment Market Analysis, Opportunity and Forecast, By By End-Use Industry, 2016-2032
- 5.6.1. Western Europe Digital Payment Market Analysis by By End-Use Industry: Introduction
- 5.6.2. Market Size Absolute $ Opportunity Analysis and Forecast, By By End-Use Industry, 2016-2032
- 5.6.3. BFSI
- 5.6.4. Healthcare
- 5.6.5. IT & Telecom
- 5.6.6. Media & Entertainment
- 5.6.7. Retail & E-commerce
- 5.6.8. Other
- 5.7. Western Europe Digital Payment Market Analysis, Opportunity and Forecast, By Country , 2016-2032
- 5.7.1. Western Europe Digital Payment Market Analysis by Country : Introduction
- 5.7.2. Market Size Absolute $ Opportunity Analysis and Forecast, Country , 2016-2032
- 5.7.2.1. Germany
- 5.7.2.2. France
- 5.7.2.3. The UK
- 5.7.2.4. Spain
- 5.7.2.5. Italy
- 5.7.2.6. Portugal
- 5.7.2.7. Ireland
- 5.7.2.8. Austria
- 5.7.2.9. Switzerland
- 5.7.2.10. Benelux
- 5.7.2.11. Nordic
- 5.7.2.12. Rest of Western Europe
- 6. Eastern Europe Digital Payment Market Analysis, Opportunity and Forecast, 2016-2032
- 6.1. Eastern Europe Digital Payment Market Analysis, 2016-2021
- 6.2. Eastern Europe Digital Payment Market Opportunity and Forecast, 2023-2032
- 6.3. Eastern Europe Digital Payment Market Analysis, Opportunity and Forecast, By By Solution, 2016-2032
- 6.3.1. Eastern Europe Digital Payment Market Analysis by By Solution: Introduction
- 6.3.2. Market Size Absolute $ Opportunity Analysis and Forecast, By By Solution, 2016-2032
- 6.3.3. Application Program Interface
- 6.3.4. Payment Gateway
- 6.3.5. Payment Processing
- 6.3.6. Payment Security & Fraud Management
- 6.3.7. Other
- 6.4. Eastern Europe Digital Payment Market Analysis, Opportunity and Forecast, By By Deployment Mode, 2016-2032
- 6.4.1. Eastern Europe Digital Payment Market Analysis by By Deployment Mode: Introduction
- 6.4.2. Market Size Absolute $ Opportunity Analysis and Forecast, By By Deployment Mode, 2016-2032
- 6.4.3. Cloud-Based
- 6.4.4. On-Premise
- 6.5. Eastern Europe Digital Payment Market Analysis, Opportunity and Forecast, By By Mode of Payment, 2016-2032
- 6.5.1. Eastern Europe Digital Payment Market Analysis by By Mode of Payment: Introduction
- 6.5.2. Market Size Absolute $ Opportunity Analysis and Forecast, By By Mode of Payment, 2016-2032
- 6.5.3. Bank Cards
- 6.5.4. Digital Currencies
- 6.5.5. Point of Sales
- 6.5.6. Net Banking
- 6.5.7. Other
- 6.6. Eastern Europe Digital Payment Market Analysis, Opportunity and Forecast, By By End-Use Industry, 2016-2032
- 6.6.1. Eastern Europe Digital Payment Market Analysis by By End-Use Industry: Introduction
- 6.6.2. Market Size Absolute $ Opportunity Analysis and Forecast, By By End-Use Industry, 2016-2032
- 6.6.3. BFSI
- 6.6.4. Healthcare
- 6.6.5. IT & Telecom
- 6.6.6. Media & Entertainment
- 6.6.7. Retail & E-commerce
- 6.6.8. Other
- 6.7. Eastern Europe Digital Payment Market Analysis, Opportunity and Forecast, By Country , 2016-2032
- 6.7.1. Eastern Europe Digital Payment Market Analysis by Country : Introduction
- 6.7.2. Market Size Absolute $ Opportunity Analysis and Forecast, Country , 2016-2032
- 6.7.2.1. Russia
- 6.7.2.2. Poland
- 6.7.2.3. The Czech Republic
- 6.7.2.4. Greece
- 6.7.2.5. Rest of Eastern Europe
- 7. APAC Digital Payment Market Analysis, Opportunity and Forecast, 2016-2032
- 7.1. APAC Digital Payment Market Analysis, 2016-2021
- 7.2. APAC Digital Payment Market Opportunity and Forecast, 2023-2032
- 7.3. APAC Digital Payment Market Analysis, Opportunity and Forecast, By By Solution, 2016-2032
- 7.3.1. APAC Digital Payment Market Analysis by By Solution: Introduction
- 7.3.2. Market Size Absolute $ Opportunity Analysis and Forecast, By By Solution, 2016-2032
- 7.3.3. Application Program Interface
- 7.3.4. Payment Gateway
- 7.3.5. Payment Processing
- 7.3.6. Payment Security & Fraud Management
- 7.3.7. Other
- 7.4. APAC Digital Payment Market Analysis, Opportunity and Forecast, By By Deployment Mode, 2016-2032
- 7.4.1. APAC Digital Payment Market Analysis by By Deployment Mode: Introduction
- 7.4.2. Market Size Absolute $ Opportunity Analysis and Forecast, By By Deployment Mode, 2016-2032
- 7.4.3. Cloud-Based
- 7.4.4. On-Premise
- 7.5. APAC Digital Payment Market Analysis, Opportunity and Forecast, By By Mode of Payment, 2016-2032
- 7.5.1. APAC Digital Payment Market Analysis by By Mode of Payment: Introduction
- 7.5.2. Market Size Absolute $ Opportunity Analysis and Forecast, By By Mode of Payment, 2016-2032
- 7.5.3. Bank Cards
- 7.5.4. Digital Currencies
- 7.5.5. Point of Sales
- 7.5.6. Net Banking
- 7.5.7. Other
- 7.6. APAC Digital Payment Market Analysis, Opportunity and Forecast, By By End-Use Industry, 2016-2032
- 7.6.1. APAC Digital Payment Market Analysis by By End-Use Industry: Introduction
- 7.6.2. Market Size Absolute $ Opportunity Analysis and Forecast, By By End-Use Industry, 2016-2032
- 7.6.3. BFSI
- 7.6.4. Healthcare
- 7.6.5. IT & Telecom
- 7.6.6. Media & Entertainment
- 7.6.7. Retail & E-commerce
- 7.6.8. Other
- 7.7. APAC Digital Payment Market Analysis, Opportunity and Forecast, By Country , 2016-2032
- 7.7.1. APAC Digital Payment Market Analysis by Country : Introduction
- 7.7.2. Market Size Absolute $ Opportunity Analysis and Forecast, Country , 2016-2032
- 7.7.2.1. China
- 7.7.2.2. Japan
- 7.7.2.3. South Korea
- 7.7.2.4. India
- 7.7.2.5. Australia & New Zeland
- 7.7.2.6. Indonesia
- 7.7.2.7. Malaysia
- 7.7.2.8. Philippines
- 7.7.2.9. Singapore
- 7.7.2.10. Thailand
- 7.7.2.11. Vietnam
- 7.7.2.12. Rest of APAC
- 8. Latin America Digital Payment Market Analysis, Opportunity and Forecast, 2016-2032
- 8.1. Latin America Digital Payment Market Analysis, 2016-2021
- 8.2. Latin America Digital Payment Market Opportunity and Forecast, 2023-2032
- 8.3. Latin America Digital Payment Market Analysis, Opportunity and Forecast, By By Solution, 2016-2032
- 8.3.1. Latin America Digital Payment Market Analysis by By Solution: Introduction
- 8.3.2. Market Size Absolute $ Opportunity Analysis and Forecast, By By Solution, 2016-2032
- 8.3.3. Application Program Interface
- 8.3.4. Payment Gateway
- 8.3.5. Payment Processing
- 8.3.6. Payment Security & Fraud Management
- 8.3.7. Other
- 8.4. Latin America Digital Payment Market Analysis, Opportunity and Forecast, By By Deployment Mode, 2016-2032
- 8.4.1. Latin America Digital Payment Market Analysis by By Deployment Mode: Introduction
- 8.4.2. Market Size Absolute $ Opportunity Analysis and Forecast, By By Deployment Mode, 2016-2032
- 8.4.3. Cloud-Based
- 8.4.4. On-Premise
- 8.5. Latin America Digital Payment Market Analysis, Opportunity and Forecast, By By Mode of Payment, 2016-2032
- 8.5.1. Latin America Digital Payment Market Analysis by By Mode of Payment: Introduction
- 8.5.2. Market Size Absolute $ Opportunity Analysis and Forecast, By By Mode of Payment, 2016-2032
- 8.5.3. Bank Cards
- 8.5.4. Digital Currencies
- 8.5.5. Point of Sales
- 8.5.6. Net Banking
- 8.5.7. Other
- 8.6. Latin America Digital Payment Market Analysis, Opportunity and Forecast, By By End-Use Industry, 2016-2032
- 8.6.1. Latin America Digital Payment Market Analysis by By End-Use Industry: Introduction
- 8.6.2. Market Size Absolute $ Opportunity Analysis and Forecast, By By End-Use Industry, 2016-2032
- 8.6.3. BFSI
- 8.6.4. Healthcare
- 8.6.5. IT & Telecom
- 8.6.6. Media & Entertainment
- 8.6.7. Retail & E-commerce
- 8.6.8. Other
- 8.7. Latin America Digital Payment Market Analysis, Opportunity and Forecast, By Country , 2016-2032
- 8.7.1. Latin America Digital Payment Market Analysis by Country : Introduction
- 8.7.2. Market Size Absolute $ Opportunity Analysis and Forecast, Country , 2016-2032
- 8.7.2.1. Brazil
- 8.7.2.2. Colombia
- 8.7.2.3. Chile
- 8.7.2.4. Argentina
- 8.7.2.5. Costa Rica
- 8.7.2.6. Rest of Latin America
- 9. Middle East & Africa Digital Payment Market Analysis, Opportunity and Forecast, 2016-2032
- 9.1. Middle East & Africa Digital Payment Market Analysis, 2016-2021
- 9.2. Middle East & Africa Digital Payment Market Opportunity and Forecast, 2023-2032
- 9.3. Middle East & Africa Digital Payment Market Analysis, Opportunity and Forecast, By By Solution, 2016-2032
- 9.3.1. Middle East & Africa Digital Payment Market Analysis by By Solution: Introduction
- 9.3.2. Market Size Absolute $ Opportunity Analysis and Forecast, By By Solution, 2016-2032
- 9.3.3. Application Program Interface
- 9.3.4. Payment Gateway
- 9.3.5. Payment Processing
- 9.3.6. Payment Security & Fraud Management
- 9.3.7. Other
- 9.4. Middle East & Africa Digital Payment Market Analysis, Opportunity and Forecast, By By Deployment Mode, 2016-2032
- 9.4.1. Middle East & Africa Digital Payment Market Analysis by By Deployment Mode: Introduction
- 9.4.2. Market Size Absolute $ Opportunity Analysis and Forecast, By By Deployment Mode, 2016-2032
- 9.4.3. Cloud-Based
- 9.4.4. On-Premise
- 9.5. Middle East & Africa Digital Payment Market Analysis, Opportunity and Forecast, By By Mode of Payment, 2016-2032
- 9.5.1. Middle East & Africa Digital Payment Market Analysis by By Mode of Payment: Introduction
- 9.5.2. Market Size Absolute $ Opportunity Analysis and Forecast, By By Mode of Payment, 2016-2032
- 9.5.3. Bank Cards
- 9.5.4. Digital Currencies
- 9.5.5. Point of Sales
- 9.5.6. Net Banking
- 9.5.7. Other
- 9.6. Middle East & Africa Digital Payment Market Analysis, Opportunity and Forecast, By By End-Use Industry, 2016-2032
- 9.6.1. Middle East & Africa Digital Payment Market Analysis by By End-Use Industry: Introduction
- 9.6.2. Market Size Absolute $ Opportunity Analysis and Forecast, By By End-Use Industry, 2016-2032
- 9.6.3. BFSI
- 9.6.4. Healthcare
- 9.6.5. IT & Telecom
- 9.6.6. Media & Entertainment
- 9.6.7. Retail & E-commerce
- 9.6.8. Other
- 9.7. Middle East & Africa Digital Payment Market Analysis, Opportunity and Forecast, By Country , 2016-2032
- 9.7.1. Middle East & Africa Digital Payment Market Analysis by Country : Introduction
- 9.7.2. Market Size Absolute $ Opportunity Analysis and Forecast, Country , 2016-2032
- 9.7.2.1. Algeria
- 9.7.2.2. Egypt
- 9.7.2.3. Israel
- 9.7.2.4. Kuwait
- 9.7.2.5. Nigeria
- 9.7.2.6. Saudi Arabia
- 9.7.2.7. South Africa
- 9.7.2.8. Turkey
- 9.7.2.9. The UAE
- 9.7.2.10. Rest of MEA
- 10. Global Digital Payment Market Analysis, Opportunity and Forecast, By Region , 2016-2032
- 10.1. Global Digital Payment Market Analysis by Region : Introduction
- 10.2. Market Size Absolute $ Opportunity Analysis and Forecast, By Region , 2016-2032
- 10.2.1. North America
- 10.2.2. Western Europe
- 10.2.3. Eastern Europe
- 10.2.4. APAC
- 10.2.5. Latin America
- 10.2.6. Middle East & Africa
- 11. Global Digital Payment Market Competitive Landscape, Market Share Analysis, and Company Profiles
- 11.1. Market Share Analysis
- 11.2. Company Profiles
- 11.3. PayPal Holdings Inc (U.S.)
- 11.3.1. Company Overview
- 11.3.2. Financial Highlights
- 11.3.3. Product Portfolio
- 11.3.4. SWOT Analysis
- 11.3.5. Key Strategies and Developments
- 11.4. Fiserv Inc (U.S.)
- 11.4.1. Company Overview
- 11.4.2. Financial Highlights
- 11.4.3. Product Portfolio
- 11.4.4. SWOT Analysis
- 11.4.5. Key Strategies and Developments
- 11.5. Alipay (China)
- 11.5.1. Company Overview
- 11.5.2. Financial Highlights
- 11.5.3. Product Portfolio
- 11.5.4. SWOT Analysis
- 11.5.5. Key Strategies and Developments
- 11.6. Apple Inc. (U.S.)
- 11.6.1. Company Overview
- 11.6.2. Financial Highlights
- 11.6.3. Product Portfolio
- 11.6.4. SWOT Analysis
- 11.6.5. Key Strategies and Developments
- 11.7. Google
- 11.7.1. Company Overview
- 11.7.2. Financial Highlights
- 11.7.3. Product Portfolio
- 11.7.4. SWOT Analysis
- 11.7.5. Key Strategies and Developments
- 11.8. LLC (U.S.)
- 11.8.1. Company Overview
- 11.8.2. Financial Highlights
- 11.8.3. Product Portfolio
- 11.8.4. SWOT Analysis
- 11.8.5. Key Strategies and Developments
- 11.9. Visa (U.S.)
- 11.9.1. Company Overview
- 11.9.2. Financial Highlights
- 11.9.3. Product Portfolio
- 11.9.4. SWOT Analysis
- 11.9.5. Key Strategies and Developments
- 11.10. Mastercard (U.S.)
- 11.10.1. Company Overview
- 11.10.2. Financial Highlights
- 11.10.3. Product Portfolio
- 11.10.4. SWOT Analysis
- 11.10.5. Key Strategies and Developments
- 11.11. American Express (U.S.)
- 11.11.1. Company Overview
- 11.11.2. Financial Highlights
- 11.11.3. Product Portfolio
- 11.11.4. SWOT Analysis
- 11.11.5. Key Strategies and Developments
- 11.12. Amazon Pay (U.S.)
- 11.12.1. Company Overview
- 11.12.2. Financial Highlights
- 11.12.3. Product Portfolio
- 11.12.4. SWOT Analysis
- 11.12.5. Key Strategies and Developments
- 11.13. Aurus Inc. (U.S.)
- 11.13.1. Company Overview
- 11.13.2. Financial Highlights
- 11.13.3. Product Portfolio
- 11.13.4. SWOT Analysis
- 11.13.5. Key Strategies and Developments
- 11.14. Adyen (Netherlands)
- 11.14.1. Company Overview
- 11.14.2. Financial Highlights
- 11.14.3. Product Portfolio
- 11.14.4. SWOT Analysis
- 11.14.5. Key Strategies and Developments
- 11.15. Kakao Pay Corp (South Korea)
- 11.15.1. Company Overview
- 11.15.2. Financial Highlights
- 11.15.3. Product Portfolio
- 11.15.4. SWOT Analysis
- 11.15.5. Key Strategies and Developments
- 11.16. Grab (India)
- 11.16.1. Company Overview
- 11.16.2. Financial Highlights
- 11.16.3. Product Portfolio
- 11.16.4. SWOT Analysis
- 11.16.5. Key Strategies and Developments
- 11.17. Paytm (India)
- 11.17.1. Company Overview
- 11.17.2. Financial Highlights
- 11.17.3. Product Portfolio
- 11.17.4. SWOT Analysis
- 11.17.5. Key Strategies and Developments
- 11.18. SAMSUNG (South Korea)
- 11.18.1. Company Overview
- 11.18.2. Financial Highlights
- 11.18.3. Product Portfolio
- 11.18.4. SWOT Analysis
- 11.18.5. Key Strategies and Developments
- 11.19. UnionPay International (China)
- 11.19.1. Company Overview
- 11.19.2. Financial Highlights
- 11.19.3. Product Portfolio
- 11.19.4. SWOT Analysis
- 11.19.5. Key Strategies and Developments
- 11.20. MercadoLibre S.R.L (Argentina)
- 11.20.1. Company Overview
- 11.20.2. Financial Highlights
- 11.20.3. Product Portfolio
- 11.20.4. SWOT Analysis
- 11.20.5. Key Strategies and Developments
- 11.21. WeChat Pay (China)
- 11.21.1. Company Overview
- 11.21.2. Financial Highlights
- 11.21.3. Product Portfolio
- 11.21.4. SWOT Analysis
- 11.21.5. Key Strategies and Developments
- 11.22. Financial Software and Systems Pvt. Ltd. (U.S.)
- 11.22.1. Company Overview
- 11.22.2. Financial Highlights
- 11.22.3. Product Portfolio
- 11.22.4. SWOT Analysis
- 11.22.5. Key Strategies and Developments
- 12. Assumptions and Acronyms
- 13. Research Methodology
- 14. Contact
List of Figures
-
- Figure 1: Global Digital Payment Market Revenue (US$ Mn) Market Share by Solution in 2022
- Figure 2: Global Digital Payment Market Attractiveness Analysis by Solution, 2016-2032
- Figure 3: Global Digital Payment Market Revenue (US$ Mn) Market Share by Deployment Modein 2022
- Figure 4: Global Digital Payment Market Attractiveness Analysis by Deployment Mode, 2016-2032
- Figure 5: Global Digital Payment Market Revenue (US$ Mn) Market Share by Mode of Paymentin 2022
- Figure 6: Global Digital Payment Market Attractiveness Analysis by Mode of Payment, 2016-2032
- Figure 7: Global Digital Payment Market Revenue (US$ Mn) Market Share by End-Use Industryin 2022
- Figure 8: Global Digital Payment Market Attractiveness Analysis by End-Use Industry, 2016-2032
- Figure 9: Global Digital Payment Market Revenue (US$ Mn) Market Share by Region in 2022
- Figure 10: Global Digital Payment Market Attractiveness Analysis by Region, 2016-2032
- Figure 11: Global Digital Payment Market Revenue (US$ Mn) (2016-2032)
- Figure 12: Global Digital Payment Market Revenue (US$ Mn) Comparison by Region (2016-2032)
- Figure 13: Global Digital Payment Market Revenue (US$ Mn) Comparison by Solution (2016-2032)
- Figure 14: Global Digital Payment Market Revenue (US$ Mn) Comparison by Deployment Mode (2016-2032)
- Figure 15: Global Digital Payment Market Revenue (US$ Mn) Comparison by Mode of Payment (2016-2032)
- Figure 16: Global Digital Payment Market Revenue (US$ Mn) Comparison by End-Use Industry (2016-2032)
- Figure 17: Global Digital Payment Market Y-o-Y Growth Rate Comparison by Region (2016-2032)
- Figure 18: Global Digital Payment Market Y-o-Y Growth Rate Comparison by Solution (2016-2032)
- Figure 19: Global Digital Payment Market Y-o-Y Growth Rate Comparison by Deployment Mode (2016-2032)
- Figure 20: Global Digital Payment Market Y-o-Y Growth Rate Comparison by Mode of Payment (2016-2032)
- Figure 21: Global Digital Payment Market Y-o-Y Growth Rate Comparison by End-Use Industry (2016-2032)
- Figure 22: Global Digital Payment Market Share Comparison by Region (2016-2032)
- Figure 23: Global Digital Payment Market Share Comparison by Solution (2016-2032)
- Figure 24: Global Digital Payment Market Share Comparison by Deployment Mode (2016-2032)
- Figure 25: Global Digital Payment Market Share Comparison by Mode of Payment (2016-2032)
- Figure 26: Global Digital Payment Market Share Comparison by End-Use Industry (2016-2032)
- Figure 27: North America Digital Payment Market Revenue (US$ Mn) Market Share by Solutionin 2022
- Figure 28: North America Digital Payment Market Attractiveness Analysis by Solution, 2016-2032
- Figure 29: North America Digital Payment Market Revenue (US$ Mn) Market Share by Deployment Modein 2022
- Figure 30: North America Digital Payment Market Attractiveness Analysis by Deployment Mode, 2016-2032
- Figure 31: North America Digital Payment Market Revenue (US$ Mn) Market Share by Mode of Paymentin 2022
- Figure 32: North America Digital Payment Market Attractiveness Analysis by Mode of Payment, 2016-2032
- Figure 33: North America Digital Payment Market Revenue (US$ Mn) Market Share by End-Use Industryin 2022
- Figure 34: North America Digital Payment Market Attractiveness Analysis by End-Use Industry, 2016-2032
- Figure 35: North America Digital Payment Market Revenue (US$ Mn) Market Share by Country in 2022
- Figure 36: North America Digital Payment Market Attractiveness Analysis by Country, 2016-2032
- Figure 37: North America Digital Payment Market Revenue (US$ Mn) (2016-2032)
- Figure 38: North America Digital Payment Market Revenue (US$ Mn) Comparison by Country (2016-2032)
- Figure 39: North America Digital Payment Market Revenue (US$ Mn) Comparison by Solution (2016-2032)
- Figure 40: North America Digital Payment Market Revenue (US$ Mn) Comparison by Deployment Mode (2016-2032)
- Figure 41: North America Digital Payment Market Revenue (US$ Mn) Comparison by Mode of Payment (2016-2032)
- Figure 42: North America Digital Payment Market Revenue (US$ Mn) Comparison by End-Use Industry (2016-2032)
- Figure 43: North America Digital Payment Market Y-o-Y Growth Rate Comparison by Country (2016-2032)
- Figure 44: North America Digital Payment Market Y-o-Y Growth Rate Comparison by Solution (2016-2032)
- Figure 45: North America Digital Payment Market Y-o-Y Growth Rate Comparison by Deployment Mode (2016-2032)
- Figure 46: North America Digital Payment Market Y-o-Y Growth Rate Comparison by Mode of Payment (2016-2032)
- Figure 47: North America Digital Payment Market Y-o-Y Growth Rate Comparison by End-Use Industry (2016-2032)
- Figure 48: North America Digital Payment Market Share Comparison by Country (2016-2032)
- Figure 49: North America Digital Payment Market Share Comparison by Solution (2016-2032)
- Figure 50: North America Digital Payment Market Share Comparison by Deployment Mode (2016-2032)
- Figure 51: North America Digital Payment Market Share Comparison by Mode of Payment (2016-2032)
- Figure 52: North America Digital Payment Market Share Comparison by End-Use Industry (2016-2032)
- Figure 53: Western Europe Digital Payment Market Revenue (US$ Mn) Market Share by Solutionin 2022
- Figure 54: Western Europe Digital Payment Market Attractiveness Analysis by Solution, 2016-2032
- Figure 55: Western Europe Digital Payment Market Revenue (US$ Mn) Market Share by Deployment Modein 2022
- Figure 56: Western Europe Digital Payment Market Attractiveness Analysis by Deployment Mode, 2016-2032
- Figure 57: Western Europe Digital Payment Market Revenue (US$ Mn) Market Share by Mode of Paymentin 2022
- Figure 58: Western Europe Digital Payment Market Attractiveness Analysis by Mode of Payment, 2016-2032
- Figure 59: Western Europe Digital Payment Market Revenue (US$ Mn) Market Share by End-Use Industryin 2022
- Figure 60: Western Europe Digital Payment Market Attractiveness Analysis by End-Use Industry, 2016-2032
- Figure 61: Western Europe Digital Payment Market Revenue (US$ Mn) Market Share by Country in 2022
- Figure 62: Western Europe Digital Payment Market Attractiveness Analysis by Country, 2016-2032
- Figure 63: Western Europe Digital Payment Market Revenue (US$ Mn) (2016-2032)
- Figure 64: Western Europe Digital Payment Market Revenue (US$ Mn) Comparison by Country (2016-2032)
- Figure 65: Western Europe Digital Payment Market Revenue (US$ Mn) Comparison by Solution (2016-2032)
- Figure 66: Western Europe Digital Payment Market Revenue (US$ Mn) Comparison by Deployment Mode (2016-2032)
- Figure 67: Western Europe Digital Payment Market Revenue (US$ Mn) Comparison by Mode of Payment (2016-2032)
- Figure 68: Western Europe Digital Payment Market Revenue (US$ Mn) Comparison by End-Use Industry (2016-2032)
- Figure 69: Western Europe Digital Payment Market Y-o-Y Growth Rate Comparison by Country (2016-2032)
- Figure 70: Western Europe Digital Payment Market Y-o-Y Growth Rate Comparison by Solution (2016-2032)
- Figure 71: Western Europe Digital Payment Market Y-o-Y Growth Rate Comparison by Deployment Mode (2016-2032)
- Figure 72: Western Europe Digital Payment Market Y-o-Y Growth Rate Comparison by Mode of Payment (2016-2032)
- Figure 73: Western Europe Digital Payment Market Y-o-Y Growth Rate Comparison by End-Use Industry (2016-2032)
- Figure 74: Western Europe Digital Payment Market Share Comparison by Country (2016-2032)
- Figure 75: Western Europe Digital Payment Market Share Comparison by Solution (2016-2032)
- Figure 76: Western Europe Digital Payment Market Share Comparison by Deployment Mode (2016-2032)
- Figure 77: Western Europe Digital Payment Market Share Comparison by Mode of Payment (2016-2032)
- Figure 78: Western Europe Digital Payment Market Share Comparison by End-Use Industry (2016-2032)
- Figure 79: Eastern Europe Digital Payment Market Revenue (US$ Mn) Market Share by Solutionin 2022
- Figure 80: Eastern Europe Digital Payment Market Attractiveness Analysis by Solution, 2016-2032
- Figure 81: Eastern Europe Digital Payment Market Revenue (US$ Mn) Market Share by Deployment Modein 2022
- Figure 82: Eastern Europe Digital Payment Market Attractiveness Analysis by Deployment Mode, 2016-2032
- Figure 83: Eastern Europe Digital Payment Market Revenue (US$ Mn) Market Share by Mode of Paymentin 2022
- Figure 84: Eastern Europe Digital Payment Market Attractiveness Analysis by Mode of Payment, 2016-2032
- Figure 85: Eastern Europe Digital Payment Market Revenue (US$ Mn) Market Share by End-Use Industryin 2022
- Figure 86: Eastern Europe Digital Payment Market Attractiveness Analysis by End-Use Industry, 2016-2032
- Figure 87: Eastern Europe Digital Payment Market Revenue (US$ Mn) Market Share by Country in 2022
- Figure 88: Eastern Europe Digital Payment Market Attractiveness Analysis by Country, 2016-2032
- Figure 89: Eastern Europe Digital Payment Market Revenue (US$ Mn) (2016-2032)
- Figure 90: Eastern Europe Digital Payment Market Revenue (US$ Mn) Comparison by Country (2016-2032)
- Figure 91: Eastern Europe Digital Payment Market Revenue (US$ Mn) Comparison by Solution (2016-2032)
- Figure 92: Eastern Europe Digital Payment Market Revenue (US$ Mn) Comparison by Deployment Mode (2016-2032)
- Figure 93: Eastern Europe Digital Payment Market Revenue (US$ Mn) Comparison by Mode of Payment (2016-2032)
- Figure 94: Eastern Europe Digital Payment Market Revenue (US$ Mn) Comparison by End-Use Industry (2016-2032)
- Figure 95: Eastern Europe Digital Payment Market Y-o-Y Growth Rate Comparison by Country (2016-2032)
- Figure 96: Eastern Europe Digital Payment Market Y-o-Y Growth Rate Comparison by Solution (2016-2032)
- Figure 97: Eastern Europe Digital Payment Market Y-o-Y Growth Rate Comparison by Deployment Mode (2016-2032)
- Figure 98: Eastern Europe Digital Payment Market Y-o-Y Growth Rate Comparison by Mode of Payment (2016-2032)
- Figure 99: Eastern Europe Digital Payment Market Y-o-Y Growth Rate Comparison by End-Use Industry (2016-2032)
- Figure 100: Eastern Europe Digital Payment Market Share Comparison by Country (2016-2032)
- Figure 101: Eastern Europe Digital Payment Market Share Comparison by Solution (2016-2032)
- Figure 102: Eastern Europe Digital Payment Market Share Comparison by Deployment Mode (2016-2032)
- Figure 103: Eastern Europe Digital Payment Market Share Comparison by Mode of Payment (2016-2032)
- Figure 104: Eastern Europe Digital Payment Market Share Comparison by End-Use Industry (2016-2032)
- Figure 105: APAC Digital Payment Market Revenue (US$ Mn) Market Share by Solutionin 2022
- Figure 106: APAC Digital Payment Market Attractiveness Analysis by Solution, 2016-2032
- Figure 107: APAC Digital Payment Market Revenue (US$ Mn) Market Share by Deployment Modein 2022
- Figure 108: APAC Digital Payment Market Attractiveness Analysis by Deployment Mode, 2016-2032
- Figure 109: APAC Digital Payment Market Revenue (US$ Mn) Market Share by Mode of Paymentin 2022
- Figure 110: APAC Digital Payment Market Attractiveness Analysis by Mode of Payment, 2016-2032
- Figure 111: APAC Digital Payment Market Revenue (US$ Mn) Market Share by End-Use Industryin 2022
- Figure 112: APAC Digital Payment Market Attractiveness Analysis by End-Use Industry, 2016-2032
- Figure 113: APAC Digital Payment Market Revenue (US$ Mn) Market Share by Country in 2022
- Figure 114: APAC Digital Payment Market Attractiveness Analysis by Country, 2016-2032
- Figure 115: APAC Digital Payment Market Revenue (US$ Mn) (2016-2032)
- Figure 116: APAC Digital Payment Market Revenue (US$ Mn) Comparison by Country (2016-2032)
- Figure 117: APAC Digital Payment Market Revenue (US$ Mn) Comparison by Solution (2016-2032)
- Figure 118: APAC Digital Payment Market Revenue (US$ Mn) Comparison by Deployment Mode (2016-2032)
- Figure 119: APAC Digital Payment Market Revenue (US$ Mn) Comparison by Mode of Payment (2016-2032)
- Figure 120: APAC Digital Payment Market Revenue (US$ Mn) Comparison by End-Use Industry (2016-2032)
- Figure 121: APAC Digital Payment Market Y-o-Y Growth Rate Comparison by Country (2016-2032)
- Figure 122: APAC Digital Payment Market Y-o-Y Growth Rate Comparison by Solution (2016-2032)
- Figure 123: APAC Digital Payment Market Y-o-Y Growth Rate Comparison by Deployment Mode (2016-2032)
- Figure 124: APAC Digital Payment Market Y-o-Y Growth Rate Comparison by Mode of Payment (2016-2032)
- Figure 125: APAC Digital Payment Market Y-o-Y Growth Rate Comparison by End-Use Industry (2016-2032)
- Figure 126: APAC Digital Payment Market Share Comparison by Country (2016-2032)
- Figure 127: APAC Digital Payment Market Share Comparison by Solution (2016-2032)
- Figure 128: APAC Digital Payment Market Share Comparison by Deployment Mode (2016-2032)
- Figure 129: APAC Digital Payment Market Share Comparison by Mode of Payment (2016-2032)
- Figure 130: APAC Digital Payment Market Share Comparison by End-Use Industry (2016-2032)
- Figure 131: Latin America Digital Payment Market Revenue (US$ Mn) Market Share by Solutionin 2022
- Figure 132: Latin America Digital Payment Market Attractiveness Analysis by Solution, 2016-2032
- Figure 133: Latin America Digital Payment Market Revenue (US$ Mn) Market Share by Deployment Modein 2022
- Figure 134: Latin America Digital Payment Market Attractiveness Analysis by Deployment Mode, 2016-2032
- Figure 135: Latin America Digital Payment Market Revenue (US$ Mn) Market Share by Mode of Paymentin 2022
- Figure 136: Latin America Digital Payment Market Attractiveness Analysis by Mode of Payment, 2016-2032
- Figure 137: Latin America Digital Payment Market Revenue (US$ Mn) Market Share by End-Use Industryin 2022
- Figure 138: Latin America Digital Payment Market Attractiveness Analysis by End-Use Industry, 2016-2032
- Figure 139: Latin America Digital Payment Market Revenue (US$ Mn) Market Share by Country in 2022
- Figure 140: Latin America Digital Payment Market Attractiveness Analysis by Country, 2016-2032
- Figure 141: Latin America Digital Payment Market Revenue (US$ Mn) (2016-2032)
- Figure 142: Latin America Digital Payment Market Revenue (US$ Mn) Comparison by Country (2016-2032)
- Figure 143: Latin America Digital Payment Market Revenue (US$ Mn) Comparison by Solution (2016-2032)
- Figure 144: Latin America Digital Payment Market Revenue (US$ Mn) Comparison by Deployment Mode (2016-2032)
- Figure 145: Latin America Digital Payment Market Revenue (US$ Mn) Comparison by Mode of Payment (2016-2032)
- Figure 146: Latin America Digital Payment Market Revenue (US$ Mn) Comparison by End-Use Industry (2016-2032)
- Figure 147: Latin America Digital Payment Market Y-o-Y Growth Rate Comparison by Country (2016-2032)
- Figure 148: Latin America Digital Payment Market Y-o-Y Growth Rate Comparison by Solution (2016-2032)
- Figure 149: Latin America Digital Payment Market Y-o-Y Growth Rate Comparison by Deployment Mode (2016-2032)
- Figure 150: Latin America Digital Payment Market Y-o-Y Growth Rate Comparison by Mode of Payment (2016-2032)
- Figure 151: Latin America Digital Payment Market Y-o-Y Growth Rate Comparison by End-Use Industry (2016-2032)
- Figure 152: Latin America Digital Payment Market Share Comparison by Country (2016-2032)
- Figure 153: Latin America Digital Payment Market Share Comparison by Solution (2016-2032)
- Figure 154: Latin America Digital Payment Market Share Comparison by Deployment Mode (2016-2032)
- Figure 155: Latin America Digital Payment Market Share Comparison by Mode of Payment (2016-2032)
- Figure 156: Latin America Digital Payment Market Share Comparison by End-Use Industry (2016-2032)
- Figure 157: Middle East & Africa Digital Payment Market Revenue (US$ Mn) Market Share by Solutionin 2022
- Figure 158: Middle East & Africa Digital Payment Market Attractiveness Analysis by Solution, 2016-2032
- Figure 159: Middle East & Africa Digital Payment Market Revenue (US$ Mn) Market Share by Deployment Modein 2022
- Figure 160: Middle East & Africa Digital Payment Market Attractiveness Analysis by Deployment Mode, 2016-2032
- Figure 161: Middle East & Africa Digital Payment Market Revenue (US$ Mn) Market Share by Mode of Paymentin 2022
- Figure 162: Middle East & Africa Digital Payment Market Attractiveness Analysis by Mode of Payment, 2016-2032
- Figure 163: Middle East & Africa Digital Payment Market Revenue (US$ Mn) Market Share by End-Use Industryin 2022
- Figure 164: Middle East & Africa Digital Payment Market Attractiveness Analysis by End-Use Industry, 2016-2032
- Figure 165: Middle East & Africa Digital Payment Market Revenue (US$ Mn) Market Share by Country in 2022
- Figure 166: Middle East & Africa Digital Payment Market Attractiveness Analysis by Country, 2016-2032
- Figure 167: Middle East & Africa Digital Payment Market Revenue (US$ Mn) (2016-2032)
- Figure 168: Middle East & Africa Digital Payment Market Revenue (US$ Mn) Comparison by Country (2016-2032)
- Figure 169: Middle East & Africa Digital Payment Market Revenue (US$ Mn) Comparison by Solution (2016-2032)
- Figure 170: Middle East & Africa Digital Payment Market Revenue (US$ Mn) Comparison by Deployment Mode (2016-2032)
- Figure 171: Middle East & Africa Digital Payment Market Revenue (US$ Mn) Comparison by Mode of Payment (2016-2032)
- Figure 172: Middle East & Africa Digital Payment Market Revenue (US$ Mn) Comparison by End-Use Industry (2016-2032)
- Figure 173: Middle East & Africa Digital Payment Market Y-o-Y Growth Rate Comparison by Country (2016-2032)
- Figure 174: Middle East & Africa Digital Payment Market Y-o-Y Growth Rate Comparison by Solution (2016-2032)
- Figure 175: Middle East & Africa Digital Payment Market Y-o-Y Growth Rate Comparison by Deployment Mode (2016-2032)
- Figure 176: Middle East & Africa Digital Payment Market Y-o-Y Growth Rate Comparison by Mode of Payment (2016-2032)
- Figure 177: Middle East & Africa Digital Payment Market Y-o-Y Growth Rate Comparison by End-Use Industry (2016-2032)
- Figure 178: Middle East & Africa Digital Payment Market Share Comparison by Country (2016-2032)
- Figure 179: Middle East & Africa Digital Payment Market Share Comparison by Solution (2016-2032)
- Figure 180: Middle East & Africa Digital Payment Market Share Comparison by Deployment Mode (2016-2032)
- Figure 181: Middle East & Africa Digital Payment Market Share Comparison by Mode of Payment (2016-2032)
- Figure 182: Middle East & Africa Digital Payment Market Share Comparison by End-Use Industry (2016-2032)
List of Tables
- Table 1: Global Digital Payment Market Comparison by Solution (2016-2032)
- Table 2: Global Digital Payment Market Comparison by Deployment Mode (2016-2032)
- Table 3: Global Digital Payment Market Comparison by Mode of Payment (2016-2032)
- Table 4: Global Digital Payment Market Comparison by End-Use Industry (2016-2032)
- Table 5: Global Digital Payment Market Revenue (US$ Mn) Comparison by Region (2016-2032)
- Table 6: Global Digital Payment Market Revenue (US$ Mn) (2016-2032)
- Table 7: Global Digital Payment Market Revenue (US$ Mn) Comparison by Region (2016-2032)
- Table 8: Global Digital Payment Market Revenue (US$ Mn) Comparison by Solution (2016-2032)
- Table 9: Global Digital Payment Market Revenue (US$ Mn) Comparison by Deployment Mode (2016-2032)
- Table 10: Global Digital Payment Market Revenue (US$ Mn) Comparison by Mode of Payment (2016-2032)
- Table 11: Global Digital Payment Market Revenue (US$ Mn) Comparison by End-Use Industry (2016-2032)
- Table 12: Global Digital Payment Market Y-o-Y Growth Rate Comparison by Region (2016-2032)
- Table 13: Global Digital Payment Market Y-o-Y Growth Rate Comparison by Solution (2016-2032)
- Table 14: Global Digital Payment Market Y-o-Y Growth Rate Comparison by Deployment Mode (2016-2032)
- Table 15: Global Digital Payment Market Y-o-Y Growth Rate Comparison by Mode of Payment (2016-2032)
- Table 16: Global Digital Payment Market Y-o-Y Growth Rate Comparison by End-Use Industry (2016-2032)
- Table 17: Global Digital Payment Market Share Comparison by Region (2016-2032)
- Table 18: Global Digital Payment Market Share Comparison by Solution (2016-2032)
- Table 19: Global Digital Payment Market Share Comparison by Deployment Mode (2016-2032)
- Table 20: Global Digital Payment Market Share Comparison by Mode of Payment (2016-2032)
- Table 21: Global Digital Payment Market Share Comparison by End-Use Industry (2016-2032)
- Table 22: North America Digital Payment Market Comparison by Deployment Mode (2016-2032)
- Table 23: North America Digital Payment Market Comparison by Mode of Payment (2016-2032)
- Table 24: North America Digital Payment Market Comparison by End-Use Industry (2016-2032)
- Table 25: North America Digital Payment Market Revenue (US$ Mn) Comparison by Country (2016-2032)
- Table 26: North America Digital Payment Market Revenue (US$ Mn) (2016-2032)
- Table 27: North America Digital Payment Market Revenue (US$ Mn) Comparison by Country (2016-2032)
- Table 28: North America Digital Payment Market Revenue (US$ Mn) Comparison by Solution (2016-2032)
- Table 29: North America Digital Payment Market Revenue (US$ Mn) Comparison by Deployment Mode (2016-2032)
- Table 30: North America Digital Payment Market Revenue (US$ Mn) Comparison by Mode of Payment (2016-2032)
- Table 31: North America Digital Payment Market Revenue (US$ Mn) Comparison by End-Use Industry (2016-2032)
- Table 32: North America Digital Payment Market Y-o-Y Growth Rate Comparison by Country (2016-2032)
- Table 33: North America Digital Payment Market Y-o-Y Growth Rate Comparison by Solution (2016-2032)
- Table 34: North America Digital Payment Market Y-o-Y Growth Rate Comparison by Deployment Mode (2016-2032)
- Table 35: North America Digital Payment Market Y-o-Y Growth Rate Comparison by Mode of Payment (2016-2032)
- Table 36: North America Digital Payment Market Y-o-Y Growth Rate Comparison by End-Use Industry (2016-2032)
- Table 37: North America Digital Payment Market Share Comparison by Country (2016-2032)
- Table 38: North America Digital Payment Market Share Comparison by Solution (2016-2032)
- Table 39: North America Digital Payment Market Share Comparison by Deployment Mode (2016-2032)
- Table 40: North America Digital Payment Market Share Comparison by Mode of Payment (2016-2032)
- Table 41: North America Digital Payment Market Share Comparison by End-Use Industry (2016-2032)
- Table 42: Western Europe Digital Payment Market Comparison by Solution (2016-2032)
- Table 43: Western Europe Digital Payment Market Comparison by Deployment Mode (2016-2032)
- Table 44: Western Europe Digital Payment Market Comparison by Mode of Payment (2016-2032)
- Table 45: Western Europe Digital Payment Market Comparison by End-Use Industry (2016-2032)
- Table 46: Western Europe Digital Payment Market Revenue (US$ Mn) Comparison by Country (2016-2032)
- Table 47: Western Europe Digital Payment Market Revenue (US$ Mn) (2016-2032)
- Table 48: Western Europe Digital Payment Market Revenue (US$ Mn) Comparison by Country (2016-2032)
- Table 49: Western Europe Digital Payment Market Revenue (US$ Mn) Comparison by Solution (2016-2032)
- Table 50: Western Europe Digital Payment Market Revenue (US$ Mn) Comparison by Deployment Mode (2016-2032)
- Table 51: Western Europe Digital Payment Market Revenue (US$ Mn) Comparison by Mode of Payment (2016-2032)
- Table 52: Western Europe Digital Payment Market Revenue (US$ Mn) Comparison by End-Use Industry (2016-2032)
- Table 53: Western Europe Digital Payment Market Y-o-Y Growth Rate Comparison by Country (2016-2032)
- Table 54: Western Europe Digital Payment Market Y-o-Y Growth Rate Comparison by Solution (2016-2032)
- Table 55: Western Europe Digital Payment Market Y-o-Y Growth Rate Comparison by Deployment Mode (2016-2032)
- Table 56: Western Europe Digital Payment Market Y-o-Y Growth Rate Comparison by Mode of Payment (2016-2032)
- Table 57: Western Europe Digital Payment Market Y-o-Y Growth Rate Comparison by End-Use Industry (2016-2032)
- Table 58: Western Europe Digital Payment Market Share Comparison by Country (2016-2032)
- Table 59: Western Europe Digital Payment Market Share Comparison by Solution (2016-2032)
- Table 60: Western Europe Digital Payment Market Share Comparison by Deployment Mode (2016-2032)
- Table 61: Western Europe Digital Payment Market Share Comparison by Mode of Payment (2016-2032)
- Table 62: Western Europe Digital Payment Market Share Comparison by End-Use Industry (2016-2032)
- Table 63: Eastern Europe Digital Payment Market Comparison by Solution (2016-2032)
- Table 64: Eastern Europe Digital Payment Market Comparison by Deployment Mode (2016-2032)
- Table 65: Eastern Europe Digital Payment Market Comparison by Mode of Payment (2016-2032)
- Table 66: Eastern Europe Digital Payment Market Comparison by End-Use Industry (2016-2032)
- Table 67: Eastern Europe Digital Payment Market Revenue (US$ Mn) Comparison by Country (2016-2032)
- Table 68: Eastern Europe Digital Payment Market Revenue (US$ Mn) (2016-2032)
- Table 69: Eastern Europe Digital Payment Market Revenue (US$ Mn) Comparison by Country (2016-2032)
- Table 70: Eastern Europe Digital Payment Market Revenue (US$ Mn) Comparison by Solution (2016-2032)
- Table 71: Eastern Europe Digital Payment Market Revenue (US$ Mn) Comparison by Deployment Mode (2016-2032)
- Table 72: Eastern Europe Digital Payment Market Revenue (US$ Mn) Comparison by Mode of Payment (2016-2032)
- Table 73: Eastern Europe Digital Payment Market Revenue (US$ Mn) Comparison by End-Use Industry (2016-2032)
- Table 74: Eastern Europe Digital Payment Market Y-o-Y Growth Rate Comparison by Country (2016-2032)
- Table 75: Eastern Europe Digital Payment Market Y-o-Y Growth Rate Comparison by Solution (2016-2032)
- Table 76: Eastern Europe Digital Payment Market Y-o-Y Growth Rate Comparison by Deployment Mode (2016-2032)
- Table 77: Eastern Europe Digital Payment Market Y-o-Y Growth Rate Comparison by Mode of Payment (2016-2032)
- Table 78: Eastern Europe Digital Payment Market Y-o-Y Growth Rate Comparison by End-Use Industry (2016-2032)
- Table 79: Eastern Europe Digital Payment Market Share Comparison by Country (2016-2032)
- Table 80: Eastern Europe Digital Payment Market Share Comparison by Solution (2016-2032)
- Table 81: Eastern Europe Digital Payment Market Share Comparison by Deployment Mode (2016-2032)
- Table 82: Eastern Europe Digital Payment Market Share Comparison by Mode of Payment (2016-2032)
- Table 83: Eastern Europe Digital Payment Market Share Comparison by End-Use Industry (2016-2032)
- Table 84: APAC Digital Payment Market Comparison by Solution (2016-2032)
- Table 85: APAC Digital Payment Market Comparison by Deployment Mode (2016-2032)
- Table 86: APAC Digital Payment Market Comparison by Mode of Payment (2016-2032)
- Table 87: APAC Digital Payment Market Comparison by End-Use Industry (2016-2032)
- Table 88: APAC Digital Payment Market Revenue (US$ Mn) Comparison by Country (2016-2032)
- Table 89: APAC Digital Payment Market Revenue (US$ Mn) (2016-2032)
- Table 90: APAC Digital Payment Market Revenue (US$ Mn) Comparison by Country (2016-2032)
- Table 91: APAC Digital Payment Market Revenue (US$ Mn) Comparison by Solution (2016-2032)
- Table 92: APAC Digital Payment Market Revenue (US$ Mn) Comparison by Deployment Mode (2016-2032)
- Table 93: APAC Digital Payment Market Revenue (US$ Mn) Comparison by Mode of Payment (2016-2032)
- Table 94: APAC Digital Payment Market Revenue (US$ Mn) Comparison by End-Use Industry (2016-2032)
- Table 95: APAC Digital Payment Market Y-o-Y Growth Rate Comparison by Country (2016-2032)
- Table 96: APAC Digital Payment Market Y-o-Y Growth Rate Comparison by Solution (2016-2032)
- Table 97: APAC Digital Payment Market Y-o-Y Growth Rate Comparison by Deployment Mode (2016-2032)
- Table 98: APAC Digital Payment Market Y-o-Y Growth Rate Comparison by Mode of Payment (2016-2032)
- Table 99: APAC Digital Payment Market Y-o-Y Growth Rate Comparison by End-Use Industry (2016-2032)
- Table 100: APAC Digital Payment Market Share Comparison by Country (2016-2032)
- Table 101: APAC Digital Payment Market Share Comparison by Solution (2016-2032)
- Table 102: APAC Digital Payment Market Share Comparison by Deployment Mode (2016-2032)
- Table 103: APAC Digital Payment Market Share Comparison by Mode of Payment (2016-2032)
- Table 104: APAC Digital Payment Market Share Comparison by End-Use Industry (2016-2032)
- Table 105: Latin America Digital Payment Market Comparison by Solution (2016-2032)
- Table 106: Latin America Digital Payment Market Comparison by Deployment Mode (2016-2032)
- Table 107: Latin America Digital Payment Market Comparison by Mode of Payment (2016-2032)
- Table 108: Latin America Digital Payment Market Comparison by End-Use Industry (2016-2032)
- Table 109: Latin America Digital Payment Market Revenue (US$ Mn) Comparison by Country (2016-2032)
- Table 110: Latin America Digital Payment Market Revenue (US$ Mn) (2016-2032)
- Table 111: Latin America Digital Payment Market Revenue (US$ Mn) Comparison by Country (2016-2032)
- Table 112: Latin America Digital Payment Market Revenue (US$ Mn) Comparison by Solution (2016-2032)
- Table 113: Latin America Digital Payment Market Revenue (US$ Mn) Comparison by Deployment Mode (2016-2032)
- Table 114: Latin America Digital Payment Market Revenue (US$ Mn) Comparison by Mode of Payment (2016-2032)
- Table 115: Latin America Digital Payment Market Revenue (US$ Mn) Comparison by End-Use Industry (2016-2032)
- Table 116: Latin America Digital Payment Market Y-o-Y Growth Rate Comparison by Country (2016-2032)
- Table 117: Latin America Digital Payment Market Y-o-Y Growth Rate Comparison by Solution (2016-2032)
- Table 118: Latin America Digital Payment Market Y-o-Y Growth Rate Comparison by Deployment Mode (2016-2032)
- Table 119: Latin America Digital Payment Market Y-o-Y Growth Rate Comparison by Mode of Payment (2016-2032)
- Table 120: Latin America Digital Payment Market Y-o-Y Growth Rate Comparison by End-Use Industry (2016-2032)
- Table 121: Latin America Digital Payment Market Share Comparison by Country (2016-2032)
- Table 122: Latin America Digital Payment Market Share Comparison by Solution (2016-2032)
- Table 123: Latin America Digital Payment Market Share Comparison by Deployment Mode (2016-2032)
- Table 124: Latin America Digital Payment Market Share Comparison by Mode of Payment (2016-2032)
- Table 125: Latin America Digital Payment Market Share Comparison by End-Use Industry (2016-2032)
- Table 126: Middle East & Africa Digital Payment Market Comparison by Solution (2016-2032)
- Table 127: Middle East & Africa Digital Payment Market Comparison by Deployment Mode (2016-2032)
- Table 128: Middle East & Africa Digital Payment Market Comparison by Mode of Payment (2016-2032)
- Table 129: Middle East & Africa Digital Payment Market Comparison by End-Use Industry (2016-2032)
- Table 130: Middle East & Africa Digital Payment Market Revenue (US$ Mn) Comparison by Country (2016-2032)
- Table 131: Middle East & Africa Digital Payment Market Revenue (US$ Mn) (2016-2032)
- Table 132: Middle East & Africa Digital Payment Market Revenue (US$ Mn) Comparison by Country (2016-2032)
- Table 133: Middle East & Africa Digital Payment Market Revenue (US$ Mn) Comparison by Solution (2016-2032)
- Table 134: Middle East & Africa Digital Payment Market Revenue (US$ Mn) Comparison by Deployment Mode (2016-2032)
- Table 135: Middle East & Africa Digital Payment Market Revenue (US$ Mn) Comparison by Mode of Payment (2016-2032)
- Table 136: Middle East & Africa Digital Payment Market Revenue (US$ Mn) Comparison by End-Use Industry (2016-2032)
- Table 137: Middle East & Africa Digital Payment Market Y-o-Y Growth Rate Comparison by Country (2016-2032)
- Table 138: Middle East & Africa Digital Payment Market Y-o-Y Growth Rate Comparison by Solution (2016-2032)
- Table 139: Middle East & Africa Digital Payment Market Y-o-Y Growth Rate Comparison by Deployment Mode (2016-2032)
- Table 140: Middle East & Africa Digital Payment Market Y-o-Y Growth Rate Comparison by Mode of Payment (2016-2032)
- Table 141: Middle East & Africa Digital Payment Market Y-o-Y Growth Rate Comparison by End-Use Industry (2016-2032)
- Table 142: Middle East & Africa Digital Payment Market Share Comparison by Country (2016-2032)
- Table 143: Middle East & Africa Digital Payment Market Share Comparison by Solution (2016-2032)
- Table 144: Middle East & Africa Digital Payment Market Share Comparison by Deployment Mode (2016-2032)
- Table 145: Middle East & Africa Digital Payment Market Share Comparison by Mode of Payment (2016-2032)
- Table 146: Middle East & Africa Digital Payment Market Share Comparison by End-Use Industry (2016-2032)
- 1. Executive Summary
-
- First Data Corp.
- PayPal Payments Private Ltd.
- Worldpay, LLC
- Wirecard AG
- Fiserv, Inc.
- Chetu, Inc.
- Total System Services, Inc.
- Novatti Group Ltd.
- ACI Worldwide Inc.
- Global Payments Inc.
- BlueSnap Inc.
- Paysafe Holdings UK Ltd.
- Worldline SA
- Wex Inc.
- SIX Payment Services Ltd.
- Dwolla, Inc.
- Stripe, Inc.
- Adyen N.V.
- PayU Payments Private Ltd.
- YapStone, Inc.
Our Clients


View Our Licence Options
