Digital Food Management Market By Application (Food Safety, Marketing, and Other), By Technology (Computer-Aided Design (CAD), Computer Aided Engineering (CAE), Sales Force Automation (SFA), Enterprise Resource Planning (ERP), and Other), By Region and Companies - Industry Segment Outlook, Market Assessment, Competition Scenario, Trends, and Forecast 2024-2033
-
40233
-
May 2024
-
300
-


-
This report was compiled by Vishwa Gaul Vishwa is an experienced market research and consulting professional with over 8 years of expertise in the ICT industry, contributing to over 700 reports across telecommunications, software, hardware, and digital solutions. Correspondence Team Lead- ICT Linkedin | Detailed Market research Methodology Our methodology involves a mix of primary research, including interviews with leading mental health experts, and secondary research from reputable medical journals and databases. View Detailed Methodology Page
-
Quick Navigation
Report Overview
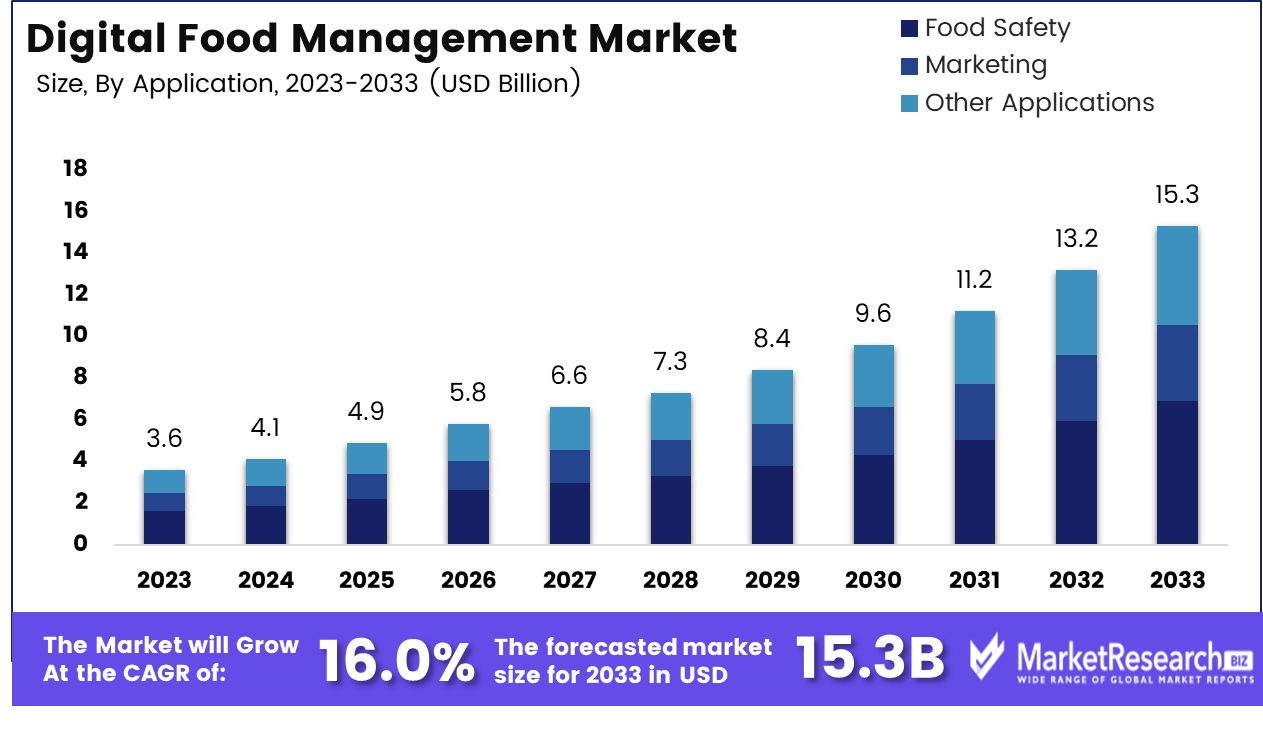
Digital Food Management Market size is expected to be worth around USD 15.3 Bn by 2033 from USD 3.6 Bn in 2023, growing at a CAGR of 16.0% during the forecast period from 2024 to 2033. The surge in demand in the food industry and hospitality are some of the main driving factors for the digital food management solution market expansion.
Digital food management defines the use of digital technologies and applications to improve multiple aspects of the food industry starting from supply chain management to food delivery and waste deductions. This new approach influences the power of modern technologies like the IoT, AI, blockchain, data analytics, and mobile application tools to enhance efficacy, transparency, and sustainability in the food production system. Digital food management also helps to boost production methods, marketing strategies, and many more to the benefit of all parties in the farm-to-counter supply chain, which consists of the farmers, vendors, and restaurant owners.
 The digitalization of the food industry’s supply chain aims to streamline the food’s journey from the farm to the table of the customers. For this process, it uses sensors, blockchain, and other advanced technologies to monitor products, handle inventories, and reduce food waste. Additionally, to offer a challenging aspect of food production and consumption, digital food also creates some unique advice for how to approach the future of dietary consumption and nourishment. The food system is the main key factor for deforestation and biodiversity loss and produces a quarter of the greenhouse gas pollution worldwide.
According to the World Bank in 2019, globally 500 million small farmers who donate 80% of food are among the poorest and most malnourished category. Climate change will force almost 100 million farmers into extreme poverty by 2030 which will adversely impact agriculture and food security. Enhancing the performance of the food system is important in order to sustainably feed almost 10 billion individuals by 2050 while helping the farmers to boost their incomes safeguarding them from climate change and supporting them to sustain.
Digital technologies have the capability to produce a substantial positive impact across the food system. These range from new innovations that can make the food chain systems more resourceful and climate resistant like precision agriculture, gene editing, and biologically based crop safety that can enhance food production. The demand for digital food management solutions will increase due to their advantages in food production such as increasing efficacy, improving transparency and food safety, encouraging sustainable techniques, and focusing more on customization and convenience according to the customers, which will help contribute to market expansion in the coming years.
Key Takeaways
- Market Value: Digital Food Management Market size is expected to be worth around USD 15.3 Bn by 2033 from USD 3.6 Bn in 2023, growing at a CAGR of 16.0% during the forecast period from 2024 to 2033.
- Based on Application: Digital food management prioritizes food safety, comprising 38% of the market.
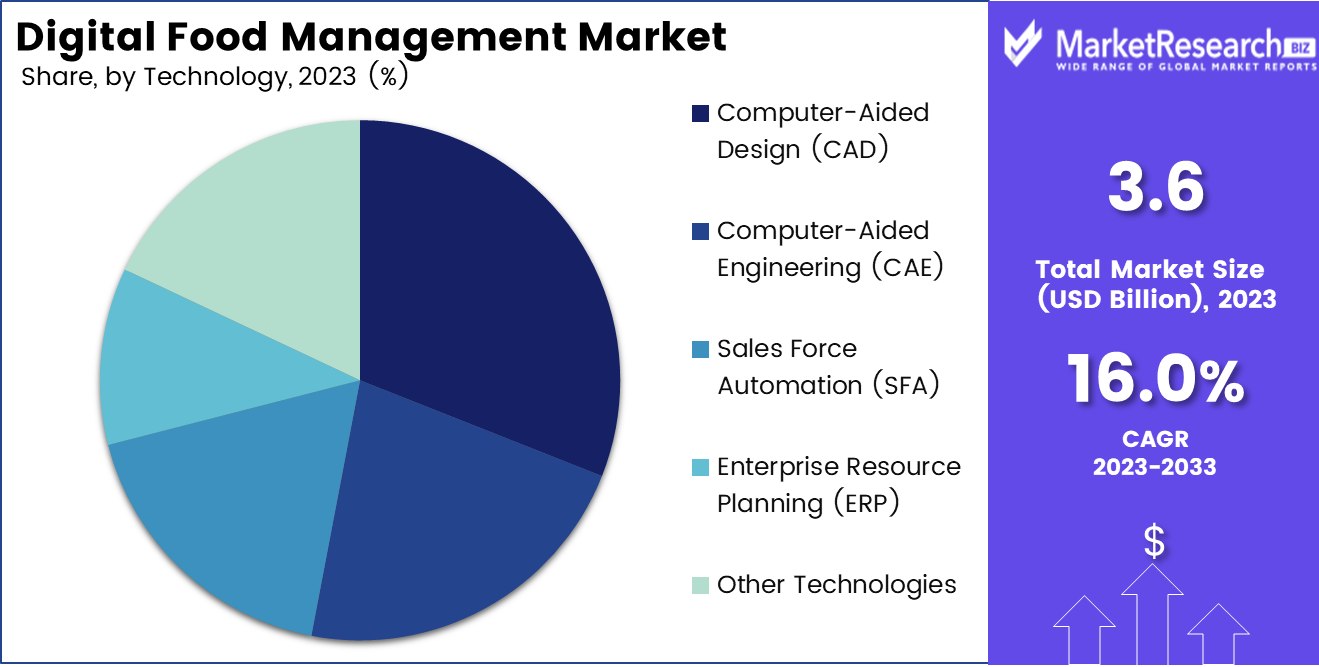
- Based on Technology: CAD technology constitutes 31% of the Digital Food Management Market.
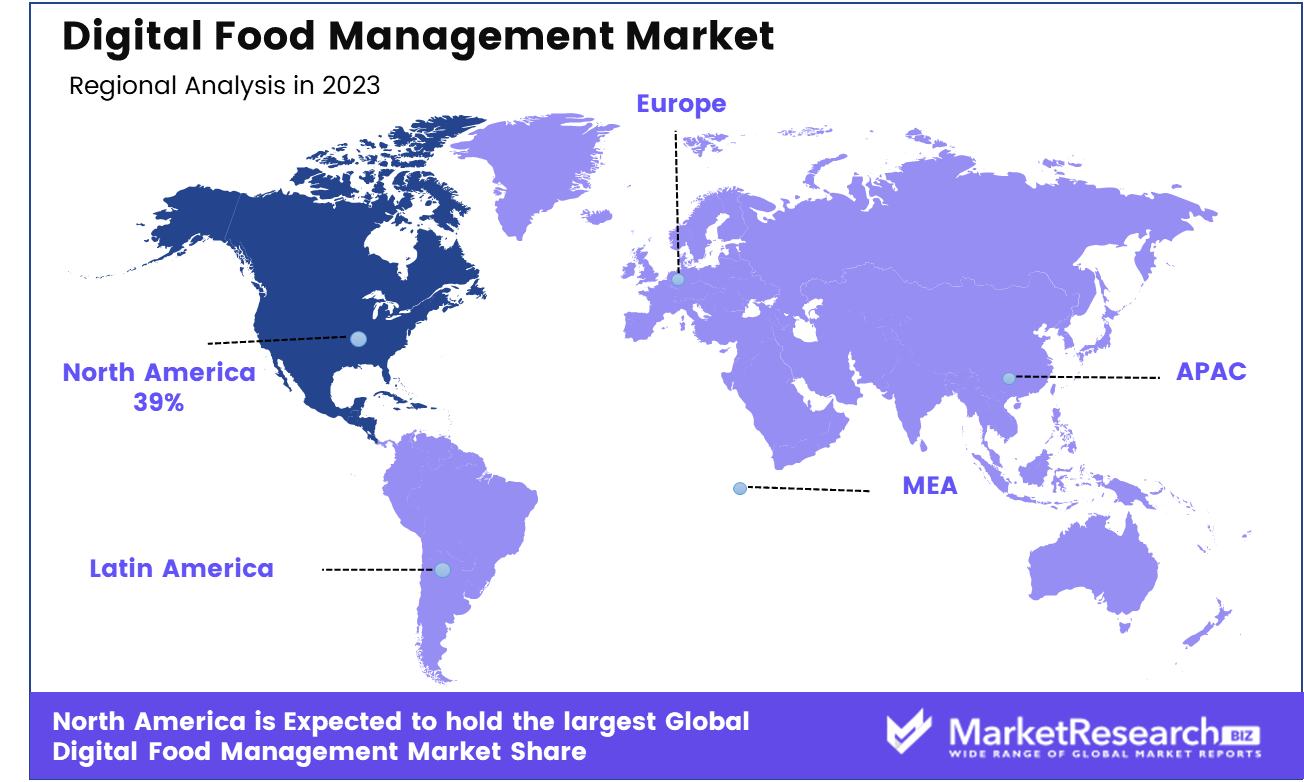
- Regional Analysis: North America leads with a 39% share in digital food management.
- Growth Opportunity: In 2023, the global digital food management market is set to grow significantly, driven by the expansion of online food delivery platforms and enhanced customer engagement through digital loyalty programs.
Driving factors
Enhanced Integration of Digital Technologies
The digital transformation within the food industry significantly propels the Digital Food Management Market. The adoption of advanced technologies, such as mobile applications, IoT (Internet of Things), and online platforms, is fundamentally reshaping how food businesses operate. These digital tools enhance customer engagement, streamline ordering processes, and optimize inventory management.
For instance, mobile apps facilitate convenient order placements and real-time communication between consumers and service providers, increasing operational efficiency and customer satisfaction. This integration of digital solutions not only meets the rising consumer expectations for speed and convenience but also drives operational efficiencies, reducing costs and improving service delivery.
Strengthening Food Safety and Quality Assurance
Digital food management solutions are increasingly crucial in enhancing food safety and quality control across the supply chain. By implementing digital tracking and monitoring systems, businesses can ensure compliance with health regulations and standards, thereby minimizing risks of contamination and foodborne illnesses.
Real-time data collection and analytics provided by these digital systems enable proactive management of potential safety issues, ensuring high standards of food quality and consumer trust. This aspect of digital innovation is particularly critical as it aligns with global regulatory pressures and consumer demands for transparency and accountability in food production and handling.
Promoting Sustainability Through Waste Reduction
The push towards sustainability is a significant factor driving the adoption of digital food management solutions focused on minimizing food waste. Digital tools that predict inventory needs, optimize food use, and manage supply chain inefficiencies play a pivotal role in reducing waste.
By accurately forecasting demand and enhancing shelf-life management, these technologies ensure that food production aligns more closely with consumption patterns. This not only helps in conserving resources but also in reducing the environmental impact associated with food waste, contributing to more sustainable business practices in the food industry.
Restraining Factors
Barriers to Adoption: Resistance to Change
The inertia of traditional operational practices in the food industry significantly hampers the adoption of digital food management solutions. Many established food businesses exhibit a reluctance to integrate digital technologies, largely due to resistance to change, lack of technical expertise, and fears of disrupting proven processes. This hesitancy can be attributed to cultural resistance within organizations where traditional methods are deeply ingrained.
Moreover, the perceived complexity and cost of training staff to adapt to new systems can deter decision-makers. Such resistance not only slows down the digital transformation journey of these businesses but also limits the overall expansion of the digital food management market by constraining its acceptance in broader segments of the industry.
Economic Constraints: High Maintenance Costs of Digital Systems
The financial implications of adopting digital food management systems pose another significant challenge. The initial setup costs, coupled with high maintenance expenses due to the need for continuous updates and system upgrades, create a barrier for many food businesses, particularly small to medium-sized enterprises (SMEs).
The rapid pace of technological evolution necessitates frequent updates to software and hardware to stay current, which can strain the budgets of these businesses. This factor is crucial in limiting market penetration as potential users weigh the benefits of digital adoption against the substantial ongoing investment required to maintain such systems effectively.
Application Analysis
The Digital Food Management Market dedicates 38% of its application to enhancing food safety measures.
In 2023, Food Safety held a dominant market position in the By Application segment of the Digital Food Management Market, capturing more than a 38% share. This substantial market share underscores the critical importance of ensuring food safety in the increasingly digital landscape of food management systems. The emphasis on food safety reflects a broad recognition of its essential role in compliance with regulatory standards and in maintaining consumer trust.
Adjacent to Food Safety, the Marketing segment also plays a crucial role in the Digital Food Management Market. Here, digital tools are leveraged to enhance brand visibility and consumer engagement through targeted advertising, social media campaigns, and personalized promotions. This segment benefits from the integration of big data and analytics, which allows for more nuanced consumer insights and more effective marketing strategies.
Other Applications within the market include inventory management, supply chain monitoring, and customer relationship management. These applications are vital for the seamless operation of food services and retail businesses, offering real-time insights and operational efficiencies that are critical in today's fast-paced market environment.
Technology Analysis
Computer-aided design (CAD) technology constitutes 31% of the Digital Food Management Market's technological application.
In 2023, Computer-Aided Design (CAD) held a dominant market position in the By Technology segment of the Digital Food Management Market, capturing more than a 31% share. The prominence of CAD technologies underscores their critical role in designing efficient, safe, and scalable food processing facilities and equipment. CAD applications enable precise simulations and modifications, which are essential for meeting stringent industry standards and adapting to evolving food safety regulations.
Following CAD, Computer-Aided Engineering (CAE) also plays a significant role in this market. CAE technologies are instrumental in optimizing food production processes through enhanced analytical capabilities that predict product behavior under various conditions. This helps in minimizing risks and improving overall product quality.
Sales Force Automation (SFA) technologies focus on streamlining sales processes, managing customer data, enhancing communication between sales teams, and boosting productivity by automating tasks such as order processing and tracking, inventory control, and customer interactions. These technologies are crucial for enhancing the responsiveness and efficiency of sales operations in the food industry.
Enterprise Resource Planning (ERP) systems integrate all facets of an operation, including product planning, purchasing, manufacturing, sales, and marketing into a single database, application, and user interface. ERP in food management helps companies manage their end-to-end supply chain operations and comply with food safety regulations effectively.
Key Market Segments
By Application
- Food Safety
- Marketing
- Other Applications
By Technology
- Computer-Aided Design (CAD)
- Computer-Aided Engineering (CAE)
- Sales Force Automation (SFA)
- Enterprise Resource Planning (ERP)
- Other Technologies
Growth Opportunity
Expansion Through Online Food Delivery Platforms
The global digital food management market is poised for significant growth in 2023, driven largely by the surge in online food delivery services. As consumers increasingly turn to the convenience of ordering food online, there is a burgeoning demand for robust digital platforms that not only facilitate these transactions but also enhance the operational efficiency of restaurants and food providers.
These platforms help streamline processes from order taking to delivery, ensuring a seamless experience for both providers and consumers. This trend not only opens new revenue streams for digital food management solutions but also extends their relevance across a broader range of food service operations.
Enhancing Engagement via Customer Loyalty Programs
Another significant growth opportunity for the digital food management market in 2023 is the strategic implementation of digital loyalty programs. By integrating customer loyalty programs with mobile apps, businesses can significantly enhance customer retention and encourage repeat business.
These programs provide valuable data that can be analyzed to personalize offerings and improve customer service, thereby increasing customer satisfaction and loyalty. The ability to effectively manage and utilize customer data through digital tools is crucial for businesses aiming to capitalize on this trend, as it directly contributes to sustained business growth through enhanced customer engagement.
Latest Trends
Advancing Through Technology Integration
In 2023, the global digital food management market is expected to witness transformative growth through the integration of advanced technologies like Artificial Intelligence (AI), virtual reality, and contactless payment methods. AI, in particular, is set to revolutionize the industry by automating critical operations such as order-taking, inventory management, and customer service. This automation facilitates more accurate demand forecasting and resource allocation, reducing waste and enhancing operational efficiency.
Furthermore, the adoption of virtual reality can offer unique customer experiences, potentially increasing engagement and brand loyalty. Contactless payments, enhanced by security and convenience, will continue to grow in popularity, reflecting a shift towards safer and more efficient consumer transactions.
Embracing In-House Delivery Apps
Another trend shaping the digital food management landscape in 2023 is the move by restaurants toward developing their own in-house delivery apps. This strategy allows businesses to maintain direct communication with their customers, circumventing third-party platforms that can erode customer relationships and profits.
By managing deliveries internally, restaurants can control the delivery process, ensure food quality, and offer personalized promotions, thereby enhancing customer satisfaction. This trend not only supports customer retention strategies but also helps establishments understand consumer behavior better through data generated by these apps.
Regional Analysis
North America leads the digital food management market with a significant 39% share.
North America, the dominant region, holds a 39% share of the global market. This leadership is primarily due to the high penetration of advanced technologies and the presence of major players in North America. North America's focus on reducing food waste and enhancing food safety through digital tracking and AI-driven analytics solutions is driving substantial market engagement.
Europe follows closely, leveraging its stringent food safety regulations to accelerate the adoption of digital food management systems. These systems are increasingly integrated with the European Union's policies on food traceability and sustainability, pushing businesses towards digital compliance solutions. The robust infrastructure and government support for tech-driven food management initiatives further bolster the European market.
In the Asia Pacific, rapid urbanization and growing technological literacy are key drivers. The region is witnessing a surge in demand for digital solutions in food management, particularly in China, Japan, and India, due to increasing internet penetration and the expanding presence of tech-savvy consumers. The APAC market is poised for the highest growth rate, as these economies focus on enhancing food distribution and quality management.
The Middle East & Africa, though a smaller market, is experiencing growth due to rising investments in smart city projects and food security strategies. Digital transformation in food management is increasingly seen as crucial in improving traceability and reducing food losses.
Latin America is embracing digital food management solutions to strengthen its agricultural export capabilities and internal food supply chains, supported by governmental digitalization efforts and a growing focus on sustainability.
Key Regions and Countries
North America
- US
- Canada
- Mexico
Western Europe
- Germany
- France
- The UK
- Spain
- Italy
- Portugal
- Ireland
- Austria
- Switzerland
- Benelux
- Nordic
- Rest of Western Europe
Eastern Europe
- Russia
- Poland
- The Czech Republic
- Greece
- Rest of Eastern Europe
APAC
- China
- Japan
- South Korea
- India
- Australia & New Zealand
- Indonesia
- Malaysia
- Philippines
- Singapore
- Thailand
- Vietnam
- Rest of APAC
Latin America
- Brazil
- Colombia
- Chile
- Argentina
- Costa Rica
- Rest of Latin America
Middle East & Africa
- Algeria
- Egypt
- Israel
- Kuwait
- Nigeria
- Saudi Arabia
- South Africa
- Turkey
- United Arab Emirates
- Rest of MEA
Key Players Analysis
Agilysys Inc. and Oracle Corp. are leading with comprehensive, scalable solutions tailored for large-scale operations, enhancing their market penetration in both the hospitality and retail sectors. These corporations are not only advancing in technological capabilities but are also expanding their global footprint through strategic alliances and acquisitions.
Apicbase NV, Computrition Inc., and JAMIX Oy specialize in niche segments like nutritional analysis and kitchen management. Their focused approach allows them to deliver specialized solutions that cater to the unique needs of healthcare facilities and educational institutions, respectively.
Emerging players such as SmartSuite Holdings LLC and iNECTA LLC are making significant inroads by leveraging cloud-based platforms that offer cost-effectiveness and ease of integration. These attributes are particularly appealing to small and medium-sized enterprises looking for agile and flexible solutions.
Toast Inc., with its robust point-of-sale systems, continues to integrate more features that streamline operations from front-end order taking to backend kitchen management, resonating well with fast-paced food service environments.
FlexiBake Ltd., GOFRUGAL, and KELLTON TECH are enhancing their offerings with features like inventory management and real-time data analytics, which are critical for optimizing supply chains and reducing waste—a growing concern among all food-related businesses.
The CBORD Group Inc., SweetWARE, Kitchen Brains, and Omega POS Inc. remain focused on expanding their product lines to include more AI-driven analytics and IoT integrations, pushing the boundaries of what digital food management systems can achieve in terms of operational efficiency and food safety compliance.
Top Key Players in the Digital Food Management Market
- Agilysys Inc.
- Apicbase NV
- Computrition Inc.
- SmartSuite Holdings LLC
- SweetWARE
- The CBORD Group Inc.
- Toast Inc.
- FlexiBake Ltd.
- GOFRUGAL
- iNECTA LLC
- JAMIX Oy
- KELLTON TECH
- Kitchen Brains
- Omega POS Inc.
- Oracle Corp.
- Other Key Players
Recent Development
- In April 2024, Vietnam, in collaboration with South Korea, launched a new digital food safety management system designed to enhance the monitoring of food poisoning outbreaks nationwide, as reported by Pearly Neo.
- In March 2024, Static Media announced the acquisition of TheTakeout.com, a distinguished digital platform for food enthusiasts, further enhancing its portfolio of food brands and expanding its reach to 38 million monthly visitors, as reported by PRNewswire.
- In April 2024, Martins and Joshua Udotai, co-founders of Dinesurf, discussed the platform's transformative impact on restaurant discovery and management in Africa through digital innovation, as reported by Vanguard.
- In April 2024, Joe Park, Yum Brands' Chief Digital and Technology Officer, is driving the fast-food conglomerate's substantial investment in AI technologies to optimize every aspect of its operations, enhancing customer and franchisee experiences across its major brands including Taco Bell, Pizza Hut, KFC, and Habit Burger Grill.
Report Scope
Report Features Description Market Value (2023) USD 3.6 Bn Forecast Revenue (2033) USD 15.3 Bn CAGR (2024-2033) 16.0% Base Year for Estimation 2023 Historic Period 2016-2023 Forecast Period 2024-2033 Report Coverage Revenue Forecast, Market Dynamics, COVID-19 Impact, Competitive Landscape, Recent Developments Segments Covered By Application (Food Safety, Marketing, and other applications), By Technology (Computer-Aided Design (CAD), Computer Aided Engineering (CAE), Sales Force Automation (SFA), Enterprise Resource Planning (ERP), and Other Technologies) Regional Analysis North America – The US, Canada, & Mexico; Western Europe – Germany, France, The UK, Spain, Italy, Portugal, Ireland, Austria, Switzerland, Benelux, Nordic, & Rest of Western Europe; Eastern Europe – Russia, Poland, The Czech Republic, Greece, & Rest of Eastern Europe; APAC – China, Japan, South Korea, India, Australia & New Zealand, Indonesia, Malaysia, Philippines, Singapore, Thailand, Vietnam, & Rest of APAC; Latin America – Brazil, Colombia, Chile, Argentina, Costa Rica, & Rest of Latin America; Middle East & Africa – Algeria, Egypt, Israel, Kuwait, Nigeria, Saudi Arabia, South Africa, Turkey, United Arab Emirates, & Rest of MEA Competitive Landscape Agilysys Inc., Apicbase NV, Computrition Inc., SmartSuite Holdings LLC, SweetWARE, The CBORD Group Inc., Toast Inc., FlexiBake Ltd., GOFRUGAL, iNECTA LLC, JAMIX Oy, KELLTON TECH, Kitchen Brains, Omega POS Inc., Oracle Corp., and Other Key Players. Customization Scope Customization for segments, region/country-level will be provided. Moreover, additional customization can be done based on the requirements. Purchase Options We have three licenses to opt for: Single User License, Multi-User License (Up to 5 Users), Corporate Use License (Unlimited User and Printable PDF) -
-
- Agilysys Inc.
- Apicbase NV
- Computrition Inc.
- SmartSuite Holdings LLC
- SweetWARE
- The CBORD Group Inc.
- Toast Inc.
- FlexiBake Ltd.
- GOFRUGAL
- iNECTA LLC
- JAMIX Oy
- KELLTON TECH
- Kitchen Brains
- Omega POS Inc.
- Oracle Corp.
- Other Key Players
Our Clients


View Our Licence Options
