
Global Dating and Matchmaking Market By Service (Matchmaking, Social Dating, Adult Dating, and Niche Dating), By Demographics (Adult and Generation X), By Subscription (Annually and Quarterly), By Region and Companies - Industry Segment Outlook, Market Assessment, Competition Scenario, Trends and Forecast 2023-2032.
-
36150
-
April 2023
-
177
-


-
This report was compiled by Research Team Research team of over 50 passionate professionals leverages advanced research methodologies and analytical expertise to deliver insightful, data-driven market intelligence that empowers businesses across diverse industries to make strategic, well-informed Correspondence Research Team Linkedin | Detailed Market research Methodology Our methodology involves a mix of primary research, including interviews with leading mental health experts, and secondary research from reputable medical journals and databases. View Detailed Methodology Page
-
Quick Navigation
Report Overview
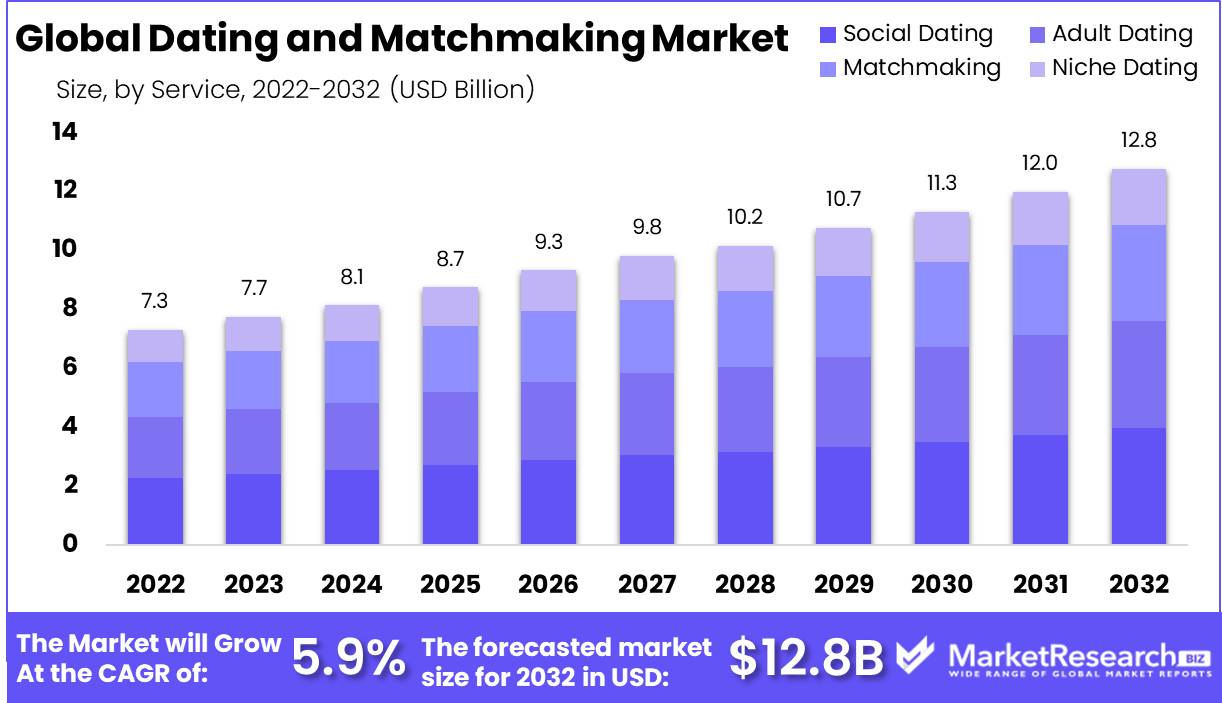
Global Dating and Matchmaking Market size is expected to be worth around USD 12.8 Bn by 2032 from USD 7.3 Bn in 2022, growing at a CAGR of 5.9% during the forecast period from 2023 to 2032.
Online dating is a service provided through a web-based computer system or mobile phone application by using the GPS tracker feature and it has quick access to mobile wallets and digital photo galleries to improve the process of online dating and matchmaking. These platforms speed up and simplify the process of chatting, flirting, and meeting becoming romantic when involved in traditional online dating services. There are several advantages to using these online dating and matchmaking platforms. These apps are developed by using special algorithms to detect people with similar interests and likes. It has lots of possibilities for users can find the same matched person in the online dating app. The users will find several types of people with the same pastime and same hobbies on this app.
Market Scope
Service Analysis
Social Matchmaking Holds Largest Shares in the Market During the Forecast Period 2022
On the basis of service, the market is segmented into adult dating, social dating, niche dating, and matchmaking. Social dating is the most dominating segment in this market. Due to factors such as non-monogamous and instant hookup relationships. Due to an increase in the number of single people, a rise in per capita income, and an increase in customer preference for non-monogamous relationships in a greater rate of subscription for online dating services.
The widespread application of Artificial Intelligence helps to extend training for profile recommendations life coaching and relationships. Social dating has two altered types of business models, which includes free subscription. The paid subscription provides profitable services and simplifies easy access to find the partner as per their preferences. The availability of internet connectivity and smartphones increases the use of dating services among the millennials and it allows service providers to expand their business.
Demographics Analysis
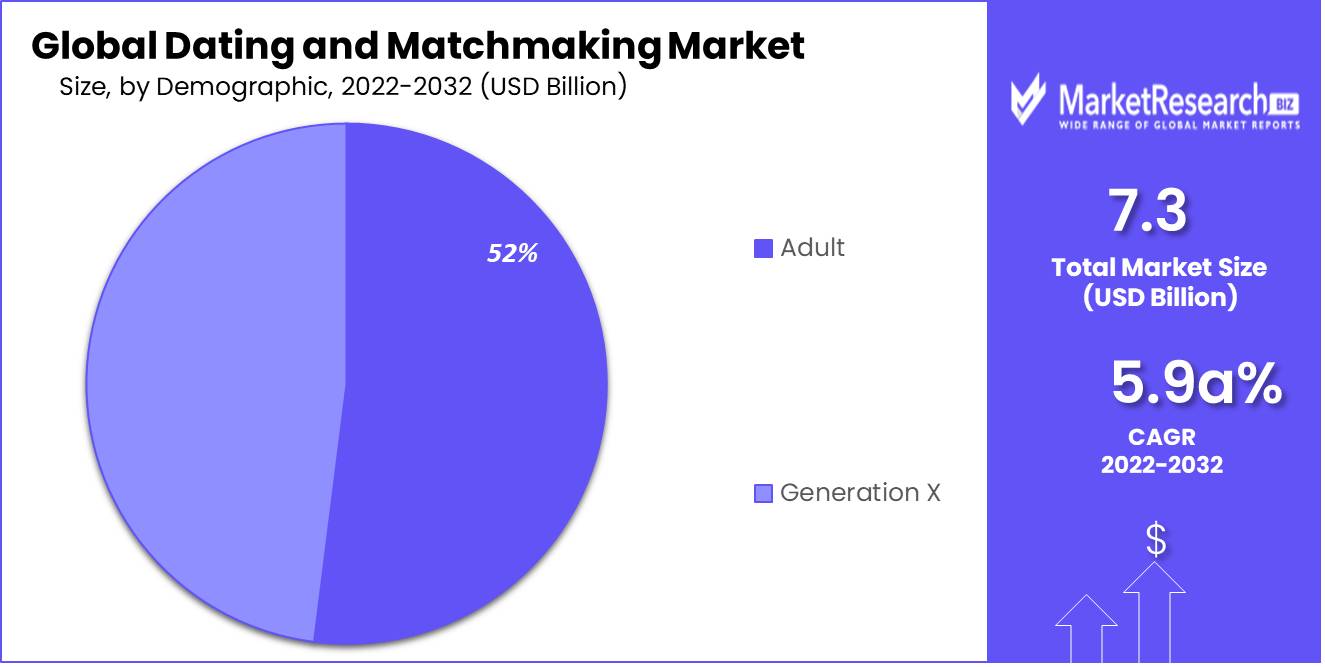
The adult Segment is the most Dominating Group in the Dating and Matchmaking Service Market
Based on demographics, the market is segmented into Adults and Generation X. Most people find their partner through the online dating and matchmaking app sits. Some young people are focused on their goals and prefer non-committed relationships instead of committed relationships. The social dating apps such as Tinder serve as an ideal platform for these people. It is the reason that dating and matchmaking services are more popular among the above 18 aged people.
Subscription Analysis
Quarterly Segment Held Largest Shares in the Market During the Forecast Period 2022
Based on subscription, the market is divided into annual, quarterly, monthly, and weekly. The quarterly subscription is the most dominating subscription model in the market. The business player in the online dating and matchmaking market is coming with attractive contracts that increase the subscription base and revenue such factors help the growth of the online dating and matchmaking market. Businesses such as Tinder provide offers to the users for the subscription after more than one repetition. These strategies boost the overall growth of this segment.
Key Market Segments
By Service
- Matchmaking
- Social Dating
- Adult Dating
- Niche Dating
By Demographics
- Adult
- Generation X
By Subscription
- Annually
- Quarterly
Market Dynamics
Drivers
Increase in Usage of Internet Services
The increasing use of internet services also rises the visibility of several online platforms for dating and matchmaking services which helps to grow the dating and matchmaking services market. The adult population increasingly uses Internet services to find a companion is driving the growth of the dating and matchmaking market. Dating and matchmaking sites provide video dating, chat dating, and others dating features. Increasing the number of marriage failures and also an increase in the number of software and websites for dating and matchmaking increases the growth of the dating and matchmaking market. Social trends outside traditional social circles increasing the rates of interracial marriage drive the growth of the dating and matchmaking services market.
Restraints
Increasing Fake Accounts
The growth of the dating and matchmaking service market is hindered due to different online frauds known as love scams, which are essentially impeding the expansion of the internet business. Some people believe that internet dating is more harmful, raising concerns about the safety of women. Scammer abuse, the publication of intimate images, attacks, and criminal cases are all factors limiting the expansion of the online dating market.
Opportunity
Emerging Advanced Features in the Dating and Matchmaking Apps
People in the world are looking for particular characteristics of a suitable partner. The characteristic involves similar mindedness, same interests, and others. Online dating and matchmaking apps help them find such kind of partners who shares the same characteristics due to several features and easy availability of particular peoples on online platform for dating and matchmaking because of these factors these dating platforms are in high demand. The market is anticipated to witness the advanced features in the apps, ethnicity, sexual orientation, and other metrics to become more inclusive by allowing representation of all users. Online dating and matchmaking are easy to use, quick, and convenient and it requires less effort. However, it allows a limit for the number of people who can contact them by using many available features.
Trends
Many companies launched new features to remind the COVID-19 situation. They introduced new facilities of the epidemic containing a virtual badge that shows people a video call, a virtual dating site, chat gamification, a vaccinated person badge, and many others. Grindr made some kind of changes to its existing features. Which includes video chats that are freely available to all users. It is also a shared COVID-19 pandemic-related sexual health guide developed by New York to help users understand the risk of transmitting the virus.
Regional Analysis
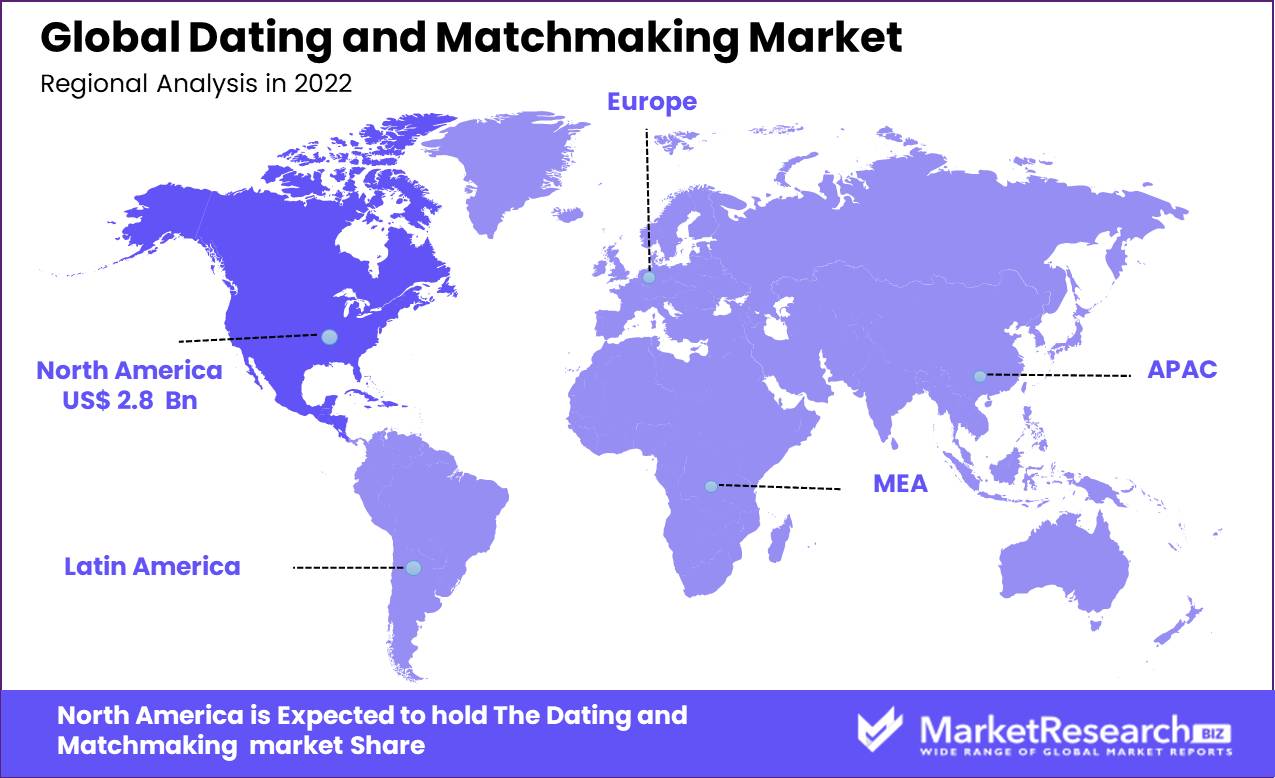
North America will be the Most Dominating Region in the Dating and Matchmaking market in 2022
On the basis of geography, North America is the most dominating region with the largest revenue shares of the online dating and matchmaking services market during the projection period. North America is considered a mature market for dating and matchmaking services. This is due to the increasing number of people who are using online dating site services. The recent development of dating and matchmaking services using technology drives the growth of the market all around the world.
For example, several companies adopted AI to provide the best services to customers. Asia Pacific has 2 billion active internet users which account for 49% of the population. India, Japan, and China are some of the most dominant internet users in the Asian Countries. In Asia-Pacific online services for dating and matchmaking is in their initial growth stage and which is anticipated to gain traction during the projection period.
Key Regions
- North America
- The US
- Canada
- Mexico
- Western Europe
- Germany
- France
- The UK
- Spain
- Italy
- Portugal
- Ireland
- Austria
- Switzerland
- Benelux
- Nordic
- Rest of Western Europe
- Eastern Europe
- Russia
- Poland
- The Czech Republic
- Greece
- Rest of Eastern Europe
- APAC
- China
- Japan
- South Korea
- India
- Australia & New Zealand
- Indonesia
- Malaysia
- Philippines
- Singapore
- Thailand
- Vietnam
- Rest of APAC
- Latin America
- Brazil
- Colombia
- Chile
- Argentina
- Costa Rica
- Rest of Latin America
- Middle East & Africa
- Algeria
- Egypt
- Israel
- Kuwait
- Nigeria
- Saudi Arabia
- South Africa
- Turkey
- United Arab Emirates
- Rest of MEA
Key Players Analysis
Developing key players are concentrated on a variety of strategies to develop their particular companies in foreign markets. Several Dating and Matchmaking market companies are concentrating on growing their R&D facilities and existing operations. Furthermore, businesses in the Dating and Matchmaking market are developing a portfolio and new product expansion strategies through mergers, investments and acquisitions. In addition, numerous key players are now concentrating on different marketing strategies such as increasing awareness about advanced features, which is expanding the growth of target products.
- Match Group, LLC
- Bumble Inc.
- Grindr LLC
- eHarmony, Inc.
- Spark Networks, Inc.
- The Meet Group, Inc.
- com.au Pty Ltd
- Coffee Meets Bagel
- Ruby Life Inc.
- Mobeze, Inc.
- C-Date
- Other key players
Recent Developments
- In September 2021: Tinder Inc. expanded its business around Constant with a Short Film. Tinder Inc. introduced a film title closure to navigate through the tricky terrain of consent all around the world of advanced dating and matchmaking services.
- In March 2020, Tinder Inc. Declared that the business recorded greater than 3 billion which helps the advance of dating and matchmaking sites.
- In May 2022, Bumble declared a partnership with Cosmopolitan to increase awareness of its virtual dating and matchmaking offer. The initiative was developed in collaboration with JUMP, Partnerships Hub, and Havas Media Groups content.
Report Scope
Report Features Description Market Value (2022) USD 7.3 Bn Forecast Revenue (2032) USD 12.8 Bn CAGR (2023-2032) 5.9% Base Year for Estimation 2022 Historic Period 2016-2022 Forecast Period 2023-2032 Report Coverage Revenue Forecast, Market Dynamics, COVID-19 Impact, Competitive Landscape, Recent Developments Segments Covered By Service (Matchmaking, Social Dating, Adult Dating, and Niche Dating); By Demographics (Adult and Generation X); By Subscription (Annually and Quarterly) Regional Analysis North America – The US, Canada, & Mexico; Western Europe – Germany, France, The UK, Spain, Italy, Portugal, Ireland, Austria, Switzerland, Benelux, Nordic, & Rest of Western Europe; Eastern Europe – Russia, Poland, The Czech Republic, Greece, & Rest of Eastern Europe; APAC – China, Japan, South Korea, India, Australia & New Zealand, Indonesia, Malaysia, Philippines, Singapore, Thailand, Vietnam, & Rest of APAC; Latin America – Brazil, Colombia, Chile, Argentina, Costa Rica, & Rest of Latin America; Middle East & Africa – Algeria, Egypt, Israel, Kuwait, Nigeria, Saudi Arabia, South Africa, Turkey, United Arab Emirates, & Rest of MEA Competitive Landscape Match Group, LLC, Bumble Inc., Grindr LLC, eHarmony, Inc., Spark Networks, Inc., The Meet Group, Inc., rsvp.com.au Pty Ltd, Coffee Meets Bagel, Ruby Life Inc., Mobeze, Inc., C-Date and Other key players Customization Scope Customization for segments, region/country-level will be provided. Moreover, additional customization can be done based on the requirements. Purchase Options We have three licenses to opt for: Single User License, Multi-User License (Up to 5 Users), Corporate Use License (Unlimited User and Printable PDF) -
- 1. Executive Summary
- 1.1. Definition
- 1.2. Taxonomy
- 1.3. Research Scope
- 1.4. Key Analysis
- 1.5. Key Findings by Major Segments
- 1.6. Top strategies by Major Players
- 2. Global Dating and Matchmaking Market Overview
- 2.1. Dating and Matchmaking Market Dynamics
- 2.1.1. Drivers
- 2.1.2. Opportunities
- 2.1.3. Restraints
- 2.1.4. Challenges
- 2.2. Macro-economic Factors
- 2.3. Regulatory Framework
- 2.4. Market Investment Feasibility Index
- 2.5. PEST Analysis
- 2.6. PORTER’S Five Force Analysis
- 2.7. Drivers & Restraints Impact Analysis
- 2.8. Industry Chain Analysis
- 2.9. Cost Structure Analysis
- 2.10. Marketing Strategy
- 2.11. Russia-Ukraine War Impact Analysis
- 2.12. Opportunity Map Analysis
- 2.13. Market Competition Scenario Analysis
- 2.14. Product Life Cycle Analysis
- 2.15. Opportunity Orbits
- 2.16. Manufacturer Intensity Map
- 2.17. Major Companies sales by Value & Volume
- 2.1. Dating and Matchmaking Market Dynamics
- 3. Global Dating and Matchmaking Market Analysis, Opportunity and Forecast, 2016-2032
- 3.1. Global Dating and Matchmaking Market Analysis, 2016-2021
- 3.2. Global Dating and Matchmaking Market Opportunity and Forecast, 2023-2032
- 3.3. Global Dating and Matchmaking Market Analysis, Opportunity and Forecast, By Type, 2016-2032
- 3.3.1. Global Dating and Matchmaking Market Analysis by Type: Introduction
- 3.3.2. Market Size Absolute $ Opportunity Analysis and Forecast, By Type, 2016-2032
- 3.3.3. Online
- 3.3.4. Traditional
- 3.4. Global Dating and Matchmaking Market Analysis, Opportunity and Forecast, By Subscription, 2016-2032
- 3.4.1. Global Dating and Matchmaking Market Analysis by Subscription: Introduction
- 3.4.2. Market Size Absolute $ Opportunity Analysis and Forecast, By Subscription, 2016-2032
- 3.4.3. Annualy
- 3.4.4. Quarterly
- 3.5. Global Dating and Matchmaking Market Analysis, Opportunity and Forecast, By Service, 2016-2032
- 3.5.1. Global Dating and Matchmaking Market Analysis by Service: Introduction
- 3.5.2. Market Size Absolute $ Opportunity Analysis and Forecast, By Service, 2016-2032
- 3.5.3. Matchmaking
- 3.5.4. Social Dating
- 3.5.5. Adult Dating
- 3.5.6. Niche Dating
- 3.6. Global Dating and Matchmaking Market Analysis, Opportunity and Forecast, By Demographics, 2016-2032
- 3.6.1. Global Dating and Matchmaking Market Analysis by Demographics: Introduction
- 3.6.2. Market Size Absolute $ Opportunity Analysis and Forecast, By Demographics, 2016-2032
- 3.6.3. Adult
- 3.6.4. Generation X
- 4. North America Dating and Matchmaking Market Analysis, Opportunity and Forecast, 2016-2032
- 4.1. North America Dating and Matchmaking Market Analysis, 2016-2021
- 4.2. North America Dating and Matchmaking Market Opportunity and Forecast, 2023-2032
- 4.3. North America Dating and Matchmaking Market Analysis, Opportunity and Forecast, By Type, 2016-2032
- 4.3.1. North America Dating and Matchmaking Market Analysis by Type: Introduction
- 4.3.2. Market Size Absolute $ Opportunity Analysis and Forecast, By Type, 2016-2032
- 4.3.3. Online
- 4.3.4. Traditional
- 4.4. North America Dating and Matchmaking Market Analysis, Opportunity and Forecast, By Subscription, 2016-2032
- 4.4.1. North America Dating and Matchmaking Market Analysis by Subscription: Introduction
- 4.4.2. Market Size Absolute $ Opportunity Analysis and Forecast, By Subscription, 2016-2032
- 4.4.3. Annualy
- 4.4.4. Quarterly
- 4.5. North America Dating and Matchmaking Market Analysis, Opportunity and Forecast, By Service, 2016-2032
- 4.5.1. North America Dating and Matchmaking Market Analysis by Service: Introduction
- 4.5.2. Market Size Absolute $ Opportunity Analysis and Forecast, By Service, 2016-2032
- 4.5.3. Matchmaking
- 4.5.4. Social Dating
- 4.5.5. Adult Dating
- 4.5.6. Niche Dating
- 4.6. North America Dating and Matchmaking Market Analysis, Opportunity and Forecast, By Demographics, 2016-2032
- 4.6.1. North America Dating and Matchmaking Market Analysis by Demographics: Introduction
- 4.6.2. Market Size Absolute $ Opportunity Analysis and Forecast, By Demographics, 2016-2032
- 4.6.3. Adult
- 4.6.4. Generation X
- 4.7. North America Dating and Matchmaking Market Analysis, Opportunity and Forecast, By Country , 2016-2032
- 4.7.1. North America Dating and Matchmaking Market Analysis by Country : Introduction
- 4.7.2. Market Size Absolute $ Opportunity Analysis and Forecast, Country , 2016-2032
- 4.7.2.1. The US
- 4.7.2.2. Canada
- 4.7.2.3. Mexico
- 5. Western Europe Dating and Matchmaking Market Analysis, Opportunity and Forecast, 2016-2032
- 5.1. Western Europe Dating and Matchmaking Market Analysis, 2016-2021
- 5.2. Western Europe Dating and Matchmaking Market Opportunity and Forecast, 2023-2032
- 5.3. Western Europe Dating and Matchmaking Market Analysis, Opportunity and Forecast, By Type, 2016-2032
- 5.3.1. Western Europe Dating and Matchmaking Market Analysis by Type: Introduction
- 5.3.2. Market Size Absolute $ Opportunity Analysis and Forecast, By Type, 2016-2032
- 5.3.3. Online
- 5.3.4. Traditional
- 5.4. Western Europe Dating and Matchmaking Market Analysis, Opportunity and Forecast, By Subscription, 2016-2032
- 5.4.1. Western Europe Dating and Matchmaking Market Analysis by Subscription: Introduction
- 5.4.2. Market Size Absolute $ Opportunity Analysis and Forecast, By Subscription, 2016-2032
- 5.4.3. Annualy
- 5.4.4. Quarterly
- 5.5. Western Europe Dating and Matchmaking Market Analysis, Opportunity and Forecast, By Service, 2016-2032
- 5.5.1. Western Europe Dating and Matchmaking Market Analysis by Service: Introduction
- 5.5.2. Market Size Absolute $ Opportunity Analysis and Forecast, By Service, 2016-2032
- 5.5.3. Matchmaking
- 5.5.4. Social Dating
- 5.5.5. Adult Dating
- 5.5.6. Niche Dating
- 5.6. Western Europe Dating and Matchmaking Market Analysis, Opportunity and Forecast, By Demographics, 2016-2032
- 5.6.1. Western Europe Dating and Matchmaking Market Analysis by Demographics: Introduction
- 5.6.2. Market Size Absolute $ Opportunity Analysis and Forecast, By Demographics, 2016-2032
- 5.6.3. Adult
- 5.6.4. Generation X
- 5.7. Western Europe Dating and Matchmaking Market Analysis, Opportunity and Forecast, By Country , 2016-2032
- 5.7.1. Western Europe Dating and Matchmaking Market Analysis by Country : Introduction
- 5.7.2. Market Size Absolute $ Opportunity Analysis and Forecast, Country , 2016-2032
- 5.7.2.1. Germany
- 5.7.2.2. France
- 5.7.2.3. The UK
- 5.7.2.4. Spain
- 5.7.2.5. Italy
- 5.7.2.6. Portugal
- 5.7.2.7. Ireland
- 5.7.2.8. Austria
- 5.7.2.9. Switzerland
- 5.7.2.10. Benelux
- 5.7.2.11. Nordic
- 5.7.2.12. Rest of Western Europe
- 6. Eastern Europe Dating and Matchmaking Market Analysis, Opportunity and Forecast, 2016-2032
- 6.1. Eastern Europe Dating and Matchmaking Market Analysis, 2016-2021
- 6.2. Eastern Europe Dating and Matchmaking Market Opportunity and Forecast, 2023-2032
- 6.3. Eastern Europe Dating and Matchmaking Market Analysis, Opportunity and Forecast, By Type, 2016-2032
- 6.3.1. Eastern Europe Dating and Matchmaking Market Analysis by Type: Introduction
- 6.3.2. Market Size Absolute $ Opportunity Analysis and Forecast, By Type, 2016-2032
- 6.3.3. Online
- 6.3.4. Traditional
- 6.4. Eastern Europe Dating and Matchmaking Market Analysis, Opportunity and Forecast, By Subscription, 2016-2032
- 6.4.1. Eastern Europe Dating and Matchmaking Market Analysis by Subscription: Introduction
- 6.4.2. Market Size Absolute $ Opportunity Analysis and Forecast, By Subscription, 2016-2032
- 6.4.3. Annualy
- 6.4.4. Quarterly
- 6.5. Eastern Europe Dating and Matchmaking Market Analysis, Opportunity and Forecast, By Service, 2016-2032
- 6.5.1. Eastern Europe Dating and Matchmaking Market Analysis by Service: Introduction
- 6.5.2. Market Size Absolute $ Opportunity Analysis and Forecast, By Service, 2016-2032
- 6.5.3. Matchmaking
- 6.5.4. Social Dating
- 6.5.5. Adult Dating
- 6.5.6. Niche Dating
- 6.6. Eastern Europe Dating and Matchmaking Market Analysis, Opportunity and Forecast, By Demographics, 2016-2032
- 6.6.1. Eastern Europe Dating and Matchmaking Market Analysis by Demographics: Introduction
- 6.6.2. Market Size Absolute $ Opportunity Analysis and Forecast, By Demographics, 2016-2032
- 6.6.3. Adult
- 6.6.4. Generation X
- 6.7. Eastern Europe Dating and Matchmaking Market Analysis, Opportunity and Forecast, By Country , 2016-2032
- 6.7.1. Eastern Europe Dating and Matchmaking Market Analysis by Country : Introduction
- 6.7.2. Market Size Absolute $ Opportunity Analysis and Forecast, Country , 2016-2032
- 6.7.2.1. Russia
- 6.7.2.2. Poland
- 6.7.2.3. The Czech Republic
- 6.7.2.4. Greece
- 6.7.2.5. Rest of Eastern Europe
- 7. APAC Dating and Matchmaking Market Analysis, Opportunity and Forecast, 2016-2032
- 7.1. APAC Dating and Matchmaking Market Analysis, 2016-2021
- 7.2. APAC Dating and Matchmaking Market Opportunity and Forecast, 2023-2032
- 7.3. APAC Dating and Matchmaking Market Analysis, Opportunity and Forecast, By Type, 2016-2032
- 7.3.1. APAC Dating and Matchmaking Market Analysis by Type: Introduction
- 7.3.2. Market Size Absolute $ Opportunity Analysis and Forecast, By Type, 2016-2032
- 7.3.3. Online
- 7.3.4. Traditional
- 7.4. APAC Dating and Matchmaking Market Analysis, Opportunity and Forecast, By Subscription, 2016-2032
- 7.4.1. APAC Dating and Matchmaking Market Analysis by Subscription: Introduction
- 7.4.2. Market Size Absolute $ Opportunity Analysis and Forecast, By Subscription, 2016-2032
- 7.4.3. Annualy
- 7.4.4. Quarterly
- 7.5. APAC Dating and Matchmaking Market Analysis, Opportunity and Forecast, By Service, 2016-2032
- 7.5.1. APAC Dating and Matchmaking Market Analysis by Service: Introduction
- 7.5.2. Market Size Absolute $ Opportunity Analysis and Forecast, By Service, 2016-2032
- 7.5.3. Matchmaking
- 7.5.4. Social Dating
- 7.5.5. Adult Dating
- 7.5.6. Niche Dating
- 7.6. APAC Dating and Matchmaking Market Analysis, Opportunity and Forecast, By Demographics, 2016-2032
- 7.6.1. APAC Dating and Matchmaking Market Analysis by Demographics: Introduction
- 7.6.2. Market Size Absolute $ Opportunity Analysis and Forecast, By Demographics, 2016-2032
- 7.6.3. Adult
- 7.6.4. Generation X
- 7.7. APAC Dating and Matchmaking Market Analysis, Opportunity and Forecast, By Country , 2016-2032
- 7.7.1. APAC Dating and Matchmaking Market Analysis by Country : Introduction
- 7.7.2. Market Size Absolute $ Opportunity Analysis and Forecast, Country , 2016-2032
- 7.7.2.1. China
- 7.7.2.2. Japan
- 7.7.2.3. South Korea
- 7.7.2.4. India
- 7.7.2.5. Australia & New Zeland
- 7.7.2.6. Indonesia
- 7.7.2.7. Malaysia
- 7.7.2.8. Philippines
- 7.7.2.9. Singapore
- 7.7.2.10. Thailand
- 7.7.2.11. Vietnam
- 7.7.2.12. Rest of APAC
- 8. Latin America Dating and Matchmaking Market Analysis, Opportunity and Forecast, 2016-2032
- 8.1. Latin America Dating and Matchmaking Market Analysis, 2016-2021
- 8.2. Latin America Dating and Matchmaking Market Opportunity and Forecast, 2023-2032
- 8.3. Latin America Dating and Matchmaking Market Analysis, Opportunity and Forecast, By Type, 2016-2032
- 8.3.1. Latin America Dating and Matchmaking Market Analysis by Type: Introduction
- 8.3.2. Market Size Absolute $ Opportunity Analysis and Forecast, By Type, 2016-2032
- 8.3.3. Online
- 8.3.4. Traditional
- 8.4. Latin America Dating and Matchmaking Market Analysis, Opportunity and Forecast, By Subscription, 2016-2032
- 8.4.1. Latin America Dating and Matchmaking Market Analysis by Subscription: Introduction
- 8.4.2. Market Size Absolute $ Opportunity Analysis and Forecast, By Subscription, 2016-2032
- 8.4.3. Annualy
- 8.4.4. Quarterly
- 8.5. Latin America Dating and Matchmaking Market Analysis, Opportunity and Forecast, By Service, 2016-2032
- 8.5.1. Latin America Dating and Matchmaking Market Analysis by Service: Introduction
- 8.5.2. Market Size Absolute $ Opportunity Analysis and Forecast, By Service, 2016-2032
- 8.5.3. Matchmaking
- 8.5.4. Social Dating
- 8.5.5. Adult Dating
- 8.5.6. Niche Dating
- 8.6. Latin America Dating and Matchmaking Market Analysis, Opportunity and Forecast, By Demographics, 2016-2032
- 8.6.1. Latin America Dating and Matchmaking Market Analysis by Demographics: Introduction
- 8.6.2. Market Size Absolute $ Opportunity Analysis and Forecast, By Demographics, 2016-2032
- 8.6.3. Adult
- 8.6.4. Generation X
- 8.7. Latin America Dating and Matchmaking Market Analysis, Opportunity and Forecast, By Country , 2016-2032
- 8.7.1. Latin America Dating and Matchmaking Market Analysis by Country : Introduction
- 8.7.2. Market Size Absolute $ Opportunity Analysis and Forecast, Country , 2016-2032
- 8.7.2.1. Brazil
- 8.7.2.2. Colombia
- 8.7.2.3. Chile
- 8.7.2.4. Argentina
- 8.7.2.5. Costa Rica
- 8.7.2.6. Rest of Latin America
- 9. Middle East & Africa Dating and Matchmaking Market Analysis, Opportunity and Forecast, 2016-2032
- 9.1. Middle East & Africa Dating and Matchmaking Market Analysis, 2016-2021
- 9.2. Middle East & Africa Dating and Matchmaking Market Opportunity and Forecast, 2023-2032
- 9.3. Middle East & Africa Dating and Matchmaking Market Analysis, Opportunity and Forecast, By Type, 2016-2032
- 9.3.1. Middle East & Africa Dating and Matchmaking Market Analysis by Type: Introduction
- 9.3.2. Market Size Absolute $ Opportunity Analysis and Forecast, By Type, 2016-2032
- 9.3.3. Online
- 9.3.4. Traditional
- 9.4. Middle East & Africa Dating and Matchmaking Market Analysis, Opportunity and Forecast, By Subscription, 2016-2032
- 9.4.1. Middle East & Africa Dating and Matchmaking Market Analysis by Subscription: Introduction
- 9.4.2. Market Size Absolute $ Opportunity Analysis and Forecast, By Subscription, 2016-2032
- 9.4.3. Annualy
- 9.4.4. Quarterly
- 9.5. Middle East & Africa Dating and Matchmaking Market Analysis, Opportunity and Forecast, By Service, 2016-2032
- 9.5.1. Middle East & Africa Dating and Matchmaking Market Analysis by Service: Introduction
- 9.5.2. Market Size Absolute $ Opportunity Analysis and Forecast, By Service, 2016-2032
- 9.5.3. Matchmaking
- 9.5.4. Social Dating
- 9.5.5. Adult Dating
- 9.5.6. Niche Dating
- 9.6. Middle East & Africa Dating and Matchmaking Market Analysis, Opportunity and Forecast, By Demographics, 2016-2032
- 9.6.1. Middle East & Africa Dating and Matchmaking Market Analysis by Demographics: Introduction
- 9.6.2. Market Size Absolute $ Opportunity Analysis and Forecast, By Demographics, 2016-2032
- 9.6.3. Adult
- 9.6.4. Generation X
- 9.7. Middle East & Africa Dating and Matchmaking Market Analysis, Opportunity and Forecast, By Country , 2016-2032
- 9.7.1. Middle East & Africa Dating and Matchmaking Market Analysis by Country : Introduction
- 9.7.2. Market Size Absolute $ Opportunity Analysis and Forecast, Country , 2016-2032
- 9.7.2.1. Algeria
- 9.7.2.2. Egypt
- 9.7.2.3. Israel
- 9.7.2.4. Kuwait
- 9.7.2.5. Nigeria
- 9.7.2.6. Saudi Arabia
- 9.7.2.7. South Africa
- 9.7.2.8. Turkey
- 9.7.2.9. The UAE
- 9.7.2.10. Rest of MEA
- 10. Global Dating and Matchmaking Market Analysis, Opportunity and Forecast, By Region , 2016-2032
- 10.1. Global Dating and Matchmaking Market Analysis by Region : Introduction
- 10.2. Market Size Absolute $ Opportunity Analysis and Forecast, By Region , 2016-2032
- 10.2.1. North America
- 10.2.2. Western Europe
- 10.2.3. Eastern Europe
- 10.2.4. APAC
- 10.2.5. Latin America
- 10.2.6. Middle East & Africa
- 11. Global Dating and Matchmaking Market Competitive Landscape, Market Share Analysis, and Company Profiles
- 11.1. Market Share Analysis
- 11.2. Company Profiles
- 11.3. Match Group, LLC
- 11.3.1. Company Overview
- 11.3.2. Financial Highlights
- 11.3.3. Product Portfolio
- 11.3.4. SWOT Analysis
- 11.3.5. Key Strategies and Developments
- 11.4. Bumble Inc.
- 11.4.1. Company Overview
- 11.4.2. Financial Highlights
- 11.4.3. Product Portfolio
- 11.4.4. SWOT Analysis
- 11.4.5. Key Strategies and Developments
- 11.5. Grindr LLC
- 11.5.1. Company Overview
- 11.5.2. Financial Highlights
- 11.5.3. Product Portfolio
- 11.5.4. SWOT Analysis
- 11.5.5. Key Strategies and Developments
- 11.6. eHarmony, Inc.
- 11.6.1. Company Overview
- 11.6.2. Financial Highlights
- 11.6.3. Product Portfolio
- 11.6.4. SWOT Analysis
- 11.6.5. Key Strategies and Developments
- 11.7. Spark Networks, Inc.
- 11.7.1. Company Overview
- 11.7.2. Financial Highlights
- 11.7.3. Product Portfolio
- 11.7.4. SWOT Analysis
- 11.7.5. Key Strategies and Developments
- 11.8. The Meet Group, Inc.
- 11.8.1. Company Overview
- 11.8.2. Financial Highlights
- 11.8.3. Product Portfolio
- 11.8.4. SWOT Analysis
- 11.8.5. Key Strategies and Developments
- 11.9. rsvp.com.au Pty Ltd
- 11.9.1. Company Overview
- 11.9.2. Financial Highlights
- 11.9.3. Product Portfolio
- 11.9.4. SWOT Analysis
- 11.9.5. Key Strategies and Developments
- 11.10. Coffee Meets Bagel
- 11.10.1. Company Overview
- 11.10.2. Financial Highlights
- 11.10.3. Product Portfolio
- 11.10.4. SWOT Analysis
- 11.10.5. Key Strategies and Developments
- 11.11. Ruby Life Inc.
- 11.11.1. Company Overview
- 11.11.2. Financial Highlights
- 11.11.3. Product Portfolio
- 11.11.4. SWOT Analysis
- 11.11.5. Key Strategies and Developments
- 11.12. Mobeze, Inc.
- 11.12.1. Company Overview
- 11.12.2. Financial Highlights
- 11.12.3. Product Portfolio
- 11.12.4. SWOT Analysis
- 11.12.5. Key Strategies and Developments
- 11.13. C-Date
- 11.13.1. Company Overview
- 11.13.2. Financial Highlights
- 11.13.3. Product Portfolio
- 11.13.4. SWOT Analysis
- 11.13.5. Key Strategies and Developments
- 11.14. Other key players
- 11.14.1. Company Overview
- 11.14.2. Financial Highlights
- 11.14.3. Product Portfolio
- 11.14.4. SWOT Analysis
- 11.14.5. Key Strategies and Developments
- 12. Assumptions and Acronyms
- 13. Research Methodology
- 14. Contact
- Table 1: Global Dating and Matchmaking Market Comparison by Type (2016-2032)
- Table 2: Global Dating and Matchmaking Market Comparison by Subscription (2016-2032)
- Table 3: Global Dating and Matchmaking Market Comparison by Service (2016-2032)
- Table 4: Global Dating and Matchmaking Market Comparison by Demographics (2016-2032)
- Table 5: Global Dating and Matchmaking Market Revenue (US$ Mn) Comparison by Region (2016-2032)
- Table 6: Global Dating and Matchmaking Market Revenue (US$ Mn) (2016-2032)
- Table 7: Global Dating and Matchmaking Market Revenue (US$ Mn) Comparison by Region (2016-2032)
- Table 8: Global Dating and Matchmaking Market Revenue (US$ Mn) Comparison by Type (2016-2032)
- Table 9: Global Dating and Matchmaking Market Revenue (US$ Mn) Comparison by Subscription (2016-2032)
- Table 10: Global Dating and Matchmaking Market Revenue (US$ Mn) Comparison by Service (2016-2032)
- Table 11: Global Dating and Matchmaking Market Revenue (US$ Mn) Comparison by Demographics (2016-2032)
- Table 12: Global Dating and Matchmaking Market Y-o-Y Growth Rate Comparison by Region (2016-2032)
- Table 13: Global Dating and Matchmaking Market Y-o-Y Growth Rate Comparison by Type (2016-2032)
- Table 14: Global Dating and Matchmaking Market Y-o-Y Growth Rate Comparison by Subscription (2016-2032)
- Table 15: Global Dating and Matchmaking Market Y-o-Y Growth Rate Comparison by Service (2016-2032)
- Table 16: Global Dating and Matchmaking Market Y-o-Y Growth Rate Comparison by Demographics (2016-2032)
- Table 17: Global Dating and Matchmaking Market Share Comparison by Region (2016-2032)
- Table 18: Global Dating and Matchmaking Market Share Comparison by Type (2016-2032)
- Table 19: Global Dating and Matchmaking Market Share Comparison by Subscription (2016-2032)
- Table 20: Global Dating and Matchmaking Market Share Comparison by Service (2016-2032)
- Table 21: Global Dating and Matchmaking Market Share Comparison by Demographics (2016-2032)
- Table 22: North America Dating and Matchmaking Market Comparison by Subscription (2016-2032)
- Table 23: North America Dating and Matchmaking Market Comparison by Service (2016-2032)
- Table 24: North America Dating and Matchmaking Market Comparison by Demographics (2016-2032)
- Table 25: North America Dating and Matchmaking Market Revenue (US$ Mn) Comparison by Country (2016-2032)
- Table 26: North America Dating and Matchmaking Market Revenue (US$ Mn) (2016-2032)
- Table 27: North America Dating and Matchmaking Market Revenue (US$ Mn) Comparison by Country (2016-2032)
- Table 28: North America Dating and Matchmaking Market Revenue (US$ Mn) Comparison by Type (2016-2032)
- Table 29: North America Dating and Matchmaking Market Revenue (US$ Mn) Comparison by Subscription (2016-2032)
- Table 30: North America Dating and Matchmaking Market Revenue (US$ Mn) Comparison by Service (2016-2032)
- Table 31: North America Dating and Matchmaking Market Revenue (US$ Mn) Comparison by Demographics (2016-2032)
- Table 32: North America Dating and Matchmaking Market Y-o-Y Growth Rate Comparison by Country (2016-2032)
- Table 33: North America Dating and Matchmaking Market Y-o-Y Growth Rate Comparison by Type (2016-2032)
- Table 34: North America Dating and Matchmaking Market Y-o-Y Growth Rate Comparison by Subscription (2016-2032)
- Table 35: North America Dating and Matchmaking Market Y-o-Y Growth Rate Comparison by Service (2016-2032)
- Table 36: North America Dating and Matchmaking Market Y-o-Y Growth Rate Comparison by Demographics (2016-2032)
- Table 37: North America Dating and Matchmaking Market Share Comparison by Country (2016-2032)
- Table 38: North America Dating and Matchmaking Market Share Comparison by Type (2016-2032)
- Table 39: North America Dating and Matchmaking Market Share Comparison by Subscription (2016-2032)
- Table 40: North America Dating and Matchmaking Market Share Comparison by Service (2016-2032)
- Table 41: North America Dating and Matchmaking Market Share Comparison by Demographics (2016-2032)
- Table 42: Western Europe Dating and Matchmaking Market Comparison by Type (2016-2032)
- Table 43: Western Europe Dating and Matchmaking Market Comparison by Subscription (2016-2032)
- Table 44: Western Europe Dating and Matchmaking Market Comparison by Service (2016-2032)
- Table 45: Western Europe Dating and Matchmaking Market Comparison by Demographics (2016-2032)
- Table 46: Western Europe Dating and Matchmaking Market Revenue (US$ Mn) Comparison by Country (2016-2032)
- Table 47: Western Europe Dating and Matchmaking Market Revenue (US$ Mn) (2016-2032)
- Table 48: Western Europe Dating and Matchmaking Market Revenue (US$ Mn) Comparison by Country (2016-2032)
- Table 49: Western Europe Dating and Matchmaking Market Revenue (US$ Mn) Comparison by Type (2016-2032)
- Table 50: Western Europe Dating and Matchmaking Market Revenue (US$ Mn) Comparison by Subscription (2016-2032)
- Table 51: Western Europe Dating and Matchmaking Market Revenue (US$ Mn) Comparison by Service (2016-2032)
- Table 52: Western Europe Dating and Matchmaking Market Revenue (US$ Mn) Comparison by Demographics (2016-2032)
- Table 53: Western Europe Dating and Matchmaking Market Y-o-Y Growth Rate Comparison by Country (2016-2032)
- Table 54: Western Europe Dating and Matchmaking Market Y-o-Y Growth Rate Comparison by Type (2016-2032)
- Table 55: Western Europe Dating and Matchmaking Market Y-o-Y Growth Rate Comparison by Subscription (2016-2032)
- Table 56: Western Europe Dating and Matchmaking Market Y-o-Y Growth Rate Comparison by Service (2016-2032)
- Table 57: Western Europe Dating and Matchmaking Market Y-o-Y Growth Rate Comparison by Demographics (2016-2032)
- Table 58: Western Europe Dating and Matchmaking Market Share Comparison by Country (2016-2032)
- Table 59: Western Europe Dating and Matchmaking Market Share Comparison by Type (2016-2032)
- Table 60: Western Europe Dating and Matchmaking Market Share Comparison by Subscription (2016-2032)
- Table 61: Western Europe Dating and Matchmaking Market Share Comparison by Service (2016-2032)
- Table 62: Western Europe Dating and Matchmaking Market Share Comparison by Demographics (2016-2032)
- Table 63: Eastern Europe Dating and Matchmaking Market Comparison by Type (2016-2032)
- Table 64: Eastern Europe Dating and Matchmaking Market Comparison by Subscription (2016-2032)
- Table 65: Eastern Europe Dating and Matchmaking Market Comparison by Service (2016-2032)
- Table 66: Eastern Europe Dating and Matchmaking Market Comparison by Demographics (2016-2032)
- Table 67: Eastern Europe Dating and Matchmaking Market Revenue (US$ Mn) Comparison by Country (2016-2032)
- Table 68: Eastern Europe Dating and Matchmaking Market Revenue (US$ Mn) (2016-2032)
- Table 69: Eastern Europe Dating and Matchmaking Market Revenue (US$ Mn) Comparison by Country (2016-2032)
- Table 70: Eastern Europe Dating and Matchmaking Market Revenue (US$ Mn) Comparison by Type (2016-2032)
- Table 71: Eastern Europe Dating and Matchmaking Market Revenue (US$ Mn) Comparison by Subscription (2016-2032)
- Table 72: Eastern Europe Dating and Matchmaking Market Revenue (US$ Mn) Comparison by Service (2016-2032)
- Table 73: Eastern Europe Dating and Matchmaking Market Revenue (US$ Mn) Comparison by Demographics (2016-2032)
- Table 74: Eastern Europe Dating and Matchmaking Market Y-o-Y Growth Rate Comparison by Country (2016-2032)
- Table 75: Eastern Europe Dating and Matchmaking Market Y-o-Y Growth Rate Comparison by Type (2016-2032)
- Table 76: Eastern Europe Dating and Matchmaking Market Y-o-Y Growth Rate Comparison by Subscription (2016-2032)
- Table 77: Eastern Europe Dating and Matchmaking Market Y-o-Y Growth Rate Comparison by Service (2016-2032)
- Table 78: Eastern Europe Dating and Matchmaking Market Y-o-Y Growth Rate Comparison by Demographics (2016-2032)
- Table 79: Eastern Europe Dating and Matchmaking Market Share Comparison by Country (2016-2032)
- Table 80: Eastern Europe Dating and Matchmaking Market Share Comparison by Type (2016-2032)
- Table 81: Eastern Europe Dating and Matchmaking Market Share Comparison by Subscription (2016-2032)
- Table 82: Eastern Europe Dating and Matchmaking Market Share Comparison by Service (2016-2032)
- Table 83: Eastern Europe Dating and Matchmaking Market Share Comparison by Demographics (2016-2032)
- Table 84: APAC Dating and Matchmaking Market Comparison by Type (2016-2032)
- Table 85: APAC Dating and Matchmaking Market Comparison by Subscription (2016-2032)
- Table 86: APAC Dating and Matchmaking Market Comparison by Service (2016-2032)
- Table 87: APAC Dating and Matchmaking Market Comparison by Demographics (2016-2032)
- Table 88: APAC Dating and Matchmaking Market Revenue (US$ Mn) Comparison by Country (2016-2032)
- Table 89: APAC Dating and Matchmaking Market Revenue (US$ Mn) (2016-2032)
- Table 90: APAC Dating and Matchmaking Market Revenue (US$ Mn) Comparison by Country (2016-2032)
- Table 91: APAC Dating and Matchmaking Market Revenue (US$ Mn) Comparison by Type (2016-2032)
- Table 92: APAC Dating and Matchmaking Market Revenue (US$ Mn) Comparison by Subscription (2016-2032)
- Table 93: APAC Dating and Matchmaking Market Revenue (US$ Mn) Comparison by Service (2016-2032)
- Table 94: APAC Dating and Matchmaking Market Revenue (US$ Mn) Comparison by Demographics (2016-2032)
- Table 95: APAC Dating and Matchmaking Market Y-o-Y Growth Rate Comparison by Country (2016-2032)
- Table 96: APAC Dating and Matchmaking Market Y-o-Y Growth Rate Comparison by Type (2016-2032)
- Table 97: APAC Dating and Matchmaking Market Y-o-Y Growth Rate Comparison by Subscription (2016-2032)
- Table 98: APAC Dating and Matchmaking Market Y-o-Y Growth Rate Comparison by Service (2016-2032)
- Table 99: APAC Dating and Matchmaking Market Y-o-Y Growth Rate Comparison by Demographics (2016-2032)
- Table 100: APAC Dating and Matchmaking Market Share Comparison by Country (2016-2032)
- Table 101: APAC Dating and Matchmaking Market Share Comparison by Type (2016-2032)
- Table 102: APAC Dating and Matchmaking Market Share Comparison by Subscription (2016-2032)
- Table 103: APAC Dating and Matchmaking Market Share Comparison by Service (2016-2032)
- Table 104: APAC Dating and Matchmaking Market Share Comparison by Demographics (2016-2032)
- Table 105: Latin America Dating and Matchmaking Market Comparison by Type (2016-2032)
- Table 106: Latin America Dating and Matchmaking Market Comparison by Subscription (2016-2032)
- Table 107: Latin America Dating and Matchmaking Market Comparison by Service (2016-2032)
- Table 108: Latin America Dating and Matchmaking Market Comparison by Demographics (2016-2032)
- Table 109: Latin America Dating and Matchmaking Market Revenue (US$ Mn) Comparison by Country (2016-2032)
- Table 110: Latin America Dating and Matchmaking Market Revenue (US$ Mn) (2016-2032)
- Table 111: Latin America Dating and Matchmaking Market Revenue (US$ Mn) Comparison by Country (2016-2032)
- Table 112: Latin America Dating and Matchmaking Market Revenue (US$ Mn) Comparison by Type (2016-2032)
- Table 113: Latin America Dating and Matchmaking Market Revenue (US$ Mn) Comparison by Subscription (2016-2032)
- Table 114: Latin America Dating and Matchmaking Market Revenue (US$ Mn) Comparison by Service (2016-2032)
- Table 115: Latin America Dating and Matchmaking Market Revenue (US$ Mn) Comparison by Demographics (2016-2032)
- Table 116: Latin America Dating and Matchmaking Market Y-o-Y Growth Rate Comparison by Country (2016-2032)
- Table 117: Latin America Dating and Matchmaking Market Y-o-Y Growth Rate Comparison by Type (2016-2032)
- Table 118: Latin America Dating and Matchmaking Market Y-o-Y Growth Rate Comparison by Subscription (2016-2032)
- Table 119: Latin America Dating and Matchmaking Market Y-o-Y Growth Rate Comparison by Service (2016-2032)
- Table 120: Latin America Dating and Matchmaking Market Y-o-Y Growth Rate Comparison by Demographics (2016-2032)
- Table 121: Latin America Dating and Matchmaking Market Share Comparison by Country (2016-2032)
- Table 122: Latin America Dating and Matchmaking Market Share Comparison by Type (2016-2032)
- Table 123: Latin America Dating and Matchmaking Market Share Comparison by Subscription (2016-2032)
- Table 124: Latin America Dating and Matchmaking Market Share Comparison by Service (2016-2032)
- Table 125: Latin America Dating and Matchmaking Market Share Comparison by Demographics (2016-2032)
- Table 126: Middle East & Africa Dating and Matchmaking Market Comparison by Type (2016-2032)
- Table 127: Middle East & Africa Dating and Matchmaking Market Comparison by Subscription (2016-2032)
- Table 128: Middle East & Africa Dating and Matchmaking Market Comparison by Service (2016-2032)
- Table 129: Middle East & Africa Dating and Matchmaking Market Comparison by Demographics (2016-2032)
- Table 130: Middle East & Africa Dating and Matchmaking Market Revenue (US$ Mn) Comparison by Country (2016-2032)
- Table 131: Middle East & Africa Dating and Matchmaking Market Revenue (US$ Mn) (2016-2032)
- Table 132: Middle East & Africa Dating and Matchmaking Market Revenue (US$ Mn) Comparison by Country (2016-2032)
- Table 133: Middle East & Africa Dating and Matchmaking Market Revenue (US$ Mn) Comparison by Type (2016-2032)
- Table 134: Middle East & Africa Dating and Matchmaking Market Revenue (US$ Mn) Comparison by Subscription (2016-2032)
- Table 135: Middle East & Africa Dating and Matchmaking Market Revenue (US$ Mn) Comparison by Service (2016-2032)
- Table 136: Middle East & Africa Dating and Matchmaking Market Revenue (US$ Mn) Comparison by Demographics (2016-2032)
- Table 137: Middle East & Africa Dating and Matchmaking Market Y-o-Y Growth Rate Comparison by Country (2016-2032)
- Table 138: Middle East & Africa Dating and Matchmaking Market Y-o-Y Growth Rate Comparison by Type (2016-2032)
- Table 139: Middle East & Africa Dating and Matchmaking Market Y-o-Y Growth Rate Comparison by Subscription (2016-2032)
- Table 140: Middle East & Africa Dating and Matchmaking Market Y-o-Y Growth Rate Comparison by Service (2016-2032)
- Table 141: Middle East & Africa Dating and Matchmaking Market Y-o-Y Growth Rate Comparison by Demographics (2016-2032)
- Table 142: Middle East & Africa Dating and Matchmaking Market Share Comparison by Country (2016-2032)
- Table 143: Middle East & Africa Dating and Matchmaking Market Share Comparison by Type (2016-2032)
- Table 144: Middle East & Africa Dating and Matchmaking Market Share Comparison by Subscription (2016-2032)
- Table 145: Middle East & Africa Dating and Matchmaking Market Share Comparison by Service (2016-2032)
- Table 146: Middle East & Africa Dating and Matchmaking Market Share Comparison by Demographics (2016-2032)
- List of Figures
- Figure 1: Global Dating and Matchmaking Market Revenue (US$ Mn) Market Share by Type in 2022
- Figure 2: Global Dating and Matchmaking Market Attractiveness Analysis by Type, 2016-2032
- Figure 3: Global Dating and Matchmaking Market Revenue (US$ Mn) Market Share by Subscriptionin 2022
- Figure 4: Global Dating and Matchmaking Market Attractiveness Analysis by Subscription, 2016-2032
- Figure 5: Global Dating and Matchmaking Market Revenue (US$ Mn) Market Share by Servicein 2022
- Figure 6: Global Dating and Matchmaking Market Attractiveness Analysis by Service, 2016-2032
- Figure 7: Global Dating and Matchmaking Market Revenue (US$ Mn) Market Share by Demographicsin 2022
- Figure 8: Global Dating and Matchmaking Market Attractiveness Analysis by Demographics, 2016-2032
- Figure 9: Global Dating and Matchmaking Market Revenue (US$ Mn) Market Share by Region in 2022
- Figure 10: Global Dating and Matchmaking Market Attractiveness Analysis by Region, 2016-2032
- Figure 11: Global Dating and Matchmaking Market Revenue (US$ Mn) (2016-2032)
- Figure 12: Global Dating and Matchmaking Market Revenue (US$ Mn) Comparison by Region (2016-2032)
- Figure 13: Global Dating and Matchmaking Market Revenue (US$ Mn) Comparison by Type (2016-2032)
- Figure 14: Global Dating and Matchmaking Market Revenue (US$ Mn) Comparison by Subscription (2016-2032)
- Figure 15: Global Dating and Matchmaking Market Revenue (US$ Mn) Comparison by Service (2016-2032)
- Figure 16: Global Dating and Matchmaking Market Revenue (US$ Mn) Comparison by Demographics (2016-2032)
- Figure 17: Global Dating and Matchmaking Market Y-o-Y Growth Rate Comparison by Region (2016-2032)
- Figure 18: Global Dating and Matchmaking Market Y-o-Y Growth Rate Comparison by Type (2016-2032)
- Figure 19: Global Dating and Matchmaking Market Y-o-Y Growth Rate Comparison by Subscription (2016-2032)
- Figure 20: Global Dating and Matchmaking Market Y-o-Y Growth Rate Comparison by Service (2016-2032)
- Figure 21: Global Dating and Matchmaking Market Y-o-Y Growth Rate Comparison by Demographics (2016-2032)
- Figure 22: Global Dating and Matchmaking Market Share Comparison by Region (2016-2032)
- Figure 23: Global Dating and Matchmaking Market Share Comparison by Type (2016-2032)
- Figure 24: Global Dating and Matchmaking Market Share Comparison by Subscription (2016-2032)
- Figure 25: Global Dating and Matchmaking Market Share Comparison by Service (2016-2032)
- Figure 26: Global Dating and Matchmaking Market Share Comparison by Demographics (2016-2032)
- Figure 27: North America Dating and Matchmaking Market Revenue (US$ Mn) Market Share by Typein 2022
- Figure 28: North America Dating and Matchmaking Market Attractiveness Analysis by Type, 2016-2032
- Figure 29: North America Dating and Matchmaking Market Revenue (US$ Mn) Market Share by Subscriptionin 2022
- Figure 30: North America Dating and Matchmaking Market Attractiveness Analysis by Subscription, 2016-2032
- Figure 31: North America Dating and Matchmaking Market Revenue (US$ Mn) Market Share by Servicein 2022
- Figure 32: North America Dating and Matchmaking Market Attractiveness Analysis by Service, 2016-2032
- Figure 33: North America Dating and Matchmaking Market Revenue (US$ Mn) Market Share by Demographicsin 2022
- Figure 34: North America Dating and Matchmaking Market Attractiveness Analysis by Demographics, 2016-2032
- Figure 35: North America Dating and Matchmaking Market Revenue (US$ Mn) Market Share by Country in 2022
- Figure 36: North America Dating and Matchmaking Market Attractiveness Analysis by Country, 2016-2032
- Figure 37: North America Dating and Matchmaking Market Revenue (US$ Mn) (2016-2032)
- Figure 38: North America Dating and Matchmaking Market Revenue (US$ Mn) Comparison by Country (2016-2032)
- Figure 39: North America Dating and Matchmaking Market Revenue (US$ Mn) Comparison by Type (2016-2032)
- Figure 40: North America Dating and Matchmaking Market Revenue (US$ Mn) Comparison by Subscription (2016-2032)
- Figure 41: North America Dating and Matchmaking Market Revenue (US$ Mn) Comparison by Service (2016-2032)
- Figure 42: North America Dating and Matchmaking Market Revenue (US$ Mn) Comparison by Demographics (2016-2032)
- Figure 43: North America Dating and Matchmaking Market Y-o-Y Growth Rate Comparison by Country (2016-2032)
- Figure 44: North America Dating and Matchmaking Market Y-o-Y Growth Rate Comparison by Type (2016-2032)
- Figure 45: North America Dating and Matchmaking Market Y-o-Y Growth Rate Comparison by Subscription (2016-2032)
- Figure 46: North America Dating and Matchmaking Market Y-o-Y Growth Rate Comparison by Service (2016-2032)
- Figure 47: North America Dating and Matchmaking Market Y-o-Y Growth Rate Comparison by Demographics (2016-2032)
- Figure 48: North America Dating and Matchmaking Market Share Comparison by Country (2016-2032)
- Figure 49: North America Dating and Matchmaking Market Share Comparison by Type (2016-2032)
- Figure 50: North America Dating and Matchmaking Market Share Comparison by Subscription (2016-2032)
- Figure 51: North America Dating and Matchmaking Market Share Comparison by Service (2016-2032)
- Figure 52: North America Dating and Matchmaking Market Share Comparison by Demographics (2016-2032)
- Figure 53: Western Europe Dating and Matchmaking Market Revenue (US$ Mn) Market Share by Typein 2022
- Figure 54: Western Europe Dating and Matchmaking Market Attractiveness Analysis by Type, 2016-2032
- Figure 55: Western Europe Dating and Matchmaking Market Revenue (US$ Mn) Market Share by Subscriptionin 2022
- Figure 56: Western Europe Dating and Matchmaking Market Attractiveness Analysis by Subscription, 2016-2032
- Figure 57: Western Europe Dating and Matchmaking Market Revenue (US$ Mn) Market Share by Servicein 2022
- Figure 58: Western Europe Dating and Matchmaking Market Attractiveness Analysis by Service, 2016-2032
- Figure 59: Western Europe Dating and Matchmaking Market Revenue (US$ Mn) Market Share by Demographicsin 2022
- Figure 60: Western Europe Dating and Matchmaking Market Attractiveness Analysis by Demographics, 2016-2032
- Figure 61: Western Europe Dating and Matchmaking Market Revenue (US$ Mn) Market Share by Country in 2022
- Figure 62: Western Europe Dating and Matchmaking Market Attractiveness Analysis by Country, 2016-2032
- Figure 63: Western Europe Dating and Matchmaking Market Revenue (US$ Mn) (2016-2032)
- Figure 64: Western Europe Dating and Matchmaking Market Revenue (US$ Mn) Comparison by Country (2016-2032)
- Figure 65: Western Europe Dating and Matchmaking Market Revenue (US$ Mn) Comparison by Type (2016-2032)
- Figure 66: Western Europe Dating and Matchmaking Market Revenue (US$ Mn) Comparison by Subscription (2016-2032)
- Figure 67: Western Europe Dating and Matchmaking Market Revenue (US$ Mn) Comparison by Service (2016-2032)
- Figure 68: Western Europe Dating and Matchmaking Market Revenue (US$ Mn) Comparison by Demographics (2016-2032)
- Figure 69: Western Europe Dating and Matchmaking Market Y-o-Y Growth Rate Comparison by Country (2016-2032)
- Figure 70: Western Europe Dating and Matchmaking Market Y-o-Y Growth Rate Comparison by Type (2016-2032)
- Figure 71: Western Europe Dating and Matchmaking Market Y-o-Y Growth Rate Comparison by Subscription (2016-2032)
- Figure 72: Western Europe Dating and Matchmaking Market Y-o-Y Growth Rate Comparison by Service (2016-2032)
- Figure 73: Western Europe Dating and Matchmaking Market Y-o-Y Growth Rate Comparison by Demographics (2016-2032)
- Figure 74: Western Europe Dating and Matchmaking Market Share Comparison by Country (2016-2032)
- Figure 75: Western Europe Dating and Matchmaking Market Share Comparison by Type (2016-2032)
- Figure 76: Western Europe Dating and Matchmaking Market Share Comparison by Subscription (2016-2032)
- Figure 77: Western Europe Dating and Matchmaking Market Share Comparison by Service (2016-2032)
- Figure 78: Western Europe Dating and Matchmaking Market Share Comparison by Demographics (2016-2032)
- Figure 79: Eastern Europe Dating and Matchmaking Market Revenue (US$ Mn) Market Share by Typein 2022
- Figure 80: Eastern Europe Dating and Matchmaking Market Attractiveness Analysis by Type, 2016-2032
- Figure 81: Eastern Europe Dating and Matchmaking Market Revenue (US$ Mn) Market Share by Subscriptionin 2022
- Figure 82: Eastern Europe Dating and Matchmaking Market Attractiveness Analysis by Subscription, 2016-2032
- Figure 83: Eastern Europe Dating and Matchmaking Market Revenue (US$ Mn) Market Share by Servicein 2022
- Figure 84: Eastern Europe Dating and Matchmaking Market Attractiveness Analysis by Service, 2016-2032
- Figure 85: Eastern Europe Dating and Matchmaking Market Revenue (US$ Mn) Market Share by Demographicsin 2022
- Figure 86: Eastern Europe Dating and Matchmaking Market Attractiveness Analysis by Demographics, 2016-2032
- Figure 87: Eastern Europe Dating and Matchmaking Market Revenue (US$ Mn) Market Share by Country in 2022
- Figure 88: Eastern Europe Dating and Matchmaking Market Attractiveness Analysis by Country, 2016-2032
- Figure 89: Eastern Europe Dating and Matchmaking Market Revenue (US$ Mn) (2016-2032)
- Figure 90: Eastern Europe Dating and Matchmaking Market Revenue (US$ Mn) Comparison by Country (2016-2032)
- Figure 91: Eastern Europe Dating and Matchmaking Market Revenue (US$ Mn) Comparison by Type (2016-2032)
- Figure 92: Eastern Europe Dating and Matchmaking Market Revenue (US$ Mn) Comparison by Subscription (2016-2032)
- Figure 93: Eastern Europe Dating and Matchmaking Market Revenue (US$ Mn) Comparison by Service (2016-2032)
- Figure 94: Eastern Europe Dating and Matchmaking Market Revenue (US$ Mn) Comparison by Demographics (2016-2032)
- Figure 95: Eastern Europe Dating and Matchmaking Market Y-o-Y Growth Rate Comparison by Country (2016-2032)
- Figure 96: Eastern Europe Dating and Matchmaking Market Y-o-Y Growth Rate Comparison by Type (2016-2032)
- Figure 97: Eastern Europe Dating and Matchmaking Market Y-o-Y Growth Rate Comparison by Subscription (2016-2032)
- Figure 98: Eastern Europe Dating and Matchmaking Market Y-o-Y Growth Rate Comparison by Service (2016-2032)
- Figure 99: Eastern Europe Dating and Matchmaking Market Y-o-Y Growth Rate Comparison by Demographics (2016-2032)
- Figure 100: Eastern Europe Dating and Matchmaking Market Share Comparison by Country (2016-2032)
- Figure 101: Eastern Europe Dating and Matchmaking Market Share Comparison by Type (2016-2032)
- Figure 102: Eastern Europe Dating and Matchmaking Market Share Comparison by Subscription (2016-2032)
- Figure 103: Eastern Europe Dating and Matchmaking Market Share Comparison by Service (2016-2032)
- Figure 104: Eastern Europe Dating and Matchmaking Market Share Comparison by Demographics (2016-2032)
- Figure 105: APAC Dating and Matchmaking Market Revenue (US$ Mn) Market Share by Typein 2022
- Figure 106: APAC Dating and Matchmaking Market Attractiveness Analysis by Type, 2016-2032
- Figure 107: APAC Dating and Matchmaking Market Revenue (US$ Mn) Market Share by Subscriptionin 2022
- Figure 108: APAC Dating and Matchmaking Market Attractiveness Analysis by Subscription, 2016-2032
- Figure 109: APAC Dating and Matchmaking Market Revenue (US$ Mn) Market Share by Servicein 2022
- Figure 110: APAC Dating and Matchmaking Market Attractiveness Analysis by Service, 2016-2032
- Figure 111: APAC Dating and Matchmaking Market Revenue (US$ Mn) Market Share by Demographicsin 2022
- Figure 112: APAC Dating and Matchmaking Market Attractiveness Analysis by Demographics, 2016-2032
- Figure 113: APAC Dating and Matchmaking Market Revenue (US$ Mn) Market Share by Country in 2022
- Figure 114: APAC Dating and Matchmaking Market Attractiveness Analysis by Country, 2016-2032
- Figure 115: APAC Dating and Matchmaking Market Revenue (US$ Mn) (2016-2032)
- Figure 116: APAC Dating and Matchmaking Market Revenue (US$ Mn) Comparison by Country (2016-2032)
- Figure 117: APAC Dating and Matchmaking Market Revenue (US$ Mn) Comparison by Type (2016-2032)
- Figure 118: APAC Dating and Matchmaking Market Revenue (US$ Mn) Comparison by Subscription (2016-2032)
- Figure 119: APAC Dating and Matchmaking Market Revenue (US$ Mn) Comparison by Service (2016-2032)
- Figure 120: APAC Dating and Matchmaking Market Revenue (US$ Mn) Comparison by Demographics (2016-2032)
- Figure 121: APAC Dating and Matchmaking Market Y-o-Y Growth Rate Comparison by Country (2016-2032)
- Figure 122: APAC Dating and Matchmaking Market Y-o-Y Growth Rate Comparison by Type (2016-2032)
- Figure 123: APAC Dating and Matchmaking Market Y-o-Y Growth Rate Comparison by Subscription (2016-2032)
- Figure 124: APAC Dating and Matchmaking Market Y-o-Y Growth Rate Comparison by Service (2016-2032)
- Figure 125: APAC Dating and Matchmaking Market Y-o-Y Growth Rate Comparison by Demographics (2016-2032)
- Figure 126: APAC Dating and Matchmaking Market Share Comparison by Country (2016-2032)
- Figure 127: APAC Dating and Matchmaking Market Share Comparison by Type (2016-2032)
- Figure 128: APAC Dating and Matchmaking Market Share Comparison by Subscription (2016-2032)
- Figure 129: APAC Dating and Matchmaking Market Share Comparison by Service (2016-2032)
- Figure 130: APAC Dating and Matchmaking Market Share Comparison by Demographics (2016-2032)
- Figure 131: Latin America Dating and Matchmaking Market Revenue (US$ Mn) Market Share by Typein 2022
- Figure 132: Latin America Dating and Matchmaking Market Attractiveness Analysis by Type, 2016-2032
- Figure 133: Latin America Dating and Matchmaking Market Revenue (US$ Mn) Market Share by Subscriptionin 2022
- Figure 134: Latin America Dating and Matchmaking Market Attractiveness Analysis by Subscription, 2016-2032
- Figure 135: Latin America Dating and Matchmaking Market Revenue (US$ Mn) Market Share by Servicein 2022
- Figure 136: Latin America Dating and Matchmaking Market Attractiveness Analysis by Service, 2016-2032
- Figure 137: Latin America Dating and Matchmaking Market Revenue (US$ Mn) Market Share by Demographicsin 2022
- Figure 138: Latin America Dating and Matchmaking Market Attractiveness Analysis by Demographics, 2016-2032
- Figure 139: Latin America Dating and Matchmaking Market Revenue (US$ Mn) Market Share by Country in 2022
- Figure 140: Latin America Dating and Matchmaking Market Attractiveness Analysis by Country, 2016-2032
- Figure 141: Latin America Dating and Matchmaking Market Revenue (US$ Mn) (2016-2032)
- Figure 142: Latin America Dating and Matchmaking Market Revenue (US$ Mn) Comparison by Country (2016-2032)
- Figure 143: Latin America Dating and Matchmaking Market Revenue (US$ Mn) Comparison by Type (2016-2032)
- Figure 144: Latin America Dating and Matchmaking Market Revenue (US$ Mn) Comparison by Subscription (2016-2032)
- Figure 145: Latin America Dating and Matchmaking Market Revenue (US$ Mn) Comparison by Service (2016-2032)
- Figure 146: Latin America Dating and Matchmaking Market Revenue (US$ Mn) Comparison by Demographics (2016-2032)
- Figure 147: Latin America Dating and Matchmaking Market Y-o-Y Growth Rate Comparison by Country (2016-2032)
- Figure 148: Latin America Dating and Matchmaking Market Y-o-Y Growth Rate Comparison by Type (2016-2032)
- Figure 149: Latin America Dating and Matchmaking Market Y-o-Y Growth Rate Comparison by Subscription (2016-2032)
- Figure 150: Latin America Dating and Matchmaking Market Y-o-Y Growth Rate Comparison by Service (2016-2032)
- Figure 151: Latin America Dating and Matchmaking Market Y-o-Y Growth Rate Comparison by Demographics (2016-2032)
- Figure 152: Latin America Dating and Matchmaking Market Share Comparison by Country (2016-2032)
- Figure 153: Latin America Dating and Matchmaking Market Share Comparison by Type (2016-2032)
- Figure 154: Latin America Dating and Matchmaking Market Share Comparison by Subscription (2016-2032)
- Figure 155: Latin America Dating and Matchmaking Market Share Comparison by Service (2016-2032)
- Figure 156: Latin America Dating and Matchmaking Market Share Comparison by Demographics (2016-2032)
- Figure 157: Middle East & Africa Dating and Matchmaking Market Revenue (US$ Mn) Market Share by Typein 2022
- Figure 158: Middle East & Africa Dating and Matchmaking Market Attractiveness Analysis by Type, 2016-2032
- Figure 159: Middle East & Africa Dating and Matchmaking Market Revenue (US$ Mn) Market Share by Subscriptionin 2022
- Figure 160: Middle East & Africa Dating and Matchmaking Market Attractiveness Analysis by Subscription, 2016-2032
- Figure 161: Middle East & Africa Dating and Matchmaking Market Revenue (US$ Mn) Market Share by Servicein 2022
- Figure 162: Middle East & Africa Dating and Matchmaking Market Attractiveness Analysis by Service, 2016-2032
- Figure 163: Middle East & Africa Dating and Matchmaking Market Revenue (US$ Mn) Market Share by Demographicsin 2022
- Figure 164: Middle East & Africa Dating and Matchmaking Market Attractiveness Analysis by Demographics, 2016-2032
- Figure 165: Middle East & Africa Dating and Matchmaking Market Revenue (US$ Mn) Market Share by Country in 2022
- Figure 166: Middle East & Africa Dating and Matchmaking Market Attractiveness Analysis by Country, 2016-2032
- Figure 167: Middle East & Africa Dating and Matchmaking Market Revenue (US$ Mn) (2016-2032)
- Figure 168: Middle East & Africa Dating and Matchmaking Market Revenue (US$ Mn) Comparison by Country (2016-2032)
- Figure 169: Middle East & Africa Dating and Matchmaking Market Revenue (US$ Mn) Comparison by Type (2016-2032)
- Figure 170: Middle East & Africa Dating and Matchmaking Market Revenue (US$ Mn) Comparison by Subscription (2016-2032)
- Figure 171: Middle East & Africa Dating and Matchmaking Market Revenue (US$ Mn) Comparison by Service (2016-2032)
- Figure 172: Middle East & Africa Dating and Matchmaking Market Revenue (US$ Mn) Comparison by Demographics (2016-2032)
- Figure 173: Middle East & Africa Dating and Matchmaking Market Y-o-Y Growth Rate Comparison by Country (2016-2032)
- Figure 174: Middle East & Africa Dating and Matchmaking Market Y-o-Y Growth Rate Comparison by Type (2016-2032)
- Figure 175: Middle East & Africa Dating and Matchmaking Market Y-o-Y Growth Rate Comparison by Subscription (2016-2032)
- Figure 176: Middle East & Africa Dating and Matchmaking Market Y-o-Y Growth Rate Comparison by Service (2016-2032)
- Figure 177: Middle East & Africa Dating and Matchmaking Market Y-o-Y Growth Rate Comparison by Demographics (2016-2032)
- Figure 178: Middle East & Africa Dating and Matchmaking Market Share Comparison by Country (2016-2032)
- Figure 179: Middle East & Africa Dating and Matchmaking Market Share Comparison by Type (2016-2032)
- Figure 180: Middle East & Africa Dating and Matchmaking Market Share Comparison by Subscription (2016-2032)
- Figure 181: Middle East & Africa Dating and Matchmaking Market Share Comparison by Service (2016-2032)
- Figure 182: Middle East & Africa Dating and Matchmaking Market Share Comparison by Demographics (2016-2032)
- 1. Executive Summary
-
- Match Group, LLC
- Bumble Inc.
- Grindr LLC
- eHarmony, Inc.
- Spark Networks, Inc.
- The Meet Group, Inc.
- com.au Pty Ltd
- Coffee Meets Bagel
- Ruby Life Inc.
- Mobeze, Inc.
- C-Date
- Other key players
Our Clients


View Our Licence Options
