
Cosmetic Raw Materials Market By Type (Natural, Synthetic, Hybrid cosmetic raw materials), By Application(Skincare, Haircare, Makeup, Fragrances), By Region And Companies - Industry Segment Outlook, Market Assessment, Competition Scenario, Trends, And Forecast 2023-2032
-
14822
-
Nov 2023
-
286
-


-
This report was compiled by Research Team Research team of over 50 passionate professionals leverages advanced research methodologies and analytical expertise to deliver insightful, data-driven market intelligence that empowers businesses across diverse industries to make strategic, well-informed Correspondence Research Team Linkedin | Detailed Market research Methodology Our methodology involves a mix of primary research, including interviews with leading mental health experts, and secondary research from reputable medical journals and databases. View Detailed Methodology Page
-
Quick Navigation
Report Overview
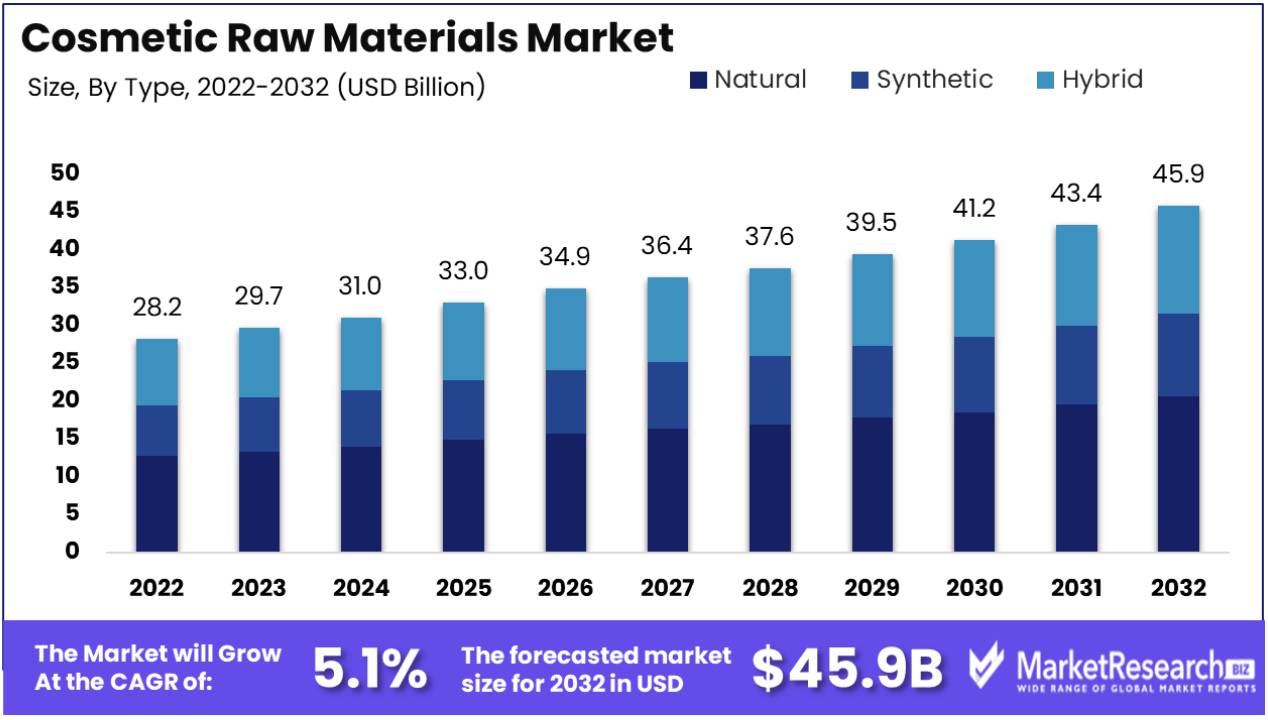
Cosmetic Raw Materials Market size is expected to be worth around USD 48.2 Mn by 2032 from USD 28.23 Mn in 2022, growing at a CAGR of 5.1% during the forecast period from 2023 to 2032.
The surge in demand regarding the advantages of cosmetic products is the main driving factor for the cosmetic raw material market. Cosmetic products are essential in everyday life activities. Individuals apply the cosmetics to look confident and enhance their skin tone.
Cosmetic products are categorized for different purposes such as skin, hair, color cosmetics, and perfumes that help them to lead a healthy and hygienic lifestyle. Up surging the fashion trends by new product innovations in hair color and other cosmetic formulations and the packaging pattern helps in market expansion.
There is a significant expansion in brand recognition and the launching of new cosmetic products on online platforms also contributes to market growth in the forecast period. Customers are getting more inclined towards natural or organic skin products.
Cosmetic raw material markets are expanding due to an aging population; elderly individuals frequently seek anti-aging products treatments and hair dye colors to alter their looks. Within this industry, there are high-quality raw materials such as hyaluronic acid, retinol, and vitamin C sold online retailers for use in anti-aging products serums, and treatments.
Online platforms provide access to unique products not readily available in physical stores; this is particularly beneficial in India's cosmetic brands that rely on unique formulations that separate them from competitors. As the majority of individuals are getting skincare products consciousness, they can now get several types of natural and organic oils for their skin tone.
The organic products are chemical-free and have eco-friendly options. Not only this, individuals can easily get information about the raw ingredients that are used for making any specific products. It has a detailed description list and the steps for applying any cosmetics. This kind of transparency, quality, several types of cosmetic products and availability attracts the customers easily.
Thus, making people opt for online purchases as it is cost-effective and consumes time by not visiting the stores physically. The attractive discounts and delivery options, make the cosmetic market more engaging. Navigate the Cosmetic Raw Materials Market for clean beauty formulations, ensuring a wholesome blend of efficacy and sustainability.
Driving factors
Natural and Organic Cosmetic Demand Drives Raw Materials Market Growth
The increasing demand for natural and organic cosmetics is a major driving force in the cosmetic raw materials market. Consumers are becoming more environmentally conscious and health-aware, leading to a preference for products with natural, organic, and sustainable ingredients. This shift has compelled cosmetic manufacturers to source raw materials that align with these values, such as plant-based extracts, natural oils, and minerals. The trend towards green beauty is not just a fad but a lasting movement, suggesting continued growth in the market for natural and organic raw materials. This shift is also encouraging innovation in sourcing and processing these materials sustainably.
Skincare Routine Popularity Boosts Raw Materials Market
The increasing demand for skincare routines is another key factor in the growth of the cosmetic raw materials market. As consumers adopt more comprehensive skincare routines, the variety and volume of products used have increased. Cleansers, serums, moisturizers, and sunscreens all fall into this category; each requiring specific raw materials. As skincare routines gain in popularity due to education and marketing campaigns, demand for high-quality and effective cosmetic raw materials grows steadily.
Social Media’s Role in Cosmetic Raw Materials Market Amplification
The growing promotion of cosmetic products on social media significantly contributes to the market’s growth. Influencers and beauty vloggers on platforms like Instagram, YouTube, and TikTok showcase various cosmetic products and trends, creating widespread awareness and interest. This digital exposure drives consumer demand for the latest cosmetic products, subsequently increasing the demand for innovative and trendy raw materials to develop these products. The influence of social media is expected to continue shaping consumer preferences and trends in the cosmetic industry, directly impacting the raw materials market.
The Middle-Class Boom and Cosmetic Consumption
The growing middle-class population globally presents vast opportunities for the cosmetic raw materials market. As disposable incomes rise, so does the ability and willingness to spend on personal care products, including cosmetics. This expanding consumer base is seeking quality cosmetic products that are accessible and affordable, leading to increased production and diversification in the cosmetic industry. The growth of the middle class, particularly in emerging economies, is expected to significantly contribute to the sustained demand for cosmetic raw materials, fueling market growth and diversification.
Restraining Factors
Fluctuating Prices of Raw Materials Restrain Cosmetic Raw Materials Market Growth
Fluctuations in the prices of raw materials add an element of unpredictability to the cosmetic raw materials market. Factors such as climate change, geopolitical issues, and supply chain disruptions can cause volatility in the cost of essential ingredients. This volatility poses a challenge for cosmetic manufacturers in budgeting and pricing strategies, potentially leading to reduced profit margins or higher product prices, which can impact consumer demand and market growth.
Stringent Regulations on Chemicals in Cosmetics Restrain Market Growth
Stringent regulations governing the use of certain chemicals in cosmetics act as a restraining factor for the market. These regulations, aimed at ensuring consumer safety, can limit the types of ingredients that manufacturers can use. Complying with these regulatory frameworks often requires additional testing and validation, increasing the cost and time to market. This can hinder innovation and delay the introduction of new products, impacting the market's overall growth potential.
Segmentation Analysis of Cosmetic Raw Materials Market
By Type Analysis
Natural cosmetic raw materials lead the market segment, reflecting the growing consumer preference for natural and organic products. This trend is driven by rising awareness of synthetic materials' environmental impact and a shift toward sustainability within the cosmetics industry. Natural ingredients known for their biocompatibility and reduced risk of skin irritation are increasingly preferred for use in formulations of both skincare and haircare products.
Synthetic materials, while not as popular, remain essential due to their cost-effectiveness, consistency, and a wide array of uses. Hybrid cosmetic raw materials, combining natural and synthetic elements, are emerging as a compromise, offering the benefits of both types. These segments are important for catering to diverse consumer needs and product performance requirements.
By Application Analysis
Skincare dominates the application of cosmetic raw materials. This prominence is driven by the global rise in skincare awareness and the demand for products offering anti-aging products, moisturizing, and sun protection benefits. Innovations in natural and active ingredients for skincare products fuel this segment's growth, aligning with consumer desires for effective and safe products. The cosmetic industry is thriving, fueled by an increase in awareness, particularly in the skin care segment of Cosmetic Raw Materials.
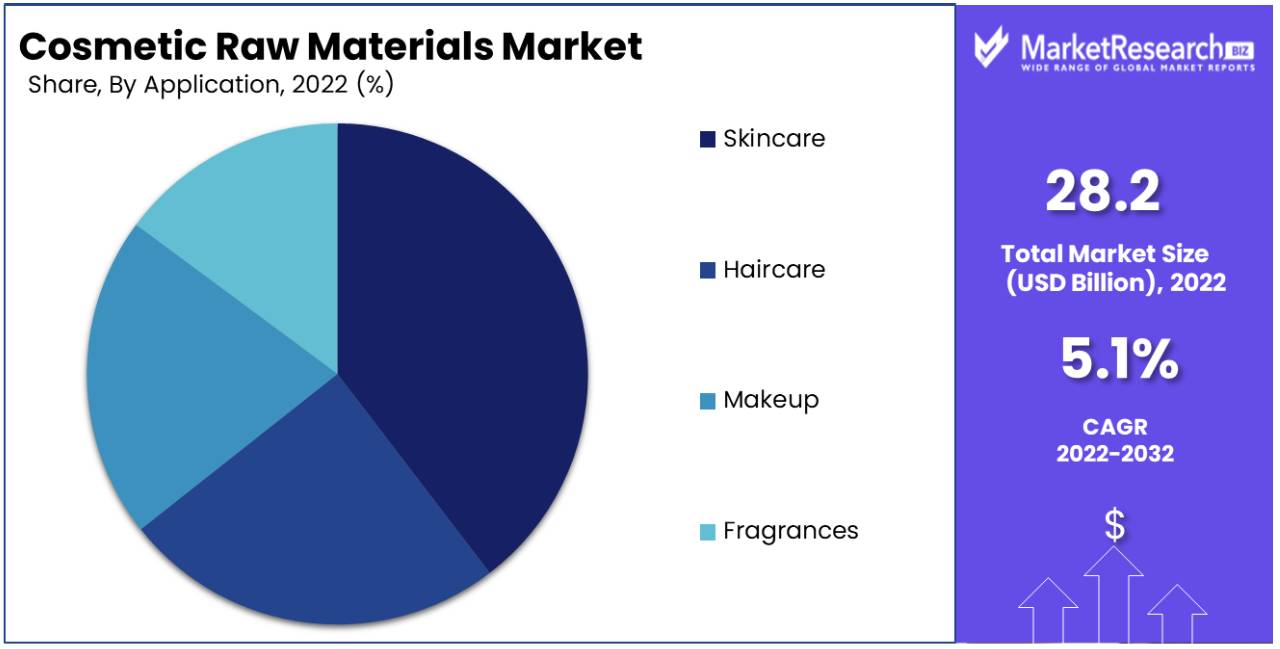
Hair Care products are increasingly using natural ingredients for scalp health and hair nourishment. Makeup and fragrances also integrate natural and synthetic materials to achieve desired aesthetic effects and scent profiles. Though these segments may be smaller than skincare, they still play a significant role in shaping the industry by driving innovation and diversification of product offerings.
The cosmetic raw materials industry is marked by increasing consumer preferences for sustainable and skin-friendly products that use natural ingredients. The skincare segment remains the most significant application area, reflecting the widespread consumer focus on skin health and appearance. The industry is also supported by the ongoing development and application of synthetic and hybrid materials, which are crucial in meeting the diverse requirements of the cosmetics industry.
Key Market Segments
By Type
- Natural
- Synthetic
- Hybrid cosmetic raw materials
By Application
- Skincare
- Haircare
- Makeup
- Fragrances
Growth Opportunity
Increasing Demand for Natural and Organic Cosmetics Drives Growth in Cosmetic Raw Materials Market
The rising consumer preference for natural and organic cosmetics presents a substantial growth opportunity in the cosmetic raw materials industry. As consumers prioritize healthier and eco-friendly beauty choices, the demand for raw materials derived from natural sources, such as plant extracts and organic compounds, is surging. Manufacturers that offer a wide range of natural and organic cosmetic raw materials stand to benefit, as these products align with the global trend towards clean and sustainable beauty, fostering market expansion. The Cosmetic Raw Materials Industry boasts the largest market share, driven by consumer awareness and prominent players a major factor in its success.
Growing Demand for Water-Based Cosmetics Spurs Expansion in Cosmetic Raw Materials Market
Water-based cosmetics have become an indispensable driver of market growth in the cosmetic raw materials sector, thanks to consumer preferences for lightweight, hydrating, non-greasy formulations that make application easy. Manufacturers are responding with water-based offerings designed specifically to make consumers' lives simpler while feeling great on their skin - therefore increasing demand for raw materials like emulsifiers and stabilizers that support this form of formulations. This trend creates significant growth opportunities for suppliers of such raw materials in the industry.
Increasing Demand for Vegan and Cruelty-Free Cosmetics Propels Market Growth
The increasing demand for vegan and cruelty-free cosmetics is a powerful driver of industry expansion in the cosmetic raw materials sector. Ethical and sustainable beauty choices are gaining prominence among consumers. Cosmetic brands are increasingly reformulating their products to exclude animal-derived ingredients and avoid animal testing, creating an increased business demand for vegan- and cruelty-free raw materials such as plant-based alternatives and testing methods that don't harm animals. Suppliers with such materials have an opportunity to capitalize on this trend. This trend aligns with the global shift towards ethical and animal-friendly beauty practices, fostering opportunities for market growth.
Regional Analysis
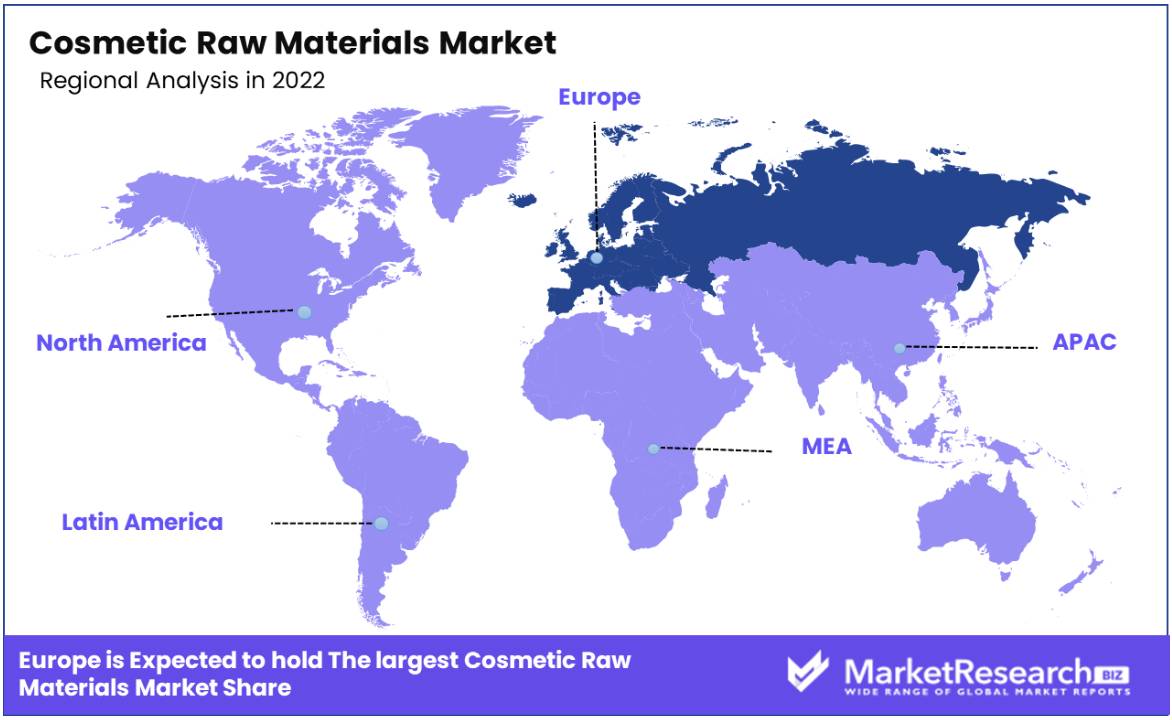
Europe Dominates with 32% Market Share in the Cosmetic Raw Materials Market
Europe holds a significant 32% share of the global cosmetic raw materials industry a testament to its robust cosmetic and personal care industry. Key factors driving this market dominance include a strong focus on innovation, high consumer demand for natural and organic products, and stringent regulatory standards ensuring product quality and safety. Europe's industry leadership is further reinforced by the presence of many world-renowned cosmetic brands and manufacturers, constantly seeking high-quality and unique raw materials for their product formulations.
The regional industry dynamics are shaped by a well-established research and development infrastructure, encouraging the development of advanced and sustainable raw materials. The European industry is also characterized by a sophisticated consumer base that demands ethically sourced and environmentally friendly products, influencing trends and driving innovation in raw materials.
North America:
North America, particularly the United States, plays a significant role in the cosmetic raw materials market. The region's industry share is propelled by its sizable cosmetic industry, high consumer spending power, and a culture that highly values personal grooming and appearance. The industry benefits from the presence of numerous leading cosmetic companies and a strong inclination towards innovative and high-quality products.
Looking forward, the North American market is expected to maintain its strong position, with trends such as clean beauty and natural ingredient types likely to drive further growth and innovation in cosmetic raw materials.
Asia-Pacific:
Asia-Pacific region is rapidly increasing its presence in the cosmetic raw materials industry, due to rising consumer incomes, an emphasis on personal care and beauty products, and an expansion in local cosmetic manufacturing industries - with South Korea, Japan, and China playing prominent roles both as consumers of innovative cosmetic products as well as manufacturers of innovative raw materials.
Asia-Pacific cosmetic industry is projected to experience rapid expansion over the coming years, driven by economic development, rising demand for advanced and specialized cosmetic products, as well as an increase in interest in organic ingredients.
Key Regions and Countries
North America
- The US
- Canada
- Rest of North America
Europe
- Germany
- France
- The UK
- Spain
- Italy
- Russia
- Netherlands
- Rest of Europe
Asia-Pacific
- China
- Japan
- South Korea
- India
- New Zealand
- Singapore
- Thailand
- Vietnam
- Rest of Asia Pacific
Latin America
- Brazil
- Mexico
- Rest of Latin America
Middle East & Africa
- South Africa
- Saudi Arabia
- UAE
- Rest of Middle East & Africa
Key Players Analysis
The cosmetic raw materials market is dominated by a mix of chemical giants and specialized companies, each contributing significantly to the industry's landscape. BASF SE and Evonik Industries AG lead with extensive portfolios and innovations in high-performance ingredients, setting industry standards and driving market trends.
DowDuPont Nemours Inc. and Solvay SA have a significant impact through their diversified chemical expertise, offering a wide range of raw materials that cater to various cosmetic applications. Their strategic positioning is bolstered by a focus on sustainable and environmentally friendly solutions.
Eastman Chemical Co. and Clariant AG are noted for their commitment to innovation and quality, with a particular emphasis on specialty ingredients that enhance product efficacy and appeal. Ashland Global Holdings Inc. and Givaudan stand out for their expertise in natural and organic raw materials, aligning with the growing consumer preference for clean and green beauty products.
Momentive Performance Materials Inc. and Croda International Plc have made significant inroads with their advanced silicone and emulsion technologies, catering to the evolving needs of the cosmetics industry. Lehmann & Voss & Co. KG and CB Minerals LLC have carved out niches by focusing on specific market segments, including luxury cosmetics and natural ingredients.
Overall, these major market players collectively drive the cosmetic raw materials market, focusing on sustainability, technological innovation, and responding to the ever-evolving consumer demands for high-quality and ethically sourced ingredients.
Top Key Players in Cosmetic Raw Materials
- BASF SE
- Evonik Industries AG
- DowDuPont Nemours Inc.
- Solvay SA
- Eastman Chemical Co.
- Clariant AG
- Ashland Global Holdings Inc.
- Givaudan
- Momentive Performance Materials Inc.
- Croda International Plc
- Lehmann & Voss & Co. KG
- CB Minerals LLC
- Lonza Group AG
- Wacker Chemie AG
- Akzo Nobel N.V.
- Symrise AG
- Kao Corporation
- Lubrizol Corporation
- Innospec Inc.
- DSM
- Coty Inc.
- Combe Inc.
- Shanghai Delta Industry
Recent Development
- In June 2022, Solvay announced Mirasoft SL L60 and Mirasoft SL A60 two bio-surfactants with a high-performance that allow the development of more environmentally sustainable products for beauty care.
- In April 2022, Croda International Plc. launched Purposeful Beauty an innovative sustainability brand name, designed to increase its sustainability initiatives in beauty care
- In March 2022, BASF joined forces in partnership with Henkel to replace fossil carbon feedstocks with renewable feedstock in the majority of products of Henkel's European Laundry and Home Care and Beauty Care business for the next four years.
Report Scope
Report Features Description Market Value (2022) USD 28.23 Bn Forecast Revenue (2032) USD 48.2 Bn CAGR (2023-2032) 5.1% Base Year for Estimation 2022 Historic Period 2016-2022 Forecast Period 2023-2032 Report Coverage Revenue Forecast, Market Dynamics, COVID-19 Impact, Competitive Landscape, Recent Developments Segments Covered By Type (Natural, Synthetic, Hybrid cosmetic raw materials), By Application(Skincare, Haircare, Makeup, Fragrances) Regional Analysis North America - The US, Canada, Rest of North America, Europe - Germany, France, The UK, Spain, Italy, Russia, Netherlands, Rest of Europe, Asia-Pacific - China, Japan, South Korea, India, New Zealand, Singapore, Thailand, Vietnam, Rest of Asia Pacific, Latin America - Brazil, Mexico, Rest of Latin America, Middle East & Africa - South Africa, Saudi Arabia, UAE, Rest of Middle East & Africa Competitive Landscape BASF SE, Evonik Industries AG, DowDuPont Nemours Inc., Solvay SA, Eastman Chemical Co., Clariant AG, Ashland Global Holdings Inc., Givaudan, Momentive Performance Materials Inc., Croda International Plc, Lehmann & Voss & Co. KG, CB Minerals LLC, Lonza Group AG, Wacker Chemie AG, Akzo Nobel N.V., Symrise AG, Kao Corporation, Lubrizol Corporation, Innospec Inc., DSM, Coty Inc., Combe Inc. Customization Scope Customization for segments, region/country-level will be provided. Moreover, additional customization can be done based on the requirements. Purchase Options We have three licenses to opt for: Single User License, Multi-User License (Up to 5 Users), Corporate Use License (Unlimited User and Printable PDF) -
- 1. Executive Summary
- 1.1. Definition
- 1.2. Taxonomy
- 1.3. Research Scope
- 1.4. Key Analysis
- 1.5. Key Findings by Major Segments
- 1.6. Top strategies by Major Players
- 2. Global Dementia Care Products Market Overview
- 2.1. Dementia Care Products Market Dynamics
- 2.1.1. Drivers
- 2.1.2. Opportunities
- 2.1.3. Restraints
- 2.1.4. Challenges
- 2.2. Macro-economic Factors
- 2.3. Regulatory Framework
- 2.4. Market Investment Feasibility Index
- 2.5. PEST Analysis
- 2.6. PORTER’S Five Force Analysis
- 2.7. Drivers & Restraints Impact Analysis
- 2.8. Industry Chain Analysis
- 2.9. Cost Structure Analysis
- 2.10. Marketing Strategy
- 2.11. Russia-Ukraine War Impact Analysis
- 2.12. Opportunity Map Analysis
- 2.13. Market Competition Scenario Analysis
- 2.14. Product Life Cycle Analysis
- 2.15. Opportunity Orbits
- 2.16. Manufacturer Intensity Map
- 2.17. Major Companies sales by Value & Volume
- 2.1. Dementia Care Products Market Dynamics
- 3. Global Dementia Care Products Market Analysis, Opportunity and Forecast, 2016-2032
- 3.1. Global Dementia Care Products Market Analysis, 2016-2021
- 3.2. Global Dementia Care Products Market Opportunity and Forecast, 2023-2032
- 3.3. Global Dementia Care Products Market Analysis, Opportunity and Forecast, By Type, 2016-2032
- 3.3.1. Global Dementia Care Products Market Analysis by Type: Introduction
- 3.3.2. Market Size Absolute $ Opportunity Analysis and Forecast, By Type, 2016-2032
- 3.3.3. Memory Exercise & Activity Products
- 3.3.4. Daily Reminder Products
- 3.3.5. Bathroom Safety Products
- 3.3.6. Dining Aids
- 3.3.7. Communication Products
- 3.3.8. Personal Safety Products
- 3.3.9. Others
- 3.4. Global Dementia Care Products Market Analysis, Opportunity and Forecast, By End-User, 2016-2032
- 3.4.1. Global Dementia Care Products Market Analysis by End-User: Introduction
- 3.4.2. Market Size Absolute $ Opportunity Analysis and Forecast, By End-User, 2016-2032
- 3.4.3. Long Term Care Centers
- 3.4.4. Home Care Settings
- 3.4.5. Other
- 4. North America Dementia Care Products Market Analysis, Opportunity and Forecast, 2016-2032
- 4.1. North America Dementia Care Products Market Analysis, 2016-2021
- 4.2. North America Dementia Care Products Market Opportunity and Forecast, 2023-2032
- 4.3. North America Dementia Care Products Market Analysis, Opportunity and Forecast, By Type, 2016-2032
- 4.3.1. North America Dementia Care Products Market Analysis by Type: Introduction
- 4.3.2. Market Size Absolute $ Opportunity Analysis and Forecast, By Type, 2016-2032
- 4.3.3. Memory Exercise & Activity Products
- 4.3.4. Daily Reminder Products
- 4.3.5. Bathroom Safety Products
- 4.3.6. Dining Aids
- 4.3.7. Communication Products
- 4.3.8. Personal Safety Products
- 4.3.9. Others
- 4.4. North America Dementia Care Products Market Analysis, Opportunity and Forecast, By End-User, 2016-2032
- 4.4.1. North America Dementia Care Products Market Analysis by End-User: Introduction
- 4.4.2. Market Size Absolute $ Opportunity Analysis and Forecast, By End-User, 2016-2032
- 4.4.3. Long Term Care Centers
- 4.4.4. Home Care Settings
- 4.4.5. Other
- 4.5. North America Dementia Care Products Market Analysis, Opportunity and Forecast, By Country , 2016-2032
- 4.5.1. North America Dementia Care Products Market Analysis by Country : Introduction
- 4.5.2. Market Size Absolute $ Opportunity Analysis and Forecast, Country , 2016-2032
- 4.5.2.1. The US
- 4.5.2.2. Canada
- 4.5.2.3. Mexico
- 5. Western Europe Dementia Care Products Market Analysis, Opportunity and Forecast, 2016-2032
- 5.1. Western Europe Dementia Care Products Market Analysis, 2016-2021
- 5.2. Western Europe Dementia Care Products Market Opportunity and Forecast, 2023-2032
- 5.3. Western Europe Dementia Care Products Market Analysis, Opportunity and Forecast, By Type, 2016-2032
- 5.3.1. Western Europe Dementia Care Products Market Analysis by Type: Introduction
- 5.3.2. Market Size Absolute $ Opportunity Analysis and Forecast, By Type, 2016-2032
- 5.3.3. Memory Exercise & Activity Products
- 5.3.4. Daily Reminder Products
- 5.3.5. Bathroom Safety Products
- 5.3.6. Dining Aids
- 5.3.7. Communication Products
- 5.3.8. Personal Safety Products
- 5.3.9. Others
- 5.4. Western Europe Dementia Care Products Market Analysis, Opportunity and Forecast, By End-User, 2016-2032
- 5.4.1. Western Europe Dementia Care Products Market Analysis by End-User: Introduction
- 5.4.2. Market Size Absolute $ Opportunity Analysis and Forecast, By End-User, 2016-2032
- 5.4.3. Long Term Care Centers
- 5.4.4. Home Care Settings
- 5.4.5. Other
- 5.5. Western Europe Dementia Care Products Market Analysis, Opportunity and Forecast, By Country , 2016-2032
- 5.5.1. Western Europe Dementia Care Products Market Analysis by Country : Introduction
- 5.5.2. Market Size Absolute $ Opportunity Analysis and Forecast, Country , 2016-2032
- 5.5.2.1. Germany
- 5.5.2.2. France
- 5.5.2.3. The UK
- 5.5.2.4. Spain
- 5.5.2.5. Italy
- 5.5.2.6. Portugal
- 5.5.2.7. Ireland
- 5.5.2.8. Austria
- 5.5.2.9. Switzerland
- 5.5.2.10. Benelux
- 5.5.2.11. Nordic
- 5.5.2.12. Rest of Western Europe
- 6. Eastern Europe Dementia Care Products Market Analysis, Opportunity and Forecast, 2016-2032
- 6.1. Eastern Europe Dementia Care Products Market Analysis, 2016-2021
- 6.2. Eastern Europe Dementia Care Products Market Opportunity and Forecast, 2023-2032
- 6.3. Eastern Europe Dementia Care Products Market Analysis, Opportunity and Forecast, By Type, 2016-2032
- 6.3.1. Eastern Europe Dementia Care Products Market Analysis by Type: Introduction
- 6.3.2. Market Size Absolute $ Opportunity Analysis and Forecast, By Type, 2016-2032
- 6.3.3. Memory Exercise & Activity Products
- 6.3.4. Daily Reminder Products
- 6.3.5. Bathroom Safety Products
- 6.3.6. Dining Aids
- 6.3.7. Communication Products
- 6.3.8. Personal Safety Products
- 6.3.9. Others
- 6.4. Eastern Europe Dementia Care Products Market Analysis, Opportunity and Forecast, By End-User, 2016-2032
- 6.4.1. Eastern Europe Dementia Care Products Market Analysis by End-User: Introduction
- 6.4.2. Market Size Absolute $ Opportunity Analysis and Forecast, By End-User, 2016-2032
- 6.4.3. Long Term Care Centers
- 6.4.4. Home Care Settings
- 6.4.5. Other
- 6.5. Eastern Europe Dementia Care Products Market Analysis, Opportunity and Forecast, By Country , 2016-2032
- 6.5.1. Eastern Europe Dementia Care Products Market Analysis by Country : Introduction
- 6.5.2. Market Size Absolute $ Opportunity Analysis and Forecast, Country , 2016-2032
- 6.5.2.1. Russia
- 6.5.2.2. Poland
- 6.5.2.3. The Czech Republic
- 6.5.2.4. Greece
- 6.5.2.5. Rest of Eastern Europe
- 7. APAC Dementia Care Products Market Analysis, Opportunity and Forecast, 2016-2032
- 7.1. APAC Dementia Care Products Market Analysis, 2016-2021
- 7.2. APAC Dementia Care Products Market Opportunity and Forecast, 2023-2032
- 7.3. APAC Dementia Care Products Market Analysis, Opportunity and Forecast, By Type, 2016-2032
- 7.3.1. APAC Dementia Care Products Market Analysis by Type: Introduction
- 7.3.2. Market Size Absolute $ Opportunity Analysis and Forecast, By Type, 2016-2032
- 7.3.3. Memory Exercise & Activity Products
- 7.3.4. Daily Reminder Products
- 7.3.5. Bathroom Safety Products
- 7.3.6. Dining Aids
- 7.3.7. Communication Products
- 7.3.8. Personal Safety Products
- 7.3.9. Others
- 7.4. APAC Dementia Care Products Market Analysis, Opportunity and Forecast, By End-User, 2016-2032
- 7.4.1. APAC Dementia Care Products Market Analysis by End-User: Introduction
- 7.4.2. Market Size Absolute $ Opportunity Analysis and Forecast, By End-User, 2016-2032
- 7.4.3. Long Term Care Centers
- 7.4.4. Home Care Settings
- 7.4.5. Other
- 7.5. APAC Dementia Care Products Market Analysis, Opportunity and Forecast, By Country , 2016-2032
- 7.5.1. APAC Dementia Care Products Market Analysis by Country : Introduction
- 7.5.2. Market Size Absolute $ Opportunity Analysis and Forecast, Country , 2016-2032
- 7.5.2.1. China
- 7.5.2.2. Japan
- 7.5.2.3. South Korea
- 7.5.2.4. India
- 7.5.2.5. Australia & New Zeland
- 7.5.2.6. Indonesia
- 7.5.2.7. Malaysia
- 7.5.2.8. Philippines
- 7.5.2.9. Singapore
- 7.5.2.10. Thailand
- 7.5.2.11. Vietnam
- 7.5.2.12. Rest of APAC
- 8. Latin America Dementia Care Products Market Analysis, Opportunity and Forecast, 2016-2032
- 8.1. Latin America Dementia Care Products Market Analysis, 2016-2021
- 8.2. Latin America Dementia Care Products Market Opportunity and Forecast, 2023-2032
- 8.3. Latin America Dementia Care Products Market Analysis, Opportunity and Forecast, By Type, 2016-2032
- 8.3.1. Latin America Dementia Care Products Market Analysis by Type: Introduction
- 8.3.2. Market Size Absolute $ Opportunity Analysis and Forecast, By Type, 2016-2032
- 8.3.3. Memory Exercise & Activity Products
- 8.3.4. Daily Reminder Products
- 8.3.5. Bathroom Safety Products
- 8.3.6. Dining Aids
- 8.3.7. Communication Products
- 8.3.8. Personal Safety Products
- 8.3.9. Others
- 8.4. Latin America Dementia Care Products Market Analysis, Opportunity and Forecast, By End-User, 2016-2032
- 8.4.1. Latin America Dementia Care Products Market Analysis by End-User: Introduction
- 8.4.2. Market Size Absolute $ Opportunity Analysis and Forecast, By End-User, 2016-2032
- 8.4.3. Long Term Care Centers
- 8.4.4. Home Care Settings
- 8.4.5. Other
- 8.5. Latin America Dementia Care Products Market Analysis, Opportunity and Forecast, By Country , 2016-2032
- 8.5.1. Latin America Dementia Care Products Market Analysis by Country : Introduction
- 8.5.2. Market Size Absolute $ Opportunity Analysis and Forecast, Country , 2016-2032
- 8.5.2.1. Brazil
- 8.5.2.2. Colombia
- 8.5.2.3. Chile
- 8.5.2.4. Argentina
- 8.5.2.5. Costa Rica
- 8.5.2.6. Rest of Latin America
- 9. Middle East & Africa Dementia Care Products Market Analysis, Opportunity and Forecast, 2016-2032
- 9.1. Middle East & Africa Dementia Care Products Market Analysis, 2016-2021
- 9.2. Middle East & Africa Dementia Care Products Market Opportunity and Forecast, 2023-2032
- 9.3. Middle East & Africa Dementia Care Products Market Analysis, Opportunity and Forecast, By Type, 2016-2032
- 9.3.1. Middle East & Africa Dementia Care Products Market Analysis by Type: Introduction
- 9.3.2. Market Size Absolute $ Opportunity Analysis and Forecast, By Type, 2016-2032
- 9.3.3. Memory Exercise & Activity Products
- 9.3.4. Daily Reminder Products
- 9.3.5. Bathroom Safety Products
- 9.3.6. Dining Aids
- 9.3.7. Communication Products
- 9.3.8. Personal Safety Products
- 9.3.9. Others
- 9.4. Middle East & Africa Dementia Care Products Market Analysis, Opportunity and Forecast, By End-User, 2016-2032
- 9.4.1. Middle East & Africa Dementia Care Products Market Analysis by End-User: Introduction
- 9.4.2. Market Size Absolute $ Opportunity Analysis and Forecast, By End-User, 2016-2032
- 9.4.3. Long Term Care Centers
- 9.4.4. Home Care Settings
- 9.4.5. Other
- 9.5. Middle East & Africa Dementia Care Products Market Analysis, Opportunity and Forecast, By Country , 2016-2032
- 9.5.1. Middle East & Africa Dementia Care Products Market Analysis by Country : Introduction
- 9.5.2. Market Size Absolute $ Opportunity Analysis and Forecast, Country , 2016-2032
- 9.5.2.1. Algeria
- 9.5.2.2. Egypt
- 9.5.2.3. Israel
- 9.5.2.4. Kuwait
- 9.5.2.5. Nigeria
- 9.5.2.6. Saudi Arabia
- 9.5.2.7. South Africa
- 9.5.2.8. Turkey
- 9.5.2.9. The UAE
- 9.5.2.10. Rest of MEA
- 10. Global Dementia Care Products Market Analysis, Opportunity and Forecast, By Region , 2016-2032
- 10.1. Global Dementia Care Products Market Analysis by Region : Introduction
- 10.2. Market Size Absolute $ Opportunity Analysis and Forecast, By Region , 2016-2032
- 10.2.1. North America
- 10.2.2. Western Europe
- 10.2.3. Eastern Europe
- 10.2.4. APAC
- 10.2.5. Latin America
- 10.2.6. Middle East & Africa
- 11. Global Dementia Care Products Market Competitive Landscape, Market Share Analysis, and Company Profiles
- 11.1. Market Share Analysis
- 11.2. Company Profiles
- 11.3. Brookdale Senior Living
- 11.3.1. Company Overview
- 11.3.2. Financial Highlights
- 11.3.3. Product Portfolio
- 11.3.4. SWOT Analysis
- 11.3.5. Key Strategies and Developments
- 11.4. Sunrise Senior Living
- 11.4.1. Company Overview
- 11.4.2. Financial Highlights
- 11.4.3. Product Portfolio
- 11.4.4. SWOT Analysis
- 11.4.5. Key Strategies and Developments
- 11.5. Life Care Services
- 11.5.1. Company Overview
- 11.5.2. Financial Highlights
- 11.5.3. Product Portfolio
- 11.5.4. SWOT Analysis
- 11.5.5. Key Strategies and Developments
- 11.6. Five Star Senior Living
- 11.6.1. Company Overview
- 11.6.2. Financial Highlights
- 11.6.3. Product Portfolio
- 11.6.4. SWOT Analysis
- 11.6.5. Key Strategies and Developments
- 11.7. Atria Senior Living
- 11.7.1. Company Overview
- 11.7.2. Financial Highlights
- 11.7.3. Product Portfolio
- 11.7.4. SWOT Analysis
- 11.7.5. Key Strategies and Developments
- 11.8. Erickson Living
- 11.8.1. Company Overview
- 11.8.2. Financial Highlights
- 11.8.3. Product Portfolio
- 11.8.4. SWOT Analysis
- 11.8.5. Key Strategies and Developments
- 11.9. Kensington Park Senior Living
- 11.9.1. Company Overview
- 11.9.2. Financial Highlights
- 11.9.3. Product Portfolio
- 11.9.4. SWOT Analysis
- 11.9.5. Key Strategies and Developments
- 11.10. Masonicare
- 11.10.1. Company Overview
- 11.10.2. Financial Highlights
- 11.10.3. Product Portfolio
- 11.10.4. SWOT Analysis
- 11.10.5. Key Strategies and Developments
- 11.11. ProMedica Health System, Inc.
- 11.11.1. Company Overview
- 11.11.2. Financial Highlights
- 11.11.3. Product Portfolio
- 11.11.4. SWOT Analysis
- 11.11.5. Key Strategies and Developments
- 11.12. Azura Memory Care
- 11.12.1. Company Overview
- 11.12.2. Financial Highlights
- 11.12.3. Product Portfolio
- 11.12.4. SWOT Analysis
- 11.12.5. Key Strategies and Developments
- 11.13.1. Company Overview
- 11.13.2. Financial Highlights
- 11.13.3. Product Portfolio
- 11.13.4. SWOT Analysis
- 11.13.5. Key Strategies and Developments
- 11.14. Best Alzheimer's Products
- 11.14.1. Company Overview
- 11.14.2. Financial Highlights
- 11.14.3. Product Portfolio
- 11.14.4. SWOT Analysis
- 11.14.5. Key Strategies and Developments
- 11.15. EasierLiving, LLC
- 11.15.1. Company Overview
- 11.15.2. Financial Highlights
- 11.15.3. Product Portfolio
- 11.15.4. SWOT Analysis
- 11.15.5. Key Strategies and Developments
- 11.16. Parentgiving, Inc.
- 11.16.1. Company Overview
- 11.16.2. Financial Highlights
- 11.16.3. Product Portfolio
- 11.16.4. SWOT Analysis
- 11.16.5. Key Strategies and Developments
- 11.17. Find memory care
- 11.17.1. Company Overview
- 11.17.2. Financial Highlights
- 11.17.3. Product Portfolio
- 11.17.4. SWOT Analysis
- 11.17.5. Key Strategies and Developments
- 11.18. NRS Healthcare
- 11.18.1. Company Overview
- 11.18.2. Financial Highlights
- 11.18.3. Product Portfolio
- 11.18.4. SWOT Analysis
- 11.18.5. Key Strategies and Developments
- 11.19. Buddi Ltd
- 11.19.1. Company Overview
- 11.19.2. Financial Highlights
- 11.19.3. Product Portfolio
- 11.19.4. SWOT Analysis
- 11.19.5. Key Strategies and Developments
- 12. Assumptions and Acronyms
- 13. Research Methodology
- 14. Contact
"
- List of Figures
- "
- Figure 1: Global Dementia Care Products Market Revenue (US$ Mn) Market Share by Type in 2022
- Figure 2: Global Dementia Care Products Market Attractiveness Analysis by Type, 2016-2032
- Figure 3: Global Dementia Care Products Market Revenue (US$ Mn) Market Share by End-Userin 2022
- Figure 4: Global Dementia Care Products Market Attractiveness Analysis by End-User, 2016-2032
- Figure 5: Global Dementia Care Products Market Revenue (US$ Mn) Market Share by Region in 2022
- Figure 6: Global Dementia Care Products Market Attractiveness Analysis by Region, 2016-2032
- Figure 7: Global Dementia Care Products Market Revenue (US$ Mn) (2016-2032)
- Figure 8: Global Dementia Care Products Market Revenue (US$ Mn) Comparison by Region (2016-2032)
- Figure 9: Global Dementia Care Products Market Revenue (US$ Mn) Comparison by Type (2016-2032)
- Figure 10: Global Dementia Care Products Market Revenue (US$ Mn) Comparison by End-User (2016-2032)
- Figure 11: Global Dementia Care Products Market Y-o-Y Growth Rate Comparison by Region (2016-2032)
- Figure 12: Global Dementia Care Products Market Y-o-Y Growth Rate Comparison by Type (2016-2032)
- Figure 13: Global Dementia Care Products Market Y-o-Y Growth Rate Comparison by End-User (2016-2032)
- Figure 14: Global Dementia Care Products Market Share Comparison by Region (2016-2032)
- Figure 15: Global Dementia Care Products Market Share Comparison by Type (2016-2032)
- Figure 16: Global Dementia Care Products Market Share Comparison by End-User (2016-2032)
- Figure 17: North America Dementia Care Products Market Revenue (US$ Mn) Market Share by Typein 2022
- Figure 18: North America Dementia Care Products Market Attractiveness Analysis by Type, 2016-2032
- Figure 19: North America Dementia Care Products Market Revenue (US$ Mn) Market Share by End-Userin 2022
- Figure 20: North America Dementia Care Products Market Attractiveness Analysis by End-User, 2016-2032
- Figure 21: North America Dementia Care Products Market Revenue (US$ Mn) Market Share by Country in 2022
- Figure 22: North America Dementia Care Products Market Attractiveness Analysis by Country, 2016-2032
- Figure 23: North America Dementia Care Products Market Revenue (US$ Mn) (2016-2032)
- Figure 24: North America Dementia Care Products Market Revenue (US$ Mn) Comparison by Country (2016-2032)
- Figure 25: North America Dementia Care Products Market Revenue (US$ Mn) Comparison by Type (2016-2032)
- Figure 26: North America Dementia Care Products Market Revenue (US$ Mn) Comparison by End-User (2016-2032)
- Figure 27: North America Dementia Care Products Market Y-o-Y Growth Rate Comparison by Country (2016-2032)
- Figure 28: North America Dementia Care Products Market Y-o-Y Growth Rate Comparison by Type (2016-2032)
- Figure 29: North America Dementia Care Products Market Y-o-Y Growth Rate Comparison by End-User (2016-2032)
- Figure 30: North America Dementia Care Products Market Share Comparison by Country (2016-2032)
- Figure 31: North America Dementia Care Products Market Share Comparison by Type (2016-2032)
- Figure 32: North America Dementia Care Products Market Share Comparison by End-User (2016-2032)
- Figure 33: Western Europe Dementia Care Products Market Revenue (US$ Mn) Market Share by Typein 2022
- Figure 34: Western Europe Dementia Care Products Market Attractiveness Analysis by Type, 2016-2032
- Figure 35: Western Europe Dementia Care Products Market Revenue (US$ Mn) Market Share by End-Userin 2022
- Figure 36: Western Europe Dementia Care Products Market Attractiveness Analysis by End-User, 2016-2032
- Figure 37: Western Europe Dementia Care Products Market Revenue (US$ Mn) Market Share by Country in 2022
- Figure 38: Western Europe Dementia Care Products Market Attractiveness Analysis by Country, 2016-2032
- Figure 39: Western Europe Dementia Care Products Market Revenue (US$ Mn) (2016-2032)
- Figure 40: Western Europe Dementia Care Products Market Revenue (US$ Mn) Comparison by Country (2016-2032)
- Figure 41: Western Europe Dementia Care Products Market Revenue (US$ Mn) Comparison by Type (2016-2032)
- Figure 42: Western Europe Dementia Care Products Market Revenue (US$ Mn) Comparison by End-User (2016-2032)
- Figure 43: Western Europe Dementia Care Products Market Y-o-Y Growth Rate Comparison by Country (2016-2032)
- Figure 44: Western Europe Dementia Care Products Market Y-o-Y Growth Rate Comparison by Type (2016-2032)
- Figure 45: Western Europe Dementia Care Products Market Y-o-Y Growth Rate Comparison by End-User (2016-2032)
- Figure 46: Western Europe Dementia Care Products Market Share Comparison by Country (2016-2032)
- Figure 47: Western Europe Dementia Care Products Market Share Comparison by Type (2016-2032)
- Figure 48: Western Europe Dementia Care Products Market Share Comparison by End-User (2016-2032)
- Figure 49: Eastern Europe Dementia Care Products Market Revenue (US$ Mn) Market Share by Typein 2022
- Figure 50: Eastern Europe Dementia Care Products Market Attractiveness Analysis by Type, 2016-2032
- Figure 51: Eastern Europe Dementia Care Products Market Revenue (US$ Mn) Market Share by End-Userin 2022
- Figure 52: Eastern Europe Dementia Care Products Market Attractiveness Analysis by End-User, 2016-2032
- Figure 53: Eastern Europe Dementia Care Products Market Revenue (US$ Mn) Market Share by Country in 2022
- Figure 54: Eastern Europe Dementia Care Products Market Attractiveness Analysis by Country, 2016-2032
- Figure 55: Eastern Europe Dementia Care Products Market Revenue (US$ Mn) (2016-2032)
- Figure 56: Eastern Europe Dementia Care Products Market Revenue (US$ Mn) Comparison by Country (2016-2032)
- Figure 57: Eastern Europe Dementia Care Products Market Revenue (US$ Mn) Comparison by Type (2016-2032)
- Figure 58: Eastern Europe Dementia Care Products Market Revenue (US$ Mn) Comparison by End-User (2016-2032)
- Figure 59: Eastern Europe Dementia Care Products Market Y-o-Y Growth Rate Comparison by Country (2016-2032)
- Figure 60: Eastern Europe Dementia Care Products Market Y-o-Y Growth Rate Comparison by Type (2016-2032)
- Figure 61: Eastern Europe Dementia Care Products Market Y-o-Y Growth Rate Comparison by End-User (2016-2032)
- Figure 62: Eastern Europe Dementia Care Products Market Share Comparison by Country (2016-2032)
- Figure 63: Eastern Europe Dementia Care Products Market Share Comparison by Type (2016-2032)
- Figure 64: Eastern Europe Dementia Care Products Market Share Comparison by End-User (2016-2032)
- Figure 65: APAC Dementia Care Products Market Revenue (US$ Mn) Market Share by Typein 2022
- Figure 66: APAC Dementia Care Products Market Attractiveness Analysis by Type, 2016-2032
- Figure 67: APAC Dementia Care Products Market Revenue (US$ Mn) Market Share by End-Userin 2022
- Figure 68: APAC Dementia Care Products Market Attractiveness Analysis by End-User, 2016-2032
- Figure 69: APAC Dementia Care Products Market Revenue (US$ Mn) Market Share by Country in 2022
- Figure 70: APAC Dementia Care Products Market Attractiveness Analysis by Country, 2016-2032
- Figure 71: APAC Dementia Care Products Market Revenue (US$ Mn) (2016-2032)
- Figure 72: APAC Dementia Care Products Market Revenue (US$ Mn) Comparison by Country (2016-2032)
- Figure 73: APAC Dementia Care Products Market Revenue (US$ Mn) Comparison by Type (2016-2032)
- Figure 74: APAC Dementia Care Products Market Revenue (US$ Mn) Comparison by End-User (2016-2032)
- Figure 75: APAC Dementia Care Products Market Y-o-Y Growth Rate Comparison by Country (2016-2032)
- Figure 76: APAC Dementia Care Products Market Y-o-Y Growth Rate Comparison by Type (2016-2032)
- Figure 77: APAC Dementia Care Products Market Y-o-Y Growth Rate Comparison by End-User (2016-2032)
- Figure 78: APAC Dementia Care Products Market Share Comparison by Country (2016-2032)
- Figure 79: APAC Dementia Care Products Market Share Comparison by Type (2016-2032)
- Figure 80: APAC Dementia Care Products Market Share Comparison by End-User (2016-2032)
- Figure 81: Latin America Dementia Care Products Market Revenue (US$ Mn) Market Share by Typein 2022
- Figure 82: Latin America Dementia Care Products Market Attractiveness Analysis by Type, 2016-2032
- Figure 83: Latin America Dementia Care Products Market Revenue (US$ Mn) Market Share by End-Userin 2022
- Figure 84: Latin America Dementia Care Products Market Attractiveness Analysis by End-User, 2016-2032
- Figure 85: Latin America Dementia Care Products Market Revenue (US$ Mn) Market Share by Country in 2022
- Figure 86: Latin America Dementia Care Products Market Attractiveness Analysis by Country, 2016-2032
- Figure 87: Latin America Dementia Care Products Market Revenue (US$ Mn) (2016-2032)
- Figure 88: Latin America Dementia Care Products Market Revenue (US$ Mn) Comparison by Country (2016-2032)
- Figure 89: Latin America Dementia Care Products Market Revenue (US$ Mn) Comparison by Type (2016-2032)
- Figure 90: Latin America Dementia Care Products Market Revenue (US$ Mn) Comparison by End-User (2016-2032)
- Figure 91: Latin America Dementia Care Products Market Y-o-Y Growth Rate Comparison by Country (2016-2032)
- Figure 92: Latin America Dementia Care Products Market Y-o-Y Growth Rate Comparison by Type (2016-2032)
- Figure 93: Latin America Dementia Care Products Market Y-o-Y Growth Rate Comparison by End-User (2016-2032)
- Figure 94: Latin America Dementia Care Products Market Share Comparison by Country (2016-2032)
- Figure 95: Latin America Dementia Care Products Market Share Comparison by Type (2016-2032)
- Figure 96: Latin America Dementia Care Products Market Share Comparison by End-User (2016-2032)
- Figure 97: Middle East & Africa Dementia Care Products Market Revenue (US$ Mn) Market Share by Typein 2022
- Figure 98: Middle East & Africa Dementia Care Products Market Attractiveness Analysis by Type, 2016-2032
- Figure 99: Middle East & Africa Dementia Care Products Market Revenue (US$ Mn) Market Share by End-Userin 2022
- Figure 100: Middle East & Africa Dementia Care Products Market Attractiveness Analysis by End-User, 2016-2032
- Figure 101: Middle East & Africa Dementia Care Products Market Revenue (US$ Mn) Market Share by Country in 2022
- Figure 102: Middle East & Africa Dementia Care Products Market Attractiveness Analysis by Country, 2016-2032
- Figure 103: Middle East & Africa Dementia Care Products Market Revenue (US$ Mn) (2016-2032)
- Figure 104: Middle East & Africa Dementia Care Products Market Revenue (US$ Mn) Comparison by Country (2016-2032)
- Figure 105: Middle East & Africa Dementia Care Products Market Revenue (US$ Mn) Comparison by Type (2016-2032)
- Figure 106: Middle East & Africa Dementia Care Products Market Revenue (US$ Mn) Comparison by End-User (2016-2032)
- Figure 107: Middle East & Africa Dementia Care Products Market Y-o-Y Growth Rate Comparison by Country (2016-2032)
- Figure 108: Middle East & Africa Dementia Care Products Market Y-o-Y Growth Rate Comparison by Type (2016-2032)
- Figure 109: Middle East & Africa Dementia Care Products Market Y-o-Y Growth Rate Comparison by End-User (2016-2032)
- Figure 110: Middle East & Africa Dementia Care Products Market Share Comparison by Country (2016-2032)
- Figure 111: Middle East & Africa Dementia Care Products Market Share Comparison by Type (2016-2032)
- Figure 112: Middle East & Africa Dementia Care Products Market Share Comparison by End-User (2016-2032)
"
- List of Tables
- "
- Table 1: Global Dementia Care Products Market Comparison by Type (2016-2032)
- Table 2: Global Dementia Care Products Market Comparison by End-User (2016-2032)
- Table 3: Global Dementia Care Products Market Revenue (US$ Mn) Comparison by Region (2016-2032)
- Table 4: Global Dementia Care Products Market Revenue (US$ Mn) (2016-2032)
- Table 5: Global Dementia Care Products Market Revenue (US$ Mn) Comparison by Region (2016-2032)
- Table 6: Global Dementia Care Products Market Revenue (US$ Mn) Comparison by Type (2016-2032)
- Table 7: Global Dementia Care Products Market Revenue (US$ Mn) Comparison by End-User (2016-2032)
- Table 8: Global Dementia Care Products Market Y-o-Y Growth Rate Comparison by Region (2016-2032)
- Table 9: Global Dementia Care Products Market Y-o-Y Growth Rate Comparison by Type (2016-2032)
- Table 10: Global Dementia Care Products Market Y-o-Y Growth Rate Comparison by End-User (2016-2032)
- Table 11: Global Dementia Care Products Market Share Comparison by Region (2016-2032)
- Table 12: Global Dementia Care Products Market Share Comparison by Type (2016-2032)
- Table 13: Global Dementia Care Products Market Share Comparison by End-User (2016-2032)
- Table 14: North America Dementia Care Products Market Comparison by End-User (2016-2032)
- Table 15: North America Dementia Care Products Market Revenue (US$ Mn) Comparison by Country (2016-2032)
- Table 16: North America Dementia Care Products Market Revenue (US$ Mn) (2016-2032)
- Table 17: North America Dementia Care Products Market Revenue (US$ Mn) Comparison by Country (2016-2032)
- Table 18: North America Dementia Care Products Market Revenue (US$ Mn) Comparison by Type (2016-2032)
- Table 19: North America Dementia Care Products Market Revenue (US$ Mn) Comparison by End-User (2016-2032)
- Table 20: North America Dementia Care Products Market Y-o-Y Growth Rate Comparison by Country (2016-2032)
- Table 21: North America Dementia Care Products Market Y-o-Y Growth Rate Comparison by Type (2016-2032)
- Table 22: North America Dementia Care Products Market Y-o-Y Growth Rate Comparison by End-User (2016-2032)
- Table 23: North America Dementia Care Products Market Share Comparison by Country (2016-2032)
- Table 24: North America Dementia Care Products Market Share Comparison by Type (2016-2032)
- Table 25: North America Dementia Care Products Market Share Comparison by End-User (2016-2032)
- Table 26: Western Europe Dementia Care Products Market Comparison by Type (2016-2032)
- Table 27: Western Europe Dementia Care Products Market Comparison by End-User (2016-2032)
- Table 28: Western Europe Dementia Care Products Market Revenue (US$ Mn) Comparison by Country (2016-2032)
- Table 29: Western Europe Dementia Care Products Market Revenue (US$ Mn) (2016-2032)
- Table 30: Western Europe Dementia Care Products Market Revenue (US$ Mn) Comparison by Country (2016-2032)
- Table 31: Western Europe Dementia Care Products Market Revenue (US$ Mn) Comparison by Type (2016-2032)
- Table 32: Western Europe Dementia Care Products Market Revenue (US$ Mn) Comparison by End-User (2016-2032)
- Table 33: Western Europe Dementia Care Products Market Y-o-Y Growth Rate Comparison by Country (2016-2032)
- Table 34: Western Europe Dementia Care Products Market Y-o-Y Growth Rate Comparison by Type (2016-2032)
- Table 35: Western Europe Dementia Care Products Market Y-o-Y Growth Rate Comparison by End-User (2016-2032)
- Table 36: Western Europe Dementia Care Products Market Share Comparison by Country (2016-2032)
- Table 37: Western Europe Dementia Care Products Market Share Comparison by Type (2016-2032)
- Table 38: Western Europe Dementia Care Products Market Share Comparison by End-User (2016-2032)
- Table 39: Eastern Europe Dementia Care Products Market Comparison by Type (2016-2032)
- Table 40: Eastern Europe Dementia Care Products Market Comparison by End-User (2016-2032)
- Table 41: Eastern Europe Dementia Care Products Market Revenue (US$ Mn) Comparison by Country (2016-2032)
- Table 42: Eastern Europe Dementia Care Products Market Revenue (US$ Mn) (2016-2032)
- Table 43: Eastern Europe Dementia Care Products Market Revenue (US$ Mn) Comparison by Country (2016-2032)
- Table 44: Eastern Europe Dementia Care Products Market Revenue (US$ Mn) Comparison by Type (2016-2032)
- Table 45: Eastern Europe Dementia Care Products Market Revenue (US$ Mn) Comparison by End-User (2016-2032)
- Table 46: Eastern Europe Dementia Care Products Market Y-o-Y Growth Rate Comparison by Country (2016-2032)
- Table 47: Eastern Europe Dementia Care Products Market Y-o-Y Growth Rate Comparison by Type (2016-2032)
- Table 48: Eastern Europe Dementia Care Products Market Y-o-Y Growth Rate Comparison by End-User (2016-2032)
- Table 49: Eastern Europe Dementia Care Products Market Share Comparison by Country (2016-2032)
- Table 50: Eastern Europe Dementia Care Products Market Share Comparison by Type (2016-2032)
- Table 51: Eastern Europe Dementia Care Products Market Share Comparison by End-User (2016-2032)
- Table 52: APAC Dementia Care Products Market Comparison by Type (2016-2032)
- Table 53: APAC Dementia Care Products Market Comparison by End-User (2016-2032)
- Table 54: APAC Dementia Care Products Market Revenue (US$ Mn) Comparison by Country (2016-2032)
- Table 55: APAC Dementia Care Products Market Revenue (US$ Mn) (2016-2032)
- Table 56: APAC Dementia Care Products Market Revenue (US$ Mn) Comparison by Country (2016-2032)
- Table 57: APAC Dementia Care Products Market Revenue (US$ Mn) Comparison by Type (2016-2032)
- Table 58: APAC Dementia Care Products Market Revenue (US$ Mn) Comparison by End-User (2016-2032)
- Table 59: APAC Dementia Care Products Market Y-o-Y Growth Rate Comparison by Country (2016-2032)
- Table 60: APAC Dementia Care Products Market Y-o-Y Growth Rate Comparison by Type (2016-2032)
- Table 61: APAC Dementia Care Products Market Y-o-Y Growth Rate Comparison by End-User (2016-2032)
- Table 62: APAC Dementia Care Products Market Share Comparison by Country (2016-2032)
- Table 63: APAC Dementia Care Products Market Share Comparison by Type (2016-2032)
- Table 64: APAC Dementia Care Products Market Share Comparison by End-User (2016-2032)
- Table 65: Latin America Dementia Care Products Market Comparison by Type (2016-2032)
- Table 66: Latin America Dementia Care Products Market Comparison by End-User (2016-2032)
- Table 67: Latin America Dementia Care Products Market Revenue (US$ Mn) Comparison by Country (2016-2032)
- Table 68: Latin America Dementia Care Products Market Revenue (US$ Mn) (2016-2032)
- Table 69: Latin America Dementia Care Products Market Revenue (US$ Mn) Comparison by Country (2016-2032)
- Table 70: Latin America Dementia Care Products Market Revenue (US$ Mn) Comparison by Type (2016-2032)
- Table 71: Latin America Dementia Care Products Market Revenue (US$ Mn) Comparison by End-User (2016-2032)
- Table 72: Latin America Dementia Care Products Market Y-o-Y Growth Rate Comparison by Country (2016-2032)
- Table 73: Latin America Dementia Care Products Market Y-o-Y Growth Rate Comparison by Type (2016-2032)
- Table 74: Latin America Dementia Care Products Market Y-o-Y Growth Rate Comparison by End-User (2016-2032)
- Table 75: Latin America Dementia Care Products Market Share Comparison by Country (2016-2032)
- Table 76: Latin America Dementia Care Products Market Share Comparison by Type (2016-2032)
- Table 77: Latin America Dementia Care Products Market Share Comparison by End-User (2016-2032)
- Table 78: Middle East & Africa Dementia Care Products Market Comparison by Type (2016-2032)
- Table 79: Middle East & Africa Dementia Care Products Market Comparison by End-User (2016-2032)
- Table 80: Middle East & Africa Dementia Care Products Market Revenue (US$ Mn) Comparison by Country (2016-2032)
- Table 81: Middle East & Africa Dementia Care Products Market Revenue (US$ Mn) (2016-2032)
- Table 82: Middle East & Africa Dementia Care Products Market Revenue (US$ Mn) Comparison by Country (2016-2032)
- Table 83: Middle East & Africa Dementia Care Products Market Revenue (US$ Mn) Comparison by Type (2016-2032)
- Table 84: Middle East & Africa Dementia Care Products Market Revenue (US$ Mn) Comparison by End-User (2016-2032)
- Table 85: Middle East & Africa Dementia Care Products Market Y-o-Y Growth Rate Comparison by Country (2016-2032)
- Table 86: Middle East & Africa Dementia Care Products Market Y-o-Y Growth Rate Comparison by Type (2016-2032)
- Table 87: Middle East & Africa Dementia Care Products Market Y-o-Y Growth Rate Comparison by End-User (2016-2032)
- Table 88: Middle East & Africa Dementia Care Products Market Share Comparison by Country (2016-2032)
- Table 89: Middle East & Africa Dementia Care Products Market Share Comparison by Type (2016-2032)
- Table 90: Middle East & Africa Dementia Care Products Market Share Comparison by End-User (2016-2032)
- 1. Executive Summary
-
- BASF SE
- Evonik Industries AG
- DowDuPont Nemours Inc.
- Solvay SA
- Eastman Chemical Co.
- Clariant AG
- Ashland Global Holdings Inc.
- Givaudan
- Momentive Performance Materials Inc.
- Croda International Plc
- Lehmann & Voss & Co. KG
- CB Minerals LLC
- Lonza Group AG
- Wacker Chemie AG
- Akzo Nobel N.V.
- Symrise AG
- Kao Corporation
- Lubrizol Corporation
- Innospec Inc.
- DSM
- Coty Inc.
- Combe Inc.
- Shanghai Delta Industry
Our Clients


View Our Licence Options
