
Cosmeceuticals Market Research Report Information, by Product Type (Skincare, Hair Care, Oral Hygiene, and Other Types), by Injectable (Botox, Dermal Fillers, And Other Injectable), by Distribution Channel (Pharmacy/Drug Stores, Online Stores, And Others), And Region - Forecast 2023-2032
40265
Feb 2022
165
Report Overview
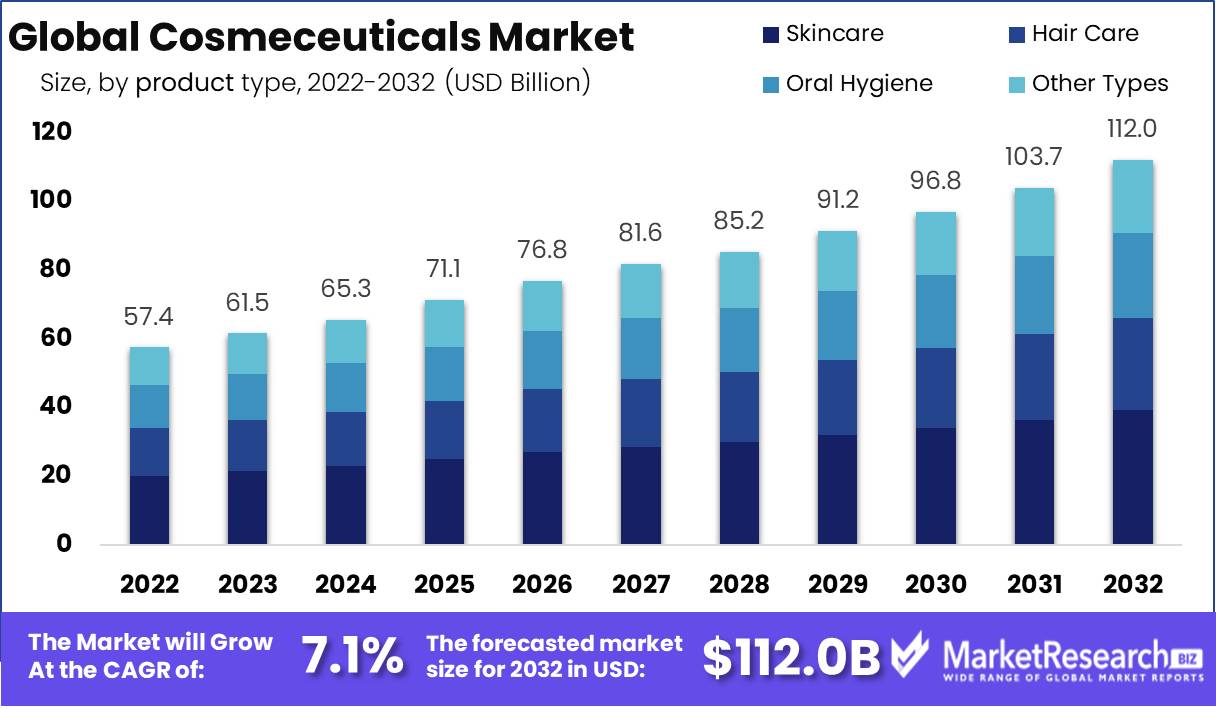
Cosmeceuticals Market size is expected to be worth around USD 112.0 Bn by 2032 from USD 57.4 Bn in 2022, growing at a CAGR of 7.1% during the forecast period from 2023 to 2032.
Cosmeceuticals are restorative beauty care products that contain naturally active synthetic substances and profess to give clinical or drug-like benefits. Corrective drugs are headways in superficial dermatological things, and innovative skincare is in the vogue age. These items upgrade the presence of and support the skin and treat restoratively compromised skin cells. The presentation of cosmeceuticals rebuilt the beauty care products and individual consideration business, and the cosmeceuticals industry is supposed to ascend as clients' familiarity with their appearance develops. Cosmeceutical brands are available without a prescription and are ordinarily utilized related to other skincare items to assist with further developing pigmentation, complexion, surface, and fine kinks.
Within the beauty and skincare industry, the cosmeceuticals market is a dynamic and rapidly evolving sector. These products are known for their combination of cosmetic and pharmaceutical properties, which provide consumers with innovative solutions to various skin concerns.
In a recent development, Oriflame, a prominent player in the cosmetics and beauty industry, made significant strides in the Indian cosmeceuticals market beginning in January 2023. They debuted a new product line called 'NovAge Proceuticals.' This product line is strategically designed to address Indian consumers' specific skin concerns, reflecting the company's commitment to providing tailored solutions in this competitive market.
In addition, in the same month, Gencor unveiled a game-changing innovation in the cosmeceuticals industry. They developed a dispersible form of palmitoylethanolamide (PEA) known as 'Levagen+.' This one-of-a-kind product is intended to protect the skin from oxidative stress-induced damage. The incorporation of Pharamako Biotechnologies' LipiSperse technology, which improves the bioavailability and functionality of PEA for beauty applications, distinguishes Levagen+.
Driving factors
Increasing The Public's Awareness of Cosmetics and Introducing Cutting-Edge Products To Boost Market Expansion
A greater number of people worldwide use these products because of the strong emphasis placed on initiatives by government agencies and market players to raise public awareness of skin and hair health. In addition, one of the primary factors driving the adoption of these products in both established and emerging economies is the creation of active ingredients by cosmeceutical market participants.
For instance, in the year 2021, a number of specialized campaigns sponsored by the American Academy of Dermatology will emphasize skin and hair health alongside overall health. The month of May is skin cancer awareness month, highlighting the importance of sun protection through the use of sunscreen products and the harm caused by UV rays to the skin are two examples. The demand for professional skincare products is rising as a result of the rising incidence of skin conditions in both children and adults.
Various cosmeceuticals market players have been encouraged to develop novel formulations with a focus on the development of active ingredients, such as plant-based alternatives, as a result of this and the global adoption of organic products. The cosmeceuticals market's expansion can be attributed to an increase in key product launches and product development. Explore the numerous benefits of cosmeceuticals in addressing dry skin with advanced skin care anti-aging solutions, driving growth in the cosmeceuticals market.
Restraining Factors
High Cost of Branded Products To Affect Demand for Cosmeceuticals
The cosmetic industry is in high demand all over the world due to the rising number of people with skin and hair conditions, the aging population, and public awareness of dermatological treatments. It is anticipated that the market's expansion will be stifled by the prohibitive price of branded cosmeceuticals sold by major cosmeceutical market players.
The high costs incurred by the end consumer are the result of the growing number of important businesses positioning themselves as extravagance brands in this sector, the high recovery costs of products as a result of spending on novel product research and development, and brand campaigns.
A major impediment to cosmeceuticals market expansion is the availability of low-quality alternates as a result of a lack of strict regulation. During the forecast period, the demand for these products in developing nations is also hindered by the absence of insurance reimbursement.
Type Analysis
In 2022, The Dominance Of The Skin Care Segment Resulted From An Increase In Product Adoption.
The cosmeceuticals market is divided into skin care, hair care, Oral Hygiene, and other types by product type. Anti-aging, sun protection, skin whitening, anti-acne cosmetics, professional skincare, and other segments further divide the skincare industry. The general public's rising awareness of skin diseases and increasing use of personal care products contributed to this market's dominance.
Due to the growing number of people who are getting older and the growing awareness of anti-aging products that effectively manage skin aesthetics like wrinkles, the anti-aging category dominated the skincare market. Cosmeceuticals offer essential benefits for dry skin, revolutionizing skincare.
The Cosmeceuticals Market has witnessed remarkable industry growth within the skincare segment. Consumers prioritize skin health, addressing skin concerns with cosmetic products. This trend has spurred innovation in both skincare and makeup products, driving advancements in the cosmetics industry.
Distribution Channel Analysis
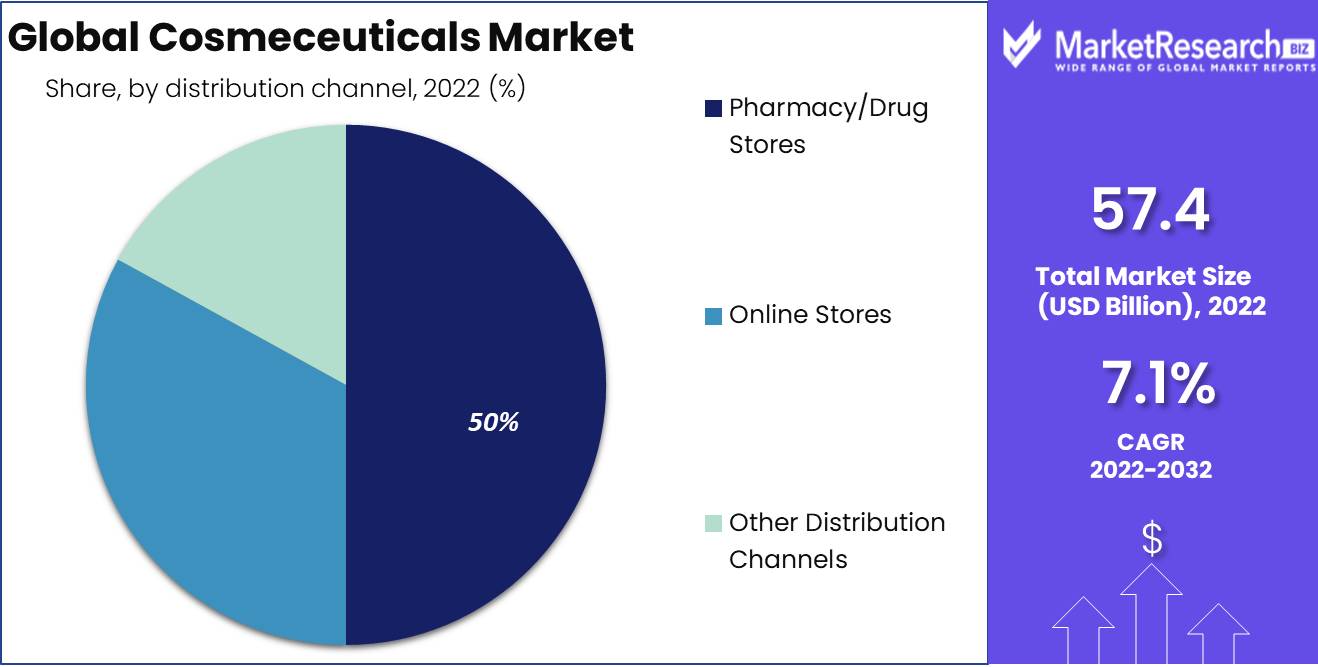
A Stable Distribution System To Support The Pharmacy/Drug Store Sector's Dominance Of The Global Market From 2023 To 2032
Based on the distribution channel, the global cosmeceuticals market is divided into drug stores/pharmacies, online stores, and others. In 2022, the segment of drug stores and pharmacies held the largest share of the global market. The retail stores' discounts and the introduction of cutting-edge products at reasonable prices are to blame for the segment's dominance. Additionally, the robust network of these stores in developed nations and stronger penetration of larger store chains are to blame for the strong growth of the pharmacy/drug stores segment in the global industry.
In contrast, the online store's segment is expected to experience a higher CAGR than the other segments. The entry of major players that are investing in the growth of e-commerce and digital platforms to engage customers in real-time is credited with the higher growth of online channels. In addition, the COVID-19 pandemic has significantly influenced consumers' preference for online stores over retail ones. Online segments have driven the annual growth rate of the cosmeceuticals market, becoming the primary online distribution channel for these products.
Key Market Segments
Based on Type
- Skincare
- Hair Care
- Oral Hygiene
- Other Types
By Injectable
- Botox
- Dermal Fillers
- Other Injectable
By Distribution Channel
- Pharmacy/Drug Stores
- Online Stores
- Other Distribution Channels
Growth Opportunity
Personalized cosmeceutical products, tailored to an individual's specific skin type and concerns, have become increasingly popular. Companies that offer customizable solutions may find a unique selling point in the market. To dominate the cosmeceuticals market, leveraging growth factors is imperative. Key development strategies must align with evolving consumer demands. Balancing traditional products with innovative offerings is vital to secure the largest market share. Effective development activities are pivotal for sustained success in this competitive landscape.
This, in turn, has created opportunities for new introductions and innovations in the cosmetic industry, thus making the manufacturers focus on active anti-aging-based skin products. The cosmeceutical market growth has been witnessed due to the increasing demand for high-product quality. Consumers are seeking active anti-aging-based skin products. However, it's essential to address harmful effects and ensure safety, especially with the increase in skin disorders in this dynamic market.
Latest Trends
Increasing Preference of General Population Toward Natural Products To Boost Demand For Cosmeceuticals
Bringing to light the advantages that natural ingredients offer over conventional products, such as fewer side effects like skin cracking and hair loss. The cosmeceuticals market is expected to expand as a result of major market players' efforts to raise awareness of organic outcomes through different brand drives and dermatologists' growing preference for prescribing natural alternatives such as organic products for skin and hair care. In addition, the major players in the market are working on the creation of e-commerce media, such as Direct to Consumer (DTC) dispersal media, in order to meet the growing demand, which is anticipated to support the expansion of organic outcomes.
Regional Analysis
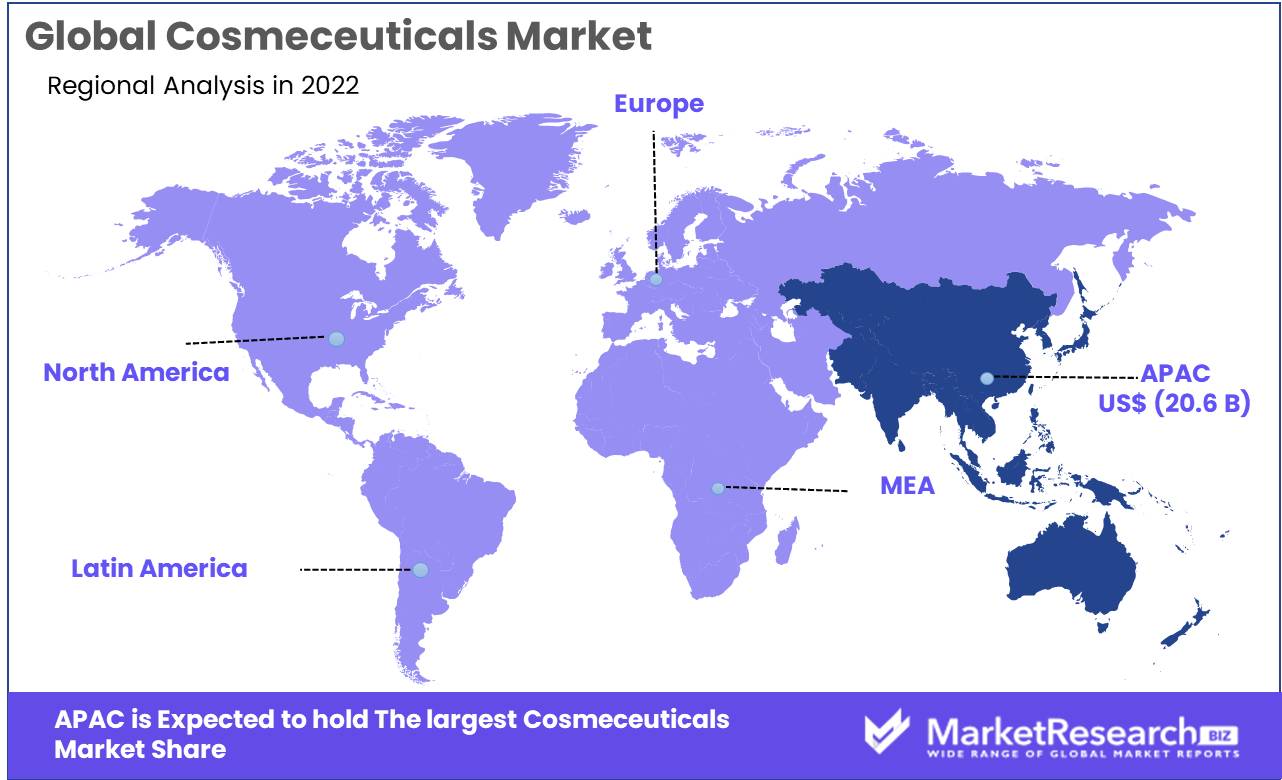
Asia-Pacific Region Accounted Significant Share Of The Global Cosmeceuticals Market
Asia Pacific dominated the cosmeceuticals market. The Asian market's expansion can be attributed to the increasing emphasis on strategic partnerships and product launches by market players as well as investments in digital infrastructure to boost product distribution and appeal to consumers. In addition, the Asia-Pacific market is being driven by a number of key factors, including a growing population and increased public awareness of these products.
In addition, consumers of cosmeceuticals in Asia-Pacific are likely to grow gradually due to rising market demand for products and a growing awareness of skin and hair health, medical aesthetics, and dermatological disorders.
In the global market, North America held the second-largest cosmeceutical market size, and share. The widespread availability of patients with dermatological conditions like melanoma and eczema and the expanding use of cutting-edge dermatology products in the region are to blame for this expansion. Additionally, it is anticipated that cosmeceutical products will see an increase in demand as a result of an increasing number of dermatological procedures, such as non-surgical cosmetic procedures.
Key Regions and Countries
North America
- US
- Canada
- Mexico
Western Europe
- Germany
- France
- The UK
- Spain
- Italy
- Portugal
- Ireland
- Austria
- Switzerland
- Benelux
- Nordic
- Rest of Western Europe
Eastern Europe
- Russia
- Poland
- The Czech Republic
- Greece
- Rest of Eastern Europe
APAC
- China
- Japan
- South Korea
- India
- Australia & New Zealand
- Indonesia
- Malaysia
- Philippines
- Singapore
- Thailand
- Vietnam
- Rest of APAC
Latin America
- Brazil
- Colombia
- Chile
- Argentina
- Costa Rica
- Rest of Latin America
Middle East & Africa
- Algeria
- Egypt
- Israel
- Kuwait
- Nigeria
- Saudi Arabia
- South Africa
- Turkey
- United Arab Emirates
- Rest of MEA
Key Players Analysis
Strong Portfolio Of Leading Companies' Products To Help Take Over The Market
The global cosmeceuticals market is fragmented, with key market players, such as L’Oréal, Unilever, Estée Lauder Companies Inc., Procter and Gamble, and Shiseido Company Limited, holding a significant market share. The dominance of these players is attributed to the robust product portfolio of skincare products, strategic collaborations, and a strong distribution network. However, the presence of domestic players in the competitive landscape, holding the majority of the market share, varies among different regions. The key companies operating in the market are introducing advancements in key products to gain a competitive advantage over other key market players.
Moreover, there is a strong emphasis on mergers and partnerships with a view to strengthening product portfolios along with a focus on the development of e-commerce platforms to improve product reach and cosmeceuticals market position. Moreover, the other major market players, including ELEMENTIS PLC., Beiersdorf, AVON products Inc., and Allergan (AbbVie Inc.), are focused on offering OTC products to provide to developing markets as well as acquiring prominent market share across the globe.
Top Key Players in Cosmeceuticals Market
- L’Oréal (France)
- Estée Lauder Companies Inc. (U.S.)
- Beiersdorf (Germany)
- Shiseido Company Limited (Japan)
- Procter and Gamble (U.S.)
- Elementis Plc (U.S.)
- Avon Products Inc. (U.K.)
- Allergan (U.S.)
- BASF SE (Germany)
- Croda International Plc (U.K.)
- Unilever (U.K.)
- Coty Inc. (U.S.)
- Johnson & Johnson Services, Inc. (U.S.)
- Clarins (France)
- LVMH (France)
- Merck & Company Inc.
- Other Key Players
Recent Development
- In May 2023: CHOSEN, a leading cosmeceuticals brand in India, launched the "Child's Play" detangler serum for messy hair, catering to the Indian market.
- In January 2023: Oriflame launched its first range of cosmeceutical products, NovAge Proceuticals, for the Indian market, addressing specific skin challenges.
- In January 2023: Gencor unveiled a dispersible form of palmitoylethanolamide (PEA) called Levagen+ designed to shield the skin from damage caused by oxidative stress. Pharamako Biotechnologies' LipiSperse technology, integrated into Levagen+, enhances the bioavailability and functionality of PEA for beauty applications, as stated by the company.
- In October 2022: Obagi Cosmeceuticals relocated its corporate headquarters to The Woodlands, Texas, adding to the region's business-friendly environment.
- In September 2022: ESK introduced its Ageless dissolving microneedle eye patches, utilizing innovative technology to improve the delivery of skincare activities.
- In July 2022: L'Oréal Professionnel Paris launched its 'Curl Expression' range in Nigeria, featuring ten products designed specifically for natural and kinky hair textures.
Report Scope:
Report Features Description Market Value (2022) USD 57.4 Bn Forecast Revenue (2032) USD 112.0 Bn CAGR (2023-2032) 7.1% Base Year for Estimation 2022 Historic Period 2016-2022 Forecast Period 2023-2032 Report Coverage Revenue Forecast, Market Dynamics, COVID-19 Impact, Competitive Landscape, Recent Developments Segments Covered Based on Type (Skincare, haircare, Oral Hygiene, Other), By Injectable (Botox, Dermal Fillers, Other Injectable), By Distribution Channel (Pharmacy/Drug Stores, Online Stores, Other Distribution Channels) Regional Analysis North America – The US, Canada, & Mexico; Western Europe – Germany, France, The UK, Spain, Italy, Portugal, Ireland, Austria, Switzerland, Benelux, Nordic, & Rest of Western Europe; Eastern Europe – Russia, Poland, The Czech Republic, Greece, & Rest of Eastern Europe; APAC – China, Japan, South Korea, India, Australia & New Zealand, Indonesia, Malaysia, Philippines, Singapore, Thailand, Vietnam, & Rest of APAC; Latin America – Brazil, Colombia, Chile, Argentina, Costa Rica, & Rest of Latin America; Middle East & Africa – Algeria, Egypt, Israel, Kuwait, Nigeria, Saudi Arabia, South Africa, Turkey, United Arab Emirates, & Rest of MEA Competitive Landscape L’Oréal (France) Estée Lauder Companies Inc. (U.S.), Beiersdorf (Germany), Shiseido Company Limited (Japan), Procter and Gamble (U.S.), Elementis Plc (U.S.), Avon (U.K.), Allergan (U.S.), BASF SE (Germany), Croda International Plc (U.K.), Unilever (U.K.), Coty Inc. (U.S.), Johnson & Johnson Services, Inc. (U.S.), Clarins (France), LVMH (France), Merck & Company Inc., Other Key Players Customization Scope Customization for segments, region/country-level will be provided. Moreover, additional customization can be done based on the requirements. Purchase Options We have three licenses to opt for: Single User License, Multi-User License (Up to 5 Users), Corporate Use License (Unlimited User and Printable PDF) - L’Oréal (France)
- Estée Lauder Companies Inc. (U.S.)
- Beiersdorf (Germany)
- Shiseido Company Limited (Japan)
- Procter and Gamble (U.S.)
- Elementis Plc (U.S.)
- Avon Products Inc. (U.K.)
- Allergan (U.S.)
- BASF SE (Germany)
- Croda International Plc (U.K.)
- Unilever (U.K.)
- Coty Inc. (U.S.)
- Johnson & Johnson Services, Inc. (U.S.)
- Clarins (France)
- LVMH (France)
- Merck & Company Inc.
- Other Key Players
- 1. Executive Summary
- 1.1. Definition
- 1.2. Taxonomy
- 1.3. Research Scope
- 1.4. Key Analysis
- 1.5. Key Findings by Major Segments
- 1.6. Top strategies by Major Players
- 2. Global Cosmeceuticals Market Overview
- 2.1. Cosmeceuticals Market Dynamics
- 2.1.1. Drivers
- 2.1.2. Opportunities
- 2.1.3. Restraints
- 2.1.4. Challenges
- 2.2. Macro-economic Factors
- 2.3. Regulatory Framework
- 2.4. Market Investment Feasibility Index
- 2.5. PEST Analysis
- 2.6. PORTER’S Five Force Analysis
- 2.7. Drivers & Restraints Impact Analysis
- 2.8. Industry Chain Analysis
- 2.9. Cost Structure Analysis
- 2.10. Marketing Strategy
- 2.11. Russia-Ukraine War Impact Analysis
- 2.12. Opportunity Map Analysis
- 2.13. Market Competition Scenario Analysis
- 2.14. Product Life Cycle Analysis
- 2.15. Opportunity Orbits
- 2.16. Manufacturer Intensity Map
- 2.17. Major Companies sales by Value & Volume
- 2.1. Cosmeceuticals Market Dynamics
- 3. Global Cosmeceuticals Market Analysis, Opportunity and Forecast, 2016-2032
- 3.1. Global Cosmeceuticals Market Analysis, 2016-2021
- 3.2. Global Cosmeceuticals Market Opportunity and Forecast, 2023-2032
- 3.3. Global Cosmeceuticals Market Analysis, Opportunity and Forecast, By Type , 2016-2032
- 3.3.1. Global Cosmeceuticals Market Analysis by Type : Introduction
- 3.3.2. Market Size Absolute $ Opportunity Analysis and Forecast, By Type , 2016-2032
- 3.3.3. Skincare
- 3.3.4. Hair care
- 3.3.5. Oral Hygiene
- 3.3.6. Other Types
- 3.4. Global Cosmeceuticals Market Analysis, Opportunity and Forecast, By Injectable , 2016-2032
- 3.4.1. Global Cosmeceuticals Market Analysis by Injectable : Introduction
- 3.4.2. Market Size Absolute $ Opportunity Analysis and Forecast, By Injectable , 2016-2032
- 3.4.3. Botox
- 3.4.4. Dermal Fillers
- 3.4.5. Other Injectable
- 3.5. Global Cosmeceuticals Market Analysis, Opportunity and Forecast, By Distribution Channel, 2016-2032
- 3.5.1. Global Cosmeceuticals Market Analysis by Distribution Channel: Introduction
- 3.5.2. Market Size Absolute $ Opportunity Analysis and Forecast, By Distribution Channel, 2016-2032
- 3.5.3. Pharmacy/Drug Stores
- 3.5.4. Online Stores
- 3.5.5. Other Distribution Channels
- 4. North America Cosmeceuticals Market Analysis, Opportunity and Forecast, 2016-2032
- 4.1. North America Cosmeceuticals Market Analysis, 2016-2021
- 4.2. North America Cosmeceuticals Market Opportunity and Forecast, 2023-2032
- 4.3. North America Cosmeceuticals Market Analysis, Opportunity and Forecast, By Type , 2016-2032
- 4.3.1. North America Cosmeceuticals Market Analysis by Type : Introduction
- 4.3.2. Market Size Absolute $ Opportunity Analysis and Forecast, By Type , 2016-2032
- 4.3.3. Skincare
- 4.3.4. Hair care
- 4.3.5. Oral Hygiene
- 4.3.6. Other Types
- 4.4. North America Cosmeceuticals Market Analysis, Opportunity and Forecast, By Injectable , 2016-2032
- 4.4.1. North America Cosmeceuticals Market Analysis by Injectable : Introduction
- 4.4.2. Market Size Absolute $ Opportunity Analysis and Forecast, By Injectable , 2016-2032
- 4.4.3. Botox
- 4.4.4. Dermal Fillers
- 4.4.5. Other Injectable
- 4.5. North America Cosmeceuticals Market Analysis, Opportunity and Forecast, By Distribution Channel, 2016-2032
- 4.5.1. North America Cosmeceuticals Market Analysis by Distribution Channel: Introduction
- 4.5.2. Market Size Absolute $ Opportunity Analysis and Forecast, By Distribution Channel, 2016-2032
- 4.5.3. Pharmacy/Drug Stores
- 4.5.4. Online Stores
- 4.5.5. Other Distribution Channels
- 4.6. North America Cosmeceuticals Market Analysis, Opportunity and Forecast, By Country , 2016-2032
- 4.6.1. North America Cosmeceuticals Market Analysis by Country : Introduction
- 4.6.2. Market Size Absolute $ Opportunity Analysis and Forecast, Country , 2016-2032
- 4.6.2.1. The US
- 4.6.2.2. Canada
- 4.6.2.3. Mexico
- 5. Western Europe Cosmeceuticals Market Analysis, Opportunity and Forecast, 2016-2032
- 5.1. Western Europe Cosmeceuticals Market Analysis, 2016-2021
- 5.2. Western Europe Cosmeceuticals Market Opportunity and Forecast, 2023-2032
- 5.3. Western Europe Cosmeceuticals Market Analysis, Opportunity and Forecast, By Type , 2016-2032
- 5.3.1. Western Europe Cosmeceuticals Market Analysis by Type : Introduction
- 5.3.2. Market Size Absolute $ Opportunity Analysis and Forecast, By Type , 2016-2032
- 5.3.3. Skincare
- 5.3.4. Hair care
- 5.3.5. Oral Hygiene
- 5.3.6. Other Types
- 5.4. Western Europe Cosmeceuticals Market Analysis, Opportunity and Forecast, By Injectable , 2016-2032
- 5.4.1. Western Europe Cosmeceuticals Market Analysis by Injectable : Introduction
- 5.4.2. Market Size Absolute $ Opportunity Analysis and Forecast, By Injectable , 2016-2032
- 5.4.3. Botox
- 5.4.4. Dermal Fillers
- 5.4.5. Other Injectable
- 5.5. Western Europe Cosmeceuticals Market Analysis, Opportunity and Forecast, By Distribution Channel, 2016-2032
- 5.5.1. Western Europe Cosmeceuticals Market Analysis by Distribution Channel: Introduction
- 5.5.2. Market Size Absolute $ Opportunity Analysis and Forecast, By Distribution Channel, 2016-2032
- 5.5.3. Pharmacy/Drug Stores
- 5.5.4. Online Stores
- 5.5.5. Other Distribution Channels
- 5.6. Western Europe Cosmeceuticals Market Analysis, Opportunity and Forecast, By Country , 2016-2032
- 5.6.1. Western Europe Cosmeceuticals Market Analysis by Country : Introduction
- 5.6.2. Market Size Absolute $ Opportunity Analysis and Forecast, Country , 2016-2032
- 5.6.2.1. Germany
- 5.6.2.2. France
- 5.6.2.3. The UK
- 5.6.2.4. Spain
- 5.6.2.5. Italy
- 5.6.2.6. Portugal
- 5.6.2.7. Ireland
- 5.6.2.8. Austria
- 5.6.2.9. Switzerland
- 5.6.2.10. Benelux
- 5.6.2.11. Nordic
- 5.6.2.12. Rest of Western Europe
- 6. Eastern Europe Cosmeceuticals Market Analysis, Opportunity and Forecast, 2016-2032
- 6.1. Eastern Europe Cosmeceuticals Market Analysis, 2016-2021
- 6.2. Eastern Europe Cosmeceuticals Market Opportunity and Forecast, 2023-2032
- 6.3. Eastern Europe Cosmeceuticals Market Analysis, Opportunity and Forecast, By Type , 2016-2032
- 6.3.1. Eastern Europe Cosmeceuticals Market Analysis by Type : Introduction
- 6.3.2. Market Size Absolute $ Opportunity Analysis and Forecast, By Type , 2016-2032
- 6.3.3. Skincare
- 6.3.4. Hair care
- 6.3.5. Oral Hygiene
- 6.3.6. Other Types
- 6.4. Eastern Europe Cosmeceuticals Market Analysis, Opportunity and Forecast, By Injectable , 2016-2032
- 6.4.1. Eastern Europe Cosmeceuticals Market Analysis by Injectable : Introduction
- 6.4.2. Market Size Absolute $ Opportunity Analysis and Forecast, By Injectable , 2016-2032
- 6.4.3. Botox
- 6.4.4. Dermal Fillers
- 6.4.5. Other Injectable
- 6.5. Eastern Europe Cosmeceuticals Market Analysis, Opportunity and Forecast, By Distribution Channel, 2016-2032
- 6.5.1. Eastern Europe Cosmeceuticals Market Analysis by Distribution Channel: Introduction
- 6.5.2. Market Size Absolute $ Opportunity Analysis and Forecast, By Distribution Channel, 2016-2032
- 6.5.3. Pharmacy/Drug Stores
- 6.5.4. Online Stores
- 6.5.5. Other Distribution Channels
- 6.6. Eastern Europe Cosmeceuticals Market Analysis, Opportunity and Forecast, By Country , 2016-2032
- 6.6.1. Eastern Europe Cosmeceuticals Market Analysis by Country : Introduction
- 6.6.2. Market Size Absolute $ Opportunity Analysis and Forecast, Country , 2016-2032
- 6.6.2.1. Russia
- 6.6.2.2. Poland
- 6.6.2.3. The Czech Republic
- 6.6.2.4. Greece
- 6.6.2.5. Rest of Eastern Europe
- 7. APAC Cosmeceuticals Market Analysis, Opportunity and Forecast, 2016-2032
- 7.1. APAC Cosmeceuticals Market Analysis, 2016-2021
- 7.2. APAC Cosmeceuticals Market Opportunity and Forecast, 2023-2032
- 7.3. APAC Cosmeceuticals Market Analysis, Opportunity and Forecast, By Type , 2016-2032
- 7.3.1. APAC Cosmeceuticals Market Analysis by Type : Introduction
- 7.3.2. Market Size Absolute $ Opportunity Analysis and Forecast, By Type , 2016-2032
- 7.3.3. Skincare
- 7.3.4. Hair care
- 7.3.5. Oral Hygiene
- 7.3.6. Other Types
- 7.4. APAC Cosmeceuticals Market Analysis, Opportunity and Forecast, By Injectable , 2016-2032
- 7.4.1. APAC Cosmeceuticals Market Analysis by Injectable : Introduction
- 7.4.2. Market Size Absolute $ Opportunity Analysis and Forecast, By Injectable , 2016-2032
- 7.4.3. Botox
- 7.4.4. Dermal Fillers
- 7.4.5. Other Injectable
- 7.5. APAC Cosmeceuticals Market Analysis, Opportunity and Forecast, By Distribution Channel, 2016-2032
- 7.5.1. APAC Cosmeceuticals Market Analysis by Distribution Channel: Introduction
- 7.5.2. Market Size Absolute $ Opportunity Analysis and Forecast, By Distribution Channel, 2016-2032
- 7.5.3. Pharmacy/Drug Stores
- 7.5.4. Online Stores
- 7.5.5. Other Distribution Channels
- 7.6. APAC Cosmeceuticals Market Analysis, Opportunity and Forecast, By Country , 2016-2032
- 7.6.1. APAC Cosmeceuticals Market Analysis by Country : Introduction
- 7.6.2. Market Size Absolute $ Opportunity Analysis and Forecast, Country , 2016-2032
- 7.6.2.1. China
- 7.6.2.2. Japan
- 7.6.2.3. South Korea
- 7.6.2.4. India
- 7.6.2.5. Australia & New Zeland
- 7.6.2.6. Indonesia
- 7.6.2.7. Malaysia
- 7.6.2.8. Philippines
- 7.6.2.9. Singapore
- 7.6.2.10. Thailand
- 7.6.2.11. Vietnam
- 7.6.2.12. Rest of APAC
- 8. Latin America Cosmeceuticals Market Analysis, Opportunity and Forecast, 2016-2032
- 8.1. Latin America Cosmeceuticals Market Analysis, 2016-2021
- 8.2. Latin America Cosmeceuticals Market Opportunity and Forecast, 2023-2032
- 8.3. Latin America Cosmeceuticals Market Analysis, Opportunity and Forecast, By Type , 2016-2032
- 8.3.1. Latin America Cosmeceuticals Market Analysis by Type : Introduction
- 8.3.2. Market Size Absolute $ Opportunity Analysis and Forecast, By Type , 2016-2032
- 8.3.3. Skincare
- 8.3.4. Hair care
- 8.3.5. Oral Hygiene
- 8.3.6. Other Types
- 8.4. Latin America Cosmeceuticals Market Analysis, Opportunity and Forecast, By Injectable , 2016-2032
- 8.4.1. Latin America Cosmeceuticals Market Analysis by Injectable : Introduction
- 8.4.2. Market Size Absolute $ Opportunity Analysis and Forecast, By Injectable , 2016-2032
- 8.4.3. Botox
- 8.4.4. Dermal Fillers
- 8.4.5. Other Injectable
- 8.5. Latin America Cosmeceuticals Market Analysis, Opportunity and Forecast, By Distribution Channel, 2016-2032
- 8.5.1. Latin America Cosmeceuticals Market Analysis by Distribution Channel: Introduction
- 8.5.2. Market Size Absolute $ Opportunity Analysis and Forecast, By Distribution Channel, 2016-2032
- 8.5.3. Pharmacy/Drug Stores
- 8.5.4. Online Stores
- 8.5.5. Other Distribution Channels
- 8.6. Latin America Cosmeceuticals Market Analysis, Opportunity and Forecast, By Country , 2016-2032
- 8.6.1. Latin America Cosmeceuticals Market Analysis by Country : Introduction
- 8.6.2. Market Size Absolute $ Opportunity Analysis and Forecast, Country , 2016-2032
- 8.6.2.1. Brazil
- 8.6.2.2. Colombia
- 8.6.2.3. Chile
- 8.6.2.4. Argentina
- 8.6.2.5. Costa Rica
- 8.6.2.6. Rest of Latin America
- 9. Middle East & Africa Cosmeceuticals Market Analysis, Opportunity and Forecast, 2016-2032
- 9.1. Middle East & Africa Cosmeceuticals Market Analysis, 2016-2021
- 9.2. Middle East & Africa Cosmeceuticals Market Opportunity and Forecast, 2023-2032
- 9.3. Middle East & Africa Cosmeceuticals Market Analysis, Opportunity and Forecast, By Type , 2016-2032
- 9.3.1. Middle East & Africa Cosmeceuticals Market Analysis by Type : Introduction
- 9.3.2. Market Size Absolute $ Opportunity Analysis and Forecast, By Type , 2016-2032
- 9.3.3. Skincare
- 9.3.4. Hair care
- 9.3.5. Oral Hygiene
- 9.3.6. Other Types
- 9.4. Middle East & Africa Cosmeceuticals Market Analysis, Opportunity and Forecast, By Injectable , 2016-2032
- 9.4.1. Middle East & Africa Cosmeceuticals Market Analysis by Injectable : Introduction
- 9.4.2. Market Size Absolute $ Opportunity Analysis and Forecast, By Injectable , 2016-2032
- 9.4.3. Botox
- 9.4.4. Dermal Fillers
- 9.4.5. Other Injectable
- 9.5. Middle East & Africa Cosmeceuticals Market Analysis, Opportunity and Forecast, By Distribution Channel, 2016-2032
- 9.5.1. Middle East & Africa Cosmeceuticals Market Analysis by Distribution Channel: Introduction
- 9.5.2. Market Size Absolute $ Opportunity Analysis and Forecast, By Distribution Channel, 2016-2032
- 9.5.3. Pharmacy/Drug Stores
- 9.5.4. Online Stores
- 9.5.5. Other Distribution Channels
- 9.6. Middle East & Africa Cosmeceuticals Market Analysis, Opportunity and Forecast, By Country , 2016-2032
- 9.6.1. Middle East & Africa Cosmeceuticals Market Analysis by Country : Introduction
- 9.6.2. Market Size Absolute $ Opportunity Analysis and Forecast, Country , 2016-2032
- 9.6.2.1. Algeria
- 9.6.2.2. Egypt
- 9.6.2.3. Israel
- 9.6.2.4. Kuwait
- 9.6.2.5. Nigeria
- 9.6.2.6. Saudi Arabia
- 9.6.2.7. South Africa
- 9.6.2.8. Turkey
- 9.6.2.9. The UAE
- 9.6.2.10. Rest of MEA
- 10. Global Cosmeceuticals Market Analysis, Opportunity and Forecast, By Region , 2016-2032
- 10.1. Global Cosmeceuticals Market Analysis by Region : Introduction
- 10.2. Market Size Absolute $ Opportunity Analysis and Forecast, By Region , 2016-2032
- 10.2.1. North America
- 10.2.2. Western Europe
- 10.2.3. Eastern Europe
- 10.2.4. APAC
- 10.2.5. Latin America
- 10.2.6. Middle East & Africa
- 11. Global Cosmeceuticals Market Competitive Landscape, Market Share Analysis, and Company Profiles
- 11.1. Market Share Analysis
- 11.2. Company Profiles
- 11.3. L’Oréal (France) Estée Lauder Companies Inc. (U.S.)
- 11.3.1. Company Overview
- 11.3.2. Financial Highlights
- 11.3.3. Product Portfolio
- 11.3.4. SWOT Analysis
- 11.3.5. Key Strategies and Developments
- 11.4. Beiersdorf (Germany)
- 11.4.1. Company Overview
- 11.4.2. Financial Highlights
- 11.4.3. Product Portfolio
- 11.4.4. SWOT Analysis
- 11.4.5. Key Strategies and Developments
- 11.5. Shiseido Company Limited (Japan)
- 11.5.1. Company Overview
- 11.5.2. Financial Highlights
- 11.5.3. Product Portfolio
- 11.5.4. SWOT Analysis
- 11.5.5. Key Strategies and Developments
- 11.6. Procter and Gamble (U.S.)
- 11.6.1. Company Overview
- 11.6.2. Financial Highlights
- 11.6.3. Product Portfolio
- 11.6.4. SWOT Analysis
- 11.6.5. Key Strategies and Developments
- 11.7. Elementis Plc (U.S.)
- 11.7.1. Company Overview
- 11.7.2. Financial Highlights
- 11.7.3. Product Portfolio
- 11.7.4. SWOT Analysis
- 11.7.5. Key Strategies and Developments
- 11.8. Avon (U.K.)
- 11.8.1. Company Overview
- 11.8.2. Financial Highlights
- 11.8.3. Product Portfolio
- 11.8.4. SWOT Analysis
- 11.8.5. Key Strategies and Developments
- 11.9. Allergan (U.S.)
- 11.9.1. Company Overview
- 11.9.2. Financial Highlights
- 11.9.3. Product Portfolio
- 11.9.4. SWOT Analysis
- 11.9.5. Key Strategies and Developments
- 11.10. BASF SE (Germany)
- 11.10.1. Company Overview
- 11.10.2. Financial Highlights
- 11.10.3. Product Portfolio
- 11.10.4. SWOT Analysis
- 11.10.5. Key Strategies and Developments
- 11.11. Croda International Plc (U.K.)
- 11.11.1. Company Overview
- 11.11.2. Financial Highlights
- 11.11.3. Product Portfolio
- 11.11.4. SWOT Analysis
- 11.11.5. Key Strategies and Developments
- 11.12. Unilever (U.K.)
- 11.12.1. Company Overview
- 11.12.2. Financial Highlights
- 11.12.3. Product Portfolio
- 11.12.4. SWOT Analysis
- 11.12.5. Key Strategies and Developments
- 11.13. Coty Inc. (U.S.)
- 11.13.1. Company Overview
- 11.13.2. Financial Highlights
- 11.13.3. Product Portfolio
- 11.13.4. SWOT Analysis
- 11.13.5. Key Strategies and Developments
- 11.14. Other Key Players
- 11.14.1. Company Overview
- 11.14.2. Financial Highlights
- 11.14.3. Product Portfolio
- 11.14.4. SWOT Analysis
- 11.14.5. Key Strategies and Developments
- 12. Assumptions and Acronyms
- 13. Research Methodology
- 14. Contact
- List of Figures
- Figure 1: Global Cosmeceuticals Market Revenue (US$ Mn) Market Share by Type in 2022
- Figure 2: Global Cosmeceuticals Market Attractiveness Analysis by Type , 2016-2032
- Figure 3: Global Cosmeceuticals Market Revenue (US$ Mn) Market Share by Injectable in 2022
- Figure 4: Global Cosmeceuticals Market Attractiveness Analysis by Injectable , 2016-2032
- Figure 5: Global Cosmeceuticals Market Revenue (US$ Mn) Market Share by Distribution Channelin 2022
- Figure 6: Global Cosmeceuticals Market Attractiveness Analysis by Distribution Channel, 2016-2032
- Figure 7: Global Cosmeceuticals Market Revenue (US$ Mn) Market Share by Region in 2022
- Figure 8: Global Cosmeceuticals Market Attractiveness Analysis by Region, 2016-2032
- Figure 9: Global Cosmeceuticals Market Revenue (US$ Mn) (2016-2032)
- Figure 10: Global Cosmeceuticals Market Revenue (US$ Mn) Comparison by Region (2016-2032)
- Figure 11: Global Cosmeceuticals Market Revenue (US$ Mn) Comparison by Type (2016-2032)
- Figure 12: Global Cosmeceuticals Market Revenue (US$ Mn) Comparison by Injectable (2016-2032)
- Figure 13: Global Cosmeceuticals Market Revenue (US$ Mn) Comparison by Distribution Channel (2016-2032)
- Figure 14: Global Cosmeceuticals Market Y-o-Y Growth Rate Comparison by Region (2016-2032)
- Figure 15: Global Cosmeceuticals Market Y-o-Y Growth Rate Comparison by Type (2016-2032)
- Figure 16: Global Cosmeceuticals Market Y-o-Y Growth Rate Comparison by Injectable (2016-2032)
- Figure 17: Global Cosmeceuticals Market Y-o-Y Growth Rate Comparison by Distribution Channel (2016-2032)
- Figure 18: Global Cosmeceuticals Market Share Comparison by Region (2016-2032)
- Figure 19: Global Cosmeceuticals Market Share Comparison by Type (2016-2032)
- Figure 20: Global Cosmeceuticals Market Share Comparison by Injectable (2016-2032)
- Figure 21: Global Cosmeceuticals Market Share Comparison by Distribution Channel (2016-2032)
- Figure 22: North America Cosmeceuticals Market Revenue (US$ Mn) Market Share by Type in 2022
- Figure 23: North America Cosmeceuticals Market Attractiveness Analysis by Type , 2016-2032
- Figure 24: North America Cosmeceuticals Market Revenue (US$ Mn) Market Share by Injectable in 2022
- Figure 25: North America Cosmeceuticals Market Attractiveness Analysis by Injectable , 2016-2032
- Figure 26: North America Cosmeceuticals Market Revenue (US$ Mn) Market Share by Distribution Channelin 2022
- Figure 27: North America Cosmeceuticals Market Attractiveness Analysis by Distribution Channel, 2016-2032
- Figure 28: North America Cosmeceuticals Market Revenue (US$ Mn) Market Share by Country in 2022
- Figure 29: North America Cosmeceuticals Market Attractiveness Analysis by Country, 2016-2032
- Figure 30: North America Cosmeceuticals Market Revenue (US$ Mn) (2016-2032)
- Figure 31: North America Cosmeceuticals Market Revenue (US$ Mn) Comparison by Country (2016-2032)
- Figure 32: North America Cosmeceuticals Market Revenue (US$ Mn) Comparison by Type (2016-2032)
- Figure 33: North America Cosmeceuticals Market Revenue (US$ Mn) Comparison by Injectable (2016-2032)
- Figure 34: North America Cosmeceuticals Market Revenue (US$ Mn) Comparison by Distribution Channel (2016-2032)
- Figure 35: North America Cosmeceuticals Market Y-o-Y Growth Rate Comparison by Country (2016-2032)
- Figure 36: North America Cosmeceuticals Market Y-o-Y Growth Rate Comparison by Type (2016-2032)
- Figure 37: North America Cosmeceuticals Market Y-o-Y Growth Rate Comparison by Injectable (2016-2032)
- Figure 38: North America Cosmeceuticals Market Y-o-Y Growth Rate Comparison by Distribution Channel (2016-2032)
- Figure 39: North America Cosmeceuticals Market Share Comparison by Country (2016-2032)
- Figure 40: North America Cosmeceuticals Market Share Comparison by Type (2016-2032)
- Figure 41: North America Cosmeceuticals Market Share Comparison by Injectable (2016-2032)
- Figure 42: North America Cosmeceuticals Market Share Comparison by Distribution Channel (2016-2032)
- Figure 43: Western Europe Cosmeceuticals Market Revenue (US$ Mn) Market Share by Type in 2022
- Figure 44: Western Europe Cosmeceuticals Market Attractiveness Analysis by Type , 2016-2032
- Figure 45: Western Europe Cosmeceuticals Market Revenue (US$ Mn) Market Share by Injectable in 2022
- Figure 46: Western Europe Cosmeceuticals Market Attractiveness Analysis by Injectable , 2016-2032
- Figure 47: Western Europe Cosmeceuticals Market Revenue (US$ Mn) Market Share by Distribution Channelin 2022
- Figure 48: Western Europe Cosmeceuticals Market Attractiveness Analysis by Distribution Channel, 2016-2032
- Figure 49: Western Europe Cosmeceuticals Market Revenue (US$ Mn) Market Share by Country in 2022
- Figure 50: Western Europe Cosmeceuticals Market Attractiveness Analysis by Country, 2016-2032
- Figure 51: Western Europe Cosmeceuticals Market Revenue (US$ Mn) (2016-2032)
- Figure 52: Western Europe Cosmeceuticals Market Revenue (US$ Mn) Comparison by Country (2016-2032)
- Figure 53: Western Europe Cosmeceuticals Market Revenue (US$ Mn) Comparison by Type (2016-2032)
- Figure 54: Western Europe Cosmeceuticals Market Revenue (US$ Mn) Comparison by Injectable (2016-2032)
- Figure 55: Western Europe Cosmeceuticals Market Revenue (US$ Mn) Comparison by Distribution Channel (2016-2032)
- Figure 56: Western Europe Cosmeceuticals Market Y-o-Y Growth Rate Comparison by Country (2016-2032)
- Figure 57: Western Europe Cosmeceuticals Market Y-o-Y Growth Rate Comparison by Type (2016-2032)
- Figure 58: Western Europe Cosmeceuticals Market Y-o-Y Growth Rate Comparison by Injectable (2016-2032)
- Figure 59: Western Europe Cosmeceuticals Market Y-o-Y Growth Rate Comparison by Distribution Channel (2016-2032)
- Figure 60: Western Europe Cosmeceuticals Market Share Comparison by Country (2016-2032)
- Figure 61: Western Europe Cosmeceuticals Market Share Comparison by Type (2016-2032)
- Figure 62: Western Europe Cosmeceuticals Market Share Comparison by Injectable (2016-2032)
- Figure 63: Western Europe Cosmeceuticals Market Share Comparison by Distribution Channel (2016-2032)
- Figure 64: Eastern Europe Cosmeceuticals Market Revenue (US$ Mn) Market Share by Type in 2022
- Figure 65: Eastern Europe Cosmeceuticals Market Attractiveness Analysis by Type , 2016-2032
- Figure 66: Eastern Europe Cosmeceuticals Market Revenue (US$ Mn) Market Share by Injectable in 2022
- Figure 67: Eastern Europe Cosmeceuticals Market Attractiveness Analysis by Injectable , 2016-2032
- Figure 68: Eastern Europe Cosmeceuticals Market Revenue (US$ Mn) Market Share by Distribution Channelin 2022
- Figure 69: Eastern Europe Cosmeceuticals Market Attractiveness Analysis by Distribution Channel, 2016-2032
- Figure 70: Eastern Europe Cosmeceuticals Market Revenue (US$ Mn) Market Share by Country in 2022
- Figure 71: Eastern Europe Cosmeceuticals Market Attractiveness Analysis by Country, 2016-2032
- Figure 72: Eastern Europe Cosmeceuticals Market Revenue (US$ Mn) (2016-2032)
- Figure 73: Eastern Europe Cosmeceuticals Market Revenue (US$ Mn) Comparison by Country (2016-2032)
- Figure 74: Eastern Europe Cosmeceuticals Market Revenue (US$ Mn) Comparison by Type (2016-2032)
- Figure 75: Eastern Europe Cosmeceuticals Market Revenue (US$ Mn) Comparison by Injectable (2016-2032)
- Figure 76: Eastern Europe Cosmeceuticals Market Revenue (US$ Mn) Comparison by Distribution Channel (2016-2032)
- Figure 77: Eastern Europe Cosmeceuticals Market Y-o-Y Growth Rate Comparison by Country (2016-2032)
- Figure 78: Eastern Europe Cosmeceuticals Market Y-o-Y Growth Rate Comparison by Type (2016-2032)
- Figure 79: Eastern Europe Cosmeceuticals Market Y-o-Y Growth Rate Comparison by Injectable (2016-2032)
- Figure 80: Eastern Europe Cosmeceuticals Market Y-o-Y Growth Rate Comparison by Distribution Channel (2016-2032)
- Figure 81: Eastern Europe Cosmeceuticals Market Share Comparison by Country (2016-2032)
- Figure 82: Eastern Europe Cosmeceuticals Market Share Comparison by Type (2016-2032)
- Figure 83: Eastern Europe Cosmeceuticals Market Share Comparison by Injectable (2016-2032)
- Figure 84: Eastern Europe Cosmeceuticals Market Share Comparison by Distribution Channel (2016-2032)
- Figure 85: APAC Cosmeceuticals Market Revenue (US$ Mn) Market Share by Type in 2022
- Figure 86: APAC Cosmeceuticals Market Attractiveness Analysis by Type , 2016-2032
- Figure 87: APAC Cosmeceuticals Market Revenue (US$ Mn) Market Share by Injectable in 2022
- Figure 88: APAC Cosmeceuticals Market Attractiveness Analysis by Injectable , 2016-2032
- Figure 89: APAC Cosmeceuticals Market Revenue (US$ Mn) Market Share by Distribution Channelin 2022
- Figure 90: APAC Cosmeceuticals Market Attractiveness Analysis by Distribution Channel, 2016-2032
- Figure 91: APAC Cosmeceuticals Market Revenue (US$ Mn) Market Share by Country in 2022
- Figure 92: APAC Cosmeceuticals Market Attractiveness Analysis by Country, 2016-2032
- Figure 93: APAC Cosmeceuticals Market Revenue (US$ Mn) (2016-2032)
- Figure 94: APAC Cosmeceuticals Market Revenue (US$ Mn) Comparison by Country (2016-2032)
- Figure 95: APAC Cosmeceuticals Market Revenue (US$ Mn) Comparison by Type (2016-2032)
- Figure 96: APAC Cosmeceuticals Market Revenue (US$ Mn) Comparison by Injectable (2016-2032)
- Figure 97: APAC Cosmeceuticals Market Revenue (US$ Mn) Comparison by Distribution Channel (2016-2032)
- Figure 98: APAC Cosmeceuticals Market Y-o-Y Growth Rate Comparison by Country (2016-2032)
- Figure 99: APAC Cosmeceuticals Market Y-o-Y Growth Rate Comparison by Type (2016-2032)
- Figure 100: APAC Cosmeceuticals Market Y-o-Y Growth Rate Comparison by Injectable (2016-2032)
- Figure 101: APAC Cosmeceuticals Market Y-o-Y Growth Rate Comparison by Distribution Channel (2016-2032)
- Figure 102: APAC Cosmeceuticals Market Share Comparison by Country (2016-2032)
- Figure 103: APAC Cosmeceuticals Market Share Comparison by Type (2016-2032)
- Figure 104: APAC Cosmeceuticals Market Share Comparison by Injectable (2016-2032)
- Figure 105: APAC Cosmeceuticals Market Share Comparison by Distribution Channel (2016-2032)
- Figure 106: Latin America Cosmeceuticals Market Revenue (US$ Mn) Market Share by Type in 2022
- Figure 107: Latin America Cosmeceuticals Market Attractiveness Analysis by Type , 2016-2032
- Figure 108: Latin America Cosmeceuticals Market Revenue (US$ Mn) Market Share by Injectable in 2022
- Figure 109: Latin America Cosmeceuticals Market Attractiveness Analysis by Injectable , 2016-2032
- Figure 110: Latin America Cosmeceuticals Market Revenue (US$ Mn) Market Share by Distribution Channelin 2022
- Figure 111: Latin America Cosmeceuticals Market Attractiveness Analysis by Distribution Channel, 2016-2032
- Figure 112: Latin America Cosmeceuticals Market Revenue (US$ Mn) Market Share by Country in 2022
- Figure 113: Latin America Cosmeceuticals Market Attractiveness Analysis by Country, 2016-2032
- Figure 114: Latin America Cosmeceuticals Market Revenue (US$ Mn) (2016-2032)
- Figure 115: Latin America Cosmeceuticals Market Revenue (US$ Mn) Comparison by Country (2016-2032)
- Figure 116: Latin America Cosmeceuticals Market Revenue (US$ Mn) Comparison by Type (2016-2032)
- Figure 117: Latin America Cosmeceuticals Market Revenue (US$ Mn) Comparison by Injectable (2016-2032)
- Figure 118: Latin America Cosmeceuticals Market Revenue (US$ Mn) Comparison by Distribution Channel (2016-2032)
- Figure 119: Latin America Cosmeceuticals Market Y-o-Y Growth Rate Comparison by Country (2016-2032)
- Figure 120: Latin America Cosmeceuticals Market Y-o-Y Growth Rate Comparison by Type (2016-2032)
- Figure 121: Latin America Cosmeceuticals Market Y-o-Y Growth Rate Comparison by Injectable (2016-2032)
- Figure 122: Latin America Cosmeceuticals Market Y-o-Y Growth Rate Comparison by Distribution Channel (2016-2032)
- Figure 123: Latin America Cosmeceuticals Market Share Comparison by Country (2016-2032)
- Figure 124: Latin America Cosmeceuticals Market Share Comparison by Type (2016-2032)
- Figure 125: Latin America Cosmeceuticals Market Share Comparison by Injectable (2016-2032)
- Figure 126: Latin America Cosmeceuticals Market Share Comparison by Distribution Channel (2016-2032)
- Figure 127: Middle East & Africa Cosmeceuticals Market Revenue (US$ Mn) Market Share by Type in 2022
- Figure 128: Middle East & Africa Cosmeceuticals Market Attractiveness Analysis by Type , 2016-2032
- Figure 129: Middle East & Africa Cosmeceuticals Market Revenue (US$ Mn) Market Share by Injectable in 2022
- Figure 130: Middle East & Africa Cosmeceuticals Market Attractiveness Analysis by Injectable , 2016-2032
- Figure 131: Middle East & Africa Cosmeceuticals Market Revenue (US$ Mn) Market Share by Distribution Channelin 2022
- Figure 132: Middle East & Africa Cosmeceuticals Market Attractiveness Analysis by Distribution Channel, 2016-2032
- Figure 133: Middle East & Africa Cosmeceuticals Market Revenue (US$ Mn) Market Share by Country in 2022
- Figure 134: Middle East & Africa Cosmeceuticals Market Attractiveness Analysis by Country, 2016-2032
- Figure 135: Middle East & Africa Cosmeceuticals Market Revenue (US$ Mn) (2016-2032)
- Figure 136: Middle East & Africa Cosmeceuticals Market Revenue (US$ Mn) Comparison by Country (2016-2032)
- Figure 137: Middle East & Africa Cosmeceuticals Market Revenue (US$ Mn) Comparison by Type (2016-2032)
- Figure 138: Middle East & Africa Cosmeceuticals Market Revenue (US$ Mn) Comparison by Injectable (2016-2032)
- Figure 139: Middle East & Africa Cosmeceuticals Market Revenue (US$ Mn) Comparison by Distribution Channel (2016-2032)
- Figure 140: Middle East & Africa Cosmeceuticals Market Y-o-Y Growth Rate Comparison by Country (2016-2032)
- Figure 141: Middle East & Africa Cosmeceuticals Market Y-o-Y Growth Rate Comparison by Type (2016-2032)
- Figure 142: Middle East & Africa Cosmeceuticals Market Y-o-Y Growth Rate Comparison by Injectable (2016-2032)
- Figure 143: Middle East & Africa Cosmeceuticals Market Y-o-Y Growth Rate Comparison by Distribution Channel (2016-2032)
- Figure 144: Middle East & Africa Cosmeceuticals Market Share Comparison by Country (2016-2032)
- Figure 145: Middle East & Africa Cosmeceuticals Market Share Comparison by Type (2016-2032)
- Figure 146: Middle East & Africa Cosmeceuticals Market Share Comparison by Injectable (2016-2032)
- Figure 147: Middle East & Africa Cosmeceuticals Market Share Comparison by Distribution Channel (2016-2032)
- List of Tables
- Table 1: Global Cosmeceuticals Market Comparison by Type (2016-2032)
- Table 2: Global Cosmeceuticals Market Comparison by Injectable (2016-2032)
- Table 3: Global Cosmeceuticals Market Comparison by Distribution Channel (2016-2032)
- Table 4: Global Cosmeceuticals Market Revenue (US$ Mn) Comparison by Region (2016-2032)
- Table 5: Global Cosmeceuticals Market Revenue (US$ Mn) (2016-2032)
- Table 6: Global Cosmeceuticals Market Revenue (US$ Mn) Comparison by Region (2016-2032)
- Table 7: Global Cosmeceuticals Market Revenue (US$ Mn) Comparison by Type (2016-2032)
- Table 8: Global Cosmeceuticals Market Revenue (US$ Mn) Comparison by Injectable (2016-2032)
- Table 9: Global Cosmeceuticals Market Revenue (US$ Mn) Comparison by Distribution Channel (2016-2032)
- Table 10: Global Cosmeceuticals Market Y-o-Y Growth Rate Comparison by Region (2016-2032)
- Table 11: Global Cosmeceuticals Market Y-o-Y Growth Rate Comparison by Type (2016-2032)
- Table 12: Global Cosmeceuticals Market Y-o-Y Growth Rate Comparison by Injectable (2016-2032)
- Table 13: Global Cosmeceuticals Market Y-o-Y Growth Rate Comparison by Distribution Channel (2016-2032)
- Table 14: Global Cosmeceuticals Market Share Comparison by Region (2016-2032)
- Table 15: Global Cosmeceuticals Market Share Comparison by Type (2016-2032)
- Table 16: Global Cosmeceuticals Market Share Comparison by Injectable (2016-2032)
- Table 17: Global Cosmeceuticals Market Share Comparison by Distribution Channel (2016-2032)
- Table 18: North America Cosmeceuticals Market Comparison by Injectable (2016-2032)
- Table 19: North America Cosmeceuticals Market Comparison by Distribution Channel (2016-2032)
- Table 20: North America Cosmeceuticals Market Revenue (US$ Mn) Comparison by Country (2016-2032)
- Table 21: North America Cosmeceuticals Market Revenue (US$ Mn) (2016-2032)
- Table 22: North America Cosmeceuticals Market Revenue (US$ Mn) Comparison by Country (2016-2032)
- Table 23: North America Cosmeceuticals Market Revenue (US$ Mn) Comparison by Type (2016-2032)
- Table 24: North America Cosmeceuticals Market Revenue (US$ Mn) Comparison by Injectable (2016-2032)
- Table 25: North America Cosmeceuticals Market Revenue (US$ Mn) Comparison by Distribution Channel (2016-2032)
- Table 26: North America Cosmeceuticals Market Y-o-Y Growth Rate Comparison by Country (2016-2032)
- Table 27: North America Cosmeceuticals Market Y-o-Y Growth Rate Comparison by Type (2016-2032)
- Table 28: North America Cosmeceuticals Market Y-o-Y Growth Rate Comparison by Injectable (2016-2032)
- Table 29: North America Cosmeceuticals Market Y-o-Y Growth Rate Comparison by Distribution Channel (2016-2032)
- Table 30: North America Cosmeceuticals Market Share Comparison by Country (2016-2032)
- Table 31: North America Cosmeceuticals Market Share Comparison by Type (2016-2032)
- Table 32: North America Cosmeceuticals Market Share Comparison by Injectable (2016-2032)
- Table 33: North America Cosmeceuticals Market Share Comparison by Distribution Channel (2016-2032)
- Table 34: Western Europe Cosmeceuticals Market Comparison by Type (2016-2032)
- Table 35: Western Europe Cosmeceuticals Market Comparison by Injectable (2016-2032)
- Table 36: Western Europe Cosmeceuticals Market Comparison by Distribution Channel (2016-2032)
- Table 37: Western Europe Cosmeceuticals Market Revenue (US$ Mn) Comparison by Country (2016-2032)
- Table 38: Western Europe Cosmeceuticals Market Revenue (US$ Mn) (2016-2032)
- Table 39: Western Europe Cosmeceuticals Market Revenue (US$ Mn) Comparison by Country (2016-2032)
- Table 40: Western Europe Cosmeceuticals Market Revenue (US$ Mn) Comparison by Type (2016-2032)
- Table 41: Western Europe Cosmeceuticals Market Revenue (US$ Mn) Comparison by Injectable (2016-2032)
- Table 42: Western Europe Cosmeceuticals Market Revenue (US$ Mn) Comparison by Distribution Channel (2016-2032)
- Table 43: Western Europe Cosmeceuticals Market Y-o-Y Growth Rate Comparison by Country (2016-2032)
- Table 44: Western Europe Cosmeceuticals Market Y-o-Y Growth Rate Comparison by Type (2016-2032)
- Table 45: Western Europe Cosmeceuticals Market Y-o-Y Growth Rate Comparison by Injectable (2016-2032)
- Table 46: Western Europe Cosmeceuticals Market Y-o-Y Growth Rate Comparison by Distribution Channel (2016-2032)
- Table 47: Western Europe Cosmeceuticals Market Share Comparison by Country (2016-2032)
- Table 48: Western Europe Cosmeceuticals Market Share Comparison by Type (2016-2032)
- Table 49: Western Europe Cosmeceuticals Market Share Comparison by Injectable (2016-2032)
- Table 50: Western Europe Cosmeceuticals Market Share Comparison by Distribution Channel (2016-2032)
- Table 51: Eastern Europe Cosmeceuticals Market Comparison by Type (2016-2032)
- Table 52: Eastern Europe Cosmeceuticals Market Comparison by Injectable (2016-2032)
- Table 53: Eastern Europe Cosmeceuticals Market Comparison by Distribution Channel (2016-2032)
- Table 54: Eastern Europe Cosmeceuticals Market Revenue (US$ Mn) Comparison by Country (2016-2032)
- Table 55: Eastern Europe Cosmeceuticals Market Revenue (US$ Mn) (2016-2032)
- Table 56: Eastern Europe Cosmeceuticals Market Revenue (US$ Mn) Comparison by Country (2016-2032)
- Table 57: Eastern Europe Cosmeceuticals Market Revenue (US$ Mn) Comparison by Type (2016-2032)
- Table 58: Eastern Europe Cosmeceuticals Market Revenue (US$ Mn) Comparison by Injectable (2016-2032)
- Table 59: Eastern Europe Cosmeceuticals Market Revenue (US$ Mn) Comparison by Distribution Channel (2016-2032)
- Table 60: Eastern Europe Cosmeceuticals Market Y-o-Y Growth Rate Comparison by Country (2016-2032)
- Table 61: Eastern Europe Cosmeceuticals Market Y-o-Y Growth Rate Comparison by Type (2016-2032)
- Table 62: Eastern Europe Cosmeceuticals Market Y-o-Y Growth Rate Comparison by Injectable (2016-2032)
- Table 63: Eastern Europe Cosmeceuticals Market Y-o-Y Growth Rate Comparison by Distribution Channel (2016-2032)
- Table 64: Eastern Europe Cosmeceuticals Market Share Comparison by Country (2016-2032)
- Table 65: Eastern Europe Cosmeceuticals Market Share Comparison by Type (2016-2032)
- Table 66: Eastern Europe Cosmeceuticals Market Share Comparison by Injectable (2016-2032)
- Table 67: Eastern Europe Cosmeceuticals Market Share Comparison by Distribution Channel (2016-2032)
- Table 68: APAC Cosmeceuticals Market Comparison by Type (2016-2032)
- Table 69: APAC Cosmeceuticals Market Comparison by Injectable (2016-2032)
- Table 70: APAC Cosmeceuticals Market Comparison by Distribution Channel (2016-2032)
- Table 71: APAC Cosmeceuticals Market Revenue (US$ Mn) Comparison by Country (2016-2032)
- Table 72: APAC Cosmeceuticals Market Revenue (US$ Mn) (2016-2032)
- Table 73: APAC Cosmeceuticals Market Revenue (US$ Mn) Comparison by Country (2016-2032)
- Table 74: APAC Cosmeceuticals Market Revenue (US$ Mn) Comparison by Type (2016-2032)
- Table 75: APAC Cosmeceuticals Market Revenue (US$ Mn) Comparison by Injectable (2016-2032)
- Table 76: APAC Cosmeceuticals Market Revenue (US$ Mn) Comparison by Distribution Channel (2016-2032)
- Table 77: APAC Cosmeceuticals Market Y-o-Y Growth Rate Comparison by Country (2016-2032)
- Table 78: APAC Cosmeceuticals Market Y-o-Y Growth Rate Comparison by Type (2016-2032)
- Table 79: APAC Cosmeceuticals Market Y-o-Y Growth Rate Comparison by Injectable (2016-2032)
- Table 80: APAC Cosmeceuticals Market Y-o-Y Growth Rate Comparison by Distribution Channel (2016-2032)
- Table 81: APAC Cosmeceuticals Market Share Comparison by Country (2016-2032)
- Table 82: APAC Cosmeceuticals Market Share Comparison by Type (2016-2032)
- Table 83: APAC Cosmeceuticals Market Share Comparison by Injectable (2016-2032)
- Table 84: APAC Cosmeceuticals Market Share Comparison by Distribution Channel (2016-2032)
- Table 85: Latin America Cosmeceuticals Market Comparison by Type (2016-2032)
- Table 86: Latin America Cosmeceuticals Market Comparison by Injectable (2016-2032)
- Table 87: Latin America Cosmeceuticals Market Comparison by Distribution Channel (2016-2032)
- Table 88: Latin America Cosmeceuticals Market Revenue (US$ Mn) Comparison by Country (2016-2032)
- Table 89: Latin America Cosmeceuticals Market Revenue (US$ Mn) (2016-2032)
- Table 90: Latin America Cosmeceuticals Market Revenue (US$ Mn) Comparison by Country (2016-2032)
- Table 91: Latin America Cosmeceuticals Market Revenue (US$ Mn) Comparison by Type (2016-2032)
- Table 92: Latin America Cosmeceuticals Market Revenue (US$ Mn) Comparison by Injectable (2016-2032)
- Table 93: Latin America Cosmeceuticals Market Revenue (US$ Mn) Comparison by Distribution Channel (2016-2032)
- Table 94: Latin America Cosmeceuticals Market Y-o-Y Growth Rate Comparison by Country (2016-2032)
- Table 95: Latin America Cosmeceuticals Market Y-o-Y Growth Rate Comparison by Type (2016-2032)
- Table 96: Latin America Cosmeceuticals Market Y-o-Y Growth Rate Comparison by Injectable (2016-2032)
- Table 97: Latin America Cosmeceuticals Market Y-o-Y Growth Rate Comparison by Distribution Channel (2016-2032)
- Table 98: Latin America Cosmeceuticals Market Share Comparison by Country (2016-2032)
- Table 99: Latin America Cosmeceuticals Market Share Comparison by Type (2016-2032)
- Table 100: Latin America Cosmeceuticals Market Share Comparison by Injectable (2016-2032)
- Table 101: Latin America Cosmeceuticals Market Share Comparison by Distribution Channel (2016-2032)
- Table 102: Middle East & Africa Cosmeceuticals Market Comparison by Type (2016-2032)
- Table 103: Middle East & Africa Cosmeceuticals Market Comparison by Injectable (2016-2032)
- Table 104: Middle East & Africa Cosmeceuticals Market Comparison by Distribution Channel (2016-2032)
- Table 105: Middle East & Africa Cosmeceuticals Market Revenue (US$ Mn) Comparison by Country (2016-2032)
- Table 106: Middle East & Africa Cosmeceuticals Market Revenue (US$ Mn) (2016-2032)
- Table 107: Middle East & Africa Cosmeceuticals Market Revenue (US$ Mn) Comparison by Country (2016-2032)
- Table 108: Middle East & Africa Cosmeceuticals Market Revenue (US$ Mn) Comparison by Type (2016-2032)
- Table 109: Middle East & Africa Cosmeceuticals Market Revenue (US$ Mn) Comparison by Injectable (2016-2032)
- Table 110: Middle East & Africa Cosmeceuticals Market Revenue (US$ Mn) Comparison by Distribution Channel (2016-2032)
- Table 111: Middle East & Africa Cosmeceuticals Market Y-o-Y Growth Rate Comparison by Country (2016-2032)
- Table 112: Middle East & Africa Cosmeceuticals Market Y-o-Y Growth Rate Comparison by Type (2016-2032)
- Table 113: Middle East & Africa Cosmeceuticals Market Y-o-Y Growth Rate Comparison by Injectable (2016-2032)
- Table 114: Middle East & Africa Cosmeceuticals Market Y-o-Y Growth Rate Comparison by Distribution Channel (2016-2032)
- Table 115: Middle East & Africa Cosmeceuticals Market Share Comparison by Country (2016-2032)
- Table 116: Middle East & Africa Cosmeceuticals Market Share Comparison by Type (2016-2032)
- Table 117: Middle East & Africa Cosmeceuticals Market Share Comparison by Injectable (2016-2032)
- Table 118: Middle East & Africa Cosmeceuticals Market Share Comparison by Distribution Channel (2016-2032)
- 1. Executive Summary
Inquiry Form
Why Choose Us
- 360 Degree Approach
- Growth Consulting
- 24/7 Research Support
- Comprehensive-Level of Customization
- Competitive Intelligence
- Single-Country/ Region Intelligence
- Post-Sale Service Assistance
- Access to Lead Analysts
- Available in PDF, Excel, Word/ PPT
Request for Customization
OUR CLIENTS
Don't just take our word. We are trusted by these great companies!