
Collagen Supplements Market By Form(Pills & Gummies, Powder, Liquid/Drinks), By Distribution Channel(Pharmacy, Online Store, Specialty Store), By Region And Companies - Industry Segment Outlook, Market Assessment, Competition Scenario, Trends, And Forecast 2024-2033
-
39349
-
April 2024
-
300
-


-
This report was compiled by Shreyas Rokade Shreyas Rokade is a seasoned Research Analyst with CMFE, bringing extensive expertise in market research and consulting, with a strong background in Chemical Engineering. Correspondence Team Lead-CMFE Linkedin | Detailed Market research Methodology Our methodology involves a mix of primary research, including interviews with leading mental health experts, and secondary research from reputable medical journals and databases. View Detailed Methodology Page
-
Quick Navigation
Report Overview
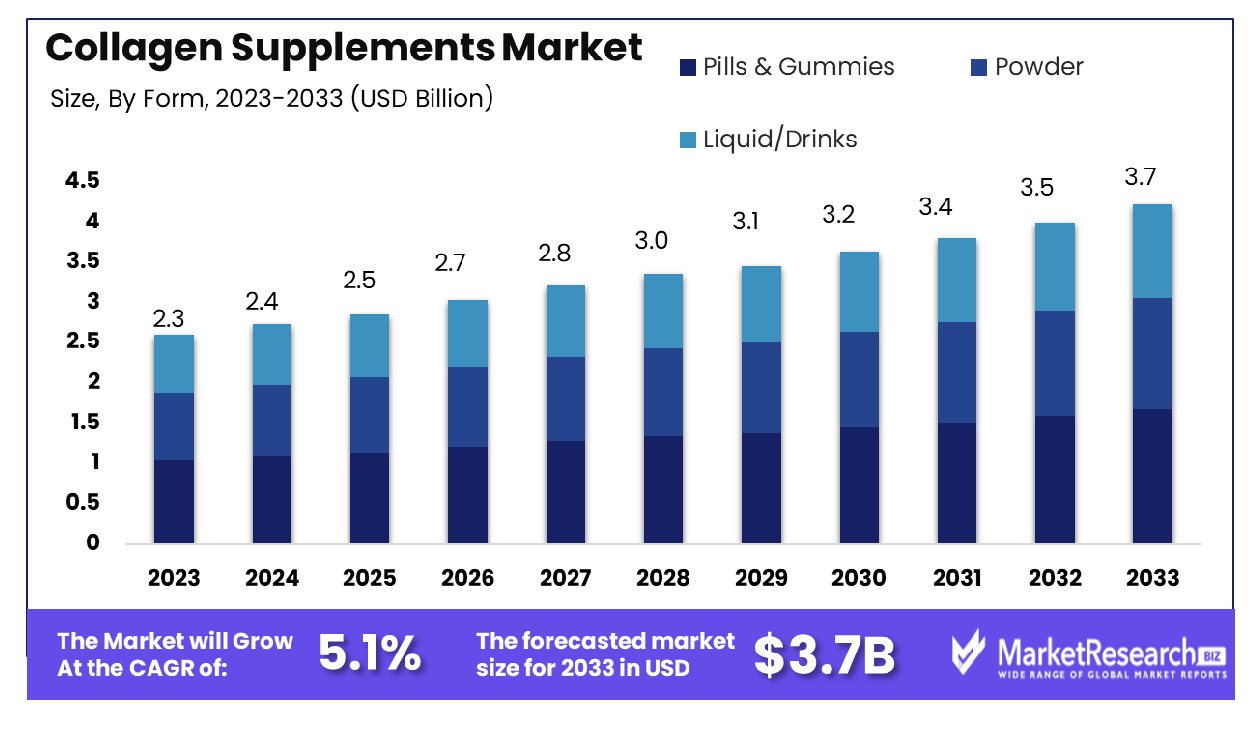
The Global Collagen Supplements Market was valued at USD 2.3 billion in 2023. It is expected to reach USD 3.7 billion by 2033, with a CAGR of 5.1% during the forecast period from 2024 to 2033. The surge in demand for beauty and cosmetic products, and the rise in different types of disease are some of the main key driving factors for collagen supplements.
Collagen supplements are defined as oral and tropical products that contain hydrolyzed collagen peptides derived from animal sources such as bovine, marine, or porcine collagen. These are developed to increase the body’s collagen production, a protein that is important for powders, liquids, and capsules and generally consists of extra ingredients such as vitamins, antioxidants, and minerals to improve collagen synthesis and absorption.
Collagen supplements focus on identifying age-related collagen loss, decreasing wrinkles, supporting joint functions, enhancing skin elasticity, and promoting bone strength. While research on collagen supplements’ efficiency and joint health. Moreover, individual responses may be different, and consultation with a healthcare expert is sagacious before starting any supplement regimen, specifically for those with allergies, sensitivities, and underlying health situations.
According to Nutraceuticals World in November 2023, highlights that Designs for Health, a well-known dietary supplements brand in the healthcare practitioner channel launched two collagen powders, Whole Beauty collagen, and Collagen + MCT. Collagen makes up around 30% of the body’s protein and 75% of the skin’s structure but Design for Health manufactures its new product which is less of it as we age making supplementation vital to help the body restructure the collagen that it depends on. Moreover, Boots declared the launch of 45 wellness supplements and vitamins, including Samantha Faiers’ brand, Revive Collagen, and Professor Green’s brand, Aguulp.
Sales for the Vitamins and beauty supplements at Boots have surged within the last 6 months. With vitamin sales growing by 43% since August 2021, the health and beauty retailer is responding to ongoing consumer demand and provides the largest range of health and wellness products in the UK. Beauty supplement sales also saw a 37% increase and, with online searches for collagen on Boots.com up by 156% in 2021 compared to 2020. Revive Collagen is the new transformation anti-ageing skincare brand which is the latest wellness brand to hit Boots shelves in almost 1,000 stores across the UK, as well as on Boots.com.
The recent benefit of collagen supplements comprises potential advantages for skin elasticity, hydration, and decreasing wrinkles by supporting the new growing research. They may also help in joint health and bone strength. Enhanced formulations and absorption techniques improve their efficiency by providing easy options for individuals seeking to support whole health and wellness. The demand for collagen supplements will increase due to their requirements in beauty sectors which will help in market expansion in the coming years.
Key Takeaways
- Market Growth: Global Collagen Supplements Market was valued at USD 2.3 billion in 2023. It is expected to reach USD 3.7 billion by 2033, with a CAGR of 5.1% during the forecast period from 2024 to 2033.
- By Form: The market is predominantly dominated by pills and gummies, accounting for 60.3% of sales.
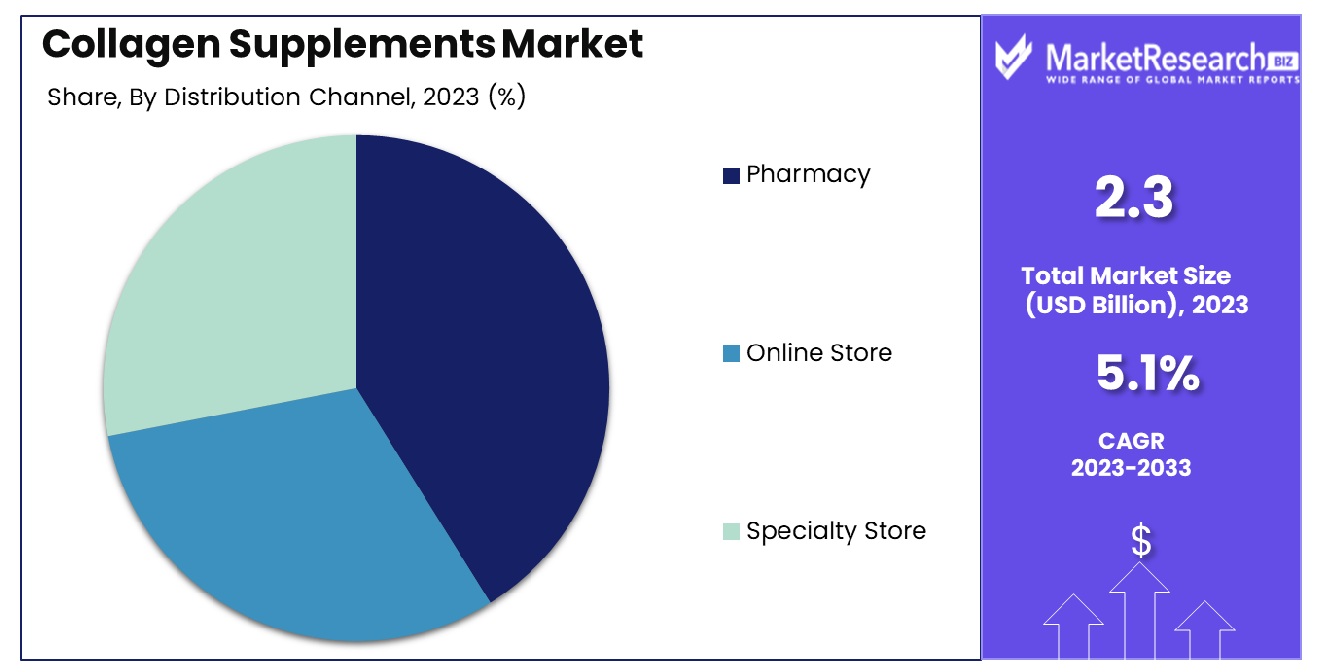
- By Distribution Channel: Pharmacy channels hold a significant share at 75.8%, showcasing strong dominance.
- Regional Dominance: In North America, the collagen supplements market accounts for an impressive 30.3% share.
- Growth Opportunity: The global collagen supplements market in 2023 presents opportunities driven by rising consumer awareness of skin health benefits, expansion into new demographics, and innovative product formulations enhancing efficacy.
Driving factors
Increased Import Demand and Growing Middle-Class Population Fueling Market Expansion
The Collagen Supplements Market experiences robust growth propelled by increased import demand and the expanding middle-class population worldwide. As disposable incomes rise, particularly in emerging economies, consumers have greater purchasing power, facilitating the acquisition of collagen supplements. This trend is evident in regions like Asia-Pacific, where a burgeoning middle class seeks health and wellness products.
Statistics indicate a notable surge in collagen supplement imports, with a significant portion directed towards catering to this demographic segment. The combination of heightened import activity and the burgeoning middle-class population synergistically drives market expansion, fostering an environment conducive to sustained growth and market penetration.
Consumer Shift Towards Preventive Healthcare Approaches Boosting Collagen Supplement Sales
A discernible shift in consumer behavior towards preventive healthcare strategies has significantly boosted collagen supplement sales. Increasingly, individuals are adopting proactive measures to maintain their health and well-being, aligning with the notion that prevention is better than cure. Collagen supplements, renowned for their purported benefits in promoting skin elasticity, joint health, and overall vitality, are experiencing heightened demand amidst this trend.
Consumers are proactively seeking products that offer preventive health benefits, driving the uptake of collagen supplements across diverse demographic segments. This paradigm shift underscores the market's growth trajectory, with projections indicating sustained upward momentum as preventive healthcare gains prominence globally.
Rising Health Consciousness and Emphasis on Leading a Healthy Lifestyle Driving Market Growth
The Collagen Supplements Market is buoyed by a pervasive trend towards heightened health consciousness and a steadfast emphasis on leading a healthy lifestyle. As individuals become increasingly cognizant of the profound impact of lifestyle choices on their well-being, there is a growing inclination towards incorporating health-enhancing products into daily routines. Collagen supplements, revered for their purported efficacy in supporting various facets of health, have emerged as a cornerstone of this burgeoning health-conscious movement.
Consumers, driven by a desire to optimize their health and vitality, are turning to collagen supplements as integral components of their wellness regimens. This heightened health consciousness permeates various demographic segments, fostering a conducive environment for market growth and innovation. As such, the market is poised to capitalize on this prevailing trend, with sustained growth projected as health-conscious consumers continue to prioritize products that align with their wellness objectives.
Restraining Factors
Lack of Long-term Clinical Studies on Efficacy Hindering Market Growth
The Collagen Supplements Market faces challenges due to the lack of comprehensive long-term clinical studies on efficacy, impeding its growth potential. While anecdotal evidence and short-term studies suggest the benefits of collagen supplementation for skin health, joint function, and overall well-being, the absence of robust, longitudinal research poses a barrier to market expansion. Potential consumers, particularly those discerning individuals who prioritize evidence-based approaches to health, may exhibit reluctance to embrace collagen supplements without concrete scientific validation of their long-term efficacy and safety.
This dearth of conclusive research undermines consumer confidence and inhibits widespread adoption, thereby limiting the market's growth potential. Addressing this constraint necessitates concerted efforts within the scientific community to conduct rigorous, longitudinal studies that elucidate the sustained effects of collagen supplementation on various health parameters, thereby fostering trust and bolstering market expansion.
Allergic Reactions Pose a Challenge to Market Penetration
The Collagen Supplements Market encounters resistance due to reports of allergic reactions in some individuals, posing a challenge to market penetration. While collagen supplements are generally well-tolerated by the majority of consumers, isolated cases of allergic reactions serve as deterrents to widespread adoption. Allergic responses, ranging from mild skin irritations to more severe manifestations, can dissuade potential consumers from incorporating collagen supplements into their wellness routines, thereby impeding market growth.
Addressing this concern requires proactive measures, including stringent quality control measures, transparent labeling practices, and comprehensive allergen testing protocols. By ensuring product safety and transparency, market stakeholders can mitigate apprehensions surrounding allergic reactions and cultivate consumer trust, thereby facilitating market expansion despite this inherent restraint. Moreover, educational initiatives aimed at raising awareness about potential allergenic risks and proper usage guidelines can empower consumers to make informed decisions, fostering a conducive environment for market growth despite this prevailing challenge.
By Form Analysis
In the natural products market, pills and gummies dominate sales at 60.3%.
In 2023, Pills & Gummies held a dominant market position in the By Form segment of the Collagen Supplements Market, capturing more than a 60.3% share. The robust performance of Pills & Gummies can be attributed to several factors, including their convenience, ease of consumption, and the growing consumer preference for ingestible collagen formats. With consumers increasingly prioritizing health and wellness, Pills & Gummies have emerged as a favored choice due to their portability and hassle-free intake.
Following Pills & Gummies, the Powder segment also demonstrated substantial growth, constituting a significant portion of the market share. Powdered collagen supplements appeal to consumers seeking versatility and customization in their supplementation routine. The ability to mix powders into various beverages and foods allows for seamless integration into daily diets, catering to diverse consumer preferences and lifestyles.
Moreover, the Liquid/Drinks segment witnessed notable traction in the Collagen Supplements Market, albeit with a comparatively smaller market share. Liquid collagen supplements offer convenience and quick absorption, making them attractive to consumers seeking immediate results. Additionally, the availability of flavored options and ready-to-drink formulations enhances the appeal of this segment, particularly among younger demographics and on-the-go consumers.
By Distribution Channel Analysis
Pharmacy channels hold a significant share, comprising 75.8% of distribution channels.
In 2023, Pharmacy held a dominant market position in the By Distribution Channel segment of the Collagen Supplements Market, capturing more than a 75.8% share. The significant market share of Pharmacy can be attributed to its widespread accessibility, established consumer trust, and the professional guidance offered by pharmacists. With consumers increasingly turning to trusted healthcare professionals for advice on dietary supplements, pharmacies have emerged as preferred destinations for collagen supplementation.
Following Pharmacy, the Online Store segment also demonstrated notable growth, constituting a substantial portion of the market share. The rise of e-commerce platforms has facilitated convenient access to a wide range of collagen supplements, offering consumers the flexibility to browse and purchase products from the comfort of their homes. Online stores provide a diverse selection of collagen supplements, catering to varied consumer preferences and requirements, while also enabling seamless delivery options.
Additionally, the Specialty Store segment witnessed traction in the Collagen Supplements Market, albeit with a relatively smaller market share compared to Pharmacy and Online Stores. Specialty stores, including health food stores and wellness boutiques, offer curated selections of premium collagen supplements, targeting health-conscious consumers seeking specialized products and personalized shopping experiences.
Key Market Segments
By Form
- Pills & Gummies
- Powder
- Liquid/Drinks
By Distribution Channel
- Pharmacy
- Online Store
- Specialty Store
Growth Opportunity
Rising Consumer Awareness Drives Market Growth
The global collagen supplements market is poised for significant expansion in 2023, largely fueled by rising consumer awareness about the manifold benefits of collagen for skin health and anti-aging. With an increasing emphasis on personal wellness and appearance, consumers are actively seeking products that offer tangible improvements in skin elasticity, hydration, and overall appearance. This heightened awareness is driving demand for collagen supplements, creating lucrative opportunities for market players to capitalize on.
Expansion into New Demographics Spurs Market Penetration
In addition to the traditional consumer base of individuals seeking skin rejuvenation, the collagen supplements market is experiencing a notable expansion into new demographics such as athletes and fitness enthusiasts. Recognizing the role of collagen in promoting joint health and muscle recovery, this demographic segment is increasingly incorporating collagen supplements into their wellness routines. This trend presents a promising avenue for market growth, as it broadens the consumer base and diversifies revenue streams for industry players.
Innovation in Product Formulations Drives Competitive Advantage
To maintain a competitive edge in the market, industry players are focusing on innovation in product formulations aimed at enhancing efficacy and absorption. By leveraging advancements in scientific research and technology, companies are developing novel formulations that offer improved bioavailability and targeted delivery of collagen molecules. These innovative products not only enhance consumer satisfaction but also differentiate brands in a crowded market landscape, fostering customer loyalty and market success.
Latest Trends
Increasing Consumer Awareness Shapes Market Dynamics
In 2023, the global collagen supplements market is witnessing a notable surge in consumer awareness regarding the myriad benefits of collagen for skin health and aging. This heightened awareness stems from growing interest in personal wellness and beauty, as consumers seek effective solutions to enhance their overall appearance and vitality.
With a plethora of information available through various media channels, consumers are becoming increasingly educated about the role of collagen in promoting skin elasticity, hydration, and anti-aging effects. As a result, demand for collagen supplements is on the rise, propelling market growth and fostering opportunities for industry players to capitalize on this trend.
Rising Demand for Natural and Functional Supplements Drives Market Expansion
Another prominent trend shaping the global collagen supplements market in 2023 is the escalating demand for natural and functional food supplements. As consumers become more health-conscious and discerning about the products they consume, there is a growing preference for supplements derived from natural sources and formulated with functional ingredients. Collagen supplements, in particular, are experiencing heightened demand due to their perceived health benefits and association with natural ingredients.
Consumers are increasingly gravitating towards products that offer not only nutritional supplement value but also specific functional benefits, such as improved skin health and anti-aging effects. This trend is driving market expansion as manufacturers respond to consumer preferences by introducing innovative collagen supplements formulated with natural, bioactive ingredients. In conclusion, the global collagen supplements market in 2023 is characterized by increasing consumer awareness of collagen's benefits and rising demand for natural and functional supplements, signaling significant opportunities for market growth and innovation.
Regional Analysis
In North America, the collagen supplements market is expected to grow by 30.3% in 2023.
The collagen supplements market exhibits a diverse landscape across different regions, with North America, Europe, Asia Pacific, Middle East & Africa, and Latin America emerging as key geographical segments. In North America, the market is characterized by robust growth, accounting for a substantial share of 30.3%. This dominance can be attributed to several factors, including the increasing consumer awareness regarding the benefits of collagen supplements in promoting skin health, joint function, and overall well-being. Moreover, the region's well-established healthcare infrastructure and rising disposable incomes further propel market growth.
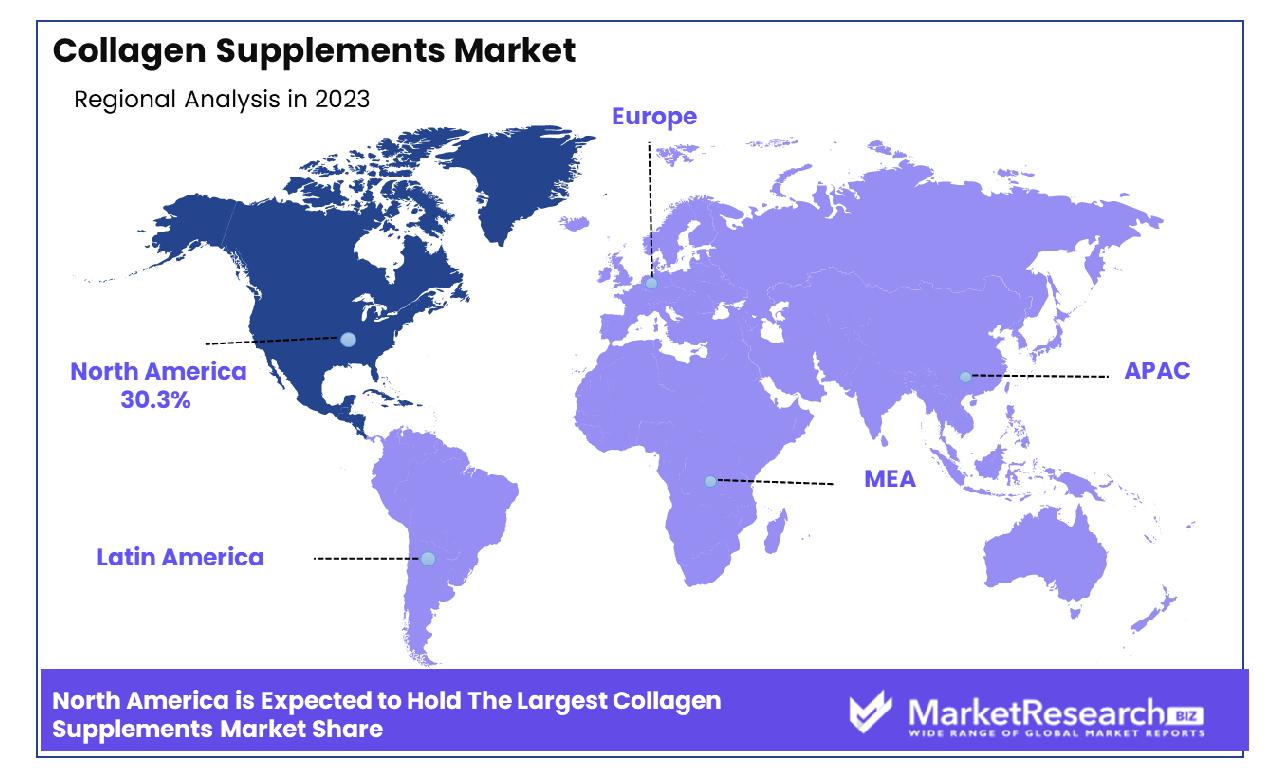
In Europe, the collagen supplements market is experiencing steady expansion, driven by a growing aging population seeking preventive healthcare solutions. The region boasts a sophisticated consumer base keen on adopting natural and organic products, thus fostering the demand for collagen supplements. Additionally, stringent regulatory frameworks ensure product quality and safety, enhancing consumer confidence and market penetration.
Asia Pacific emerges as a burgeoning market for collagen supplements, fueled by rising health consciousness among consumers and the growing trend towards preventive healthcare practices. Countries such as Japan and South Korea exhibit significant demand, driven by a culture deeply rooted in beauty and wellness traditions. Furthermore, increasing urbanization, changing lifestyles, and expanding distribution channels contribute to the market's growth trajectory in the region.
In the Middle East & Africa and Latin America, the collagen supplements market shows promising growth prospects, albeit at a comparatively slower pace. Factors such as rising disposable incomes, evolving consumer preferences toward natural products, and expanding retail networks are expected to drive market expansion in these regions.
Key Regions and Countries
North America
- The US
- Canada
- Rest of North America
Europe
- Germany
- France
- The UK
- Spain
- Netherlands
- Russia
- Italy
- Rest of Europe
Asia-Pacific
- China
- Japan
- Singapore
- Thailand
- South Korea
- Vietnam
- India
- New Zealand
- Rest of Asia Pacific
Latin America
- Mexico
- Brazil
- Rest of Latin America
Middle East & Africa
- Saudi Arabia
- South Africa
- UAE
- Rest of the Middle East & Africa
Key Players Analysis
In the dynamic landscape of the global Collagen Supplements Market in 2023, several key players have emerged as frontrunners, each contributing to the market's growth and evolution. Among these notable companies are Optimum Nutrition, Inc., BioTechUSA, TCI CO., LTD, Further Food, Vital Proteins LLC, Hunter & Gather, Shiseido Co. Ltd, The Clorox Company, THE BOUNTIFUL COMPANY, Codeage LLC, and Everest NeoCell LLC.
These companies play a pivotal role in shaping the competitive landscape of the collagen supplements market through innovative product offerings, strategic partnerships, and robust marketing strategies. Optimum Nutrition, Inc., for instance, leverages its strong brand presence and commitment to quality to capture market share. BioTechUSA's focus on research and development ensures cutting-edge formulations that resonate with consumers seeking effective collagen solutions.
Moreover, companies like Vital Proteins LLC and THE BOUNTIFUL COMPANY capitalize on the growing consumer demand for natural and organic products, aligning their offerings with the trend toward clean-label supplements. Meanwhile, Shiseido Co. Ltd, a renowned player in the beauty and skincare industry, diversifies its portfolio by tapping into the collagen supplements market, leveraging its expertise in collagen-based skincare products to appeal to health-conscious consumers.
TCI CO., LTD, Further Food, and Codeage LLC are also significant contributors, catering to niche segments with specialized products and targeting specific consumer demographics. As the market continues to expand, these key players are expected to maintain their competitive edge through continuous innovation, strategic expansion into emerging markets, and a deep understanding of evolving consumer preferences.
Market Key Players
- Optimum Nutrition, Inc
- BioTechUSA
- TCI CO., LTD
- Further Food
- Vital Proteins LLC
- Hunter & Gather
- Shiseido Co. Ltd
- The Clorox Company
- THE BOUNTIFUL COMPANY.
- Codeage LLC
- Everest NeoCell LLC
Recent Development
- In March 2024, Bioiberica's Daniel Martínez-Puig explores parallels between collagen and omega-3 markets, highlighting the need for differentiation, scientific substantiation, and standardized regulations to fuel collagen's growth and innovation potential.
- In March 2024, Bioiberica examines collagen and omega-3 markets, emphasizing differentiation, scientific support, and regulations to spur collagen's growth.
- In March 2024, Tezman Holding's subsidiary, Sel Sanayi, pioneers Collasel in the hydrolyzed collagen market, introducing innovative collagen tripeptides and setting new industry standards for quality and innovation.
Report Scope
Report Features Description Market Value (2023) USD 2.3 Billion Forecast Revenue (2033) USD 3.7 Billion CAGR (2024-2032) 5.1% Base Year for Estimation 2023 Historic Period 2016-2023 Forecast Period 2024-2033 Report Coverage Revenue Forecast, Market Dynamics, COVID-19 Impact, Competitive Landscape, Recent Developments Segments Covered By Form(Pills & Gummies, Powder, Liquid/Drinks), By Distribution Channel(Pharmacy, Online Store, Specialty Store) Regional Analysis North America - The US, Canada, Rest of North America, Europe - Germany, France, The UK, Spain, Italy, Russia, Netherlands, Rest of Europe, Asia-Pacific - China, Japan, South Korea, India, New Zealand, Singapore, Thailand, Vietnam, Rest of Asia Pacific, Latin America - Brazil, Mexico, Rest of Latin America, Middle East & Africa - South Africa, Saudi Arabia, UAE, Rest of Middle East & Africa Competitive Landscape Optimum Nutrition, Inc, BioTechUSA, TCI CO., LTD, Further Food, Vital Proteins LLC, Hunter & Gather, Shiseido Co. Ltd, The Clorox Company, THE BOUNTIFUL COMPANY., Codeage LLC, Everest NeoCell LLC Customization Scope Customization for segments, region/country-level will be provided. Moreover, additional customization can be done based on the requirements. Purchase Options We have three licenses to opt for Single User License, Multi-User License (Up to 5 Users), Corporate Use License (Unlimited User and Printable PDF) -
- 1. Executive Summary
- 1.1. Definition
- 1.2. Taxonomy
- 1.3. Research Scope
- 1.4. Key Analysis
- 1.5. Key Findings by Major Segments
- 1.6. Top strategies by Major Players
- 2. Global Collagen Supplements Marke Overview
- 2.1. Collagen Supplements Marke Dynamics
- 2.1.1. Drivers
- 2.1.2. Opportunities
- 2.1.3. Restraints
- 2.1.4. Challenges
- 2.2. Macro-economic Factors
- 2.3. Regulatory Framework
- 2.4. Market Investment Feasibility Index
- 2.5. PEST Analysis
- 2.6. PORTER’S Five Force Analysis
- 2.7. Drivers & Restraints Impact Analysis
- 2.8. Industry Chain Analysis
- 2.9. Cost Structure Analysis
- 2.10. Marketing Strategy
- 2.11. Russia-Ukraine War Impact Analysis
- 2.12. Opportunity Map Analysis
- 2.13. Market Competition Scenario Analysis
- 2.14. Product Life Cycle Analysis
- 2.15. Opportunity Orbits
- 2.16. Manufacturer Intensity Map
- 2.17. Major Companies sales by Value & Volume
- 2.1. Collagen Supplements Marke Dynamics
- 3. Global Collagen Supplements Marke Analysis, Opportunity and Forecast, 2016-2032
- 3.1. Global Collagen Supplements Marke Analysis, 2016-2021
- 3.2. Global Collagen Supplements Marke Opportunity and Forecast, 2023-2032
- 3.3. Global Collagen Supplements Marke Analysis, Opportunity and Forecast, By By Form, 2016-2032
- 3.3.1. Global Collagen Supplements Marke Analysis by By Form: Introduction
- 3.3.2. Market Size Absolute $ Opportunity Analysis and Forecast, By By Form, 2016-2032
- 3.3.3. Pills & Gummies
- 3.3.4. Powder
- 3.3.5. Liquid/Drinks
- 3.4. Global Collagen Supplements Marke Analysis, Opportunity and Forecast, By By Distribution Channel , 2016-2032
- 3.4.1. Global Collagen Supplements Marke Analysis by By Distribution Channel : Introduction
- 3.4.2. Market Size Absolute $ Opportunity Analysis and Forecast, By By Distribution Channel , 2016-2032
- 3.4.3. Pharmacy
- 3.4.4. Online Store
- 3.4.5. Specialty Store
- 4. North America Collagen Supplements Marke Analysis, Opportunity and Forecast, 2016-2032
- 4.1. North America Collagen Supplements Marke Analysis, 2016-2021
- 4.2. North America Collagen Supplements Marke Opportunity and Forecast, 2023-2032
- 4.3. North America Collagen Supplements Marke Analysis, Opportunity and Forecast, By By Form, 2016-2032
- 4.3.1. North America Collagen Supplements Marke Analysis by By Form: Introduction
- 4.3.2. Market Size Absolute $ Opportunity Analysis and Forecast, By By Form, 2016-2032
- 4.3.3. Pills & Gummies
- 4.3.4. Powder
- 4.3.5. Liquid/Drinks
- 4.4. North America Collagen Supplements Marke Analysis, Opportunity and Forecast, By By Distribution Channel , 2016-2032
- 4.4.1. North America Collagen Supplements Marke Analysis by By Distribution Channel : Introduction
- 4.4.2. Market Size Absolute $ Opportunity Analysis and Forecast, By By Distribution Channel , 2016-2032
- 4.4.3. Pharmacy
- 4.4.4. Online Store
- 4.4.5. Specialty Store
- 4.5. North America Collagen Supplements Marke Analysis, Opportunity and Forecast, By Country , 2016-2032
- 4.5.1. North America Collagen Supplements Marke Analysis by Country : Introduction
- 4.5.2. Market Size Absolute $ Opportunity Analysis and Forecast, Country , 2016-2032
- 4.5.2.1. The US
- 4.5.2.2. Canada
- 4.5.2.3. Mexico
- 5. Western Europe Collagen Supplements Marke Analysis, Opportunity and Forecast, 2016-2032
- 5.1. Western Europe Collagen Supplements Marke Analysis, 2016-2021
- 5.2. Western Europe Collagen Supplements Marke Opportunity and Forecast, 2023-2032
- 5.3. Western Europe Collagen Supplements Marke Analysis, Opportunity and Forecast, By By Form, 2016-2032
- 5.3.1. Western Europe Collagen Supplements Marke Analysis by By Form: Introduction
- 5.3.2. Market Size Absolute $ Opportunity Analysis and Forecast, By By Form, 2016-2032
- 5.3.3. Pills & Gummies
- 5.3.4. Powder
- 5.3.5. Liquid/Drinks
- 5.4. Western Europe Collagen Supplements Marke Analysis, Opportunity and Forecast, By By Distribution Channel , 2016-2032
- 5.4.1. Western Europe Collagen Supplements Marke Analysis by By Distribution Channel : Introduction
- 5.4.2. Market Size Absolute $ Opportunity Analysis and Forecast, By By Distribution Channel , 2016-2032
- 5.4.3. Pharmacy
- 5.4.4. Online Store
- 5.4.5. Specialty Store
- 5.5. Western Europe Collagen Supplements Marke Analysis, Opportunity and Forecast, By Country , 2016-2032
- 5.5.1. Western Europe Collagen Supplements Marke Analysis by Country : Introduction
- 5.5.2. Market Size Absolute $ Opportunity Analysis and Forecast, Country , 2016-2032
- 5.5.2.1. Germany
- 5.5.2.2. France
- 5.5.2.3. The UK
- 5.5.2.4. Spain
- 5.5.2.5. Italy
- 5.5.2.6. Portugal
- 5.5.2.7. Ireland
- 5.5.2.8. Austria
- 5.5.2.9. Switzerland
- 5.5.2.10. Benelux
- 5.5.2.11. Nordic
- 5.5.2.12. Rest of Western Europe
- 6. Eastern Europe Collagen Supplements Marke Analysis, Opportunity and Forecast, 2016-2032
- 6.1. Eastern Europe Collagen Supplements Marke Analysis, 2016-2021
- 6.2. Eastern Europe Collagen Supplements Marke Opportunity and Forecast, 2023-2032
- 6.3. Eastern Europe Collagen Supplements Marke Analysis, Opportunity and Forecast, By By Form, 2016-2032
- 6.3.1. Eastern Europe Collagen Supplements Marke Analysis by By Form: Introduction
- 6.3.2. Market Size Absolute $ Opportunity Analysis and Forecast, By By Form, 2016-2032
- 6.3.3. Pills & Gummies
- 6.3.4. Powder
- 6.3.5. Liquid/Drinks
- 6.4. Eastern Europe Collagen Supplements Marke Analysis, Opportunity and Forecast, By By Distribution Channel , 2016-2032
- 6.4.1. Eastern Europe Collagen Supplements Marke Analysis by By Distribution Channel : Introduction
- 6.4.2. Market Size Absolute $ Opportunity Analysis and Forecast, By By Distribution Channel , 2016-2032
- 6.4.3. Pharmacy
- 6.4.4. Online Store
- 6.4.5. Specialty Store
- 6.5. Eastern Europe Collagen Supplements Marke Analysis, Opportunity and Forecast, By Country , 2016-2032
- 6.5.1. Eastern Europe Collagen Supplements Marke Analysis by Country : Introduction
- 6.5.2. Market Size Absolute $ Opportunity Analysis and Forecast, Country , 2016-2032
- 6.5.2.1. Russia
- 6.5.2.2. Poland
- 6.5.2.3. The Czech Republic
- 6.5.2.4. Greece
- 6.5.2.5. Rest of Eastern Europe
- 7. APAC Collagen Supplements Marke Analysis, Opportunity and Forecast, 2016-2032
- 7.1. APAC Collagen Supplements Marke Analysis, 2016-2021
- 7.2. APAC Collagen Supplements Marke Opportunity and Forecast, 2023-2032
- 7.3. APAC Collagen Supplements Marke Analysis, Opportunity and Forecast, By By Form, 2016-2032
- 7.3.1. APAC Collagen Supplements Marke Analysis by By Form: Introduction
- 7.3.2. Market Size Absolute $ Opportunity Analysis and Forecast, By By Form, 2016-2032
- 7.3.3. Pills & Gummies
- 7.3.4. Powder
- 7.3.5. Liquid/Drinks
- 7.4. APAC Collagen Supplements Marke Analysis, Opportunity and Forecast, By By Distribution Channel , 2016-2032
- 7.4.1. APAC Collagen Supplements Marke Analysis by By Distribution Channel : Introduction
- 7.4.2. Market Size Absolute $ Opportunity Analysis and Forecast, By By Distribution Channel , 2016-2032
- 7.4.3. Pharmacy
- 7.4.4. Online Store
- 7.4.5. Specialty Store
- 7.5. APAC Collagen Supplements Marke Analysis, Opportunity and Forecast, By Country , 2016-2032
- 7.5.1. APAC Collagen Supplements Marke Analysis by Country : Introduction
- 7.5.2. Market Size Absolute $ Opportunity Analysis and Forecast, Country , 2016-2032
- 7.5.2.1. China
- 7.5.2.2. Japan
- 7.5.2.3. South Korea
- 7.5.2.4. India
- 7.5.2.5. Australia & New Zeland
- 7.5.2.6. Indonesia
- 7.5.2.7. Malaysia
- 7.5.2.8. Philippines
- 7.5.2.9. Singapore
- 7.5.2.10. Thailand
- 7.5.2.11. Vietnam
- 7.5.2.12. Rest of APAC
- 8. Latin America Collagen Supplements Marke Analysis, Opportunity and Forecast, 2016-2032
- 8.1. Latin America Collagen Supplements Marke Analysis, 2016-2021
- 8.2. Latin America Collagen Supplements Marke Opportunity and Forecast, 2023-2032
- 8.3. Latin America Collagen Supplements Marke Analysis, Opportunity and Forecast, By By Form, 2016-2032
- 8.3.1. Latin America Collagen Supplements Marke Analysis by By Form: Introduction
- 8.3.2. Market Size Absolute $ Opportunity Analysis and Forecast, By By Form, 2016-2032
- 8.3.3. Pills & Gummies
- 8.3.4. Powder
- 8.3.5. Liquid/Drinks
- 8.4. Latin America Collagen Supplements Marke Analysis, Opportunity and Forecast, By By Distribution Channel , 2016-2032
- 8.4.1. Latin America Collagen Supplements Marke Analysis by By Distribution Channel : Introduction
- 8.4.2. Market Size Absolute $ Opportunity Analysis and Forecast, By By Distribution Channel , 2016-2032
- 8.4.3. Pharmacy
- 8.4.4. Online Store
- 8.4.5. Specialty Store
- 8.5. Latin America Collagen Supplements Marke Analysis, Opportunity and Forecast, By Country , 2016-2032
- 8.5.1. Latin America Collagen Supplements Marke Analysis by Country : Introduction
- 8.5.2. Market Size Absolute $ Opportunity Analysis and Forecast, Country , 2016-2032
- 8.5.2.1. Brazil
- 8.5.2.2. Colombia
- 8.5.2.3. Chile
- 8.5.2.4. Argentina
- 8.5.2.5. Costa Rica
- 8.5.2.6. Rest of Latin America
- 9. Middle East & Africa Collagen Supplements Marke Analysis, Opportunity and Forecast, 2016-2032
- 9.1. Middle East & Africa Collagen Supplements Marke Analysis, 2016-2021
- 9.2. Middle East & Africa Collagen Supplements Marke Opportunity and Forecast, 2023-2032
- 9.3. Middle East & Africa Collagen Supplements Marke Analysis, Opportunity and Forecast, By By Form, 2016-2032
- 9.3.1. Middle East & Africa Collagen Supplements Marke Analysis by By Form: Introduction
- 9.3.2. Market Size Absolute $ Opportunity Analysis and Forecast, By By Form, 2016-2032
- 9.3.3. Pills & Gummies
- 9.3.4. Powder
- 9.3.5. Liquid/Drinks
- 9.4. Middle East & Africa Collagen Supplements Marke Analysis, Opportunity and Forecast, By By Distribution Channel , 2016-2032
- 9.4.1. Middle East & Africa Collagen Supplements Marke Analysis by By Distribution Channel : Introduction
- 9.4.2. Market Size Absolute $ Opportunity Analysis and Forecast, By By Distribution Channel , 2016-2032
- 9.4.3. Pharmacy
- 9.4.4. Online Store
- 9.4.5. Specialty Store
- 9.5. Middle East & Africa Collagen Supplements Marke Analysis, Opportunity and Forecast, By Country , 2016-2032
- 9.5.1. Middle East & Africa Collagen Supplements Marke Analysis by Country : Introduction
- 9.5.2. Market Size Absolute $ Opportunity Analysis and Forecast, Country , 2016-2032
- 9.5.2.1. Algeria
- 9.5.2.2. Egypt
- 9.5.2.3. Israel
- 9.5.2.4. Kuwait
- 9.5.2.5. Nigeria
- 9.5.2.6. Saudi Arabia
- 9.5.2.7. South Africa
- 9.5.2.8. Turkey
- 9.5.2.9. The UAE
- 9.5.2.10. Rest of MEA
- 10. Global Collagen Supplements Marke Analysis, Opportunity and Forecast, By Region , 2016-2032
- 10.1. Global Collagen Supplements Marke Analysis by Region : Introduction
- 10.2. Market Size Absolute $ Opportunity Analysis and Forecast, By Region , 2016-2032
- 10.2.1. North America
- 10.2.2. Western Europe
- 10.2.3. Eastern Europe
- 10.2.4. APAC
- 10.2.5. Latin America
- 10.2.6. Middle East & Africa
- 11. Global Collagen Supplements Marke Competitive Landscape, Market Share Analysis, and Company Profiles
- 11.1. Market Share Analysis
- 11.2. Company Profiles
- 11.3. Optimum Nutrition, Inc
- 11.3.1. Company Overview
- 11.3.2. Financial Highlights
- 11.3.3. Product Portfolio
- 11.3.4. SWOT Analysis
- 11.3.5. Key Strategies and Developments
- 11.4. BioTechUSA
- 11.4.1. Company Overview
- 11.4.2. Financial Highlights
- 11.4.3. Product Portfolio
- 11.4.4. SWOT Analysis
- 11.4.5. Key Strategies and Developments
- 11.5. TCI CO., LTD
- 11.5.1. Company Overview
- 11.5.2. Financial Highlights
- 11.5.3. Product Portfolio
- 11.5.4. SWOT Analysis
- 11.5.5. Key Strategies and Developments
- 11.6. Further Food
- 11.6.1. Company Overview
- 11.6.2. Financial Highlights
- 11.6.3. Product Portfolio
- 11.6.4. SWOT Analysis
- 11.6.5. Key Strategies and Developments
- 11.7. Vital Proteins LLC
- 11.7.1. Company Overview
- 11.7.2. Financial Highlights
- 11.7.3. Product Portfolio
- 11.7.4. SWOT Analysis
- 11.7.5. Key Strategies and Developments
- 11.8. Hunter & Gather
- 11.8.1. Company Overview
- 11.8.2. Financial Highlights
- 11.8.3. Product Portfolio
- 11.8.4. SWOT Analysis
- 11.8.5. Key Strategies and Developments
- 11.9. Shiseido Co. Ltd
- 11.9.1. Company Overview
- 11.9.2. Financial Highlights
- 11.9.3. Product Portfolio
- 11.9.4. SWOT Analysis
- 11.9.5. Key Strategies and Developments
- 11.10. The Clorox Company
- 11.10.1. Company Overview
- 11.10.2. Financial Highlights
- 11.10.3. Product Portfolio
- 11.10.4. SWOT Analysis
- 11.10.5. Key Strategies and Developments
- 11.11. THE BOUNTIFUL COMPANY.
- 11.11.1. Company Overview
- 11.11.2. Financial Highlights
- 11.11.3. Product Portfolio
- 11.11.4. SWOT Analysis
- 11.11.5. Key Strategies and Developments
- 11.12. Codeage LLC
- 11.12.1. Company Overview
- 11.12.2. Financial Highlights
- 11.12.3. Product Portfolio
- 11.12.4. SWOT Analysis
- 11.12.5. Key Strategies and Developments
- 11.13.1. Company Overview
- 11.13.2. Financial Highlights
- 11.13.3. Product Portfolio
- 11.13.4. SWOT Analysis
- 11.13.5. Key Strategies and Developments
- 11.14. Everest NeoCell LLC
- 11.14.1. Company Overview
- 11.14.2. Financial Highlights
- 11.14.3. Product Portfolio
- 11.14.4. SWOT Analysis
- 11.14.5. Key Strategies and Developments
- 12. Assumptions and Acronyms
- 13. Research Methodology
- 14. Contact
"
- List of Figures
- "
- Figure 1: Global Collagen Supplements Marke Revenue (US$ Mn) Market Share by By Form in 2022
- Figure 2: Global Collagen Supplements Marke Market Attractiveness Analysis by By Form, 2016-2032
- Figure 3: Global Collagen Supplements Marke Revenue (US$ Mn) Market Share by By Distribution Channel in 2022
- Figure 4: Global Collagen Supplements Marke Market Attractiveness Analysis by By Distribution Channel , 2016-2032
- Figure 5: Global Collagen Supplements Marke Revenue (US$ Mn) Market Share by Region in 2022
- Figure 6: Global Collagen Supplements Marke Market Attractiveness Analysis by Region, 2016-2032
- Figure 7: Global Collagen Supplements Marke Market Revenue (US$ Mn) (2016-2032)
- Figure 8: Global Collagen Supplements Marke Market Revenue (US$ Mn) Comparison by Region (2016-2032)
- Figure 9: Global Collagen Supplements Marke Market Revenue (US$ Mn) Comparison by By Form (2016-2032)
- Figure 10: Global Collagen Supplements Marke Market Revenue (US$ Mn) Comparison by By Distribution Channel (2016-2032)
- Figure 11: Global Collagen Supplements Marke Market Y-o-Y Growth Rate Comparison by Region (2016-2032)
- Figure 12: Global Collagen Supplements Marke Market Y-o-Y Growth Rate Comparison by By Form (2016-2032)
- Figure 13: Global Collagen Supplements Marke Market Y-o-Y Growth Rate Comparison by By Distribution Channel (2016-2032)
- Figure 14: Global Collagen Supplements Marke Market Share Comparison by Region (2016-2032)
- Figure 15: Global Collagen Supplements Marke Market Share Comparison by By Form (2016-2032)
- Figure 16: Global Collagen Supplements Marke Market Share Comparison by By Distribution Channel (2016-2032)
- Figure 17: North America Collagen Supplements Marke Revenue (US$ Mn) Market Share by By Formin 2022
- Figure 18: North America Collagen Supplements Marke Market Attractiveness Analysis by By Form, 2016-2032
- Figure 19: North America Collagen Supplements Marke Revenue (US$ Mn) Market Share by By Distribution Channel in 2022
- Figure 20: North America Collagen Supplements Marke Market Attractiveness Analysis by By Distribution Channel , 2016-2032
- Figure 21: North America Collagen Supplements Marke Revenue (US$ Mn) Market Share by Country in 2022
- Figure 22: North America Collagen Supplements Marke Market Attractiveness Analysis by Country, 2016-2032
- Figure 23: North America Collagen Supplements Marke Market Revenue (US$ Mn) (2016-2032)
- Figure 24: North America Collagen Supplements Marke Market Revenue (US$ Mn) Comparison by Country (2016-2032)
- Figure 25: North America Collagen Supplements Marke Market Revenue (US$ Mn) Comparison by By Form (2016-2032)
- Figure 26: North America Collagen Supplements Marke Market Revenue (US$ Mn) Comparison by By Distribution Channel (2016-2032)
- Figure 27: North America Collagen Supplements Marke Market Y-o-Y Growth Rate Comparison by Country (2016-2032)
- Figure 28: North America Collagen Supplements Marke Market Y-o-Y Growth Rate Comparison by By Form (2016-2032)
- Figure 29: North America Collagen Supplements Marke Market Y-o-Y Growth Rate Comparison by By Distribution Channel (2016-2032)
- Figure 30: North America Collagen Supplements Marke Market Share Comparison by Country (2016-2032)
- Figure 31: North America Collagen Supplements Marke Market Share Comparison by By Form (2016-2032)
- Figure 32: North America Collagen Supplements Marke Market Share Comparison by By Distribution Channel (2016-2032)
- Figure 33: Western Europe Collagen Supplements Marke Revenue (US$ Mn) Market Share by By Formin 2022
- Figure 34: Western Europe Collagen Supplements Marke Market Attractiveness Analysis by By Form, 2016-2032
- Figure 35: Western Europe Collagen Supplements Marke Revenue (US$ Mn) Market Share by By Distribution Channel in 2022
- Figure 36: Western Europe Collagen Supplements Marke Market Attractiveness Analysis by By Distribution Channel , 2016-2032
- Figure 37: Western Europe Collagen Supplements Marke Revenue (US$ Mn) Market Share by Country in 2022
- Figure 38: Western Europe Collagen Supplements Marke Market Attractiveness Analysis by Country, 2016-2032
- Figure 39: Western Europe Collagen Supplements Marke Market Revenue (US$ Mn) (2016-2032)
- Figure 40: Western Europe Collagen Supplements Marke Market Revenue (US$ Mn) Comparison by Country (2016-2032)
- Figure 41: Western Europe Collagen Supplements Marke Market Revenue (US$ Mn) Comparison by By Form (2016-2032)
- Figure 42: Western Europe Collagen Supplements Marke Market Revenue (US$ Mn) Comparison by By Distribution Channel (2016-2032)
- Figure 43: Western Europe Collagen Supplements Marke Market Y-o-Y Growth Rate Comparison by Country (2016-2032)
- Figure 44: Western Europe Collagen Supplements Marke Market Y-o-Y Growth Rate Comparison by By Form (2016-2032)
- Figure 45: Western Europe Collagen Supplements Marke Market Y-o-Y Growth Rate Comparison by By Distribution Channel (2016-2032)
- Figure 46: Western Europe Collagen Supplements Marke Market Share Comparison by Country (2016-2032)
- Figure 47: Western Europe Collagen Supplements Marke Market Share Comparison by By Form (2016-2032)
- Figure 48: Western Europe Collagen Supplements Marke Market Share Comparison by By Distribution Channel (2016-2032)
- Figure 49: Eastern Europe Collagen Supplements Marke Revenue (US$ Mn) Market Share by By Formin 2022
- Figure 50: Eastern Europe Collagen Supplements Marke Market Attractiveness Analysis by By Form, 2016-2032
- Figure 51: Eastern Europe Collagen Supplements Marke Revenue (US$ Mn) Market Share by By Distribution Channel in 2022
- Figure 52: Eastern Europe Collagen Supplements Marke Market Attractiveness Analysis by By Distribution Channel , 2016-2032
- Figure 53: Eastern Europe Collagen Supplements Marke Revenue (US$ Mn) Market Share by Country in 2022
- Figure 54: Eastern Europe Collagen Supplements Marke Market Attractiveness Analysis by Country, 2016-2032
- Figure 55: Eastern Europe Collagen Supplements Marke Market Revenue (US$ Mn) (2016-2032)
- Figure 56: Eastern Europe Collagen Supplements Marke Market Revenue (US$ Mn) Comparison by Country (2016-2032)
- Figure 57: Eastern Europe Collagen Supplements Marke Market Revenue (US$ Mn) Comparison by By Form (2016-2032)
- Figure 58: Eastern Europe Collagen Supplements Marke Market Revenue (US$ Mn) Comparison by By Distribution Channel (2016-2032)
- Figure 59: Eastern Europe Collagen Supplements Marke Market Y-o-Y Growth Rate Comparison by Country (2016-2032)
- Figure 60: Eastern Europe Collagen Supplements Marke Market Y-o-Y Growth Rate Comparison by By Form (2016-2032)
- Figure 61: Eastern Europe Collagen Supplements Marke Market Y-o-Y Growth Rate Comparison by By Distribution Channel (2016-2032)
- Figure 62: Eastern Europe Collagen Supplements Marke Market Share Comparison by Country (2016-2032)
- Figure 63: Eastern Europe Collagen Supplements Marke Market Share Comparison by By Form (2016-2032)
- Figure 64: Eastern Europe Collagen Supplements Marke Market Share Comparison by By Distribution Channel (2016-2032)
- Figure 65: APAC Collagen Supplements Marke Revenue (US$ Mn) Market Share by By Formin 2022
- Figure 66: APAC Collagen Supplements Marke Market Attractiveness Analysis by By Form, 2016-2032
- Figure 67: APAC Collagen Supplements Marke Revenue (US$ Mn) Market Share by By Distribution Channel in 2022
- Figure 68: APAC Collagen Supplements Marke Market Attractiveness Analysis by By Distribution Channel , 2016-2032
- Figure 69: APAC Collagen Supplements Marke Revenue (US$ Mn) Market Share by Country in 2022
- Figure 70: APAC Collagen Supplements Marke Market Attractiveness Analysis by Country, 2016-2032
- Figure 71: APAC Collagen Supplements Marke Market Revenue (US$ Mn) (2016-2032)
- Figure 72: APAC Collagen Supplements Marke Market Revenue (US$ Mn) Comparison by Country (2016-2032)
- Figure 73: APAC Collagen Supplements Marke Market Revenue (US$ Mn) Comparison by By Form (2016-2032)
- Figure 74: APAC Collagen Supplements Marke Market Revenue (US$ Mn) Comparison by By Distribution Channel (2016-2032)
- Figure 75: APAC Collagen Supplements Marke Market Y-o-Y Growth Rate Comparison by Country (2016-2032)
- Figure 76: APAC Collagen Supplements Marke Market Y-o-Y Growth Rate Comparison by By Form (2016-2032)
- Figure 77: APAC Collagen Supplements Marke Market Y-o-Y Growth Rate Comparison by By Distribution Channel (2016-2032)
- Figure 78: APAC Collagen Supplements Marke Market Share Comparison by Country (2016-2032)
- Figure 79: APAC Collagen Supplements Marke Market Share Comparison by By Form (2016-2032)
- Figure 80: APAC Collagen Supplements Marke Market Share Comparison by By Distribution Channel (2016-2032)
- Figure 81: Latin America Collagen Supplements Marke Revenue (US$ Mn) Market Share by By Formin 2022
- Figure 82: Latin America Collagen Supplements Marke Market Attractiveness Analysis by By Form, 2016-2032
- Figure 83: Latin America Collagen Supplements Marke Revenue (US$ Mn) Market Share by By Distribution Channel in 2022
- Figure 84: Latin America Collagen Supplements Marke Market Attractiveness Analysis by By Distribution Channel , 2016-2032
- Figure 85: Latin America Collagen Supplements Marke Revenue (US$ Mn) Market Share by Country in 2022
- Figure 86: Latin America Collagen Supplements Marke Market Attractiveness Analysis by Country, 2016-2032
- Figure 87: Latin America Collagen Supplements Marke Market Revenue (US$ Mn) (2016-2032)
- Figure 88: Latin America Collagen Supplements Marke Market Revenue (US$ Mn) Comparison by Country (2016-2032)
- Figure 89: Latin America Collagen Supplements Marke Market Revenue (US$ Mn) Comparison by By Form (2016-2032)
- Figure 90: Latin America Collagen Supplements Marke Market Revenue (US$ Mn) Comparison by By Distribution Channel (2016-2032)
- Figure 91: Latin America Collagen Supplements Marke Market Y-o-Y Growth Rate Comparison by Country (2016-2032)
- Figure 92: Latin America Collagen Supplements Marke Market Y-o-Y Growth Rate Comparison by By Form (2016-2032)
- Figure 93: Latin America Collagen Supplements Marke Market Y-o-Y Growth Rate Comparison by By Distribution Channel (2016-2032)
- Figure 94: Latin America Collagen Supplements Marke Market Share Comparison by Country (2016-2032)
- Figure 95: Latin America Collagen Supplements Marke Market Share Comparison by By Form (2016-2032)
- Figure 96: Latin America Collagen Supplements Marke Market Share Comparison by By Distribution Channel (2016-2032)
- Figure 97: Middle East & Africa Collagen Supplements Marke Revenue (US$ Mn) Market Share by By Formin 2022
- Figure 98: Middle East & Africa Collagen Supplements Marke Market Attractiveness Analysis by By Form, 2016-2032
- Figure 99: Middle East & Africa Collagen Supplements Marke Revenue (US$ Mn) Market Share by By Distribution Channel in 2022
- Figure 100: Middle East & Africa Collagen Supplements Marke Market Attractiveness Analysis by By Distribution Channel , 2016-2032
- Figure 101: Middle East & Africa Collagen Supplements Marke Revenue (US$ Mn) Market Share by Country in 2022
- Figure 102: Middle East & Africa Collagen Supplements Marke Market Attractiveness Analysis by Country, 2016-2032
- Figure 103: Middle East & Africa Collagen Supplements Marke Market Revenue (US$ Mn) (2016-2032)
- Figure 104: Middle East & Africa Collagen Supplements Marke Market Revenue (US$ Mn) Comparison by Country (2016-2032)
- Figure 105: Middle East & Africa Collagen Supplements Marke Market Revenue (US$ Mn) Comparison by By Form (2016-2032)
- Figure 106: Middle East & Africa Collagen Supplements Marke Market Revenue (US$ Mn) Comparison by By Distribution Channel (2016-2032)
- Figure 107: Middle East & Africa Collagen Supplements Marke Market Y-o-Y Growth Rate Comparison by Country (2016-2032)
- Figure 108: Middle East & Africa Collagen Supplements Marke Market Y-o-Y Growth Rate Comparison by By Form (2016-2032)
- Figure 109: Middle East & Africa Collagen Supplements Marke Market Y-o-Y Growth Rate Comparison by By Distribution Channel (2016-2032)
- Figure 110: Middle East & Africa Collagen Supplements Marke Market Share Comparison by Country (2016-2032)
- Figure 111: Middle East & Africa Collagen Supplements Marke Market Share Comparison by By Form (2016-2032)
- Figure 112: Middle East & Africa Collagen Supplements Marke Market Share Comparison by By Distribution Channel (2016-2032)
"
- List of Tables
- "
- Table 1: Global Collagen Supplements Marke Market Comparison by By Form (2016-2032)
- Table 2: Global Collagen Supplements Marke Market Comparison by By Distribution Channel (2016-2032)
- Table 3: Global Collagen Supplements Marke Revenue (US$ Mn) Comparison by Region (2016-2032)
- Table 4: Global Collagen Supplements Marke Market Revenue (US$ Mn) (2016-2032)
- Table 5: Global Collagen Supplements Marke Market Revenue (US$ Mn) Comparison by Region (2016-2032)
- Table 6: Global Collagen Supplements Marke Market Revenue (US$ Mn) Comparison by By Form (2016-2032)
- Table 7: Global Collagen Supplements Marke Market Revenue (US$ Mn) Comparison by By Distribution Channel (2016-2032)
- Table 8: Global Collagen Supplements Marke Market Y-o-Y Growth Rate Comparison by Region (2016-2032)
- Table 9: Global Collagen Supplements Marke Market Y-o-Y Growth Rate Comparison by By Form (2016-2032)
- Table 10: Global Collagen Supplements Marke Market Y-o-Y Growth Rate Comparison by By Distribution Channel (2016-2032)
- Table 11: Global Collagen Supplements Marke Market Share Comparison by Region (2016-2032)
- Table 12: Global Collagen Supplements Marke Market Share Comparison by By Form (2016-2032)
- Table 13: Global Collagen Supplements Marke Market Share Comparison by By Distribution Channel (2016-2032)
- Table 14: North America Collagen Supplements Marke Market Comparison by By Distribution Channel (2016-2032)
- Table 15: North America Collagen Supplements Marke Revenue (US$ Mn) Comparison by Country (2016-2032)
- Table 16: North America Collagen Supplements Marke Market Revenue (US$ Mn) (2016-2032)
- Table 17: North America Collagen Supplements Marke Market Revenue (US$ Mn) Comparison by Country (2016-2032)
- Table 18: North America Collagen Supplements Marke Market Revenue (US$ Mn) Comparison by By Form (2016-2032)
- Table 19: North America Collagen Supplements Marke Market Revenue (US$ Mn) Comparison by By Distribution Channel (2016-2032)
- Table 20: North America Collagen Supplements Marke Market Y-o-Y Growth Rate Comparison by Country (2016-2032)
- Table 21: North America Collagen Supplements Marke Market Y-o-Y Growth Rate Comparison by By Form (2016-2032)
- Table 22: North America Collagen Supplements Marke Market Y-o-Y Growth Rate Comparison by By Distribution Channel (2016-2032)
- Table 23: North America Collagen Supplements Marke Market Share Comparison by Country (2016-2032)
- Table 24: North America Collagen Supplements Marke Market Share Comparison by By Form (2016-2032)
- Table 25: North America Collagen Supplements Marke Market Share Comparison by By Distribution Channel (2016-2032)
- Table 26: Western Europe Collagen Supplements Marke Market Comparison by By Form (2016-2032)
- Table 27: Western Europe Collagen Supplements Marke Market Comparison by By Distribution Channel (2016-2032)
- Table 28: Western Europe Collagen Supplements Marke Revenue (US$ Mn) Comparison by Country (2016-2032)
- Table 29: Western Europe Collagen Supplements Marke Market Revenue (US$ Mn) (2016-2032)
- Table 30: Western Europe Collagen Supplements Marke Market Revenue (US$ Mn) Comparison by Country (2016-2032)
- Table 31: Western Europe Collagen Supplements Marke Market Revenue (US$ Mn) Comparison by By Form (2016-2032)
- Table 32: Western Europe Collagen Supplements Marke Market Revenue (US$ Mn) Comparison by By Distribution Channel (2016-2032)
- Table 33: Western Europe Collagen Supplements Marke Market Y-o-Y Growth Rate Comparison by Country (2016-2032)
- Table 34: Western Europe Collagen Supplements Marke Market Y-o-Y Growth Rate Comparison by By Form (2016-2032)
- Table 35: Western Europe Collagen Supplements Marke Market Y-o-Y Growth Rate Comparison by By Distribution Channel (2016-2032)
- Table 36: Western Europe Collagen Supplements Marke Market Share Comparison by Country (2016-2032)
- Table 37: Western Europe Collagen Supplements Marke Market Share Comparison by By Form (2016-2032)
- Table 38: Western Europe Collagen Supplements Marke Market Share Comparison by By Distribution Channel (2016-2032)
- Table 39: Eastern Europe Collagen Supplements Marke Market Comparison by By Form (2016-2032)
- Table 40: Eastern Europe Collagen Supplements Marke Market Comparison by By Distribution Channel (2016-2032)
- Table 41: Eastern Europe Collagen Supplements Marke Revenue (US$ Mn) Comparison by Country (2016-2032)
- Table 42: Eastern Europe Collagen Supplements Marke Market Revenue (US$ Mn) (2016-2032)
- Table 43: Eastern Europe Collagen Supplements Marke Market Revenue (US$ Mn) Comparison by Country (2016-2032)
- Table 44: Eastern Europe Collagen Supplements Marke Market Revenue (US$ Mn) Comparison by By Form (2016-2032)
- Table 45: Eastern Europe Collagen Supplements Marke Market Revenue (US$ Mn) Comparison by By Distribution Channel (2016-2032)
- Table 46: Eastern Europe Collagen Supplements Marke Market Y-o-Y Growth Rate Comparison by Country (2016-2032)
- Table 47: Eastern Europe Collagen Supplements Marke Market Y-o-Y Growth Rate Comparison by By Form (2016-2032)
- Table 48: Eastern Europe Collagen Supplements Marke Market Y-o-Y Growth Rate Comparison by By Distribution Channel (2016-2032)
- Table 49: Eastern Europe Collagen Supplements Marke Market Share Comparison by Country (2016-2032)
- Table 50: Eastern Europe Collagen Supplements Marke Market Share Comparison by By Form (2016-2032)
- Table 51: Eastern Europe Collagen Supplements Marke Market Share Comparison by By Distribution Channel (2016-2032)
- Table 52: APAC Collagen Supplements Marke Market Comparison by By Form (2016-2032)
- Table 53: APAC Collagen Supplements Marke Market Comparison by By Distribution Channel (2016-2032)
- Table 54: APAC Collagen Supplements Marke Revenue (US$ Mn) Comparison by Country (2016-2032)
- Table 55: APAC Collagen Supplements Marke Market Revenue (US$ Mn) (2016-2032)
- Table 56: APAC Collagen Supplements Marke Market Revenue (US$ Mn) Comparison by Country (2016-2032)
- Table 57: APAC Collagen Supplements Marke Market Revenue (US$ Mn) Comparison by By Form (2016-2032)
- Table 58: APAC Collagen Supplements Marke Market Revenue (US$ Mn) Comparison by By Distribution Channel (2016-2032)
- Table 59: APAC Collagen Supplements Marke Market Y-o-Y Growth Rate Comparison by Country (2016-2032)
- Table 60: APAC Collagen Supplements Marke Market Y-o-Y Growth Rate Comparison by By Form (2016-2032)
- Table 61: APAC Collagen Supplements Marke Market Y-o-Y Growth Rate Comparison by By Distribution Channel (2016-2032)
- Table 62: APAC Collagen Supplements Marke Market Share Comparison by Country (2016-2032)
- Table 63: APAC Collagen Supplements Marke Market Share Comparison by By Form (2016-2032)
- Table 64: APAC Collagen Supplements Marke Market Share Comparison by By Distribution Channel (2016-2032)
- Table 65: Latin America Collagen Supplements Marke Market Comparison by By Form (2016-2032)
- Table 66: Latin America Collagen Supplements Marke Market Comparison by By Distribution Channel (2016-2032)
- Table 67: Latin America Collagen Supplements Marke Revenue (US$ Mn) Comparison by Country (2016-2032)
- Table 68: Latin America Collagen Supplements Marke Market Revenue (US$ Mn) (2016-2032)
- Table 69: Latin America Collagen Supplements Marke Market Revenue (US$ Mn) Comparison by Country (2016-2032)
- Table 70: Latin America Collagen Supplements Marke Market Revenue (US$ Mn) Comparison by By Form (2016-2032)
- Table 71: Latin America Collagen Supplements Marke Market Revenue (US$ Mn) Comparison by By Distribution Channel (2016-2032)
- Table 72: Latin America Collagen Supplements Marke Market Y-o-Y Growth Rate Comparison by Country (2016-2032)
- Table 73: Latin America Collagen Supplements Marke Market Y-o-Y Growth Rate Comparison by By Form (2016-2032)
- Table 74: Latin America Collagen Supplements Marke Market Y-o-Y Growth Rate Comparison by By Distribution Channel (2016-2032)
- Table 75: Latin America Collagen Supplements Marke Market Share Comparison by Country (2016-2032)
- Table 76: Latin America Collagen Supplements Marke Market Share Comparison by By Form (2016-2032)
- Table 77: Latin America Collagen Supplements Marke Market Share Comparison by By Distribution Channel (2016-2032)
- Table 78: Middle East & Africa Collagen Supplements Marke Market Comparison by By Form (2016-2032)
- Table 79: Middle East & Africa Collagen Supplements Marke Market Comparison by By Distribution Channel (2016-2032)
- Table 80: Middle East & Africa Collagen Supplements Marke Revenue (US$ Mn) Comparison by Country (2016-2032)
- Table 81: Middle East & Africa Collagen Supplements Marke Market Revenue (US$ Mn) (2016-2032)
- Table 82: Middle East & Africa Collagen Supplements Marke Market Revenue (US$ Mn) Comparison by Country (2016-2032)
- Table 83: Middle East & Africa Collagen Supplements Marke Market Revenue (US$ Mn) Comparison by By Form (2016-2032)
- Table 84: Middle East & Africa Collagen Supplements Marke Market Revenue (US$ Mn) Comparison by By Distribution Channel (2016-2032)
- Table 85: Middle East & Africa Collagen Supplements Marke Market Y-o-Y Growth Rate Comparison by Country (2016-2032)
- Table 86: Middle East & Africa Collagen Supplements Marke Market Y-o-Y Growth Rate Comparison by By Form (2016-2032)
- Table 87: Middle East & Africa Collagen Supplements Marke Market Y-o-Y Growth Rate Comparison by By Distribution Channel (2016-2032)
- Table 88: Middle East & Africa Collagen Supplements Marke Market Share Comparison by Country (2016-2032)
- Table 89: Middle East & Africa Collagen Supplements Marke Market Share Comparison by By Form (2016-2032)
- Table 90: Middle East & Africa Collagen Supplements Marke Market Share Comparison by By Distribution Channel (2016-2032)
- 1. Executive Summary
-
- Optimum Nutrition, Inc
- BioTechUSA
- TCI CO., LTD
- Further Food
- Vital Proteins LLC
- Hunter & Gather
- Shiseido Co. Ltd
- The Clorox Company
- THE BOUNTIFUL COMPANY.
- Codeage LLC
- Everest NeoCell LLC
Our Clients


View Our Licence Options
