
Global Collagen Market By Product (Gelatin, Hydrolyzed Collagen, and Other), By Form (Powder, Liquid, and Capsule), By Source (Bovine, Porcine, Marine, and Poultry), By Application (Food & Beverages, Health Care, and Other) By Region and Companies - Industry Segment Outlook, Market Assessment, Competition Scenario, Trends, and Forecast 2023-2032
-
4699
-
May 2023
-
170
-


-
This report was compiled by Research Team Research team of over 50 passionate professionals leverages advanced research methodologies and analytical expertise to deliver insightful, data-driven market intelligence that empowers businesses across diverse industries to make strategic, well-informed Correspondence Research Team Linkedin | Detailed Market research Methodology Our methodology involves a mix of primary research, including interviews with leading mental health experts, and secondary research from reputable medical journals and databases. View Detailed Methodology Page
-
Quick Navigation
Report Overview
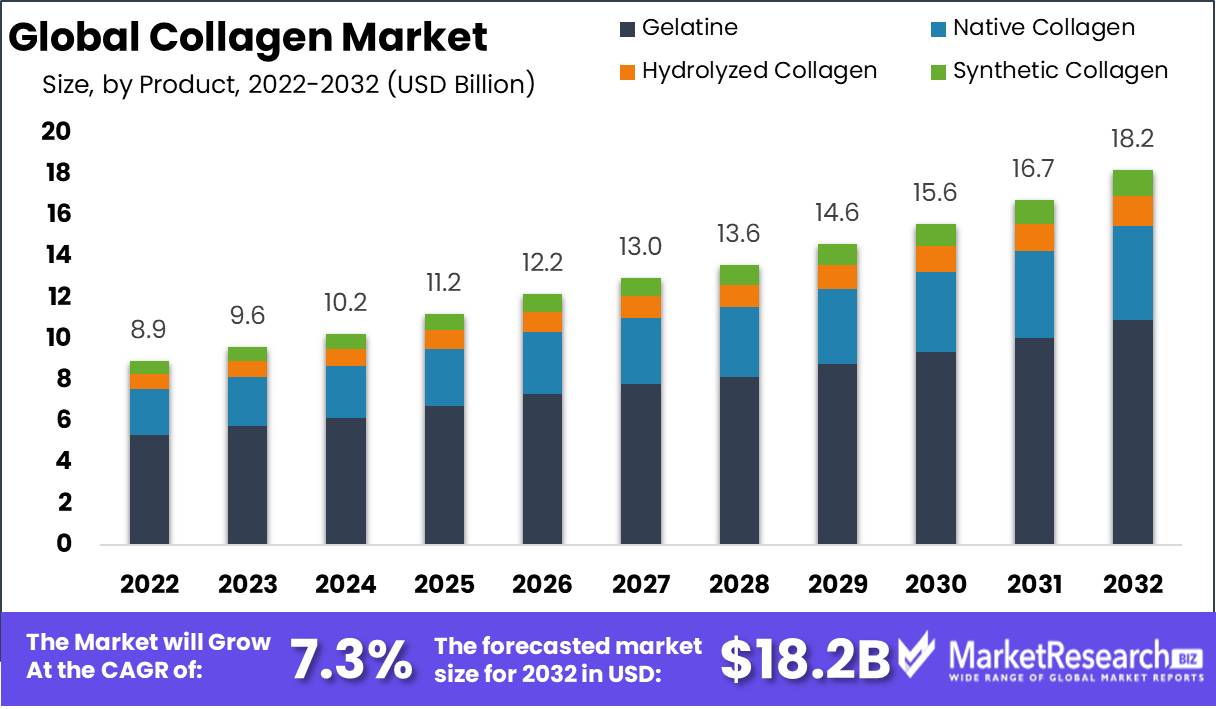
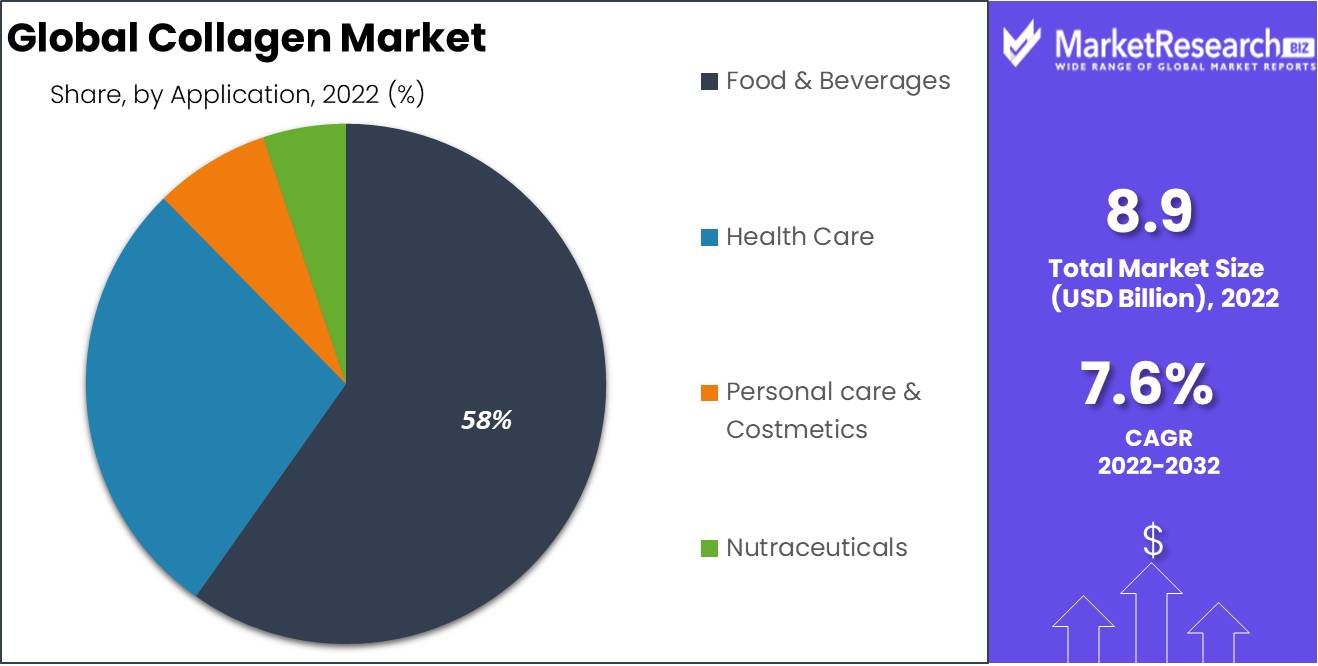
Global Collagen Market size is expected to be worth around USD 18.2 Bn by 2032 from USD 8.9 Bn in 2022, growing at a CAGR of 7.6%. during the forecast period from 2023 to 2032.
Collagen Market is found in muscles, bones, tendons, and skin and is one of the prevalent proteins in the human body. It creates a scaffold that offers support and structure. Exogenous collagen is manufactured and is acquired from many outside sources, whereas endogenous collagen Market is natural collagen produced by the body. The increasing use of collagen in various industries makes consumers more inclined toward eating healthy foods. The primary factors that will assist the market in expanding during the forecast period are the rising demand for materials and collagen-containing products in the healthcare industry.
Product Analysis
The Gelatin Product Category is Dominant Since Gelatin Collagen is an Essential Protein for the Human Body
By product, the Collagen Market has been segmented into gelatin, hydrolyzed collagen, native collagen, and synthetic collagen. In 2022, the gelatin segment held the largest market share among others. Since gelatin collagen is an essential protein for the human body and has numerous health, skin, and nutritional benefits, the food and beverage industry significantly contributes to its demand. Additional sub-categories include dietary supplements, bakery products, sports nutrition, and other food and beverage industry sub-categories. During the forecast period, the overall market is anticipated to be driven by rising health and fitness concerns, consumers’ shift toward high-nutrition products, shifting lifestyles, and acceptance of gelatin in food products.
The rising use of beauty and health supplements is expected to increase hydrolyzed collagen demand. It strengthens joint and bone health, simultaneously enhances the texture and quality of skin, nails, and hair. Additionally, it enhances the protein content of functional food & beverage and sports nutrition products. Native collagen is a type of protein. It aids in reducing marks caused by skin burns and minor wounds and is used in skincare formulations to delay the formation of new wrinkles. It also treats muscle pain, joint pain, and osteoarthritis.
The same enzyme that breaks down natural collagen in the human body can also break down synthetic Collagen Market . There are numerous biomedical applications for which it is useful. Using synthetic collagen rather than natural collagen can help you avoid immune-related issues from using natural collagen from animals such as cows. As a result, the market is expanding due to the demand for goods made from synthetic materials.
Form Analysis
Faster Rate of Absorption Making Liquid Collagen Dominant
Based on form, Collagen Market is segmented into solid, liquid, and capsule forms. Due to product advantages such as the flexibility to achieve appropriate doses, the liquid form of collagen is anticipated to exhibit the fastest CAGR over 2023-2032. Liquid collagen has a smaller molecular structure, is easier to swallow, and ensures a faster absorption rate than solid collagen. Because of these characteristics, absorption is streamlined, and less nutrient loss. Additionally, consumers who prefer not to take pills will be more likely to use liquid Collagen Market products because of their ease of use and availability in ready-to-drink, pre-dosed bottles.
Source Analysis
Abundant Supply of Cattle and Lower Prices Making Bovine Source Segment Dominate
The bovine source segment dominated the market with a 35% revenue share in 2022. The abundant cattle supply and lower prices are reasons for this larger share than in other sources. Over the forecast period, the market growth is anticipated to be boosted by the rising demand for bovine-based products in biomedical applications to treat arthritis, improve skin health, and prevent osteoporosis.
Moreover, it is used on a large scale in cosmetics because it is similar to human collagen and does not cause allergic reactions. It also helps to reduce wrinkles and improve skin elasticity in cosmetics such as creams, face gels, and facemasks. The product is extracted by cutting the porcine skin into small pieces and soaking it in acetic acid for several days. Periorbital reconstruction, Skin tissue engineering, and the treatment of chronic musculoskeletal pain are some of its applications.
Marine collagen is used in various health supplements to treat arthritis, protect the gastrointestinal mucosa, and improve bone health. It is increasingly being used in cosmetics as a natural humectant and moisturizer. Cosmetic formulations containing marine collagen vary in properties, species, configuration structure, and properties, and catching origin. Due to the product's numerous skin benefits, cosmetics manufacturers are now exploring marine-based formulations. Domesticated poultry species such as chickens, turkeys, geese, and ducks are examples of poultry sources. Collagen from poultry comes primarily from chicken. The cartilage, tissues, and bones of chickens are the source of chicken collagen. Immunity increases when arthritis and joint conditions are treated with chicken collagen. The poultry source market is expected to proliferate due to the growing consumption of chicken collagen to treat joint issues.
Application Analysis
The Food and Beverage Sector Dominated the Market with Increased Demand for Functional Foods and Beverages
The food and beverage sector dominated the market with a 58% revenue share in 2022. The Collagen Market increased demand for nutritional supplements, functional foods, and beverages in North America and Europe is a significant factor in dominating the market. Products can benefit from its use to increase their elasticity, consistency, and stability. Utilized as a food-added substance helps in working on the texture, color, and flavor of food items.
Additionally, collagen-infused drinks such as juices, cappuccino, cocoa, and energy drinks frequently incorporate it. The rising demand for materials and collagen-containing products in the healthcare industry will assist the market in expanding during the forecast period. The expansion of the beauty supplements market is credited with increasing consumer awareness of the benefits of collagen.
Key Market Segments
Based on Product
- Gelatin
- Hydrolyzed Collagen
- Native Collagen
- Synthetic Collagen
Based on Form
- Powder
- Liquid
- Capsule
Based on Source
- Bovine
- Porcine
- Marine
- Poultry
Based on Application
- Food & Beverages
- Health Care
- Nutraceuticals
- Other Applications
Market Dynamics
Drivers
Collagen Provides Numerous Advantages to the Food and Beverage Industry
Collagen Market enhances chewiness, texture, and foam stability in confectionery products. Dairy products make use of it as a texturing and stabilizing agent. Additionally, it enhances the nutritional bars' softness and flexibility by serving as a binding agent for the ingredients. The use of collagen in the food industry has increased due to its numerous functions. Additionally, it is used to treat malnutrition and some disorders of digestion and absorption. These factors are expected to propel the collagen market's expansion in terms of value sales.
Increasing use of collagen in the cosmetics & personal care industry
The Collagen Market thickness and strength of collagen fibers in human skin deteriorate, causing the skin to age. For vascular and cardiac reconstruction, bone regeneration, cartilage regeneration, soft skin augmentation, and other purposes, collagen is a nutritional supplement in cosmetic creams. Various soaps, shampoos, body lotions, facial creams, and other cosmetics contain collagen as an ingredient. Products for hair and skin contain a significant amount of hydrolyzed collagen. Hydrolyzed collagen is added to shampoos and shower gels with surfactants and active agents in the personal care industry. Such wide applications are expected to boost the market’s growth further.
Restraints
Cultural Prohibitions on Animal-Sourced Food and Drinks
Social forbiddances on utilizing animal-sourced food and drinks might go about as a limitation to the market development. Moreover, lacking handling advancements in the creating area will also challenge market development.
Lack of Advanced Manufacturing and Marketing Technologies in Developing Nations
Collagen proteins can only be extracted and processed using cutting-edge technology. Filtration and ion exchange are performed on the edible collagen extracted from fish, bovine, and porcine skins. Microfiltration technology is used to filter the fluid through a porous membrane during the process. The next step is heat sterilization, which requires heat treatment at high temperatures.
The product is then dried using spray drying technology. The technologies above are still in their infancy in many parts of the world, particularly in developing nations. Due to a lack of advanced manufacturing and marketing technologies, developing nations with significant demand for protein-based ingredients are lagging.
Opportunity
Market Expansion is Extremely Possible in Emerging Economies
The growth of the collagen market in emerging economies can be attributed to various factors, including adopting different food habits, increasing food product demand for functional ingredients, and increasing industrial activity that necessitates process enhancement. Market stakeholders from various nations have been tirelessly attempting to boost collagen production in response to rising global consumption. Food and beverage manufacturing companies are taking a strategic approach to find lucrative revenue opportunities.
Trends
Eating Healthy Foods Trend is Boosting the Market
The increasing use of collagen in various industries makes consumers more inclined toward eating healthy foods. The primary factors that will assist the market in expanding during the forecast period are the rising demand for materials and collagen-containing products in the healthcare industry.
Regional Analysis
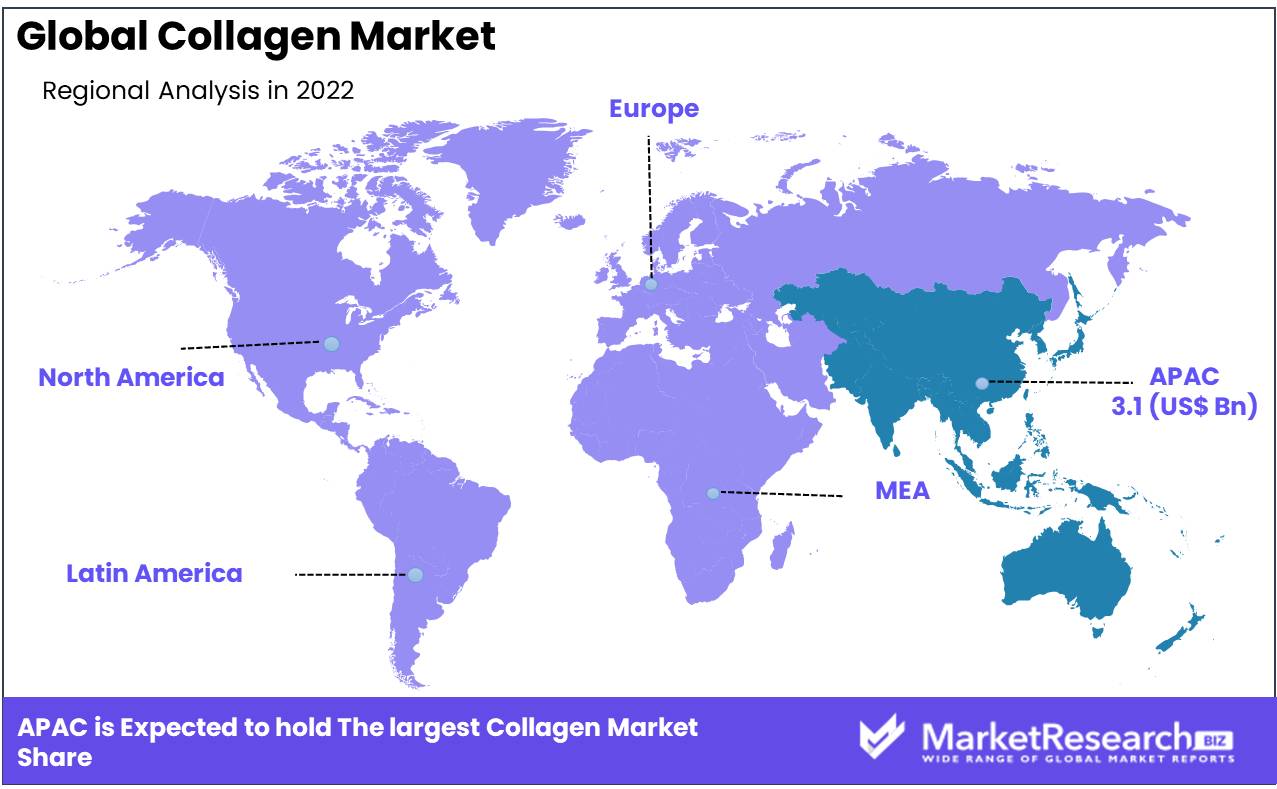
APAC Dominated the Market with Growing Awareness About the Benefits of Collagen
In 2022, the collagen market was dominated by APAC, with the largest market share of 34.3%. The market's expansion is driven by the region's growing geriatric population and awareness of the availability of collagen products there. As the government increases investment to create the meat processing industry in this region, the Asia Pacific region is anticipated to have substantial market expansion. The market for collagen-based products is growing due to investments being made to enhance research and development efforts in the Asia Pacific region.
Collagen Market is used on a large scale in the food and beverages, cosmetic, and healthcare industries. The European market is also anticipated to have robust volume growth. Europe is expected to grow at the fastest CAGR over the forecast period. The existence of candy producers in this area is causing this market to expand. The market is expanding due to rising demand for the move processing sector in the European region and the abundance of slaughterhouses there.
Key Regions
- North America
- The US
- Canada
- Mexico
- Western Europe
- Germany
- France
- The UK
- Spain
- Italy
- Portugal
- Ireland
- Austria
- Switzerland
- Benelux
- Nordic
- Rest of Western Europe
- Eastern Europe
- Russia
- Poland
- The Czech Republic
- Greece
- Rest of Eastern Europe
- APAC
- China
- Japan
- South Korea
- India
- Australia & New Zealand
- Indonesia
- Malaysia
- Philippines
- Singapore
- Thailand
- Vietnam
- Rest of APAC
- Latin America
- Brazil
- Colombia
- Chile
- Argentina
- Costa Rica
- Rest of Latin America
- Middle East & Africa
- Algeria
- Egypt
- Israel
- Kuwait
- Nigeria
- Saudi Arabia
- South Africa
- Turkey
- United Arab Emirates
- Rest of MEA
Key Players Analysis
Emerging key players are focused on various strategic policies to develop their respective businesses in foreign markets. Several collagen market companies are focusing on expanding their R&D facilities and existing operations. Increasing consumer demand for collagen in the food and beverage, cosmetics, and healthcare industries has compelled producers to invest in technology and product development to keep up with customer demand.
Listed below are some of the most prominent Collagen Market players.
Market Key Players
- Rousselot Inc.
- Nitta Gelatin
- Weishardt International
- Gelita AG
- Holista Colltech Ltd.
- Evonik Industries AG
- Lapi Gelatine S.p.a
- Connoils
- Vital Proteins LLC
- Collagen Matrix, Inc.
- Other Key Players
Recent Developments
- Jellice Taiwan introduced META Collagen in July 2022 to broaden its line of products.
- In order to boost sales and expand its share of the Chinese collagen raw materials market, Nippi Japan's subsidiary, in February 2022, signed a cooperation agreement with Infobird Co. Ltd
Report Scope
Report Features Description Market Value (2022) US$ 8.9 Bn Forecast Revenue (2032) US$ 18.2 Bn CAGR (2023-2032) 7.6% Base Year for Estimation 2022 Historic Period 2016-2022 Forecast Period 2023-2032 Report Coverage Revenue Forecast, Market Dynamics, COVID-19 Impact, Competitive Landscape, Recent Developments Segments Covered By Product - Gelatin, Hydrolyzed Collagen, Native Collagen, and Synthetic Collagen; By Form - Powder, Liquid, and Capsule; By Source - Bovine, Porcine, Marine, and Poultry; By Application - Food & Beverages, Health Care, Nutraceuticals, Personal Care & Cosmetics, and Other Application Regional Analysis North America – The US, Canada, & Mexico; Western Europe – Germany, France, The UK, Spain, Italy, Portugal, Ireland, Austria, Switzerland, Benelux, Nordic, & Rest of Western Europe; Eastern Europe – Russia, Poland, The Czech Republic, Greece, & Rest of Eastern Europe; APAC – China, Japan, South Korea, India, Australia & New Zealand, Indonesia, Malaysia, Philippines, Singapore, Thailand, Vietnam, & Rest of APAC; Latin America – Brazil, Colombia, Chile, Argentina, Costa Rica, & Rest of Latin America; Middle East & Africa – Algeria, Egypt, Israel, Kuwait, Nigeria, Saudi Arabia, South Africa, Turkey, United Arab Emirates, & Rest of MEA Competitive Landscape Rousselot Inc., Nitta Gelatin, Weishardt International, Gelita AG, Holista Colltech Ltd., Evonik Industries AG, Lapi Gelatine S.p.a, Connoils, Vital Proteins LLC, Collagen Matrix, Inc., Other Key Players Customization Scope Customization for segments, region/country-level will be provided. Moreover, additional customization can be done based on the requirements. Purchase Options We have three licenses to opt for: Single User License, Multi-User License (Up to 5 Users), Corporate Use License (Unlimited User and Printable PDF) -
- 1. Executive Summary
- 1.1. Definition
- 1.2. Taxonomy
- 1.3. Research Scope
- 1.4. Key Analysis
- 1.5. Key Findings by Major Segments
- 1.6. Top strategies by Major Players
- 2. Global Collagen Market Overview
- 2.1. Collagen Market Dynamics
- 2.1.1. Drivers
- 2.1.2. Opportunities
- 2.1.3. Restraints
- 2.1.4. Challenges
- 2.2. Macro-economic Factors
- 2.3. Regulatory Framework
- 2.4. Market Investment Feasibility Index
- 2.5. PEST Analysis
- 2.6. PORTER’S Five Force Analysis
- 2.7. Drivers & Restraints Impact Analysis
- 2.8. Industry Chain Analysis
- 2.9. Cost Structure Analysis
- 2.10. Marketing Strategy
- 2.11. Russia-Ukraine War Impact Analysis
- 2.12. Opportunity Map Analysis
- 2.13. Market Competition Scenario Analysis
- 2.14. Product Life Cycle Analysis
- 2.15. Opportunity Orbits
- 2.16. Manufacturer Intensity Map
- 2.17. Major Companies sales by Value & Volume
- 2.1. Collagen Market Dynamics
- 3. Global Collagen Market Analysis, Opportunity and Forecast, 2016-2032
- 3.1. Global Collagen Market Analysis, 2016-2021
- 3.2. Global Collagen Market Opportunity and Forecast, 2023-2032
- 3.3. Global Collagen Market Analysis, Opportunity and Forecast, By Product, 2016-2032
- 3.3.1. Global Collagen Market Analysis by Product: Introduction
- 3.3.2. Market Size Absolute $ Opportunity Analysis and Forecast, By Product, 2016-2032
- 3.3.3. Gelatin
- 3.3.4. Hydrolyzed Collagen
- 3.3.5. Native Collagen
- 3.3.6. Synthetic Collagen
- 3.4. Global Collagen Market Analysis, Opportunity and Forecast, By Form, 2016-2032
- 3.4.1. Global Collagen Market Analysis by Form: Introduction
- 3.4.2. Market Size Absolute $ Opportunity Analysis and Forecast, By Form, 2016-2032
- 3.4.3. Powder
- 3.4.4. Liquid
- 3.4.5. Capsule
- 3.5. Global Collagen Market Analysis, Opportunity and Forecast, By Source, 2016-2032
- 3.5.1. Global Collagen Market Analysis by Source: Introduction
- 3.5.2. Market Size Absolute $ Opportunity Analysis and Forecast, By Source, 2016-2032
- 3.5.3. Bovine
- 3.5.4. Porcine
- 3.5.5. Marine
- 3.5.6. Poultry
- 3.6. Global Collagen Market Analysis, Opportunity and Forecast, By Application, 2016-2032
- 3.6.1. Global Collagen Market Analysis by Application: Introduction
- 3.6.2. Market Size Absolute $ Opportunity Analysis and Forecast, By Application, 2016-2032
- 3.6.3. Food & Beverages
- 3.6.4. Health Care
- 3.6.5. Nutraceuticals
- 3.6.6. Other Application
- 4. North America Collagen Market Analysis, Opportunity and Forecast, 2016-2032
- 4.1. North America Collagen Market Analysis, 2016-2021
- 4.2. North America Collagen Market Opportunity and Forecast, 2023-2032
- 4.3. North America Collagen Market Analysis, Opportunity and Forecast, By Product, 2016-2032
- 4.3.1. North America Collagen Market Analysis by Product: Introduction
- 4.3.2. Market Size Absolute $ Opportunity Analysis and Forecast, By Product, 2016-2032
- 4.3.3. Gelatin
- 4.3.4. Hydrolyzed Collagen
- 4.3.5. Native Collagen
- 4.3.6. Synthetic Collagen
- 4.4. North America Collagen Market Analysis, Opportunity and Forecast, By Form, 2016-2032
- 4.4.1. North America Collagen Market Analysis by Form: Introduction
- 4.4.2. Market Size Absolute $ Opportunity Analysis and Forecast, By Form, 2016-2032
- 4.4.3. Powder
- 4.4.4. Liquid
- 4.4.5. Capsule
- 4.5. North America Collagen Market Analysis, Opportunity and Forecast, By Source, 2016-2032
- 4.5.1. North America Collagen Market Analysis by Source: Introduction
- 4.5.2. Market Size Absolute $ Opportunity Analysis and Forecast, By Source, 2016-2032
- 4.5.3. Bovine
- 4.5.4. Porcine
- 4.5.5. Marine
- 4.5.6. Poultry
- 4.6. North America Collagen Market Analysis, Opportunity and Forecast, By Application, 2016-2032
- 4.6.1. North America Collagen Market Analysis by Application: Introduction
- 4.6.2. Market Size Absolute $ Opportunity Analysis and Forecast, By Application, 2016-2032
- 4.6.3. Food & Beverages
- 4.6.4. Health Care
- 4.6.5. Nutraceuticals
- 4.6.6. Other Application
- 4.7. North America Collagen Market Analysis, Opportunity and Forecast, By Country , 2016-2032
- 4.7.1. North America Collagen Market Analysis by Country : Introduction
- 4.7.2. Market Size Absolute $ Opportunity Analysis and Forecast, Country , 2016-2032
- 4.7.2.1. The US
- 4.7.2.2. Canada
- 4.7.2.3. Mexico
- 5. Western Europe Collagen Market Analysis, Opportunity and Forecast, 2016-2032
- 5.1. Western Europe Collagen Market Analysis, 2016-2021
- 5.2. Western Europe Collagen Market Opportunity and Forecast, 2023-2032
- 5.3. Western Europe Collagen Market Analysis, Opportunity and Forecast, By Product, 2016-2032
- 5.3.1. Western Europe Collagen Market Analysis by Product: Introduction
- 5.3.2. Market Size Absolute $ Opportunity Analysis and Forecast, By Product, 2016-2032
- 5.3.3. Gelatin
- 5.3.4. Hydrolyzed Collagen
- 5.3.5. Native Collagen
- 5.3.6. Synthetic Collagen
- 5.4. Western Europe Collagen Market Analysis, Opportunity and Forecast, By Form, 2016-2032
- 5.4.1. Western Europe Collagen Market Analysis by Form: Introduction
- 5.4.2. Market Size Absolute $ Opportunity Analysis and Forecast, By Form, 2016-2032
- 5.4.3. Powder
- 5.4.4. Liquid
- 5.4.5. Capsule
- 5.5. Western Europe Collagen Market Analysis, Opportunity and Forecast, By Source, 2016-2032
- 5.5.1. Western Europe Collagen Market Analysis by Source: Introduction
- 5.5.2. Market Size Absolute $ Opportunity Analysis and Forecast, By Source, 2016-2032
- 5.5.3. Bovine
- 5.5.4. Porcine
- 5.5.5. Marine
- 5.5.6. Poultry
- 5.6. Western Europe Collagen Market Analysis, Opportunity and Forecast, By Application, 2016-2032
- 5.6.1. Western Europe Collagen Market Analysis by Application: Introduction
- 5.6.2. Market Size Absolute $ Opportunity Analysis and Forecast, By Application, 2016-2032
- 5.6.3. Food & Beverages
- 5.6.4. Health Care
- 5.6.5. Nutraceuticals
- 5.6.6. Other Application
- 5.7. Western Europe Collagen Market Analysis, Opportunity and Forecast, By Country , 2016-2032
- 5.7.1. Western Europe Collagen Market Analysis by Country : Introduction
- 5.7.2. Market Size Absolute $ Opportunity Analysis and Forecast, Country , 2016-2032
- 5.7.2.1. Germany
- 5.7.2.2. France
- 5.7.2.3. The UK
- 5.7.2.4. Spain
- 5.7.2.5. Italy
- 5.7.2.6. Portugal
- 5.7.2.7. Ireland
- 5.7.2.8. Austria
- 5.7.2.9. Switzerland
- 5.7.2.10. Benelux
- 5.7.2.11. Nordic
- 5.7.2.12. Rest of Western Europe
- 6. Eastern Europe Collagen Market Analysis, Opportunity and Forecast, 2016-2032
- 6.1. Eastern Europe Collagen Market Analysis, 2016-2021
- 6.2. Eastern Europe Collagen Market Opportunity and Forecast, 2023-2032
- 6.3. Eastern Europe Collagen Market Analysis, Opportunity and Forecast, By Product, 2016-2032
- 6.3.1. Eastern Europe Collagen Market Analysis by Product: Introduction
- 6.3.2. Market Size Absolute $ Opportunity Analysis and Forecast, By Product, 2016-2032
- 6.3.3. Gelatin
- 6.3.4. Hydrolyzed Collagen
- 6.3.5. Native Collagen
- 6.3.6. Synthetic Collagen
- 6.4. Eastern Europe Collagen Market Analysis, Opportunity and Forecast, By Form, 2016-2032
- 6.4.1. Eastern Europe Collagen Market Analysis by Form: Introduction
- 6.4.2. Market Size Absolute $ Opportunity Analysis and Forecast, By Form, 2016-2032
- 6.4.3. Powder
- 6.4.4. Liquid
- 6.4.5. Capsule
- 6.5. Eastern Europe Collagen Market Analysis, Opportunity and Forecast, By Source, 2016-2032
- 6.5.1. Eastern Europe Collagen Market Analysis by Source: Introduction
- 6.5.2. Market Size Absolute $ Opportunity Analysis and Forecast, By Source, 2016-2032
- 6.5.3. Bovine
- 6.5.4. Porcine
- 6.5.5. Marine
- 6.5.6. Poultry
- 6.6. Eastern Europe Collagen Market Analysis, Opportunity and Forecast, By Application, 2016-2032
- 6.6.1. Eastern Europe Collagen Market Analysis by Application: Introduction
- 6.6.2. Market Size Absolute $ Opportunity Analysis and Forecast, By Application, 2016-2032
- 6.6.3. Food & Beverages
- 6.6.4. Health Care
- 6.6.5. Nutraceuticals
- 6.6.6. Other Application
- 6.7. Eastern Europe Collagen Market Analysis, Opportunity and Forecast, By Country , 2016-2032
- 6.7.1. Eastern Europe Collagen Market Analysis by Country : Introduction
- 6.7.2. Market Size Absolute $ Opportunity Analysis and Forecast, Country , 2016-2032
- 6.7.2.1. Russia
- 6.7.2.2. Poland
- 6.7.2.3. The Czech Republic
- 6.7.2.4. Greece
- 6.7.2.5. Rest of Eastern Europe
- 7. APAC Collagen Market Analysis, Opportunity and Forecast, 2016-2032
- 7.1. APAC Collagen Market Analysis, 2016-2021
- 7.2. APAC Collagen Market Opportunity and Forecast, 2023-2032
- 7.3. APAC Collagen Market Analysis, Opportunity and Forecast, By Product, 2016-2032
- 7.3.1. APAC Collagen Market Analysis by Product: Introduction
- 7.3.2. Market Size Absolute $ Opportunity Analysis and Forecast, By Product, 2016-2032
- 7.3.3. Gelatin
- 7.3.4. Hydrolyzed Collagen
- 7.3.5. Native Collagen
- 7.3.6. Synthetic Collagen
- 7.4. APAC Collagen Market Analysis, Opportunity and Forecast, By Form, 2016-2032
- 7.4.1. APAC Collagen Market Analysis by Form: Introduction
- 7.4.2. Market Size Absolute $ Opportunity Analysis and Forecast, By Form, 2016-2032
- 7.4.3. Powder
- 7.4.4. Liquid
- 7.4.5. Capsule
- 7.5. APAC Collagen Market Analysis, Opportunity and Forecast, By Source, 2016-2032
- 7.5.1. APAC Collagen Market Analysis by Source: Introduction
- 7.5.2. Market Size Absolute $ Opportunity Analysis and Forecast, By Source, 2016-2032
- 7.5.3. Bovine
- 7.5.4. Porcine
- 7.5.5. Marine
- 7.5.6. Poultry
- 7.6. APAC Collagen Market Analysis, Opportunity and Forecast, By Application, 2016-2032
- 7.6.1. APAC Collagen Market Analysis by Application: Introduction
- 7.6.2. Market Size Absolute $ Opportunity Analysis and Forecast, By Application, 2016-2032
- 7.6.3. Food & Beverages
- 7.6.4. Health Care
- 7.6.5. Nutraceuticals
- 7.6.6. Other Application
- 7.7. APAC Collagen Market Analysis, Opportunity and Forecast, By Country , 2016-2032
- 7.7.1. APAC Collagen Market Analysis by Country : Introduction
- 7.7.2. Market Size Absolute $ Opportunity Analysis and Forecast, Country , 2016-2032
- 7.7.2.1. China
- 7.7.2.2. Japan
- 7.7.2.3. South Korea
- 7.7.2.4. India
- 7.7.2.5. Australia & New Zeland
- 7.7.2.6. Indonesia
- 7.7.2.7. Malaysia
- 7.7.2.8. Philippines
- 7.7.2.9. Singapore
- 7.7.2.10. Thailand
- 7.7.2.11. Vietnam
- 7.7.2.12. Rest of APAC
- 8. Latin America Collagen Market Analysis, Opportunity and Forecast, 2016-2032
- 8.1. Latin America Collagen Market Analysis, 2016-2021
- 8.2. Latin America Collagen Market Opportunity and Forecast, 2023-2032
- 8.3. Latin America Collagen Market Analysis, Opportunity and Forecast, By Product, 2016-2032
- 8.3.1. Latin America Collagen Market Analysis by Product: Introduction
- 8.3.2. Market Size Absolute $ Opportunity Analysis and Forecast, By Product, 2016-2032
- 8.3.3. Gelatin
- 8.3.4. Hydrolyzed Collagen
- 8.3.5. Native Collagen
- 8.3.6. Synthetic Collagen
- 8.4. Latin America Collagen Market Analysis, Opportunity and Forecast, By Form, 2016-2032
- 8.4.1. Latin America Collagen Market Analysis by Form: Introduction
- 8.4.2. Market Size Absolute $ Opportunity Analysis and Forecast, By Form, 2016-2032
- 8.4.3. Powder
- 8.4.4. Liquid
- 8.4.5. Capsule
- 8.5. Latin America Collagen Market Analysis, Opportunity and Forecast, By Source, 2016-2032
- 8.5.1. Latin America Collagen Market Analysis by Source: Introduction
- 8.5.2. Market Size Absolute $ Opportunity Analysis and Forecast, By Source, 2016-2032
- 8.5.3. Bovine
- 8.5.4. Porcine
- 8.5.5. Marine
- 8.5.6. Poultry
- 8.6. Latin America Collagen Market Analysis, Opportunity and Forecast, By Application, 2016-2032
- 8.6.1. Latin America Collagen Market Analysis by Application: Introduction
- 8.6.2. Market Size Absolute $ Opportunity Analysis and Forecast, By Application, 2016-2032
- 8.6.3. Food & Beverages
- 8.6.4. Health Care
- 8.6.5. Nutraceuticals
- 8.6.6. Other Application
- 8.7. Latin America Collagen Market Analysis, Opportunity and Forecast, By Country , 2016-2032
- 8.7.1. Latin America Collagen Market Analysis by Country : Introduction
- 8.7.2. Market Size Absolute $ Opportunity Analysis and Forecast, Country , 2016-2032
- 8.7.2.1. Brazil
- 8.7.2.2. Colombia
- 8.7.2.3. Chile
- 8.7.2.4. Argentina
- 8.7.2.5. Costa Rica
- 8.7.2.6. Rest of Latin America
- 9. Middle East & Africa Collagen Market Analysis, Opportunity and Forecast, 2016-2032
- 9.1. Middle East & Africa Collagen Market Analysis, 2016-2021
- 9.2. Middle East & Africa Collagen Market Opportunity and Forecast, 2023-2032
- 9.3. Middle East & Africa Collagen Market Analysis, Opportunity and Forecast, By Product, 2016-2032
- 9.3.1. Middle East & Africa Collagen Market Analysis by Product: Introduction
- 9.3.2. Market Size Absolute $ Opportunity Analysis and Forecast, By Product, 2016-2032
- 9.3.3. Gelatin
- 9.3.4. Hydrolyzed Collagen
- 9.3.5. Native Collagen
- 9.3.6. Synthetic Collagen
- 9.4. Middle East & Africa Collagen Market Analysis, Opportunity and Forecast, By Form, 2016-2032
- 9.4.1. Middle East & Africa Collagen Market Analysis by Form: Introduction
- 9.4.2. Market Size Absolute $ Opportunity Analysis and Forecast, By Form, 2016-2032
- 9.4.3. Powder
- 9.4.4. Liquid
- 9.4.5. Capsule
- 9.5. Middle East & Africa Collagen Market Analysis, Opportunity and Forecast, By Source, 2016-2032
- 9.5.1. Middle East & Africa Collagen Market Analysis by Source: Introduction
- 9.5.2. Market Size Absolute $ Opportunity Analysis and Forecast, By Source, 2016-2032
- 9.5.3. Bovine
- 9.5.4. Porcine
- 9.5.5. Marine
- 9.5.6. Poultry
- 9.6. Middle East & Africa Collagen Market Analysis, Opportunity and Forecast, By Application, 2016-2032
- 9.6.1. Middle East & Africa Collagen Market Analysis by Application: Introduction
- 9.6.2. Market Size Absolute $ Opportunity Analysis and Forecast, By Application, 2016-2032
- 9.6.3. Food & Beverages
- 9.6.4. Health Care
- 9.6.5. Nutraceuticals
- 9.6.6. Other Application
- 9.7. Middle East & Africa Collagen Market Analysis, Opportunity and Forecast, By Country , 2016-2032
- 9.7.1. Middle East & Africa Collagen Market Analysis by Country : Introduction
- 9.7.2. Market Size Absolute $ Opportunity Analysis and Forecast, Country , 2016-2032
- 9.7.2.1. Algeria
- 9.7.2.2. Egypt
- 9.7.2.3. Israel
- 9.7.2.4. Kuwait
- 9.7.2.5. Nigeria
- 9.7.2.6. Saudi Arabia
- 9.7.2.7. South Africa
- 9.7.2.8. Turkey
- 9.7.2.9. The UAE
- 9.7.2.10. Rest of MEA
- 10. Global Collagen Market Analysis, Opportunity and Forecast, By Region , 2016-2032
- 10.1. Global Collagen Market Analysis by Region : Introduction
- 10.2. Market Size Absolute $ Opportunity Analysis and Forecast, By Region , 2016-2032
- 10.2.1. North America
- 10.2.2. Western Europe
- 10.2.3. Eastern Europe
- 10.2.4. APAC
- 10.2.5. Latin America
- 10.2.6. Middle East & Africa
- 11. Global Collagen Market Competitive Landscape, Market Share Analysis, and Company Profiles
- 11.1. Market Share Analysis
- 11.2. Company Profiles
- 11.3. Rousselot Inc.
- 11.3.1. Company Overview
- 11.3.2. Financial Highlights
- 11.3.3. Product Portfolio
- 11.3.4. SWOT Analysis
- 11.3.5. Key Strategies and Developments
- 11.4. Nitta Gelatin
- 11.4.1. Company Overview
- 11.4.2. Financial Highlights
- 11.4.3. Product Portfolio
- 11.4.4. SWOT Analysis
- 11.4.5. Key Strategies and Developments
- 11.5. Weishardt International
- 11.5.1. Company Overview
- 11.5.2. Financial Highlights
- 11.5.3. Product Portfolio
- 11.5.4. SWOT Analysis
- 11.5.5. Key Strategies and Developments
- 11.6. Gelita AG
- 11.6.1. Company Overview
- 11.6.2. Financial Highlights
- 11.6.3. Product Portfolio
- 11.6.4. SWOT Analysis
- 11.6.5. Key Strategies and Developments
- 11.7. Holista Colltech Ltd.
- 11.7.1. Company Overview
- 11.7.2. Financial Highlights
- 11.7.3. Product Portfolio
- 11.7.4. SWOT Analysis
- 11.7.5. Key Strategies and Developments
- 11.8. Evonik Industries AG
- 11.8.1. Company Overview
- 11.8.2. Financial Highlights
- 11.8.3. Product Portfolio
- 11.8.4. SWOT Analysis
- 11.8.5. Key Strategies and Developments
- 11.9. Lapi Gelatine S.p.a
- 11.9.1. Company Overview
- 11.9.2. Financial Highlights
- 11.9.3. Product Portfolio
- 11.9.4. SWOT Analysis
- 11.9.5. Key Strategies and Developments
- 11.10. Connoils
- 11.10.1. Company Overview
- 11.10.2. Financial Highlights
- 11.10.3. Product Portfolio
- 11.10.4. SWOT Analysis
- 11.10.5. Key Strategies and Developments
- 11.11. Vital Proteins LLC
- 11.11.1. Company Overview
- 11.11.2. Financial Highlights
- 11.11.3. Product Portfolio
- 11.11.4. SWOT Analysis
- 11.11.5. Key Strategies and Developments
- 11.12. Collagen Matrix, Inc.
- 11.12.1. Company Overview
- 11.12.2. Financial Highlights
- 11.12.3. Product Portfolio
- 11.12.4. SWOT Analysis
- 11.12.5. Key Strategies and Developments
- 11.13. Other Key Players
- 11.13.1. Company Overview
- 11.13.2. Financial Highlights
- 11.13.3. Product Portfolio
- 11.13.4. SWOT Analysis
- 11.13.5. Key Strategies and Developments
- 12. Assumptions and Acronyms
- 13. Research Methodology
- 14. Contact
List of Figures
-
- Figure 1: Global Collagen Market Revenue (US$ Mn) Market Share by Product in 2022
- Figure 2: Global Collagen Market Attractiveness Analysis by Product, 2016-2032
- Figure 3: Global Collagen Market Revenue (US$ Mn) Market Share by Formin 2022
- Figure 4: Global Collagen Market Attractiveness Analysis by Form, 2016-2032
- Figure 5: Global Collagen Market Revenue (US$ Mn) Market Share by Sourcein 2022
- Figure 6: Global Collagen Market Attractiveness Analysis by Source, 2016-2032
- Figure 7: Global Collagen Market Revenue (US$ Mn) Market Share by Applicationin 2022
- Figure 8: Global Collagen Market Attractiveness Analysis by Application, 2016-2032
- Figure 9: Global Collagen Market Revenue (US$ Mn) Market Share by Region in 2022
- Figure 10: Global Collagen Market Attractiveness Analysis by Region, 2016-2032
- Figure 11: Global Collagen Market Revenue (US$ Mn) (2016-2032)
- Figure 12: Global Collagen Market Revenue (US$ Mn) Comparison by Region (2016-2032)
- Figure 13: Global Collagen Market Revenue (US$ Mn) Comparison by Product (2016-2032)
- Figure 14: Global Collagen Market Revenue (US$ Mn) Comparison by Form (2016-2032)
- Figure 15: Global Collagen Market Revenue (US$ Mn) Comparison by Source (2016-2032)
- Figure 16: Global Collagen Market Revenue (US$ Mn) Comparison by Application (2016-2032)
- Figure 17: Global Collagen Market Y-o-Y Growth Rate Comparison by Region (2016-2032)
- Figure 18: Global Collagen Market Y-o-Y Growth Rate Comparison by Product (2016-2032)
- Figure 19: Global Collagen Market Y-o-Y Growth Rate Comparison by Form (2016-2032)
- Figure 20: Global Collagen Market Y-o-Y Growth Rate Comparison by Source (2016-2032)
- Figure 21: Global Collagen Market Y-o-Y Growth Rate Comparison by Application (2016-2032)
- Figure 22: Global Collagen Market Share Comparison by Region (2016-2032)
- Figure 23: Global Collagen Market Share Comparison by Product (2016-2032)
- Figure 24: Global Collagen Market Share Comparison by Form (2016-2032)
- Figure 25: Global Collagen Market Share Comparison by Source (2016-2032)
- Figure 26: Global Collagen Market Share Comparison by Application (2016-2032)
- Figure 27: North America Collagen Market Revenue (US$ Mn) Market Share by Productin 2022
- Figure 28: North America Collagen Market Attractiveness Analysis by Product, 2016-2032
- Figure 29: North America Collagen Market Revenue (US$ Mn) Market Share by Formin 2022
- Figure 30: North America Collagen Market Attractiveness Analysis by Form, 2016-2032
- Figure 31: North America Collagen Market Revenue (US$ Mn) Market Share by Sourcein 2022
- Figure 32: North America Collagen Market Attractiveness Analysis by Source, 2016-2032
- Figure 33: North America Collagen Market Revenue (US$ Mn) Market Share by Applicationin 2022
- Figure 34: North America Collagen Market Attractiveness Analysis by Application, 2016-2032
- Figure 35: North America Collagen Market Revenue (US$ Mn) Market Share by Country in 2022
- Figure 36: North America Collagen Market Attractiveness Analysis by Country, 2016-2032
- Figure 37: North America Collagen Market Revenue (US$ Mn) (2016-2032)
- Figure 38: North America Collagen Market Revenue (US$ Mn) Comparison by Country (2016-2032)
- Figure 39: North America Collagen Market Revenue (US$ Mn) Comparison by Product (2016-2032)
- Figure 40: North America Collagen Market Revenue (US$ Mn) Comparison by Form (2016-2032)
- Figure 41: North America Collagen Market Revenue (US$ Mn) Comparison by Source (2016-2032)
- Figure 42: North America Collagen Market Revenue (US$ Mn) Comparison by Application (2016-2032)
- Figure 43: North America Collagen Market Y-o-Y Growth Rate Comparison by Country (2016-2032)
- Figure 44: North America Collagen Market Y-o-Y Growth Rate Comparison by Product (2016-2032)
- Figure 45: North America Collagen Market Y-o-Y Growth Rate Comparison by Form (2016-2032)
- Figure 46: North America Collagen Market Y-o-Y Growth Rate Comparison by Source (2016-2032)
- Figure 47: North America Collagen Market Y-o-Y Growth Rate Comparison by Application (2016-2032)
- Figure 48: North America Collagen Market Share Comparison by Country (2016-2032)
- Figure 49: North America Collagen Market Share Comparison by Product (2016-2032)
- Figure 50: North America Collagen Market Share Comparison by Form (2016-2032)
- Figure 51: North America Collagen Market Share Comparison by Source (2016-2032)
- Figure 52: North America Collagen Market Share Comparison by Application (2016-2032)
- Figure 53: Western Europe Collagen Market Revenue (US$ Mn) Market Share by Productin 2022
- Figure 54: Western Europe Collagen Market Attractiveness Analysis by Product, 2016-2032
- Figure 55: Western Europe Collagen Market Revenue (US$ Mn) Market Share by Formin 2022
- Figure 56: Western Europe Collagen Market Attractiveness Analysis by Form, 2016-2032
- Figure 57: Western Europe Collagen Market Revenue (US$ Mn) Market Share by Sourcein 2022
- Figure 58: Western Europe Collagen Market Attractiveness Analysis by Source, 2016-2032
- Figure 59: Western Europe Collagen Market Revenue (US$ Mn) Market Share by Applicationin 2022
- Figure 60: Western Europe Collagen Market Attractiveness Analysis by Application, 2016-2032
- Figure 61: Western Europe Collagen Market Revenue (US$ Mn) Market Share by Country in 2022
- Figure 62: Western Europe Collagen Market Attractiveness Analysis by Country, 2016-2032
- Figure 63: Western Europe Collagen Market Revenue (US$ Mn) (2016-2032)
- Figure 64: Western Europe Collagen Market Revenue (US$ Mn) Comparison by Country (2016-2032)
- Figure 65: Western Europe Collagen Market Revenue (US$ Mn) Comparison by Product (2016-2032)
- Figure 66: Western Europe Collagen Market Revenue (US$ Mn) Comparison by Form (2016-2032)
- Figure 67: Western Europe Collagen Market Revenue (US$ Mn) Comparison by Source (2016-2032)
- Figure 68: Western Europe Collagen Market Revenue (US$ Mn) Comparison by Application (2016-2032)
- Figure 69: Western Europe Collagen Market Y-o-Y Growth Rate Comparison by Country (2016-2032)
- Figure 70: Western Europe Collagen Market Y-o-Y Growth Rate Comparison by Product (2016-2032)
- Figure 71: Western Europe Collagen Market Y-o-Y Growth Rate Comparison by Form (2016-2032)
- Figure 72: Western Europe Collagen Market Y-o-Y Growth Rate Comparison by Source (2016-2032)
- Figure 73: Western Europe Collagen Market Y-o-Y Growth Rate Comparison by Application (2016-2032)
- Figure 74: Western Europe Collagen Market Share Comparison by Country (2016-2032)
- Figure 75: Western Europe Collagen Market Share Comparison by Product (2016-2032)
- Figure 76: Western Europe Collagen Market Share Comparison by Form (2016-2032)
- Figure 77: Western Europe Collagen Market Share Comparison by Source (2016-2032)
- Figure 78: Western Europe Collagen Market Share Comparison by Application (2016-2032)
- Figure 79: Eastern Europe Collagen Market Revenue (US$ Mn) Market Share by Productin 2022
- Figure 80: Eastern Europe Collagen Market Attractiveness Analysis by Product, 2016-2032
- Figure 81: Eastern Europe Collagen Market Revenue (US$ Mn) Market Share by Formin 2022
- Figure 82: Eastern Europe Collagen Market Attractiveness Analysis by Form, 2016-2032
- Figure 83: Eastern Europe Collagen Market Revenue (US$ Mn) Market Share by Sourcein 2022
- Figure 84: Eastern Europe Collagen Market Attractiveness Analysis by Source, 2016-2032
- Figure 85: Eastern Europe Collagen Market Revenue (US$ Mn) Market Share by Applicationin 2022
- Figure 86: Eastern Europe Collagen Market Attractiveness Analysis by Application, 2016-2032
- Figure 87: Eastern Europe Collagen Market Revenue (US$ Mn) Market Share by Country in 2022
- Figure 88: Eastern Europe Collagen Market Attractiveness Analysis by Country, 2016-2032
- Figure 89: Eastern Europe Collagen Market Revenue (US$ Mn) (2016-2032)
- Figure 90: Eastern Europe Collagen Market Revenue (US$ Mn) Comparison by Country (2016-2032)
- Figure 91: Eastern Europe Collagen Market Revenue (US$ Mn) Comparison by Product (2016-2032)
- Figure 92: Eastern Europe Collagen Market Revenue (US$ Mn) Comparison by Form (2016-2032)
- Figure 93: Eastern Europe Collagen Market Revenue (US$ Mn) Comparison by Source (2016-2032)
- Figure 94: Eastern Europe Collagen Market Revenue (US$ Mn) Comparison by Application (2016-2032)
- Figure 95: Eastern Europe Collagen Market Y-o-Y Growth Rate Comparison by Country (2016-2032)
- Figure 96: Eastern Europe Collagen Market Y-o-Y Growth Rate Comparison by Product (2016-2032)
- Figure 97: Eastern Europe Collagen Market Y-o-Y Growth Rate Comparison by Form (2016-2032)
- Figure 98: Eastern Europe Collagen Market Y-o-Y Growth Rate Comparison by Source (2016-2032)
- Figure 99: Eastern Europe Collagen Market Y-o-Y Growth Rate Comparison by Application (2016-2032)
- Figure 100: Eastern Europe Collagen Market Share Comparison by Country (2016-2032)
- Figure 101: Eastern Europe Collagen Market Share Comparison by Product (2016-2032)
- Figure 102: Eastern Europe Collagen Market Share Comparison by Form (2016-2032)
- Figure 103: Eastern Europe Collagen Market Share Comparison by Source (2016-2032)
- Figure 104: Eastern Europe Collagen Market Share Comparison by Application (2016-2032)
- Figure 105: APAC Collagen Market Revenue (US$ Mn) Market Share by Productin 2022
- Figure 106: APAC Collagen Market Attractiveness Analysis by Product, 2016-2032
- Figure 107: APAC Collagen Market Revenue (US$ Mn) Market Share by Formin 2022
- Figure 108: APAC Collagen Market Attractiveness Analysis by Form, 2016-2032
- Figure 109: APAC Collagen Market Revenue (US$ Mn) Market Share by Sourcein 2022
- Figure 110: APAC Collagen Market Attractiveness Analysis by Source, 2016-2032
- Figure 111: APAC Collagen Market Revenue (US$ Mn) Market Share by Applicationin 2022
- Figure 112: APAC Collagen Market Attractiveness Analysis by Application, 2016-2032
- Figure 113: APAC Collagen Market Revenue (US$ Mn) Market Share by Country in 2022
- Figure 114: APAC Collagen Market Attractiveness Analysis by Country, 2016-2032
- Figure 115: APAC Collagen Market Revenue (US$ Mn) (2016-2032)
- Figure 116: APAC Collagen Market Revenue (US$ Mn) Comparison by Country (2016-2032)
- Figure 117: APAC Collagen Market Revenue (US$ Mn) Comparison by Product (2016-2032)
- Figure 118: APAC Collagen Market Revenue (US$ Mn) Comparison by Form (2016-2032)
- Figure 119: APAC Collagen Market Revenue (US$ Mn) Comparison by Source (2016-2032)
- Figure 120: APAC Collagen Market Revenue (US$ Mn) Comparison by Application (2016-2032)
- Figure 121: APAC Collagen Market Y-o-Y Growth Rate Comparison by Country (2016-2032)
- Figure 122: APAC Collagen Market Y-o-Y Growth Rate Comparison by Product (2016-2032)
- Figure 123: APAC Collagen Market Y-o-Y Growth Rate Comparison by Form (2016-2032)
- Figure 124: APAC Collagen Market Y-o-Y Growth Rate Comparison by Source (2016-2032)
- Figure 125: APAC Collagen Market Y-o-Y Growth Rate Comparison by Application (2016-2032)
- Figure 126: APAC Collagen Market Share Comparison by Country (2016-2032)
- Figure 127: APAC Collagen Market Share Comparison by Product (2016-2032)
- Figure 128: APAC Collagen Market Share Comparison by Form (2016-2032)
- Figure 129: APAC Collagen Market Share Comparison by Source (2016-2032)
- Figure 130: APAC Collagen Market Share Comparison by Application (2016-2032)
- Figure 131: Latin America Collagen Market Revenue (US$ Mn) Market Share by Productin 2022
- Figure 132: Latin America Collagen Market Attractiveness Analysis by Product, 2016-2032
- Figure 133: Latin America Collagen Market Revenue (US$ Mn) Market Share by Formin 2022
- Figure 134: Latin America Collagen Market Attractiveness Analysis by Form, 2016-2032
- Figure 135: Latin America Collagen Market Revenue (US$ Mn) Market Share by Sourcein 2022
- Figure 136: Latin America Collagen Market Attractiveness Analysis by Source, 2016-2032
- Figure 137: Latin America Collagen Market Revenue (US$ Mn) Market Share by Applicationin 2022
- Figure 138: Latin America Collagen Market Attractiveness Analysis by Application, 2016-2032
- Figure 139: Latin America Collagen Market Revenue (US$ Mn) Market Share by Country in 2022
- Figure 140: Latin America Collagen Market Attractiveness Analysis by Country, 2016-2032
- Figure 141: Latin America Collagen Market Revenue (US$ Mn) (2016-2032)
- Figure 142: Latin America Collagen Market Revenue (US$ Mn) Comparison by Country (2016-2032)
- Figure 143: Latin America Collagen Market Revenue (US$ Mn) Comparison by Product (2016-2032)
- Figure 144: Latin America Collagen Market Revenue (US$ Mn) Comparison by Form (2016-2032)
- Figure 145: Latin America Collagen Market Revenue (US$ Mn) Comparison by Source (2016-2032)
- Figure 146: Latin America Collagen Market Revenue (US$ Mn) Comparison by Application (2016-2032)
- Figure 147: Latin America Collagen Market Y-o-Y Growth Rate Comparison by Country (2016-2032)
- Figure 148: Latin America Collagen Market Y-o-Y Growth Rate Comparison by Product (2016-2032)
- Figure 149: Latin America Collagen Market Y-o-Y Growth Rate Comparison by Form (2016-2032)
- Figure 150: Latin America Collagen Market Y-o-Y Growth Rate Comparison by Source (2016-2032)
- Figure 151: Latin America Collagen Market Y-o-Y Growth Rate Comparison by Application (2016-2032)
- Figure 152: Latin America Collagen Market Share Comparison by Country (2016-2032)
- Figure 153: Latin America Collagen Market Share Comparison by Product (2016-2032)
- Figure 154: Latin America Collagen Market Share Comparison by Form (2016-2032)
- Figure 155: Latin America Collagen Market Share Comparison by Source (2016-2032)
- Figure 156: Latin America Collagen Market Share Comparison by Application (2016-2032)
- Figure 157: Middle East & Africa Collagen Market Revenue (US$ Mn) Market Share by Productin 2022
- Figure 158: Middle East & Africa Collagen Market Attractiveness Analysis by Product, 2016-2032
- Figure 159: Middle East & Africa Collagen Market Revenue (US$ Mn) Market Share by Formin 2022
- Figure 160: Middle East & Africa Collagen Market Attractiveness Analysis by Form, 2016-2032
- Figure 161: Middle East & Africa Collagen Market Revenue (US$ Mn) Market Share by Sourcein 2022
- Figure 162: Middle East & Africa Collagen Market Attractiveness Analysis by Source, 2016-2032
- Figure 163: Middle East & Africa Collagen Market Revenue (US$ Mn) Market Share by Applicationin 2022
- Figure 164: Middle East & Africa Collagen Market Attractiveness Analysis by Application, 2016-2032
- Figure 165: Middle East & Africa Collagen Market Revenue (US$ Mn) Market Share by Country in 2022
- Figure 166: Middle East & Africa Collagen Market Attractiveness Analysis by Country, 2016-2032
- Figure 167: Middle East & Africa Collagen Market Revenue (US$ Mn) (2016-2032)
- Figure 168: Middle East & Africa Collagen Market Revenue (US$ Mn) Comparison by Country (2016-2032)
- Figure 169: Middle East & Africa Collagen Market Revenue (US$ Mn) Comparison by Product (2016-2032)
- Figure 170: Middle East & Africa Collagen Market Revenue (US$ Mn) Comparison by Form (2016-2032)
- Figure 171: Middle East & Africa Collagen Market Revenue (US$ Mn) Comparison by Source (2016-2032)
- Figure 172: Middle East & Africa Collagen Market Revenue (US$ Mn) Comparison by Application (2016-2032)
- Figure 173: Middle East & Africa Collagen Market Y-o-Y Growth Rate Comparison by Country (2016-2032)
- Figure 174: Middle East & Africa Collagen Market Y-o-Y Growth Rate Comparison by Product (2016-2032)
- Figure 175: Middle East & Africa Collagen Market Y-o-Y Growth Rate Comparison by Form (2016-2032)
- Figure 176: Middle East & Africa Collagen Market Y-o-Y Growth Rate Comparison by Source (2016-2032)
- Figure 177: Middle East & Africa Collagen Market Y-o-Y Growth Rate Comparison by Application (2016-2032)
- Figure 178: Middle East & Africa Collagen Market Share Comparison by Country (2016-2032)
- Figure 179: Middle East & Africa Collagen Market Share Comparison by Product (2016-2032)
- Figure 180: Middle East & Africa Collagen Market Share Comparison by Form (2016-2032)
- Figure 181: Middle East & Africa Collagen Market Share Comparison by Source (2016-2032)
- Figure 182: Middle East & Africa Collagen Market Share Comparison by Application (2016-2032)
List of Tables
- Table 1: Global Collagen Market Comparison by Product (2016-2032)
- Table 2: Global Collagen Market Comparison by Form (2016-2032)
- Table 3: Global Collagen Market Comparison by Source (2016-2032)
- Table 4: Global Collagen Market Comparison by Application (2016-2032)
- Table 5: Global Collagen Market Revenue (US$ Mn) Comparison by Region (2016-2032)
- Table 6: Global Collagen Market Revenue (US$ Mn) (2016-2032)
- Table 7: Global Collagen Market Revenue (US$ Mn) Comparison by Region (2016-2032)
- Table 8: Global Collagen Market Revenue (US$ Mn) Comparison by Product (2016-2032)
- Table 9: Global Collagen Market Revenue (US$ Mn) Comparison by Form (2016-2032)
- Table 10: Global Collagen Market Revenue (US$ Mn) Comparison by Source (2016-2032)
- Table 11: Global Collagen Market Revenue (US$ Mn) Comparison by Application (2016-2032)
- Table 12: Global Collagen Market Y-o-Y Growth Rate Comparison by Region (2016-2032)
- Table 13: Global Collagen Market Y-o-Y Growth Rate Comparison by Product (2016-2032)
- Table 14: Global Collagen Market Y-o-Y Growth Rate Comparison by Form (2016-2032)
- Table 15: Global Collagen Market Y-o-Y Growth Rate Comparison by Source (2016-2032)
- Table 16: Global Collagen Market Y-o-Y Growth Rate Comparison by Application (2016-2032)
- Table 17: Global Collagen Market Share Comparison by Region (2016-2032)
- Table 18: Global Collagen Market Share Comparison by Product (2016-2032)
- Table 19: Global Collagen Market Share Comparison by Form (2016-2032)
- Table 20: Global Collagen Market Share Comparison by Source (2016-2032)
- Table 21: Global Collagen Market Share Comparison by Application (2016-2032)
- Table 22: North America Collagen Market Comparison by Form (2016-2032)
- Table 23: North America Collagen Market Comparison by Source (2016-2032)
- Table 24: North America Collagen Market Comparison by Application (2016-2032)
- Table 25: North America Collagen Market Revenue (US$ Mn) Comparison by Country (2016-2032)
- Table 26: North America Collagen Market Revenue (US$ Mn) (2016-2032)
- Table 27: North America Collagen Market Revenue (US$ Mn) Comparison by Country (2016-2032)
- Table 28: North America Collagen Market Revenue (US$ Mn) Comparison by Product (2016-2032)
- Table 29: North America Collagen Market Revenue (US$ Mn) Comparison by Form (2016-2032)
- Table 30: North America Collagen Market Revenue (US$ Mn) Comparison by Source (2016-2032)
- Table 31: North America Collagen Market Revenue (US$ Mn) Comparison by Application (2016-2032)
- Table 32: North America Collagen Market Y-o-Y Growth Rate Comparison by Country (2016-2032)
- Table 33: North America Collagen Market Y-o-Y Growth Rate Comparison by Product (2016-2032)
- Table 34: North America Collagen Market Y-o-Y Growth Rate Comparison by Form (2016-2032)
- Table 35: North America Collagen Market Y-o-Y Growth Rate Comparison by Source (2016-2032)
- Table 36: North America Collagen Market Y-o-Y Growth Rate Comparison by Application (2016-2032)
- Table 37: North America Collagen Market Share Comparison by Country (2016-2032)
- Table 38: North America Collagen Market Share Comparison by Product (2016-2032)
- Table 39: North America Collagen Market Share Comparison by Form (2016-2032)
- Table 40: North America Collagen Market Share Comparison by Source (2016-2032)
- Table 41: North America Collagen Market Share Comparison by Application (2016-2032)
- Table 42: Western Europe Collagen Market Comparison by Product (2016-2032)
- Table 43: Western Europe Collagen Market Comparison by Form (2016-2032)
- Table 44: Western Europe Collagen Market Comparison by Source (2016-2032)
- Table 45: Western Europe Collagen Market Comparison by Application (2016-2032)
- Table 46: Western Europe Collagen Market Revenue (US$ Mn) Comparison by Country (2016-2032)
- Table 47: Western Europe Collagen Market Revenue (US$ Mn) (2016-2032)
- Table 48: Western Europe Collagen Market Revenue (US$ Mn) Comparison by Country (2016-2032)
- Table 49: Western Europe Collagen Market Revenue (US$ Mn) Comparison by Product (2016-2032)
- Table 50: Western Europe Collagen Market Revenue (US$ Mn) Comparison by Form (2016-2032)
- Table 51: Western Europe Collagen Market Revenue (US$ Mn) Comparison by Source (2016-2032)
- Table 52: Western Europe Collagen Market Revenue (US$ Mn) Comparison by Application (2016-2032)
- Table 53: Western Europe Collagen Market Y-o-Y Growth Rate Comparison by Country (2016-2032)
- Table 54: Western Europe Collagen Market Y-o-Y Growth Rate Comparison by Product (2016-2032)
- Table 55: Western Europe Collagen Market Y-o-Y Growth Rate Comparison by Form (2016-2032)
- Table 56: Western Europe Collagen Market Y-o-Y Growth Rate Comparison by Source (2016-2032)
- Table 57: Western Europe Collagen Market Y-o-Y Growth Rate Comparison by Application (2016-2032)
- Table 58: Western Europe Collagen Market Share Comparison by Country (2016-2032)
- Table 59: Western Europe Collagen Market Share Comparison by Product (2016-2032)
- Table 60: Western Europe Collagen Market Share Comparison by Form (2016-2032)
- Table 61: Western Europe Collagen Market Share Comparison by Source (2016-2032)
- Table 62: Western Europe Collagen Market Share Comparison by Application (2016-2032)
- Table 63: Eastern Europe Collagen Market Comparison by Product (2016-2032)
- Table 64: Eastern Europe Collagen Market Comparison by Form (2016-2032)
- Table 65: Eastern Europe Collagen Market Comparison by Source (2016-2032)
- Table 66: Eastern Europe Collagen Market Comparison by Application (2016-2032)
- Table 67: Eastern Europe Collagen Market Revenue (US$ Mn) Comparison by Country (2016-2032)
- Table 68: Eastern Europe Collagen Market Revenue (US$ Mn) (2016-2032)
- Table 69: Eastern Europe Collagen Market Revenue (US$ Mn) Comparison by Country (2016-2032)
- Table 70: Eastern Europe Collagen Market Revenue (US$ Mn) Comparison by Product (2016-2032)
- Table 71: Eastern Europe Collagen Market Revenue (US$ Mn) Comparison by Form (2016-2032)
- Table 72: Eastern Europe Collagen Market Revenue (US$ Mn) Comparison by Source (2016-2032)
- Table 73: Eastern Europe Collagen Market Revenue (US$ Mn) Comparison by Application (2016-2032)
- Table 74: Eastern Europe Collagen Market Y-o-Y Growth Rate Comparison by Country (2016-2032)
- Table 75: Eastern Europe Collagen Market Y-o-Y Growth Rate Comparison by Product (2016-2032)
- Table 76: Eastern Europe Collagen Market Y-o-Y Growth Rate Comparison by Form (2016-2032)
- Table 77: Eastern Europe Collagen Market Y-o-Y Growth Rate Comparison by Source (2016-2032)
- Table 78: Eastern Europe Collagen Market Y-o-Y Growth Rate Comparison by Application (2016-2032)
- Table 79: Eastern Europe Collagen Market Share Comparison by Country (2016-2032)
- Table 80: Eastern Europe Collagen Market Share Comparison by Product (2016-2032)
- Table 81: Eastern Europe Collagen Market Share Comparison by Form (2016-2032)
- Table 82: Eastern Europe Collagen Market Share Comparison by Source (2016-2032)
- Table 83: Eastern Europe Collagen Market Share Comparison by Application (2016-2032)
- Table 84: APAC Collagen Market Comparison by Product (2016-2032)
- Table 85: APAC Collagen Market Comparison by Form (2016-2032)
- Table 86: APAC Collagen Market Comparison by Source (2016-2032)
- Table 87: APAC Collagen Market Comparison by Application (2016-2032)
- Table 88: APAC Collagen Market Revenue (US$ Mn) Comparison by Country (2016-2032)
- Table 89: APAC Collagen Market Revenue (US$ Mn) (2016-2032)
- Table 90: APAC Collagen Market Revenue (US$ Mn) Comparison by Country (2016-2032)
- Table 91: APAC Collagen Market Revenue (US$ Mn) Comparison by Product (2016-2032)
- Table 92: APAC Collagen Market Revenue (US$ Mn) Comparison by Form (2016-2032)
- Table 93: APAC Collagen Market Revenue (US$ Mn) Comparison by Source (2016-2032)
- Table 94: APAC Collagen Market Revenue (US$ Mn) Comparison by Application (2016-2032)
- Table 95: APAC Collagen Market Y-o-Y Growth Rate Comparison by Country (2016-2032)
- Table 96: APAC Collagen Market Y-o-Y Growth Rate Comparison by Product (2016-2032)
- Table 97: APAC Collagen Market Y-o-Y Growth Rate Comparison by Form (2016-2032)
- Table 98: APAC Collagen Market Y-o-Y Growth Rate Comparison by Source (2016-2032)
- Table 99: APAC Collagen Market Y-o-Y Growth Rate Comparison by Application (2016-2032)
- Table 100: APAC Collagen Market Share Comparison by Country (2016-2032)
- Table 101: APAC Collagen Market Share Comparison by Product (2016-2032)
- Table 102: APAC Collagen Market Share Comparison by Form (2016-2032)
- Table 103: APAC Collagen Market Share Comparison by Source (2016-2032)
- Table 104: APAC Collagen Market Share Comparison by Application (2016-2032)
- Table 105: Latin America Collagen Market Comparison by Product (2016-2032)
- Table 106: Latin America Collagen Market Comparison by Form (2016-2032)
- Table 107: Latin America Collagen Market Comparison by Source (2016-2032)
- Table 108: Latin America Collagen Market Comparison by Application (2016-2032)
- Table 109: Latin America Collagen Market Revenue (US$ Mn) Comparison by Country (2016-2032)
- Table 110: Latin America Collagen Market Revenue (US$ Mn) (2016-2032)
- Table 111: Latin America Collagen Market Revenue (US$ Mn) Comparison by Country (2016-2032)
- Table 112: Latin America Collagen Market Revenue (US$ Mn) Comparison by Product (2016-2032)
- Table 113: Latin America Collagen Market Revenue (US$ Mn) Comparison by Form (2016-2032)
- Table 114: Latin America Collagen Market Revenue (US$ Mn) Comparison by Source (2016-2032)
- Table 115: Latin America Collagen Market Revenue (US$ Mn) Comparison by Application (2016-2032)
- Table 116: Latin America Collagen Market Y-o-Y Growth Rate Comparison by Country (2016-2032)
- Table 117: Latin America Collagen Market Y-o-Y Growth Rate Comparison by Product (2016-2032)
- Table 118: Latin America Collagen Market Y-o-Y Growth Rate Comparison by Form (2016-2032)
- Table 119: Latin America Collagen Market Y-o-Y Growth Rate Comparison by Source (2016-2032)
- Table 120: Latin America Collagen Market Y-o-Y Growth Rate Comparison by Application (2016-2032)
- Table 121: Latin America Collagen Market Share Comparison by Country (2016-2032)
- Table 122: Latin America Collagen Market Share Comparison by Product (2016-2032)
- Table 123: Latin America Collagen Market Share Comparison by Form (2016-2032)
- Table 124: Latin America Collagen Market Share Comparison by Source (2016-2032)
- Table 125: Latin America Collagen Market Share Comparison by Application (2016-2032)
- Table 126: Middle East & Africa Collagen Market Comparison by Product (2016-2032)
- Table 127: Middle East & Africa Collagen Market Comparison by Form (2016-2032)
- Table 128: Middle East & Africa Collagen Market Comparison by Source (2016-2032)
- Table 129: Middle East & Africa Collagen Market Comparison by Application (2016-2032)
- Table 130: Middle East & Africa Collagen Market Revenue (US$ Mn) Comparison by Country (2016-2032)
- Table 131: Middle East & Africa Collagen Market Revenue (US$ Mn) (2016-2032)
- Table 132: Middle East & Africa Collagen Market Revenue (US$ Mn) Comparison by Country (2016-2032)
- Table 133: Middle East & Africa Collagen Market Revenue (US$ Mn) Comparison by Product (2016-2032)
- Table 134: Middle East & Africa Collagen Market Revenue (US$ Mn) Comparison by Form (2016-2032)
- Table 135: Middle East & Africa Collagen Market Revenue (US$ Mn) Comparison by Source (2016-2032)
- Table 136: Middle East & Africa Collagen Market Revenue (US$ Mn) Comparison by Application (2016-2032)
- Table 137: Middle East & Africa Collagen Market Y-o-Y Growth Rate Comparison by Country (2016-2032)
- Table 138: Middle East & Africa Collagen Market Y-o-Y Growth Rate Comparison by Product (2016-2032)
- Table 139: Middle East & Africa Collagen Market Y-o-Y Growth Rate Comparison by Form (2016-2032)
- Table 140: Middle East & Africa Collagen Market Y-o-Y Growth Rate Comparison by Source (2016-2032)
- Table 141: Middle East & Africa Collagen Market Y-o-Y Growth Rate Comparison by Application (2016-2032)
- Table 142: Middle East & Africa Collagen Market Share Comparison by Country (2016-2032)
- Table 143: Middle East & Africa Collagen Market Share Comparison by Product (2016-2032)
- Table 144: Middle East & Africa Collagen Market Share Comparison by Form (2016-2032)
- Table 145: Middle East & Africa Collagen Market Share Comparison by Source (2016-2032)
- Table 146: Middle East & Africa Collagen Market Share Comparison by Application (2016-2032)
- 1. Executive Summary
-
- Rousselot Inc.
- Nitta Gelatin
- Weishardt International
- Gelita AG
- Holista Colltech Ltd.
- Evonik Industries AG
- Lapi Gelatine S.p.a
- Connoils
- Vital Proteins LLC
- Collagen Matrix, Inc.
- Other Key Players
Our Clients


View Our Licence Options
