Coconut Products Market By Product Type (Skin Care, Hair Care, Perfumes & Fragrance, Color Cosmetics), By End User (Supermarket, Hypermarket, Online Channels, Others) By Skin Type (Oily, Dry, Sensitive, Normal, Combination), By Region And Companies - Industry Segment Outlook, Market Assessment, Competition Scenario, Trends, And Forecast 2032
-
11030
-
May 2023
-
151
-


-
This report was compiled by Shreyas Rokade Shreyas Rokade is a seasoned Research Analyst with CMFE, bringing extensive expertise in market research and consulting, with a strong background in Chemical Engineering. Correspondence Team Lead-CMFE Linkedin | Detailed Market research Methodology Our methodology involves a mix of primary research, including interviews with leading mental health experts, and secondary research from reputable medical journals and databases. View Detailed Methodology Page
-
Quick Navigation
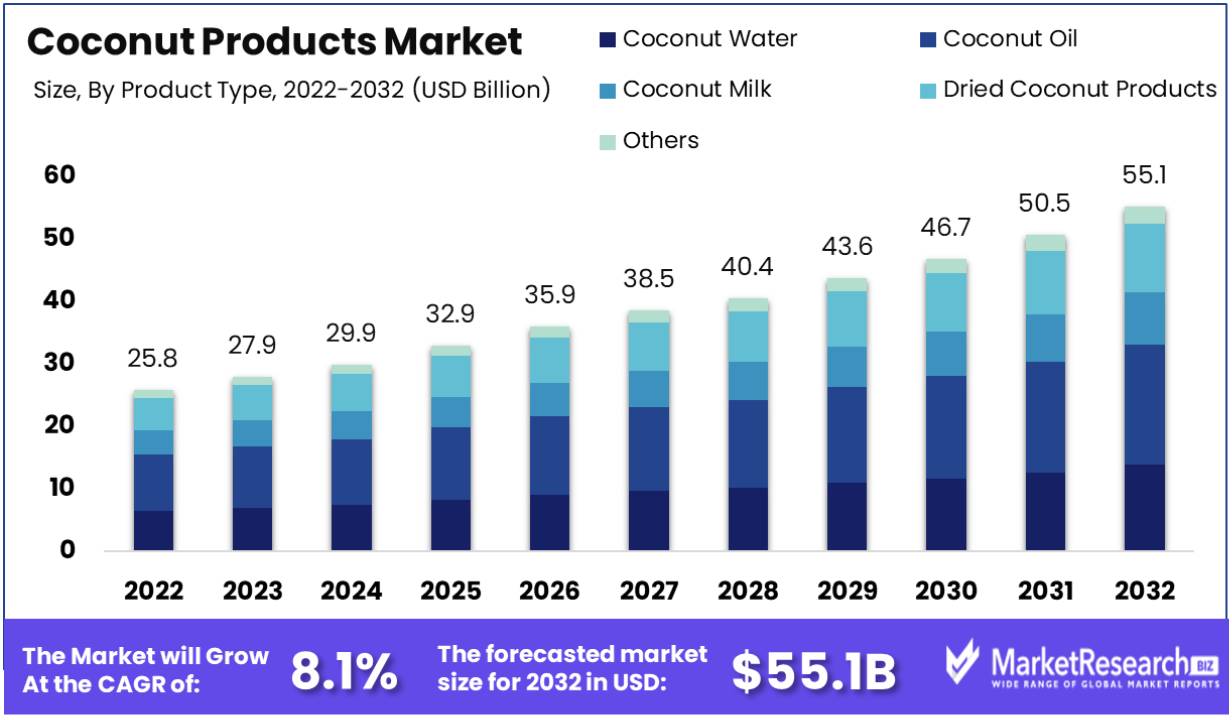
Coconut products market size was valued at USD 25.8 billion in 2022. It is expected to witness a CAGR of 8.1% from 2023 to 2032 forecast period. It is predicted to reach USD 55.1 billion by 2032.
The increase in awareness regarding the benefits of the coconut products has been the major driving factor for the coconut products market. Coconut market is divided into different products such as the coconut oil, coconut water, coconut milk and desiccated coconut. The use of coconut products is in several industries such as in the food and beverages, hair care and personal care sector.
In the personal care sector, the usage of coconut oil is more as they require manufacturing for hair and skincare applications such as hair oil and soaps. This has gained much popularity in the personal care sector due to its palliative features. The surge in demand for coconut oil in the cosmetic sector and the popularity among the food varieties drive the coconut product industry.
As more individuals are getting inclined towards fitness and health consciousness, they are seeking natural substitutes rather than other artificial energy drinks. This is one of the main reasons for the growth of the coconut products market size.
The surge in need for coconut water as a natural energy drink is increasing due to its nutritional elements such as the electrolytes. For example, coconut oil is popular among fitness individuals or the health conscious peoples for its medium-chain triglycerides (MCTs). The MCT is the type of fatty acids that are differently metabolized than other long-chain fatty acids. These can offer a quick source of energy and help in losing weight.
Many sportspeople, fitness and bodybuilding peoples are opting for natural and organic drinks and foods. The sudden increase in varieties of coconut products with their main focus towards health has made a significant impact in terms of the revenues. Manufacturers of food and beverages and other cosmetic products companies are doing the investment upon the R&D to get complete advantage of coconuts and to maintain the quality.
Moreover, coconut products play a vital role in the FMCG industry, due to the demand for its health benefits and sustainability. For example, FMCG has multiple chains of beauty and skincare products and the requirement of coconut oil is extensive. Coconut oil is well known for its moisturizing and nourishing elements.
It is used to make body lotions, face cream and other hair products. The extracts of the coconut are used in making the shampoo, conditioners and facial cleansers. The requirement for the organic and natural products will drive the coconut product market in the forecasted period.
Driving Factors
Growing Adoption of Vegan and Flexitarian Diets Drives Coconut Products Market Growth
Coconut products market growth will likely be driven by rising popularity of vegan and flexitarian diets in the coming years. More consumers opting for plant-based diets for reasons related to health, ethics and environmental sustainability; as more demand rises for plant-based ingredients like coconut. Due to their nutritional properties and versatility in vegan cooking recipes, coconut products like oil, milk and flour are popular options among chefs looking to use plant-based ingredients like coconut.
This shift has resulted in an explosion of coconut products being used both at home and within foodservice organizations. Restaurants and food manufacturers are increasingly adding coconut-based ingredients into their offerings to reach plant-based customers.
Increasing Demand for Coconut-Based Skincare and Haircare Products Boosts Market
The surge in consumer interest has propelled remarkable growth in the market for coconut-based skincare and haircare products. Renowned for their nourishing, moisturizing, and antibacterial properties, coconut oil and its derivatives have gained prominence as key components in natural beauty formulations. Consequently, an expanded array of coconut-infused products now are on the store shelves, ranging from moisturizers and serums to shampoos and conditioners.
The escalating demand for natural and organic personal care items, driven by consumers' increasing preferences, has further intensified the popularity of coconut-based products. Considered as a excellent 'superfood' for skin and hair health, coconut has become a staple ingredient in beauty regimens, often endorsed by beauty experts and influencers.
Rising Demand for Dairy Alternatives Like Coconut Milk and Cream Stimulates Market
Coconut-based dairy alternatives such as milk and cream are seeing increased popularity as consumers look for plant-based solutions to dairy. Lactose intolerance and dairy allergies become more widespread, leading them to search for plant-based alternatives such as coconut. Coconut milk products are popular due to their smooth texture and subtle flavor profile - perfect for cooking applications as well as use in coffee creamers.
This shift is part of a growing consumer trend towards plant-based diets and healthful eating. The dairy-free movement can be seen not only at grocery stores but also cafes and restaurants where coconut milk options have become increasingly common.
Increasing Consumer Awareness of Health and Wellness Encourages Coconut Product Usage
The growing awareness among consumers regarding health and wellness has spurred a rise in the utilization of coconut products. Acknowledged for its healthful qualities and abundant medium-chain triglycerides (MCTs), coconut is believed to have numerous health benefits.
This includes support for weight management, anti-inflammatory properties, and enhanced metabolism. In alignment with this health-conscious trend, an increasing number of coconut products, such as coconut water for hydration and coconut oil, have seamlessly integrated into daily dietary practices.
As consumers become more health-minded, they increasingly opt for food products that support their wellness goals. This trend has spurred the expansion of coconut products market as consumers increasingly view coconut as a nutritious and beneficial ingredient.
Restraining Factors
Dependence on a Few Large Buyers Restrains Market Growth
The coconut products market share is limited by its dependence on a few large buyers. This reliance on a small number of key purchasers can lead to market vulnerabilities, as changes in the buying patterns or preferences of these entities can significantly impact the entire market. Such dependence can also limit the bargaining power of coconut product manufacturers and suppliers, potentially affecting profitability and investment in market expansion.
Increasing Competition from Other Plant-Based Products Restrains Market Growth
The rise in popularity of other plant-based products presents increasing competition to the coconut products market. As consumers seek a variety of plant-based alternatives for health, environmental, or dietary reasons, products derived from sources such as almonds, oats, and soy milk are competing directly with coconut-based products. This growing competition can lead to a fragmentation of market share, challenging the growth prospects of the coconut products market.
Limited Availability of Processing Facilities Restrains Market Growth
The constrained access to processing facilities for coconut products poses a substantial impediment to the expansion of the market. The transformation of raw coconuts into market-ready products like coconut milk, oil, and flour demands specialized equipment and facilities. In numerous coconut-producing regions, a deficiency in sufficient processing infrastructure hinders the efficient conversion of raw coconuts into marketable goods. This constraint has ripple effects on the efficiency of the supply chain, impeding its ability to meet the escalating global demand for a variety of coconut products.
Coconut Products Market Segment Analysis
By Type
Coconut oil segment is the dominant product type in the coconut market, favored for its versatility and health benefits. Cooking uses of coconut oil are widespread due to its unique flavor and high smoke point; health and beauty products containing it feature moisturizing qualities as well. Growth in this segment is driven by an increasing interest in plant-based, natural products in both food service and personal care industries.
Coconut water has gained in popularity as an all-natural hydration beverage, while its use as an ingredient is increasingly vital in vegan and dairy-free diets. Dried coconut products like coconut flakes and chips are popular in snacking and baking. These sub-segments diversify the market and cater to evolving consumer preferences.
By Application
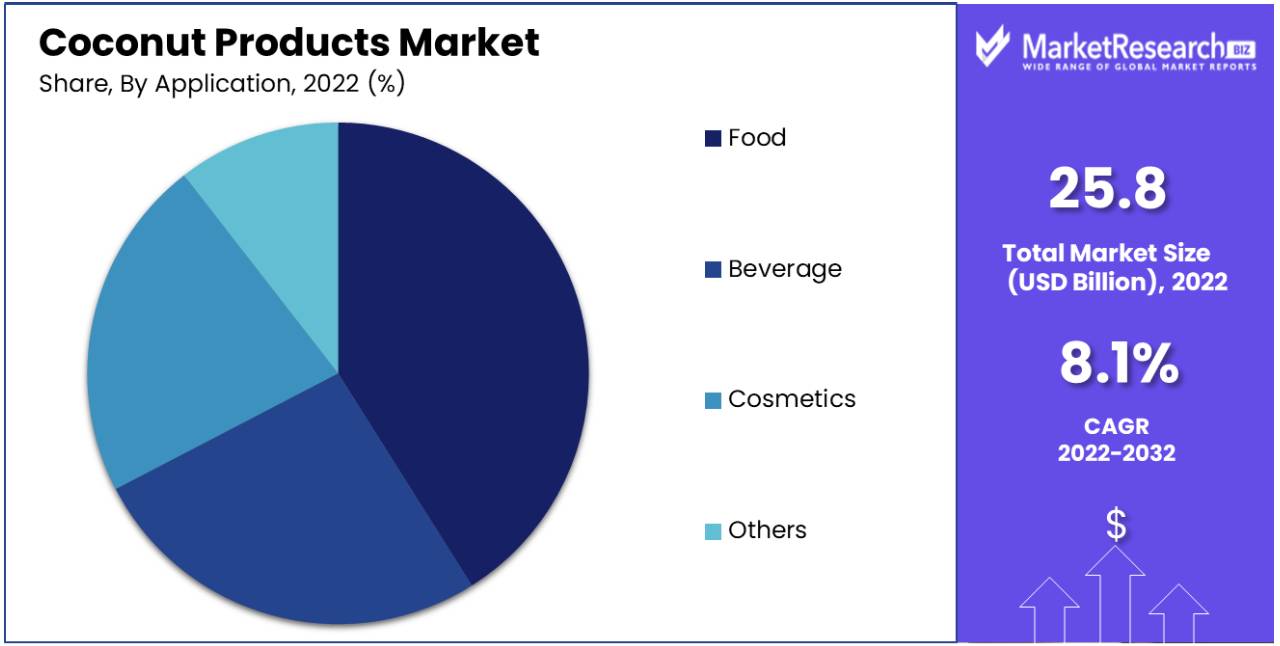
The food sector is the largest application area for coconut products market. Coconut ingredients are integral in various cuisines and are increasingly used in health-oriented and plant-based food products. The demand in this segment is underpinned by the growing trend of health-conscious eating and the culinary versatility of coconut products.
In beverages industry, coconut water and milk are popular for their natural health benefits. The cosmetics industry utilizes coconut oil and milk for their hydrating and nourishing properties. Other applications include health supplements and pet food, expanding the market's scope.
By Product
Desiccated coconut, while not the dominant product, is significant in the baking and confectionery industry. It is used for its flavor, texture, and as a decorative ingredient in a variety of food products.
Coconut powder finds use in cooking and as a dairy alternative. Coconut cream is a key ingredient in culinary applications, especially in Asian cuisines. Coconut milk, both liquid and powdered varieties, has quickly gained prominence as an appealing dairy alternative. These products contribute to the market's diversity and adaptability to different consumer needs.
Key Market Segments
By Product Type
- Skin Care
- Hair Care
- Perfumes & Fragrance
- Color Cosmetics
By End User
- Supermarket
- Hypermarket
- Online Channels
- Others
By Skin Type
- Oily
- Dry
- Sensitive
- Normal
- Combination
Growth Opportunities
Growing Demand for Organic and Natural Products Drives Growth Opportunities in Coconut Products Market
Organic and natural products have become an integral component of market expansion in the coconut products market, as consumers seek healthier and more environmentally-friendly options. Organic coconut products in particular have gained momentum due to their perceived purity and environmental friendliness - satisfying consumer desire for clean eating with responsible sourcing initiatives while propelling market expansion.
Growing Demand for Coconut-Based Functional Food and Beverages Spurs Market Expansion
An essential catalyst for the expansion of the coconut products industry is the increasing prominence of coconut-based functional food and beverages. This market growth is propelled by the widespread acknowledgment of coconut's nutritional advantages and functional attributes, rendering it a versatile ingredient suitable for enhancing various food and beverage products.
As consumers seek foods that offer health benefits beyond mere nutrition , consumers are turning to coconut-infused products like energy bars, yogurts, and smoothies as dietary staples. Businesses focusing on these offerings are strategically positioned to capitalize on the expanding market by delivering innovative and nutritious solutions that align with consumer preferences.
Regional Analysis
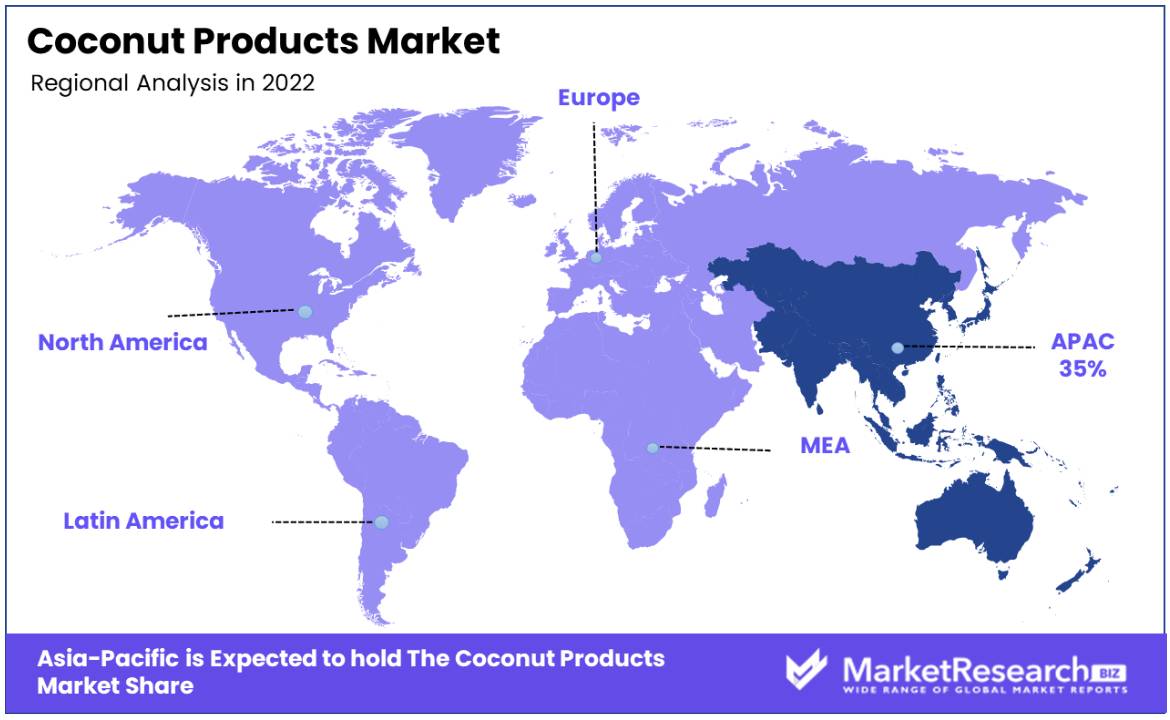
Asia Pacific Dominates with 35% Market Share in the Coconut Products Market
The Asia Pacific region has the largest market share, holding 35% of the global coconut products market. It is characterized by its significant role as producer and consumer of coconut products. Key reasons behind its dominance include ample availability of coconuts; Indonesia, Philippines and India rank amongst the leading producers globally of this fruit. Traditional uses in local diets as well as established farming and processing industries that utilize this natural product significantly contribute to this region's high market share.
Market dynamics are being determined by an increase in global demand for natural food products such as coconut oil, milk, water and flour - with Asia Pacific at the forefront of exporting this variety. Furthermore, global health awareness as well as vegan diet popularity has further spurred demand for coconut-based products.
Forecast predictions show that Asia Pacific region will remain dominant in the coconut product market. An increased emphasis on health and wellness as well as rising popularity of plant-based products are expected to drive further growth, while advancements in production and processing technologies will likely further expand quality and variety available both domestically and for export.
North America:
The North American coconut products market is poised for rapid growth in the foreseeable future. This upward trajectory is fueled by the escalating health consciousness and the burgeoning popularity of plant-based and lactose-free alternatives. Notably, the region has witnessed a surge in the demand for coconut water, oil, and milk, positioning them as perceived healthier substitutes for conventional products.
The market in North America is expected to continue growing, with trends in healthy eating and veganism likely to drive further demand. The expansion of distribution networks and the introduction of innovative coconut-based products are also set to contribute to market growth.
Europe:
The European market for coconut products is experiencing substantial growth, propelled by an increasing preference for health-conscious, natural, and organic food choices. The surge in popularity of vegan and vegetarian diets in the region has played a pivotal role in driving the heightened demand for coconut products as dairy substitutes.
Anticipated to witness steady growth, the European market benefits from an expanding consumer awareness regarding the health advantages of coconut products, coupled with a rising emphasis on sustainability and ethical sourcing. Furthermore, the proliferation of coconut product offerings in supermarkets and health food stores is expected to serve as a catalyst for market expansion.
Key Regions and Countries
North America
- The US
- Canada
- Rest of North America
Europe
- Germany
- France
- The UK
- Spain
- Italy
- Russia
- Netherlands
- Rest of Europe
Asia-Pacific
- China
- Japan
- South Korea
- India
- New Zealand
- Singapore
- Thailand
- Vietnam
- Rest of Asia Pacific
Latin America
- Brazil
- Mexico
- Rest of Latin America
Middle East & Africa
- South Africa
- Saudi Arabia
- UAE
- Rest of Middle East & Africa
Key Player Overview
The coconut products market is characterized by a diverse range of companies, each contributing uniquely to the industry's landscape. The Coconut Company (UK) Ltd. and Vita Coco are recognized for their focus on health-conscious consumers, offering a range of organic and natural coconut products that cater to the growing demand for healthy and sustainable food options.
Marico Ltd. and Nestlé S.A. have a significant impact on the market through their extensive distribution networks and broad product portfolios. Their strategic positioning enables them to cater to a wide consumer base, influencing global consumption patterns.
Enature Organic Products and Ayam Sarl emphasize organic and ethically sourced coconut products, aligning with consumer trends towards environmental sustainability and ethical sourcing. Renuka Foods PLC and S & P Industries Sdn Bhd have established strong market presences in Asia, capitalizing on the regional abundance of coconuts and focusing on export markets.
Shriram Coconut Products Limited and Star Heritage Products are notable for their focus on traditional coconut products, maintaining cultural authenticity and catering to niche markets. Pulau Sambu Singapore Pte Ltd and Sambu Group have solidified their roles in the market by offering a wide range of coconut-based products, from culinary ingredients to beverages.
Metshu Exports (pvt), Axelum Resources Corp., and Celebes Coconut Corporation are key players in the export market, with a focus on high-quality coconut products for international consumers. PT Global rounds out the market dynamics with its diverse product line and strategic expansion initiatives.
Overall, these key players drive the global coconut products market, with their strategic initiatives encompassing innovation, sustainability, and adaptation to changing consumer preferences, thereby catering to a wide range of needs from culinary applications to health and wellness products.
Key Players in the Coconut Products Market
- The Coconut Company (UK) Ltd.
- Marico Ltd.
- Enature Organic Products
- Ayam Sarl
- Nestlé S.A.
- Renuka Foods PLC
- S & P Industries Sdn Bhd
- Shriram Coconut Products Limited
- Star Heritage Products
- Pulau Sambu Singapore Pte Ltd
- Vita Coco
- Sambu Group
- Metshu Exports (pvt)
- Axelum Resources Corp.
- Celebes Coconut Corporation
- Klassic Coconut
- Thai Coconut Public Company Limited
- Universal Coco Indonesia
- PT Global
Recent Development
- 2021: McCormick & Company acquired FONA International, a manufacturer of clean label flavors, including organic coconut flavors, for $710 million. This expands McCormick's flavor solutions business.
Report Scope
Report Features Description Market Value (2022) US$ 25.8 Bn Forecast Revenue (2032) US$ 55.1 Bn CAGR (2023-2032) 8.1% Base Year for Estimation 2022 Historic Period 2016-2022 Forecast Period 2023-2032 Report Coverage Revenue Forecast, Market Dynamics, COVID-19 Impact, Competitive Landscape, Recent Developments Segments Covered By Product Type (Skin Care, Hair Care, Perfumes & Fragrances, Color Cosmetics), By End User (Supermarket, Hypermarket, Online Channels, Others) By Skin Type (Oily, Dry, Sensitive, Normal, Combination) Regional Analysis North America - The US, Canada, Rest of North America, Europe - Germany, France, The UK, Spain, Italy, Russia, Netherlands, Rest of Europe, Asia-Pacific - China, Japan, South Korea, India, New Zealand, Singapore, Thailand, Vietnam, Rest of Asia Pacific, Latin America - Brazil, Mexico, Rest of Latin America, Middle East & Africa - South Africa, Saudi Arabia, UAE, Rest of Middle East & Africa Competitive Landscape The Coconut Company (UK) Ltd., Marico Ltd., Enature Organic Products, Ayam Sarl, Nestlé S.A., Renuka Foods PLC, S & P Industries Sdn Bhd, Shriram Coconut Products Limited, Star Heritage Products, Pulau Sambu Singapore Pte Ltd, Vita Coco, Sambu Group, Metshu Exports (pvt), Axelum Resources Corp., Celebes Coconut Corporation, Klassic Coconut, Thai Coconut Public Company Limited, Universal Coco Indonesia, PT Global Customization Scope Customization for segments, region/country-level will be provided. Moreover, additional customization can be done based on the requirements. Purchase Options We have three licenses to opt for: Single User License, Multi-User License (Up to 5 Users), Corporate Use License (Unlimited User and Printable PDF) -
- 1. Executive Summary
- 1.1. Definition
- 1.2. Taxonomy
- 1.3. Research Scope
- 1.4. Key Analysis
- 1.5. Key Findings by Major Segments
- 1.6. Top strategies by Major Players
- 2. Global Coconut Products Market Overview
- 2.1. Coconut Products Market Dynamics
- 2.1.1. Drivers
- 2.1.2. Opportunities
- 2.1.3. Restraints
- 2.1.4. Challenges
- 2.2. Macro-economic Factors
- 2.3. Regulatory Framework
- 2.4. Market Investment Feasibility Index
- 2.5. PEST Analysis
- 2.6. PORTER’S Five Force Analysis
- 2.7. Drivers & Restraints Impact Analysis
- 2.8. Industry Chain Analysis
- 2.9. Cost Structure Analysis
- 2.10. Marketing Strategy
- 2.11. Russia-Ukraine War Impact Analysis
- 2.12. Opportunity Map Analysis
- 2.13. Market Competition Scenario Analysis
- 2.14. Product Life Cycle Analysis
- 2.15. Opportunity Orbits
- 2.16. Manufacturer Intensity Map
- 2.17. Major Companies sales by Value & Volume
- 2.1. Coconut Products Market Dynamics
- 3. Global Coconut Products Market Analysis, Opportunity and Forecast, 2016-2032
- 3.1. Global Coconut Products Market Analysis, 2016-2021
- 3.2. Global Coconut Products Market Opportunity and Forecast, 2023-2032
- 3.3. Global Coconut Products Market Analysis, Opportunity and Forecast, By Product Type, 2016-2032
- 3.3.1. Global Coconut Products Market Analysis by Product Type: Introduction
- 3.3.2. Market Size Absolute $ Opportunity Analysis and Forecast, By Product Type, 2016-2032
- 3.3.3. Skin Care
- 3.3.4. Hair Care
- 3.3.5. Perfumes & Fragrance
- 3.3.6. Color Cosmetics
- 3.4. Global Coconut Products Market Analysis, Opportunity and Forecast, By End User, 2016-2032
- 3.4.1. Global Coconut Products Market Analysis by End User: Introduction
- 3.4.2. Market Size Absolute $ Opportunity Analysis and Forecast, By End User, 2016-2032
- 3.4.3. Supermarket
- 3.4.4. Hypermarket
- 3.4.5. Online Channels
- 3.4.6. Others
- 3.5. Global Coconut Products Market Analysis, Opportunity and Forecast, By Skin Type, 2016-2032
- 3.5.1. Global Coconut Products Market Analysis by Skin Type: Introduction
- 3.5.2. Market Size Absolute $ Opportunity Analysis and Forecast, By Skin Type, 2016-2032
- 3.5.3. Oily
- 3.5.4. Dry
- 3.5.5. Sensitive
- 3.5.6. Normal
- 3.5.7. Combination
- 4. North America Coconut Products Market Analysis, Opportunity and Forecast, 2016-2032
- 4.1. North America Coconut Products Market Analysis, 2016-2021
- 4.2. North America Coconut Products Market Opportunity and Forecast, 2023-2032
- 4.3. North America Coconut Products Market Analysis, Opportunity and Forecast, By Product Type, 2016-2032
- 4.3.1. North America Coconut Products Market Analysis by Product Type: Introduction
- 4.3.2. Market Size Absolute $ Opportunity Analysis and Forecast, By Product Type, 2016-2032
- 4.3.3. Skin Care
- 4.3.4. Hair Care
- 4.3.5. Perfumes & Fragrance
- 4.3.6. Color Cosmetics
- 4.4. North America Coconut Products Market Analysis, Opportunity and Forecast, By End User, 2016-2032
- 4.4.1. North America Coconut Products Market Analysis by End User: Introduction
- 4.4.2. Market Size Absolute $ Opportunity Analysis and Forecast, By End User, 2016-2032
- 4.4.3. Supermarket
- 4.4.4. Hypermarket
- 4.4.5. Online Channels
- 4.4.6. Others
- 4.5. North America Coconut Products Market Analysis, Opportunity and Forecast, By Skin Type, 2016-2032
- 4.5.1. North America Coconut Products Market Analysis by Skin Type: Introduction
- 4.5.2. Market Size Absolute $ Opportunity Analysis and Forecast, By Skin Type, 2016-2032
- 4.5.3. Oily
- 4.5.4. Dry
- 4.5.5. Sensitive
- 4.5.6. Normal
- 4.5.7. Combination
- 4.6. North America Coconut Products Market Analysis, Opportunity and Forecast, By Country , 2016-2032
- 4.6.1. North America Coconut Products Market Analysis by Country : Introduction
- 4.6.2. Market Size Absolute $ Opportunity Analysis and Forecast, Country , 2016-2032
- 4.6.2.1. The US
- 4.6.2.2. Canada
- 4.6.2.3. Mexico
- 5. Western Europe Coconut Products Market Analysis, Opportunity and Forecast, 2016-2032
- 5.1. Western Europe Coconut Products Market Analysis, 2016-2021
- 5.2. Western Europe Coconut Products Market Opportunity and Forecast, 2023-2032
- 5.3. Western Europe Coconut Products Market Analysis, Opportunity and Forecast, By Product Type, 2016-2032
- 5.3.1. Western Europe Coconut Products Market Analysis by Product Type: Introduction
- 5.3.2. Market Size Absolute $ Opportunity Analysis and Forecast, By Product Type, 2016-2032
- 5.3.3. Skin Care
- 5.3.4. Hair Care
- 5.3.5. Perfumes & Fragrance
- 5.3.6. Color Cosmetics
- 5.4. Western Europe Coconut Products Market Analysis, Opportunity and Forecast, By End User, 2016-2032
- 5.4.1. Western Europe Coconut Products Market Analysis by End User: Introduction
- 5.4.2. Market Size Absolute $ Opportunity Analysis and Forecast, By End User, 2016-2032
- 5.4.3. Supermarket
- 5.4.4. Hypermarket
- 5.4.5. Online Channels
- 5.4.6. Others
- 5.5. Western Europe Coconut Products Market Analysis, Opportunity and Forecast, By Skin Type, 2016-2032
- 5.5.1. Western Europe Coconut Products Market Analysis by Skin Type: Introduction
- 5.5.2. Market Size Absolute $ Opportunity Analysis and Forecast, By Skin Type, 2016-2032
- 5.5.3. Oily
- 5.5.4. Dry
- 5.5.5. Sensitive
- 5.5.6. Normal
- 5.5.7. Combination
- 5.6. Western Europe Coconut Products Market Analysis, Opportunity and Forecast, By Country , 2016-2032
- 5.6.1. Western Europe Coconut Products Market Analysis by Country : Introduction
- 5.6.2. Market Size Absolute $ Opportunity Analysis and Forecast, Country , 2016-2032
- 5.6.2.1. Germany
- 5.6.2.2. France
- 5.6.2.3. The UK
- 5.6.2.4. Spain
- 5.6.2.5. Italy
- 5.6.2.6. Portugal
- 5.6.2.7. Ireland
- 5.6.2.8. Austria
- 5.6.2.9. Switzerland
- 5.6.2.10. Benelux
- 5.6.2.11. Nordic
- 5.6.2.12. Rest of Western Europe
- 6. Eastern Europe Coconut Products Market Analysis, Opportunity and Forecast, 2016-2032
- 6.1. Eastern Europe Coconut Products Market Analysis, 2016-2021
- 6.2. Eastern Europe Coconut Products Market Opportunity and Forecast, 2023-2032
- 6.3. Eastern Europe Coconut Products Market Analysis, Opportunity and Forecast, By Product Type, 2016-2032
- 6.3.1. Eastern Europe Coconut Products Market Analysis by Product Type: Introduction
- 6.3.2. Market Size Absolute $ Opportunity Analysis and Forecast, By Product Type, 2016-2032
- 6.3.3. Skin Care
- 6.3.4. Hair Care
- 6.3.5. Perfumes & Fragrance
- 6.3.6. Color Cosmetics
- 6.4. Eastern Europe Coconut Products Market Analysis, Opportunity and Forecast, By End User, 2016-2032
- 6.4.1. Eastern Europe Coconut Products Market Analysis by End User: Introduction
- 6.4.2. Market Size Absolute $ Opportunity Analysis and Forecast, By End User, 2016-2032
- 6.4.3. Supermarket
- 6.4.4. Hypermarket
- 6.4.5. Online Channels
- 6.4.6. Others
- 6.5. Eastern Europe Coconut Products Market Analysis, Opportunity and Forecast, By Skin Type, 2016-2032
- 6.5.1. Eastern Europe Coconut Products Market Analysis by Skin Type: Introduction
- 6.5.2. Market Size Absolute $ Opportunity Analysis and Forecast, By Skin Type, 2016-2032
- 6.5.3. Oily
- 6.5.4. Dry
- 6.5.5. Sensitive
- 6.5.6. Normal
- 6.5.7. Combination
- 6.6. Eastern Europe Coconut Products Market Analysis, Opportunity and Forecast, By Country , 2016-2032
- 6.6.1. Eastern Europe Coconut Products Market Analysis by Country : Introduction
- 6.6.2. Market Size Absolute $ Opportunity Analysis and Forecast, Country , 2016-2032
- 6.6.2.1. Russia
- 6.6.2.2. Poland
- 6.6.2.3. The Czech Republic
- 6.6.2.4. Greece
- 6.6.2.5. Rest of Eastern Europe
- 7. APAC Coconut Products Market Analysis, Opportunity and Forecast, 2016-2032
- 7.1. APAC Coconut Products Market Analysis, 2016-2021
- 7.2. APAC Coconut Products Market Opportunity and Forecast, 2023-2032
- 7.3. APAC Coconut Products Market Analysis, Opportunity and Forecast, By Product Type, 2016-2032
- 7.3.1. APAC Coconut Products Market Analysis by Product Type: Introduction
- 7.3.2. Market Size Absolute $ Opportunity Analysis and Forecast, By Product Type, 2016-2032
- 7.3.3. Skin Care
- 7.3.4. Hair Care
- 7.3.5. Perfumes & Fragrance
- 7.3.6. Color Cosmetics
- 7.4. APAC Coconut Products Market Analysis, Opportunity and Forecast, By End User, 2016-2032
- 7.4.1. APAC Coconut Products Market Analysis by End User: Introduction
- 7.4.2. Market Size Absolute $ Opportunity Analysis and Forecast, By End User, 2016-2032
- 7.4.3. Supermarket
- 7.4.4. Hypermarket
- 7.4.5. Online Channels
- 7.4.6. Others
- 7.5. APAC Coconut Products Market Analysis, Opportunity and Forecast, By Skin Type, 2016-2032
- 7.5.1. APAC Coconut Products Market Analysis by Skin Type: Introduction
- 7.5.2. Market Size Absolute $ Opportunity Analysis and Forecast, By Skin Type, 2016-2032
- 7.5.3. Oily
- 7.5.4. Dry
- 7.5.5. Sensitive
- 7.5.6. Normal
- 7.5.7. Combination
- 7.6. APAC Coconut Products Market Analysis, Opportunity and Forecast, By Country , 2016-2032
- 7.6.1. APAC Coconut Products Market Analysis by Country : Introduction
- 7.6.2. Market Size Absolute $ Opportunity Analysis and Forecast, Country , 2016-2032
- 7.6.2.1. China
- 7.6.2.2. Japan
- 7.6.2.3. South Korea
- 7.6.2.4. India
- 7.6.2.5. Australia & New Zeland
- 7.6.2.6. Indonesia
- 7.6.2.7. Malaysia
- 7.6.2.8. Philippines
- 7.6.2.9. Singapore
- 7.6.2.10. Thailand
- 7.6.2.11. Vietnam
- 7.6.2.12. Rest of APAC
- 8. Latin America Coconut Products Market Analysis, Opportunity and Forecast, 2016-2032
- 8.1. Latin America Coconut Products Market Analysis, 2016-2021
- 8.2. Latin America Coconut Products Market Opportunity and Forecast, 2023-2032
- 8.3. Latin America Coconut Products Market Analysis, Opportunity and Forecast, By Product Type, 2016-2032
- 8.3.1. Latin America Coconut Products Market Analysis by Product Type: Introduction
- 8.3.2. Market Size Absolute $ Opportunity Analysis and Forecast, By Product Type, 2016-2032
- 8.3.3. Skin Care
- 8.3.4. Hair Care
- 8.3.5. Perfumes & Fragrance
- 8.3.6. Color Cosmetics
- 8.4. Latin America Coconut Products Market Analysis, Opportunity and Forecast, By End User, 2016-2032
- 8.4.1. Latin America Coconut Products Market Analysis by End User: Introduction
- 8.4.2. Market Size Absolute $ Opportunity Analysis and Forecast, By End User, 2016-2032
- 8.4.3. Supermarket
- 8.4.4. Hypermarket
- 8.4.5. Online Channels
- 8.4.6. Others
- 8.5. Latin America Coconut Products Market Analysis, Opportunity and Forecast, By Skin Type, 2016-2032
- 8.5.1. Latin America Coconut Products Market Analysis by Skin Type: Introduction
- 8.5.2. Market Size Absolute $ Opportunity Analysis and Forecast, By Skin Type, 2016-2032
- 8.5.3. Oily
- 8.5.4. Dry
- 8.5.5. Sensitive
- 8.5.6. Normal
- 8.5.7. Combination
- 8.6. Latin America Coconut Products Market Analysis, Opportunity and Forecast, By Country , 2016-2032
- 8.6.1. Latin America Coconut Products Market Analysis by Country : Introduction
- 8.6.2. Market Size Absolute $ Opportunity Analysis and Forecast, Country , 2016-2032
- 8.6.2.1. Brazil
- 8.6.2.2. Colombia
- 8.6.2.3. Chile
- 8.6.2.4. Argentina
- 8.6.2.5. Costa Rica
- 8.6.2.6. Rest of Latin America
- 9. Middle East & Africa Coconut Products Market Analysis, Opportunity and Forecast, 2016-2032
- 9.1. Middle East & Africa Coconut Products Market Analysis, 2016-2021
- 9.2. Middle East & Africa Coconut Products Market Opportunity and Forecast, 2023-2032
- 9.3. Middle East & Africa Coconut Products Market Analysis, Opportunity and Forecast, By Product Type, 2016-2032
- 9.3.1. Middle East & Africa Coconut Products Market Analysis by Product Type: Introduction
- 9.3.2. Market Size Absolute $ Opportunity Analysis and Forecast, By Product Type, 2016-2032
- 9.3.3. Skin Care
- 9.3.4. Hair Care
- 9.3.5. Perfumes & Fragrance
- 9.3.6. Color Cosmetics
- 9.4. Middle East & Africa Coconut Products Market Analysis, Opportunity and Forecast, By End User, 2016-2032
- 9.4.1. Middle East & Africa Coconut Products Market Analysis by End User: Introduction
- 9.4.2. Market Size Absolute $ Opportunity Analysis and Forecast, By End User, 2016-2032
- 9.4.3. Supermarket
- 9.4.4. Hypermarket
- 9.4.5. Online Channels
- 9.4.6. Others
- 9.5. Middle East & Africa Coconut Products Market Analysis, Opportunity and Forecast, By Skin Type, 2016-2032
- 9.5.1. Middle East & Africa Coconut Products Market Analysis by Skin Type: Introduction
- 9.5.2. Market Size Absolute $ Opportunity Analysis and Forecast, By Skin Type, 2016-2032
- 9.5.3. Oily
- 9.5.4. Dry
- 9.5.5. Sensitive
- 9.5.6. Normal
- 9.5.7. Combination
- 9.6. Middle East & Africa Coconut Products Market Analysis, Opportunity and Forecast, By Country , 2016-2032
- 9.6.1. Middle East & Africa Coconut Products Market Analysis by Country : Introduction
- 9.6.2. Market Size Absolute $ Opportunity Analysis and Forecast, Country , 2016-2032
- 9.6.2.1. Algeria
- 9.6.2.2. Egypt
- 9.6.2.3. Israel
- 9.6.2.4. Kuwait
- 9.6.2.5. Nigeria
- 9.6.2.6. Saudi Arabia
- 9.6.2.7. South Africa
- 9.6.2.8. Turkey
- 9.6.2.9. The UAE
- 9.6.2.10. Rest of MEA
- 10. Global Coconut Products Market Analysis, Opportunity and Forecast, By Region , 2016-2032
- 10.1. Global Coconut Products Market Analysis by Region : Introduction
- 10.2. Market Size Absolute $ Opportunity Analysis and Forecast, By Region , 2016-2032
- 10.2.1. North America
- 10.2.2. Western Europe
- 10.2.3. Eastern Europe
- 10.2.4. APAC
- 10.2.5. Latin America
- 10.2.6. Middle East & Africa
- 11. Global Coconut Products Market Competitive Landscape, Market Share Analysis, and Company Profiles
- 11.1. Market Share Analysis
- 11.2. Company Profiles
- 11.3. The Coconut Company (UK) Ltd.
- 11.3.1. Company Overview
- 11.3.2. Financial Highlights
- 11.3.3. Product Portfolio
- 11.3.4. SWOT Analysis
- 11.3.5. Key Strategies and Developments
- 11.4. Marico Ltd.
- 11.4.1. Company Overview
- 11.4.2. Financial Highlights
- 11.4.3. Product Portfolio
- 11.4.4. SWOT Analysis
- 11.4.5. Key Strategies and Developments
- 11.5. Enature Organic Products
- 11.5.1. Company Overview
- 11.5.2. Financial Highlights
- 11.5.3. Product Portfolio
- 11.5.4. SWOT Analysis
- 11.5.5. Key Strategies and Developments
- 11.6. Ayam Sarl
- 11.6.1. Company Overview
- 11.6.2. Financial Highlights
- 11.6.3. Product Portfolio
- 11.6.4. SWOT Analysis
- 11.6.5. Key Strategies and Developments
- 11.7. Nestlé S.A.
- 11.7.1. Company Overview
- 11.7.2. Financial Highlights
- 11.7.3. Product Portfolio
- 11.7.4. SWOT Analysis
- 11.7.5. Key Strategies and Developments
- 11.8. Renuka Foods PLC
- 11.8.1. Company Overview
- 11.8.2. Financial Highlights
- 11.8.3. Product Portfolio
- 11.8.4. SWOT Analysis
- 11.8.5. Key Strategies and Developments
- 11.9. S & P Industries Sdn Bhd
- 11.9.1. Company Overview
- 11.9.2. Financial Highlights
- 11.9.3. Product Portfolio
- 11.9.4. SWOT Analysis
- 11.9.5. Key Strategies and Developments
- 11.10. Shriram Coconut Products Limited
- 11.10.1. Company Overview
- 11.10.2. Financial Highlights
- 11.10.3. Product Portfolio
- 11.10.4. SWOT Analysis
- 11.10.5. Key Strategies and Developments
- 11.11. Star Heritage Products
- 11.11.1. Company Overview
- 11.11.2. Financial Highlights
- 11.11.3. Product Portfolio
- 11.11.4. SWOT Analysis
- 11.11.5. Key Strategies and Developments
- 11.12. Pulau Sambu Singapore Pte Ltd
- 11.12.1. Company Overview
- 11.12.2. Financial Highlights
- 11.12.3. Product Portfolio
- 11.12.4. SWOT Analysis
- 11.12.5. Key Strategies and Developments
- 11.13.1. Company Overview
- 11.13.2. Financial Highlights
- 11.13.3. Product Portfolio
- 11.13.4. SWOT Analysis
- 11.13.5. Key Strategies and Developments
- 11.14. Vita Coco
- 11.14.1. Company Overview
- 11.14.2. Financial Highlights
- 11.14.3. Product Portfolio
- 11.14.4. SWOT Analysis
- 11.14.5. Key Strategies and Developments
- 11.15. Metshu Exports (pvt)
- 11.15.1. Company Overview
- 11.15.2. Financial Highlights
- 11.15.3. Product Portfolio
- 11.15.4. SWOT Analysis
- 11.15.5. Key Strategies and Developments
- 11.16. Axelum Resources Corp.
- 11.16.1. Company Overview
- 11.16.2. Financial Highlights
- 11.16.3. Product Portfolio
- 11.16.4. SWOT Analysis
- 11.16.5. Key Strategies and Developments
- 11.17. Celebes Coconut Corporation
- 11.17.1. Company Overview
- 11.17.2. Financial Highlights
- 11.17.3. Product Portfolio
- 11.17.4. SWOT Analysis
- 11.17.5. Key Strategies and Developments
- 11.18. Klassic Coconut
- 11.18.1. Company Overview
- 11.18.2. Financial Highlights
- 11.18.3. Product Portfolio
- 11.18.4. SWOT Analysis
- 11.18.5. Key Strategies and Developments
- 11.19. Thai Coconut Public Company Limited
- 11.19.1. Company Overview
- 11.19.2. Financial Highlights
- 11.19.3. Product Portfolio
- 11.19.4. SWOT Analysis
- 11.19.5. Key Strategies and Developments
- 11.20. Universal Coco Indonesia
- 11.20.1. Company Overview
- 11.20.2. Financial Highlights
- 11.20.3. Product Portfolio
- 11.20.4. SWOT Analysis
- 11.20.5. Key Strategies and Developments
- 11.21. PT Global
- 11.21.1. Company Overview
- 11.21.2. Financial Highlights
- 11.21.3. Product Portfolio
- 11.21.4. SWOT Analysis
- 11.21.5. Key Strategies and Developments
- 11.22. Other Key Players
- 11.22.1. Company Overview
- 11.22.2. Financial Highlights
- 11.22.3. Product Portfolio
- 11.22.4. SWOT Analysis
- 11.22.5. Key Strategies and Developments
- 12. Assumptions and Acronyms
- 13. Research Methodology
- 14. Contact
- List of Figures
- Figure 1: Global Coconut Products Market Revenue (US$ Mn) Market Share by Product Type in 2022
- Figure 2: Global Coconut Products Market Attractiveness Analysis by Product Type, 2016-2032
- Figure 3: Global Coconut Products Market Revenue (US$ Mn) Market Share by End Userin 2022
- Figure 4: Global Coconut Products Market Attractiveness Analysis by End User, 2016-2032
- Figure 5: Global Coconut Products Market Revenue (US$ Mn) Market Share by Skin Typein 2022
- Figure 6: Global Coconut Products Market Attractiveness Analysis by Skin Type, 2016-2032
- Figure 7: Global Coconut Products Market Revenue (US$ Mn) Market Share by Region in 2022
- Figure 8: Global Coconut Products Market Attractiveness Analysis by Region, 2016-2032
- Figure 9: Global Coconut Products Market Revenue (US$ Mn) (2016-2032)
- Figure 10: Global Coconut Products Market Revenue (US$ Mn) Comparison by Region (2016-2032)
- Figure 11: Global Coconut Products Market Revenue (US$ Mn) Comparison by Product Type (2016-2032)
- Figure 12: Global Coconut Products Market Revenue (US$ Mn) Comparison by End User (2016-2032)
- Figure 13: Global Coconut Products Market Revenue (US$ Mn) Comparison by Skin Type (2016-2032)
- Figure 14: Global Coconut Products Market Y-o-Y Growth Rate Comparison by Region (2016-2032)
- Figure 15: Global Coconut Products Market Y-o-Y Growth Rate Comparison by Product Type (2016-2032)
- Figure 16: Global Coconut Products Market Y-o-Y Growth Rate Comparison by End User (2016-2032)
- Figure 17: Global Coconut Products Market Y-o-Y Growth Rate Comparison by Skin Type (2016-2032)
- Figure 18: Global Coconut Products Market Share Comparison by Region (2016-2032)
- Figure 19: Global Coconut Products Market Share Comparison by Product Type (2016-2032)
- Figure 20: Global Coconut Products Market Share Comparison by End User (2016-2032)
- Figure 21: Global Coconut Products Market Share Comparison by Skin Type (2016-2032)
- Figure 22: North America Coconut Products Market Revenue (US$ Mn) Market Share by Product Typein 2022
- Figure 23: North America Coconut Products Market Attractiveness Analysis by Product Type, 2016-2032
- Figure 24: North America Coconut Products Market Revenue (US$ Mn) Market Share by End Userin 2022
- Figure 25: North America Coconut Products Market Attractiveness Analysis by End User, 2016-2032
- Figure 26: North America Coconut Products Market Revenue (US$ Mn) Market Share by Skin Typein 2022
- Figure 27: North America Coconut Products Market Attractiveness Analysis by Skin Type, 2016-2032
- Figure 28: North America Coconut Products Market Revenue (US$ Mn) Market Share by Country in 2022
- Figure 29: North America Coconut Products Market Attractiveness Analysis by Country, 2016-2032
- Figure 30: North America Coconut Products Market Revenue (US$ Mn) (2016-2032)
- Figure 31: North America Coconut Products Market Revenue (US$ Mn) Comparison by Country (2016-2032)
- Figure 32: North America Coconut Products Market Revenue (US$ Mn) Comparison by Product Type (2016-2032)
- Figure 33: North America Coconut Products Market Revenue (US$ Mn) Comparison by End User (2016-2032)
- Figure 34: North America Coconut Products Market Revenue (US$ Mn) Comparison by Skin Type (2016-2032)
- Figure 35: North America Coconut Products Market Y-o-Y Growth Rate Comparison by Country (2016-2032)
- Figure 36: North America Coconut Products Market Y-o-Y Growth Rate Comparison by Product Type (2016-2032)
- Figure 37: North America Coconut Products Market Y-o-Y Growth Rate Comparison by End User (2016-2032)
- Figure 38: North America Coconut Products Market Y-o-Y Growth Rate Comparison by Skin Type (2016-2032)
- Figure 39: North America Coconut Products Market Share Comparison by Country (2016-2032)
- Figure 40: North America Coconut Products Market Share Comparison by Product Type (2016-2032)
- Figure 41: North America Coconut Products Market Share Comparison by End User (2016-2032)
- Figure 42: North America Coconut Products Market Share Comparison by Skin Type (2016-2032)
- Figure 43: Western Europe Coconut Products Market Revenue (US$ Mn) Market Share by Product Typein 2022
- Figure 44: Western Europe Coconut Products Market Attractiveness Analysis by Product Type, 2016-2032
- Figure 45: Western Europe Coconut Products Market Revenue (US$ Mn) Market Share by End Userin 2022
- Figure 46: Western Europe Coconut Products Market Attractiveness Analysis by End User, 2016-2032
- Figure 47: Western Europe Coconut Products Market Revenue (US$ Mn) Market Share by Skin Typein 2022
- Figure 48: Western Europe Coconut Products Market Attractiveness Analysis by Skin Type, 2016-2032
- Figure 49: Western Europe Coconut Products Market Revenue (US$ Mn) Market Share by Country in 2022
- Figure 50: Western Europe Coconut Products Market Attractiveness Analysis by Country, 2016-2032
- Figure 51: Western Europe Coconut Products Market Revenue (US$ Mn) (2016-2032)
- Figure 52: Western Europe Coconut Products Market Revenue (US$ Mn) Comparison by Country (2016-2032)
- Figure 53: Western Europe Coconut Products Market Revenue (US$ Mn) Comparison by Product Type (2016-2032)
- Figure 54: Western Europe Coconut Products Market Revenue (US$ Mn) Comparison by End User (2016-2032)
- Figure 55: Western Europe Coconut Products Market Revenue (US$ Mn) Comparison by Skin Type (2016-2032)
- Figure 56: Western Europe Coconut Products Market Y-o-Y Growth Rate Comparison by Country (2016-2032)
- Figure 57: Western Europe Coconut Products Market Y-o-Y Growth Rate Comparison by Product Type (2016-2032)
- Figure 58: Western Europe Coconut Products Market Y-o-Y Growth Rate Comparison by End User (2016-2032)
- Figure 59: Western Europe Coconut Products Market Y-o-Y Growth Rate Comparison by Skin Type (2016-2032)
- Figure 60: Western Europe Coconut Products Market Share Comparison by Country (2016-2032)
- Figure 61: Western Europe Coconut Products Market Share Comparison by Product Type (2016-2032)
- Figure 62: Western Europe Coconut Products Market Share Comparison by End User (2016-2032)
- Figure 63: Western Europe Coconut Products Market Share Comparison by Skin Type (2016-2032)
- Figure 64: Eastern Europe Coconut Products Market Revenue (US$ Mn) Market Share by Product Typein 2022
- Figure 65: Eastern Europe Coconut Products Market Attractiveness Analysis by Product Type, 2016-2032
- Figure 66: Eastern Europe Coconut Products Market Revenue (US$ Mn) Market Share by End Userin 2022
- Figure 67: Eastern Europe Coconut Products Market Attractiveness Analysis by End User, 2016-2032
- Figure 68: Eastern Europe Coconut Products Market Revenue (US$ Mn) Market Share by Skin Typein 2022
- Figure 69: Eastern Europe Coconut Products Market Attractiveness Analysis by Skin Type, 2016-2032
- Figure 70: Eastern Europe Coconut Products Market Revenue (US$ Mn) Market Share by Country in 2022
- Figure 71: Eastern Europe Coconut Products Market Attractiveness Analysis by Country, 2016-2032
- Figure 72: Eastern Europe Coconut Products Market Revenue (US$ Mn) (2016-2032)
- Figure 73: Eastern Europe Coconut Products Market Revenue (US$ Mn) Comparison by Country (2016-2032)
- Figure 74: Eastern Europe Coconut Products Market Revenue (US$ Mn) Comparison by Product Type (2016-2032)
- Figure 75: Eastern Europe Coconut Products Market Revenue (US$ Mn) Comparison by End User (2016-2032)
- Figure 76: Eastern Europe Coconut Products Market Revenue (US$ Mn) Comparison by Skin Type (2016-2032)
- Figure 77: Eastern Europe Coconut Products Market Y-o-Y Growth Rate Comparison by Country (2016-2032)
- Figure 78: Eastern Europe Coconut Products Market Y-o-Y Growth Rate Comparison by Product Type (2016-2032)
- Figure 79: Eastern Europe Coconut Products Market Y-o-Y Growth Rate Comparison by End User (2016-2032)
- Figure 80: Eastern Europe Coconut Products Market Y-o-Y Growth Rate Comparison by Skin Type (2016-2032)
- Figure 81: Eastern Europe Coconut Products Market Share Comparison by Country (2016-2032)
- Figure 82: Eastern Europe Coconut Products Market Share Comparison by Product Type (2016-2032)
- Figure 83: Eastern Europe Coconut Products Market Share Comparison by End User (2016-2032)
- Figure 84: Eastern Europe Coconut Products Market Share Comparison by Skin Type (2016-2032)
- Figure 85: APAC Coconut Products Market Revenue (US$ Mn) Market Share by Product Typein 2022
- Figure 86: APAC Coconut Products Market Attractiveness Analysis by Product Type, 2016-2032
- Figure 87: APAC Coconut Products Market Revenue (US$ Mn) Market Share by End Userin 2022
- Figure 88: APAC Coconut Products Market Attractiveness Analysis by End User, 2016-2032
- Figure 89: APAC Coconut Products Market Revenue (US$ Mn) Market Share by Skin Typein 2022
- Figure 90: APAC Coconut Products Market Attractiveness Analysis by Skin Type, 2016-2032
- Figure 91: APAC Coconut Products Market Revenue (US$ Mn) Market Share by Country in 2022
- Figure 92: APAC Coconut Products Market Attractiveness Analysis by Country, 2016-2032
- Figure 93: APAC Coconut Products Market Revenue (US$ Mn) (2016-2032)
- Figure 94: APAC Coconut Products Market Revenue (US$ Mn) Comparison by Country (2016-2032)
- Figure 95: APAC Coconut Products Market Revenue (US$ Mn) Comparison by Product Type (2016-2032)
- Figure 96: APAC Coconut Products Market Revenue (US$ Mn) Comparison by End User (2016-2032)
- Figure 97: APAC Coconut Products Market Revenue (US$ Mn) Comparison by Skin Type (2016-2032)
- Figure 98: APAC Coconut Products Market Y-o-Y Growth Rate Comparison by Country (2016-2032)
- Figure 99: APAC Coconut Products Market Y-o-Y Growth Rate Comparison by Product Type (2016-2032)
- Figure 100: APAC Coconut Products Market Y-o-Y Growth Rate Comparison by End User (2016-2032)
- Figure 101: APAC Coconut Products Market Y-o-Y Growth Rate Comparison by Skin Type (2016-2032)
- Figure 102: APAC Coconut Products Market Share Comparison by Country (2016-2032)
- Figure 103: APAC Coconut Products Market Share Comparison by Product Type (2016-2032)
- Figure 104: APAC Coconut Products Market Share Comparison by End User (2016-2032)
- Figure 105: APAC Coconut Products Market Share Comparison by Skin Type (2016-2032)
- Figure 106: Latin America Coconut Products Market Revenue (US$ Mn) Market Share by Product Typein 2022
- Figure 107: Latin America Coconut Products Market Attractiveness Analysis by Product Type, 2016-2032
- Figure 108: Latin America Coconut Products Market Revenue (US$ Mn) Market Share by End Userin 2022
- Figure 109: Latin America Coconut Products Market Attractiveness Analysis by End User, 2016-2032
- Figure 110: Latin America Coconut Products Market Revenue (US$ Mn) Market Share by Skin Typein 2022
- Figure 111: Latin America Coconut Products Market Attractiveness Analysis by Skin Type, 2016-2032
- Figure 112: Latin America Coconut Products Market Revenue (US$ Mn) Market Share by Country in 2022
- Figure 113: Latin America Coconut Products Market Attractiveness Analysis by Country, 2016-2032
- Figure 114: Latin America Coconut Products Market Revenue (US$ Mn) (2016-2032)
- Figure 115: Latin America Coconut Products Market Revenue (US$ Mn) Comparison by Country (2016-2032)
- Figure 116: Latin America Coconut Products Market Revenue (US$ Mn) Comparison by Product Type (2016-2032)
- Figure 117: Latin America Coconut Products Market Revenue (US$ Mn) Comparison by End User (2016-2032)
- Figure 118: Latin America Coconut Products Market Revenue (US$ Mn) Comparison by Skin Type (2016-2032)
- Figure 119: Latin America Coconut Products Market Y-o-Y Growth Rate Comparison by Country (2016-2032)
- Figure 120: Latin America Coconut Products Market Y-o-Y Growth Rate Comparison by Product Type (2016-2032)
- Figure 121: Latin America Coconut Products Market Y-o-Y Growth Rate Comparison by End User (2016-2032)
- Figure 122: Latin America Coconut Products Market Y-o-Y Growth Rate Comparison by Skin Type (2016-2032)
- Figure 123: Latin America Coconut Products Market Share Comparison by Country (2016-2032)
- Figure 124: Latin America Coconut Products Market Share Comparison by Product Type (2016-2032)
- Figure 125: Latin America Coconut Products Market Share Comparison by End User (2016-2032)
- Figure 126: Latin America Coconut Products Market Share Comparison by Skin Type (2016-2032)
- Figure 127: Middle East & Africa Coconut Products Market Revenue (US$ Mn) Market Share by Product Typein 2022
- Figure 128: Middle East & Africa Coconut Products Market Attractiveness Analysis by Product Type, 2016-2032
- Figure 129: Middle East & Africa Coconut Products Market Revenue (US$ Mn) Market Share by End Userin 2022
- Figure 130: Middle East & Africa Coconut Products Market Attractiveness Analysis by End User, 2016-2032
- Figure 131: Middle East & Africa Coconut Products Market Revenue (US$ Mn) Market Share by Skin Typein 2022
- Figure 132: Middle East & Africa Coconut Products Market Attractiveness Analysis by Skin Type, 2016-2032
- Figure 133: Middle East & Africa Coconut Products Market Revenue (US$ Mn) Market Share by Country in 2022
- Figure 134: Middle East & Africa Coconut Products Market Attractiveness Analysis by Country, 2016-2032
- Figure 135: Middle East & Africa Coconut Products Market Revenue (US$ Mn) (2016-2032)
- Figure 136: Middle East & Africa Coconut Products Market Revenue (US$ Mn) Comparison by Country (2016-2032)
- Figure 137: Middle East & Africa Coconut Products Market Revenue (US$ Mn) Comparison by Product Type (2016-2032)
- Figure 138: Middle East & Africa Coconut Products Market Revenue (US$ Mn) Comparison by End User (2016-2032)
- Figure 139: Middle East & Africa Coconut Products Market Revenue (US$ Mn) Comparison by Skin Type (2016-2032)
- Figure 140: Middle East & Africa Coconut Products Market Y-o-Y Growth Rate Comparison by Country (2016-2032)
- Figure 141: Middle East & Africa Coconut Products Market Y-o-Y Growth Rate Comparison by Product Type (2016-2032)
- Figure 142: Middle East & Africa Coconut Products Market Y-o-Y Growth Rate Comparison by End User (2016-2032)
- Figure 143: Middle East & Africa Coconut Products Market Y-o-Y Growth Rate Comparison by Skin Type (2016-2032)
- Figure 144: Middle East & Africa Coconut Products Market Share Comparison by Country (2016-2032)
- Figure 145: Middle East & Africa Coconut Products Market Share Comparison by Product Type (2016-2032)
- Figure 146: Middle East & Africa Coconut Products Market Share Comparison by End User (2016-2032)
- Figure 147: Middle East & Africa Coconut Products Market Share Comparison by Skin Type (2016-2032)
- List of Tables
- Table 1: Global Coconut Products Market Comparison by Product Type (2016-2032)
- Table 2: Global Coconut Products Market Comparison by End User (2016-2032)
- Table 3: Global Coconut Products Market Comparison by Skin Type (2016-2032)
- Table 4: Global Coconut Products Market Revenue (US$ Mn) Comparison by Region (2016-2032)
- Table 5: Global Coconut Products Market Revenue (US$ Mn) (2016-2032)
- Table 6: Global Coconut Products Market Revenue (US$ Mn) Comparison by Region (2016-2032)
- Table 7: Global Coconut Products Market Revenue (US$ Mn) Comparison by Product Type (2016-2032)
- Table 8: Global Coconut Products Market Revenue (US$ Mn) Comparison by End User (2016-2032)
- Table 9: Global Coconut Products Market Revenue (US$ Mn) Comparison by Skin Type (2016-2032)
- Table 10: Global Coconut Products Market Y-o-Y Growth Rate Comparison by Region (2016-2032)
- Table 11: Global Coconut Products Market Y-o-Y Growth Rate Comparison by Product Type (2016-2032)
- Table 12: Global Coconut Products Market Y-o-Y Growth Rate Comparison by End User (2016-2032)
- Table 13: Global Coconut Products Market Y-o-Y Growth Rate Comparison by Skin Type (2016-2032)
- Table 14: Global Coconut Products Market Share Comparison by Region (2016-2032)
- Table 15: Global Coconut Products Market Share Comparison by Product Type (2016-2032)
- Table 16: Global Coconut Products Market Share Comparison by End User (2016-2032)
- Table 17: Global Coconut Products Market Share Comparison by Skin Type (2016-2032)
- Table 18: North America Coconut Products Market Comparison by End User (2016-2032)
- Table 19: North America Coconut Products Market Comparison by Skin Type (2016-2032)
- Table 20: North America Coconut Products Market Revenue (US$ Mn) Comparison by Country (2016-2032)
- Table 21: North America Coconut Products Market Revenue (US$ Mn) (2016-2032)
- Table 22: North America Coconut Products Market Revenue (US$ Mn) Comparison by Country (2016-2032)
- Table 23: North America Coconut Products Market Revenue (US$ Mn) Comparison by Product Type (2016-2032)
- Table 24: North America Coconut Products Market Revenue (US$ Mn) Comparison by End User (2016-2032)
- Table 25: North America Coconut Products Market Revenue (US$ Mn) Comparison by Skin Type (2016-2032)
- Table 26: North America Coconut Products Market Y-o-Y Growth Rate Comparison by Country (2016-2032)
- Table 27: North America Coconut Products Market Y-o-Y Growth Rate Comparison by Product Type (2016-2032)
- Table 28: North America Coconut Products Market Y-o-Y Growth Rate Comparison by End User (2016-2032)
- Table 29: North America Coconut Products Market Y-o-Y Growth Rate Comparison by Skin Type (2016-2032)
- Table 30: North America Coconut Products Market Share Comparison by Country (2016-2032)
- Table 31: North America Coconut Products Market Share Comparison by Product Type (2016-2032)
- Table 32: North America Coconut Products Market Share Comparison by End User (2016-2032)
- Table 33: North America Coconut Products Market Share Comparison by Skin Type (2016-2032)
- Table 34: Western Europe Coconut Products Market Comparison by Product Type (2016-2032)
- Table 35: Western Europe Coconut Products Market Comparison by End User (2016-2032)
- Table 36: Western Europe Coconut Products Market Comparison by Skin Type (2016-2032)
- Table 37: Western Europe Coconut Products Market Revenue (US$ Mn) Comparison by Country (2016-2032)
- Table 38: Western Europe Coconut Products Market Revenue (US$ Mn) (2016-2032)
- Table 39: Western Europe Coconut Products Market Revenue (US$ Mn) Comparison by Country (2016-2032)
- Table 40: Western Europe Coconut Products Market Revenue (US$ Mn) Comparison by Product Type (2016-2032)
- Table 41: Western Europe Coconut Products Market Revenue (US$ Mn) Comparison by End User (2016-2032)
- Table 42: Western Europe Coconut Products Market Revenue (US$ Mn) Comparison by Skin Type (2016-2032)
- Table 43: Western Europe Coconut Products Market Y-o-Y Growth Rate Comparison by Country (2016-2032)
- Table 44: Western Europe Coconut Products Market Y-o-Y Growth Rate Comparison by Product Type (2016-2032)
- Table 45: Western Europe Coconut Products Market Y-o-Y Growth Rate Comparison by End User (2016-2032)
- Table 46: Western Europe Coconut Products Market Y-o-Y Growth Rate Comparison by Skin Type (2016-2032)
- Table 47: Western Europe Coconut Products Market Share Comparison by Country (2016-2032)
- Table 48: Western Europe Coconut Products Market Share Comparison by Product Type (2016-2032)
- Table 49: Western Europe Coconut Products Market Share Comparison by End User (2016-2032)
- Table 50: Western Europe Coconut Products Market Share Comparison by Skin Type (2016-2032)
- Table 51: Eastern Europe Coconut Products Market Comparison by Product Type (2016-2032)
- Table 52: Eastern Europe Coconut Products Market Comparison by End User (2016-2032)
- Table 53: Eastern Europe Coconut Products Market Comparison by Skin Type (2016-2032)
- Table 54: Eastern Europe Coconut Products Market Revenue (US$ Mn) Comparison by Country (2016-2032)
- Table 55: Eastern Europe Coconut Products Market Revenue (US$ Mn) (2016-2032)
- Table 56: Eastern Europe Coconut Products Market Revenue (US$ Mn) Comparison by Country (2016-2032)
- Table 57: Eastern Europe Coconut Products Market Revenue (US$ Mn) Comparison by Product Type (2016-2032)
- Table 58: Eastern Europe Coconut Products Market Revenue (US$ Mn) Comparison by End User (2016-2032)
- Table 59: Eastern Europe Coconut Products Market Revenue (US$ Mn) Comparison by Skin Type (2016-2032)
- Table 60: Eastern Europe Coconut Products Market Y-o-Y Growth Rate Comparison by Country (2016-2032)
- Table 61: Eastern Europe Coconut Products Market Y-o-Y Growth Rate Comparison by Product Type (2016-2032)
- Table 62: Eastern Europe Coconut Products Market Y-o-Y Growth Rate Comparison by End User (2016-2032)
- Table 63: Eastern Europe Coconut Products Market Y-o-Y Growth Rate Comparison by Skin Type (2016-2032)
- Table 64: Eastern Europe Coconut Products Market Share Comparison by Country (2016-2032)
- Table 65: Eastern Europe Coconut Products Market Share Comparison by Product Type (2016-2032)
- Table 66: Eastern Europe Coconut Products Market Share Comparison by End User (2016-2032)
- Table 67: Eastern Europe Coconut Products Market Share Comparison by Skin Type (2016-2032)
- Table 68: APAC Coconut Products Market Comparison by Product Type (2016-2032)
- Table 69: APAC Coconut Products Market Comparison by End User (2016-2032)
- Table 70: APAC Coconut Products Market Comparison by Skin Type (2016-2032)
- Table 71: APAC Coconut Products Market Revenue (US$ Mn) Comparison by Country (2016-2032)
- Table 72: APAC Coconut Products Market Revenue (US$ Mn) (2016-2032)
- Table 73: APAC Coconut Products Market Revenue (US$ Mn) Comparison by Country (2016-2032)
- Table 74: APAC Coconut Products Market Revenue (US$ Mn) Comparison by Product Type (2016-2032)
- Table 75: APAC Coconut Products Market Revenue (US$ Mn) Comparison by End User (2016-2032)
- Table 76: APAC Coconut Products Market Revenue (US$ Mn) Comparison by Skin Type (2016-2032)
- Table 77: APAC Coconut Products Market Y-o-Y Growth Rate Comparison by Country (2016-2032)
- Table 78: APAC Coconut Products Market Y-o-Y Growth Rate Comparison by Product Type (2016-2032)
- Table 79: APAC Coconut Products Market Y-o-Y Growth Rate Comparison by End User (2016-2032)
- Table 80: APAC Coconut Products Market Y-o-Y Growth Rate Comparison by Skin Type (2016-2032)
- Table 81: APAC Coconut Products Market Share Comparison by Country (2016-2032)
- Table 82: APAC Coconut Products Market Share Comparison by Product Type (2016-2032)
- Table 83: APAC Coconut Products Market Share Comparison by End User (2016-2032)
- Table 84: APAC Coconut Products Market Share Comparison by Skin Type (2016-2032)
- Table 85: Latin America Coconut Products Market Comparison by Product Type (2016-2032)
- Table 86: Latin America Coconut Products Market Comparison by End User (2016-2032)
- Table 87: Latin America Coconut Products Market Comparison by Skin Type (2016-2032)
- Table 88: Latin America Coconut Products Market Revenue (US$ Mn) Comparison by Country (2016-2032)
- Table 89: Latin America Coconut Products Market Revenue (US$ Mn) (2016-2032)
- Table 90: Latin America Coconut Products Market Revenue (US$ Mn) Comparison by Country (2016-2032)
- Table 91: Latin America Coconut Products Market Revenue (US$ Mn) Comparison by Product Type (2016-2032)
- Table 92: Latin America Coconut Products Market Revenue (US$ Mn) Comparison by End User (2016-2032)
- Table 93: Latin America Coconut Products Market Revenue (US$ Mn) Comparison by Skin Type (2016-2032)
- Table 94: Latin America Coconut Products Market Y-o-Y Growth Rate Comparison by Country (2016-2032)
- Table 95: Latin America Coconut Products Market Y-o-Y Growth Rate Comparison by Product Type (2016-2032)
- Table 96: Latin America Coconut Products Market Y-o-Y Growth Rate Comparison by End User (2016-2032)
- Table 97: Latin America Coconut Products Market Y-o-Y Growth Rate Comparison by Skin Type (2016-2032)
- Table 98: Latin America Coconut Products Market Share Comparison by Country (2016-2032)
- Table 99: Latin America Coconut Products Market Share Comparison by Product Type (2016-2032)
- Table 100: Latin America Coconut Products Market Share Comparison by End User (2016-2032)
- Table 101: Latin America Coconut Products Market Share Comparison by Skin Type (2016-2032)
- Table 102: Middle East & Africa Coconut Products Market Comparison by Product Type (2016-2032)
- Table 103: Middle East & Africa Coconut Products Market Comparison by End User (2016-2032)
- Table 104: Middle East & Africa Coconut Products Market Comparison by Skin Type (2016-2032)
- Table 105: Middle East & Africa Coconut Products Market Revenue (US$ Mn) Comparison by Country (2016-2032)
- Table 106: Middle East & Africa Coconut Products Market Revenue (US$ Mn) (2016-2032)
- Table 107: Middle East & Africa Coconut Products Market Revenue (US$ Mn) Comparison by Country (2016-2032)
- Table 108: Middle East & Africa Coconut Products Market Revenue (US$ Mn) Comparison by Product Type (2016-2032)
- Table 109: Middle East & Africa Coconut Products Market Revenue (US$ Mn) Comparison by End User (2016-2032)
- Table 110: Middle East & Africa Coconut Products Market Revenue (US$ Mn) Comparison by Skin Type (2016-2032)
- Table 111: Middle East & Africa Coconut Products Market Y-o-Y Growth Rate Comparison by Country (2016-2032)
- Table 112: Middle East & Africa Coconut Products Market Y-o-Y Growth Rate Comparison by Product Type (2016-2032)
- Table 113: Middle East & Africa Coconut Products Market Y-o-Y Growth Rate Comparison by End User (2016-2032)
- Table 114: Middle East & Africa Coconut Products Market Y-o-Y Growth Rate Comparison by Skin Type (2016-2032)
- Table 115: Middle East & Africa Coconut Products Market Share Comparison by Country (2016-2032)
- Table 116: Middle East & Africa Coconut Products Market Share Comparison by Product Type (2016-2032)
- Table 117: Middle East & Africa Coconut Products Market Share Comparison by End User (2016-2032)
- Table 118: Middle East & Africa Coconut Products Market Share Comparison by Skin Type (2016-2032)
- 1. Executive Summary
-
- The Coconut Company (UK) Ltd.
- Marico Ltd.
- Enature Organic Products
- Ayam Sarl
- Nestlé S.A.
- Renuka Foods PLC
- S & P Industries Sdn Bhd
- Shriram Coconut Products Limited
- Star Heritage Products
- Pulau Sambu Singapore Pte Ltd
- Vita Coco
- Sambu Group
- Metshu Exports (pvt)
- Axelum Resources Corp.
- Celebes Coconut Corporation
- Klassic Coconut
- Thai Coconut Public Company Limited
- Universal Coco Indonesia
- PT Global
Our Clients


View Our Licence Options
