
Chatbot Market Report By Platform Type (Web-based, Mobile-based), By Deployment Type (Cloud-based, On-premises), By Service Type (Rule-based Chatbots, AI-based Chatbots), By Usage Type (Customer Service, Marketing, Sales, Others), By Industry Vertical (Retail & E-commerce, Banking, Financial Services, and Insurance [BFSI], Healthcare, Telecommunications, Travel & Hospitality, Government, Others), By Region and Companies - Industry Segment Outlook, Market Assessment, Competition Scenario, Trends and Forecast 2024-2033
-
3287
-
July 2024
-
298
-


-
This report was compiled by Vishwa Gaul Vishwa is an experienced market research and consulting professional with over 8 years of expertise in the ICT industry, contributing to over 700 reports across telecommunications, software, hardware, and digital solutions. Correspondence Team Lead- ICT Linkedin | Detailed Market research Methodology Our methodology involves a mix of primary research, including interviews with leading mental health experts, and secondary research from reputable medical journals and databases. View Detailed Methodology Page
-
Quick Navigation
Report Overview
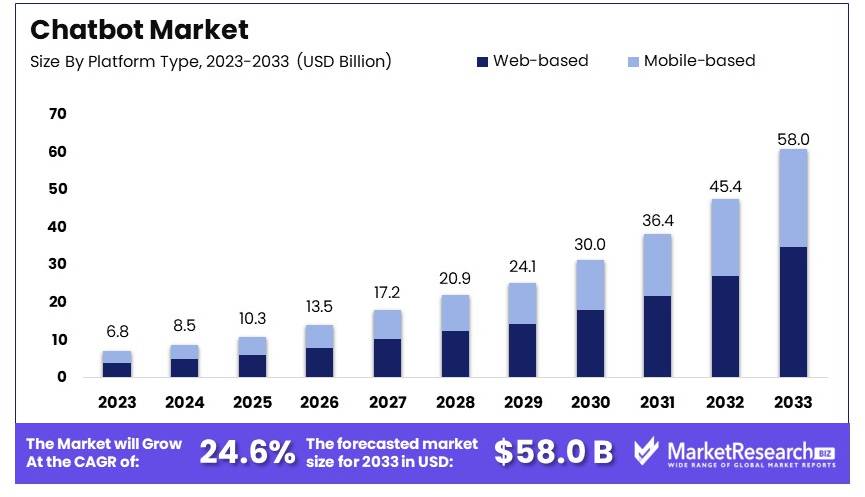
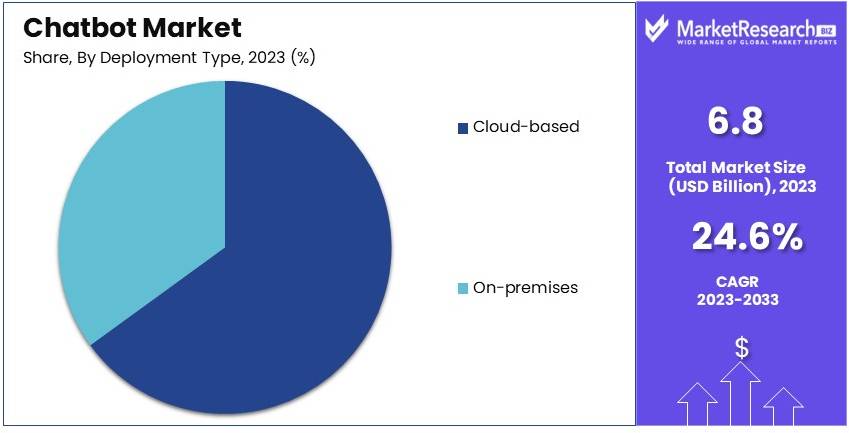
The Global Chatbot Market size is expected to be worth around USD 58.0 Billion by 2033, from USD 6.8 Billion in 2023, growing at a CAGR of 24.6% during the forecast period from 2024 to 2033.
The Chatbot Market comprises companies that develop and deploy interactive software applications utilizing artificial intelligence (AI) and natural language processing (NLP) technologies. These applications, known as chatbots, simulate conversation with users through messaging platforms, websites, or mobile apps.
Chatbots are designed to streamline customer service, automate engagement, and provide 24/7 assistance without human intervention. The market is characterized by rapid innovation and significant investment, as businesses across various sectors, including retail, healthcare, and finance, adopt chatbot solutions to enhance customer interaction, drive sales, and reduce operational costs. The proliferation of smartphones and increased consumer demand for real-time communication are major growth drivers in this dynamic sector.
The chatbot market is experiencing significant growth, driven by advancements in artificial intelligence and increasing adoption across various industries. In the financial sector, chatbots have emerged as a transformative tool for enhancing customer service efficiency. Data indicates that approximately 43% of banking customers prefer interacting with chatbots for issue resolution, appreciating the average time savings of four minutes per inquiry. This efficiency not only boosts customer satisfaction but also aligns with the sector's cost-reduction strategies.
In retail, the impact of chatbots is equally pronounced, with over 600 million shoppers worldwide utilizing these technologies. By facilitating smoother transactions and interactions, chatbots are anticipated to generate approximately $11 billion in cost savings by 2023. This substantial figure underscores the role of chatbots in streamlining operations and enhancing the consumer experience.
The healthcare sector has also capitalized on the capabilities of chatbots, particularly in automating administrative tasks. An impressive 73% of routine tasks have been automated, leading to an estimated global cost saving of $3.6 billion. This adoption is indicative of a broader trend where AI-driven solutions, like chatbots, are increasingly leveraged to improve operational efficiencies and reduce expenses across diverse sectors. Moreover, the advancement of generative AI in chatbots paves the way for more sophisticated virtual assistants capable of performing complex tasks and providing comprehensive support.
Collectively, these data points highlight the pivotal role of chatbots in driving sector-specific advancements while contributing to the overall efficiency and cost-effectiveness of business operations. As industries continue to embrace digital transformation, the integration of chatbot technologies is expected to play a central role in shaping future market dynamics and growth trajectories.
Key Takeaways
- Market Value: The Chatbot Market was valued at USD 6.8 billion in 2023 and is expected to reach USD 58.0 billion by 2033, with a CAGR of 24.6%.
- Platform Type Analysis: Web-based chatbots dominate at 55%, offering widespread accessibility and user engagement.
- Deployment Type Analysis: Cloud-based chatbots lead with 65%, providing scalability and ease of integration.
- Service Type Analysis: AI-based chatbots dominate at 70%, enhancing customer interactions with advanced AI capabilities.
- Usage Type Analysis: Customer service chatbots lead at 60%, significantly improving customer support efficiency.
- Industry Vertical Analysis: Retail & E-commerce dominate at 50%, leveraging chatbots for enhanced customer engagement.
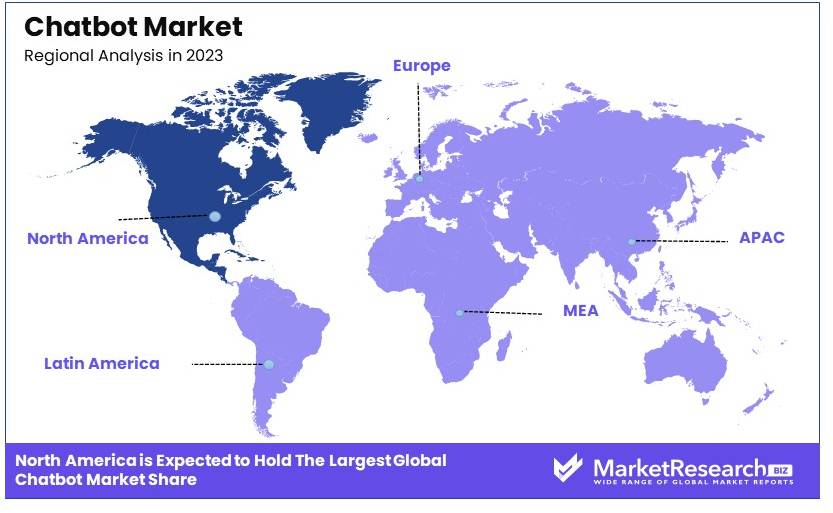
- Dominant Region: North America leads with 33%, driven by high adoption rates of advanced technologies.
- High Growth Region: Asia-Pacific is expected to grow rapidly, driven by increasing digital transformation initiatives.
- Analyst Viewpoint: The chatbot market shows strong growth potential, with increasing adoption across various industries. The market is becoming highly competitive with continuous innovations.
Driving Factors
Increasing Demand for Enhanced Customer Experience Drives Market Growth
The escalating expectation for superior customer service is significantly propelling the chatbot market. Chatbots, functioning as automated solutions, excel in providing immediate and personalized customer interactions around the clock. This capability is crucial in enhancing customer satisfaction and retention, vital metrics in today’s competitive landscape. For instance, notable companies such as Spotify and Sephora have successfully integrated chatbots to offer real-time support, effectively boosting user engagement and operational efficiency.
As per a Salesforce report, 23% of customer service organizations are using AI chatbots with an additional 31% planning to incorporate them in the future, underscoring the trend towards automated customer service solutions. The synergy between chatbots and enhanced customer experience not only drives direct consumer satisfaction but also indirectly supports sales and marketing strategies by optimizing customer data platform and analysis.
Advancements in Natural Language Processing and Machine Learning Drives Market Growth
The chatbot market is witnessing substantial growth fueled by advancements in natural language processing (NLP) and machine learning (ML). These technologies empower chatbots to understand and engage in human-like conversations, interpreting nuances and context with greater accuracy. This evolution enhances the user experience, making interactions smoother and more intuitive.
Tech giants like Google and Amazon are at the forefront, continually refining their NLP and ML capabilities to push the boundaries of what chatbots can achieve. According to Study, by 2022, 71% of white-collar workers will interact with conversational platforms daily. The integration of advanced NLP and ML not only improves the functionality of chatbots but also broadens their applicability across different sectors, thereby amplifying their impact on market expansion.
Cost-Effectiveness and Operational Efficiency Drives Market Growth
Chatbots are revolutionizing business operations by offering a cost-effective alternative for managing customer interactions. By automating routine tasks, chatbots significantly reduce the need for extensive human customer service teams, thereby lowering operational costs and enhancing efficiency.
This shift is particularly evident in sectors like banking and finance, where chatbots are employed to handle straightforward transactions and inquiries. A study predicts that chatbots will help save businesses $8 billion annually by 2022. The reduction in operational expenses combined with the capability to manage a higher volume of customer interactions seamlessly makes chatbots an invaluable asset for businesses aiming to optimize their resource allocation and boost profitability.
Restraining Factors
Limited Conversational Abilities and Comprehension Restrains Market Growth
Current chatbots struggle with understanding complex human language and context. Advances in natural language processing (NLP) and machine learning (ML) have improved capabilities, but significant gaps remain. Misinterpretations and unsatisfactory responses lead to user frustration.
This is particularly problematic in areas requiring nuanced conversations, such as mental health counseling or legal advice. Users in these fields expect precise, empathetic interactions that chatbots often fail to deliver. This limitation reduces user trust and hampers widespread adoption. In a market where customer experience is paramount, these conversational shortcomings significantly restrain the growth of the chatbot market.
Privacy and Security Concerns Restrains Market Growth
Privacy and security issues are major barriers to chatbot adoption. Chatbots handle sensitive customer data, raising fears about data breaches and misuse. High-profile incidents like the Cambridge Analytica scandal involving Facebook data have heightened these concerns.
Customers are wary of sharing personal information with chatbots, fearing unauthorized access or exploitation of their data. Companies must implement robust data protection measures and transparent privacy policies to build trust. Without these assurances, user adoption remains limited. These privacy and security challenges create significant hurdles for the expansion of the chatbot market.
Type Analysis
Web-based sub-segment dominates with 55% due to its widespread accessibility and compatibility.
The chatbot market has been segmented by platform type into web-based and mobile-based categories. The web-based sub-segment emerges as the predominant force, accounting for 55% of the market. This dominance can be attributed to the universal accessibility of web-based interfaces, which are compatible across various devices without the need for additional applications.
Businesses favor web-based chatbots due to their ease of integration into existing websites, facilitating seamless customer interactions. Moreover, the continuous enhancements in web technology, such as HTML5 and responsive designs, significantly improve the user experience, driving the adoption of web-based solutions.
In contrast, the mobile-based sub-segment, though smaller, plays a crucial role in the market's expansion. The increasing penetration of smartphones and the rising trend of on-the-go customer service have catalyzed the growth of mobile-based chatbots. These chatbots are particularly effective in engaging younger demographics who prefer instant communication through their mobile devices. Additionally, the integration of chatbots with popular messaging apps such as WhatsApp and Facebook Messenger has broadened the reach of mobile-based solutions, contributing to overall market growth.
Deployment Type Analysis
Cloud-based sub-segment dominates with 65% due to its scalability and cost-efficiency.
In the deployment type category, the chatbot market is divided into cloud-based and on-premises solutions. The cloud-based chatbots hold a commanding lead with a 65% market share. The superiority of cloud-based solutions lies in their scalability, allowing businesses of all sizes to implement and expand their chatbot services without significant upfront investments in infrastructure. Furthermore, cloud-based chatbots offer enhanced flexibility in updates and maintenance, reducing the operational burdens on companies.
The on-premises sub-segment, while smaller, is integral to sectors with stringent data security and privacy regulations, such as banking and healthcare. These organizations often opt for on-premises chatbots to maintain complete control over their data and comply with legal requirements. Although this segment is less dominant, its importance continues to be underscored by its role in industries where security is paramount.
Service Type Analysis
AI-based sub-segment dominates with 70% due to its advanced learning capabilities and personalized interactions.
Service type segmentation of the chatbot market highlights two main types: rule-based and AI-based chatbots. AI-based chatbots dominate this segment with a 70% market share, driven by their superior capabilities in learning from user interactions and providing more personalized and context-aware responses. The adoption of AI technologies such as machine learning, natural language processing, and sentiment analysis has significantly enhanced the effectiveness of chatbots, making them more attractive to businesses seeking to improve customer engagement.
Rule-based chatbots, though less sophisticated, maintain relevance in applications requiring straightforward, predefined responses. They are particularly useful for organizations that need to ensure consistency and compliance in customer interaction. Despite their limited flexibility, rule-based chatbots are critical in settings where precision and control are necessary.
Usage Type Analysis
Customer Service sub-segment dominates with 60% due to its ability to automate responses and handle high volumes of queries.
Chatbots are primarily utilized in customer service, marketing, sales, and other applications. The customer service sub-segment dominates, holding a 60% share of the market. Chatbots have revolutionized customer service by automating responses to common inquiries, enabling 24/7 service availability, and handling large volumes of queries without the need for significant human oversight. This capability significantly enhances customer satisfaction and operational efficiency.
Other usage types like marketing and sales also benefit from bot services but to a lesser extent. Marketing chatbots are effective in engaging customers through personalized content, while sales-oriented chatbots can streamline the purchasing process. The 'Others' category includes various emerging applications, each contributing to the market's diversity and expansion.
Industry Vertical Analysis
Retail & E-commerce sub-segment dominates with 50% due to its extensive use of chatbots for enhancing customer shopping experiences.
Within the industry vertical segmentation, the chatbot market serves sectors such as retail & e-commerce, BFSI, healthcare, telecommunications, travel & hospitality, government, and others. Retail & e-commerce leads with a 50% share, where chatbots play a pivotal role in enhancing customer shopping experiences by providing instant product recommendations, support, and transactional assistance.
Other sectors like BFSI and healthcare also integrate chatbots for their customer service efficiency, compliance with regulations, and ability to handle sensitive information securely. Each of these segments, while not as dominant as retail, is crucial to the comprehensive adoption and innovation of chatbot technologies across industries.
Key Market Segments
By Platform Type
- Web-based
- Mobile-based
By Deployment Type
- Cloud-based
- On-premises
By Service Type
- Rule-based Chatbots
- AI-based Chatbots
By Usage Type
- Customer Service
- Marketing
- Sales
- Others
By Industry Vertical
- Retail & E-commerce
- Banking, Financial Services, and Insurance (BFSI)
- Healthcare
- Telecommunications
- Travel & Hospitality
- Government
- Others
Growth Opportunities
Integration with Emerging Technologies Offers Growth Opportunity
The fusion of chatbots with cutting-edge technologies such as the Internet of Things (IoT), Generative AI, augmented reality (AR), and virtual reality (VR) opens new avenues for growth in the chatbot market. These integrations not only improve how users interact with devices but also broaden the scope of applications.
For instance, IoT integration allows chatbots to act as the central interface for smart home systems, offering voice-activated controls and real-time monitoring. Augmented and virtual realities introduce immersive elements to the chatbot interactions, significantly enhancing user engagement and satisfaction. Such innovations are projected to drive substantial market expansion as they cater to increasingly tech-savvy consumers and integrate seamlessly into daily activities.
Vertical-specific Chatbot Applications Offer Growth Opportunity
Tailoring chatbots to specific industries significantly enhances their effectiveness and market penetration. These vertical-specific chatbots utilize domain expertise to deliver more precise and contextually relevant responses, meeting the specialized needs of various sectors such as healthcare, finance, e-commerce, and legal services.
For instance, in healthcare, chatbots can help manage patient appointments and provide routine medical advice, which can improve efficiency and patient care. In finance, chatbots can automate customer inquiries and transactions, ensuring quick and accurate responses. The demand for such specialized solutions is increasing as organizations seek to improve customer interaction and operational efficiency, positioning this trend as a key driver for future growth in the chatbot industry.
Trending Factors
Multilingual and Cross-cultural Chatbot Capabilities Are Trending Factors
The global expansion of businesses necessitates chatbots capable of engaging customers in multiple languages and understanding various cultural contexts. Developing chatbots with these capabilities enables companies to extend their reach and tap into new markets more effectively. This trend is not just about translation but about creating culturally aware interactions that resonate with local customs and consumer behaviors.
Such capabilities are increasingly critical as companies aim to provide personalized customer experiences on a global scale. The enhanced customer satisfaction and broader market reach enabled by multilingual and culturally adaptive chatbots are making them a trending factor in today’s globalized business environment.
Chatbot Analytics and Continuous Improvement Are Trending Factors
Leveraging analytics to monitor and enhance chatbot interactions is becoming a fundamental aspect of chatbot development. The continuous analysis of user interactions helps identify gaps in chatbot performance, enabling ongoing refinements. This capability allows businesses to evolve their chatbots based on actual user needs and preferences, enhancing the accuracy and relevance of responses.
As a result, companies can ensure a consistently improving user experience, fostering greater user retention and satisfaction. This focus on continuous improvement through analytics is a trending factor as it aligns with the broader shift towards data-driven decision-making in business, contributing significantly to the strategic development of chatbot technologies.
Regional Analysis
North America Dominates with 33% Market Share in the Chatbot Industry
North America’s 33% dominance in the chatbot market can primarily be attributed to advanced technological infrastructure and high digital adoption rates. The region's substantial investment in AI and machine learning technologies enhances chatbot functionalities, making them more appealing to businesses seeking efficient customer interaction solutions. Furthermore, the presence of leading tech companies, which spearhead innovations and set market trends, significantly contributes to this high market share.
The market dynamics in North America are bolstered by its robust economic landscape and the widespread acceptance of AI technologies across various sectors including healthcare, finance, and retail. This acceptance is driven by a cultural affinity for technological innovations and a competitive business environment that rewards efficiency and customer service enhancements. These factors collectively enable the chatbot market to thrive.
Regional Market Share Analysis:
- Europe: Holds a market share of approximately 27%. The region's strict data privacy regulations and increasing demand for automated customer support in languages other than English contribute to significant market growth.
- Asia Pacific: Commands a 25% market share. Factors such as rapid digital transformation, a growing tech-savvy population, and the integration of chatbots in local languages are pivotal to this growth.
- Middle East & Africa: With a 9% market share, the region shows growth driven by expanding digital infrastructure and the increasing adoption of smart banking solutions.
- Latin America: Accounts for 6% of the market. Growth is fueled by the digital transformation of businesses and the rising need for automation in customer services to improve competitive positioning.
Key Regions and Countries
- North America
- The US
- Canada
- Mexico
- Western Europe
- Germany
- France
- The UK
- Spain
- Italy
- Portugal
- Ireland
- Austria
- Switzerland
- Benelux
- Nordic
- Rest of Western Europe
- Eastern Europe
- Russia
- Poland
- The Czech Republic
- Greece
- Rest of Eastern Europe
- APAC
- China
- Japan
- South Korea
- India
- Australia & New Zealand
- Indonesia
- Malaysia
- Philippines
- Singapore
- Thailand
- Vietnam
- Rest of APAC
- Latin America
- Brazil
- Colombia
- Chile
- Argentina
- Costa Rica
- Rest of Latin America
- Middle East & Africa
- Algeria
- Egypt
- Israel
- Kuwait
- Nigeria
- Saudi Arabia
- South Africa
- Turkey
- United Arab Emirates
- Rest of MEA
Key Players Analysis
The chatbot market is shaped by major tech giants and specialized firms. IBM Corporation, Google LLC, Microsoft Corporation, and Amazon Web Services, Inc. lead due to their extensive AI capabilities and cloud infrastructures. Facebook, Inc. leverages its vast user base for chatbot integration in social media. Nuance Communications, Inc. focuses on conversational AI for healthcare and customer service. Oracle Corporation integrates chatbots within its enterprise solutions.
Inbenta Technologies Inc. and Artificial Solutions specialize in natural language processing (NLP) for diverse industries. Rasa Technologies GmbH offers open-source chatbot frameworks, fostering community-driven innovation. SAP SE provides chatbots within its enterprise software. Kore.ai, Inc. emphasizes omnichannel support and enterprise integration. LivePerson, Inc. pioneers in conversational commerce.
These companies influence market growth through continuous advancements in AI, NLP, and machine learning. Strategic partnerships and acquisitions are common to enhance capabilities. The competitive landscape is marked by innovation, with key players aiming to offer more intuitive, human-like chatbot interactions.
Market Key Players
- IBM Corporation
- Google LLC
- Microsoft Corporation
- Amazon Web Services, Inc.
- Facebook, Inc.
- Nuance Communications, Inc.
- Oracle Corporation
- Inbenta Technologies Inc.
- Artificial Solutions
- Rasa Technologies GmbH
- SAP SE
- Kore.ai, Inc.
- LivePerson, Inc.
Recent Developments
- April 2024: OpenAI released an updated version of ChatGPT, known as GPT-4 Turbo. This new model features enhancements in writing, math, logical reasoning, and coding, providing users with more accurate and efficient responses. The update aims to improve the overall user experience by making interactions with the AI more direct and less verbose.
- May 2024: Chatlyn unveiled its most advanced AI chatbot at the Arabian Travel Market (ATM) 2024. This chatbot supports multiple languages, including Arabic, and can handle up to 4,000 tokens, making it highly effective for managing extensive customer interactions. Chatlyn's AI chatbot has been integrated into over 1,000 properties worldwide, enhancing customer engagement in the hospitality sector.
Report Scope
Report Features Description Market Value (2023) USD 6.8 Billion Forecast Revenue (2033) USD 58.0 Billion CAGR (2024-2033) 24.6% Base Year for Estimation 2023 Historic Period 2018-2023 Forecast Period 2024-2033 Report Coverage Revenue Forecast, Market Dynamics, Competitive Landscape, Recent Developments Segments Covered By Platform Type (Web-based, Mobile-based), By Deployment Type (Cloud-based, On-premises), By Service Type (Rule-based Chatbots, AI-based Chatbots), By Usage Type (Customer Service, Marketing, Sales, Others), By Industry Vertical (Retail & E-commerce, Banking, Financial Services, and Insurance [BFSI], Healthcare, Telecommunications, Travel & Hospitality, Government, Others) Regional Analysis North America - The US, Canada, & Mexico; Western Europe - Germany, France, The UK, Spain, Italy, Portugal, Ireland, Austria, Switzerland, Benelux, Nordic, & Rest of Western Europe; Eastern Europe - Russia, Poland, The Czech Republic, Greece, & Rest of Eastern Europe; APAC - China, Japan, South Korea, India, Australia & New Zealand, Indonesia, Malaysia, Philippines, Singapore, Thailand, Vietnam, & Rest of APAC; Latin America - Brazil, Colombia, Chile, Argentina, Costa Rica, & Rest of Latin America; Middle East & Africa - Algeria, Egypt, Israel, Kuwait, Nigeria, Saudi Arabia, South Africa, Turkey, United Arab Emirates, & Rest of MEA Competitive Landscape IBM Corporation, Google LLC, Microsoft Corporation, Amazon Web Services, Inc., Facebook, Inc., Nuance Communications, Inc., Oracle Corporation, Inbenta Technologies Inc., Artificial Solutions, Rasa Technologies GmbH, SAP SE, Kore.ai, Inc., LivePerson, Inc. Customization Scope Customization for segments, region/country-level will be provided. Moreover, additional customization can be done based on the requirements. Purchase Options We have three licenses to opt for: Single User License, Multi-User License (Up to 5 Users), Corporate Use License (Unlimited User and Printable PDF) -
- 1. Executive Summary
- 1.1. Definition
- 1.2. Taxonomy
- 1.3. Research Scope
- 1.4. Key Analysis
- 1.5. Key Findings by Major Segments
- 1.6. Top strategies by Major Players
- 2. Global Chatbot Market Overview
- 2.1. Chatbot Market Dynamics
- 2.1.1. Drivers
- 2.1.2. Opportunities
- 2.1.3. Restraints
- 2.1.4. Challenges
- 2.2. Macro-economic Factors
- 2.3. Regulatory Framework
- 2.4. Market Investment Feasibility Index
- 2.5. PEST Analysis
- 2.6. PORTER’S Five Force Analysis
- 2.7. Drivers & Restraints Impact Analysis
- 2.8. Industry Chain Analysis
- 2.9. Cost Structure Analysis
- 2.10. Marketing Strategy
- 2.11. Russia-Ukraine War Impact Analysis
- 2.12. Opportunity Map Analysis
- 2.13. Market Competition Scenario Analysis
- 2.14. Product Life Cycle Analysis
- 2.15. Opportunity Orbits
- 2.16. Manufacturer Intensity Map
- 2.17. Major Companies sales by Value & Volume
- 2.1. Chatbot Market Dynamics
- 3. Global Chatbot Market Analysis, Opportunity and Forecast, 2016-2032
- 3.1. Global Chatbot Market Analysis, 2016-2021
- 3.2. Global Chatbot Market Opportunity and Forecast, 2023-2032
- 3.3. Global Chatbot Market Analysis, Opportunity and Forecast, By Platform Type, 2016-2032
- 3.3.1. Global Chatbot Market Analysis by Platform Type: Introduction
- 3.3.2. Market Size Absolute $ Opportunity Analysis and Forecast, By Platform Type, 2016-2032
- 3.3.3. Web-based
- 3.3.4. Mobile-based
- 3.4. Global Chatbot Market Analysis, Opportunity and Forecast, By Deployment Type, 2016-2032
- 3.4.1. Global Chatbot Market Analysis by Deployment Type: Introduction
- 3.4.2. Market Size Absolute $ Opportunity Analysis and Forecast, By Deployment Type, 2016-2032
- 3.4.3. Cloud-based
- 3.4.4. On-premises
- 3.5. Global Chatbot Market Analysis, Opportunity and Forecast, By Service Type, 2016-2032
- 3.5.1. Global Chatbot Market Analysis by Service Type: Introduction
- 3.5.2. Market Size Absolute $ Opportunity Analysis and Forecast, By Service Type, 2016-2032
- 3.5.3. Rule-based Chatbots
- 3.5.4. AI-based Chatbots
- 3.6. Global Chatbot Market Analysis, Opportunity and Forecast, By Usage Type, 2016-2032
- 3.6.1. Global Chatbot Market Analysis by Usage Type: Introduction
- 3.6.2. Market Size Absolute $ Opportunity Analysis and Forecast, By Usage Type, 2016-2032
- 3.6.3. Customer Service
- 3.6.4. Marketing
- 3.6.5. Sales
- 3.6.6. Others
- 3.7. Global Chatbot Market Analysis, Opportunity and Forecast, By Industry Vertical, 2016-2032
- 3.7.1. Global Chatbot Market Analysis by Industry Vertical: Introduction
- 3.7.2. Market Size Absolute $ Opportunity Analysis and Forecast, By Industry Vertical, 2016-2032
- 3.7.3. Retail & E-commerce
- 3.7.4. Banking, Financial Services, and Insurance (BFSI)
- 3.7.5. Healthcare
- 3.7.6. Telecommunications
- 3.7.7. Travel & Hospitality
- 3.7.8. Government
- 3.7.9. Others
- 4. North America Chatbot Market Analysis, Opportunity and Forecast, 2016-2032
- 4.1. North America Chatbot Market Analysis, 2016-2021
- 4.2. North America Chatbot Market Opportunity and Forecast, 2023-2032
- 4.3. North America Chatbot Market Analysis, Opportunity and Forecast, By Platform Type, 2016-2032
- 4.3.1. North America Chatbot Market Analysis by Platform Type: Introduction
- 4.3.2. Market Size Absolute $ Opportunity Analysis and Forecast, By Platform Type, 2016-2032
- 4.3.3. Web-based
- 4.3.4. Mobile-based
- 4.4. North America Chatbot Market Analysis, Opportunity and Forecast, By Deployment Type, 2016-2032
- 4.4.1. North America Chatbot Market Analysis by Deployment Type: Introduction
- 4.4.2. Market Size Absolute $ Opportunity Analysis and Forecast, By Deployment Type, 2016-2032
- 4.4.3. Cloud-based
- 4.4.4. On-premises
- 4.5. North America Chatbot Market Analysis, Opportunity and Forecast, By Service Type, 2016-2032
- 4.5.1. North America Chatbot Market Analysis by Service Type: Introduction
- 4.5.2. Market Size Absolute $ Opportunity Analysis and Forecast, By Service Type, 2016-2032
- 4.5.3. Rule-based Chatbots
- 4.5.4. AI-based Chatbots
- 4.6. North America Chatbot Market Analysis, Opportunity and Forecast, By Usage Type, 2016-2032
- 4.6.1. North America Chatbot Market Analysis by Usage Type: Introduction
- 4.6.2. Market Size Absolute $ Opportunity Analysis and Forecast, By Usage Type, 2016-2032
- 4.6.3. Customer Service
- 4.6.4. Marketing
- 4.6.5. Sales
- 4.6.6. Others
- 4.7. North America Chatbot Market Analysis, Opportunity and Forecast, By Industry Vertical, 2016-2032
- 4.7.1. North America Chatbot Market Analysis by Industry Vertical: Introduction
- 4.7.2. Market Size Absolute $ Opportunity Analysis and Forecast, By Industry Vertical, 2016-2032
- 4.7.3. Retail & E-commerce
- 4.7.4. Banking, Financial Services, and Insurance (BFSI)
- 4.7.5. Healthcare
- 4.7.6. Telecommunications
- 4.7.7. Travel & Hospitality
- 4.7.8. Government
- 4.7.9. Others
- 4.8. North America Chatbot Market Analysis, Opportunity and Forecast, By Country , 2016-2032
- 4.8.1. North America Chatbot Market Analysis by Country : Introduction
- 4.8.2. Market Size Absolute $ Opportunity Analysis and Forecast, Country , 2016-2032
- 4.8.2.1. The US
- 4.8.2.2. Canada
- 4.8.2.3. Mexico
- 5. Western Europe Chatbot Market Analysis, Opportunity and Forecast, 2016-2032
- 5.1. Western Europe Chatbot Market Analysis, 2016-2021
- 5.2. Western Europe Chatbot Market Opportunity and Forecast, 2023-2032
- 5.3. Western Europe Chatbot Market Analysis, Opportunity and Forecast, By Platform Type, 2016-2032
- 5.3.1. Western Europe Chatbot Market Analysis by Platform Type: Introduction
- 5.3.2. Market Size Absolute $ Opportunity Analysis and Forecast, By Platform Type, 2016-2032
- 5.3.3. Web-based
- 5.3.4. Mobile-based
- 5.4. Western Europe Chatbot Market Analysis, Opportunity and Forecast, By Deployment Type, 2016-2032
- 5.4.1. Western Europe Chatbot Market Analysis by Deployment Type: Introduction
- 5.4.2. Market Size Absolute $ Opportunity Analysis and Forecast, By Deployment Type, 2016-2032
- 5.4.3. Cloud-based
- 5.4.4. On-premises
- 5.5. Western Europe Chatbot Market Analysis, Opportunity and Forecast, By Service Type, 2016-2032
- 5.5.1. Western Europe Chatbot Market Analysis by Service Type: Introduction
- 5.5.2. Market Size Absolute $ Opportunity Analysis and Forecast, By Service Type, 2016-2032
- 5.5.3. Rule-based Chatbots
- 5.5.4. AI-based Chatbots
- 5.6. Western Europe Chatbot Market Analysis, Opportunity and Forecast, By Usage Type, 2016-2032
- 5.6.1. Western Europe Chatbot Market Analysis by Usage Type: Introduction
- 5.6.2. Market Size Absolute $ Opportunity Analysis and Forecast, By Usage Type, 2016-2032
- 5.6.3. Customer Service
- 5.6.4. Marketing
- 5.6.5. Sales
- 5.6.6. Others
- 5.7. Western Europe Chatbot Market Analysis, Opportunity and Forecast, By Industry Vertical, 2016-2032
- 5.7.1. Western Europe Chatbot Market Analysis by Industry Vertical: Introduction
- 5.7.2. Market Size Absolute $ Opportunity Analysis and Forecast, By Industry Vertical, 2016-2032
- 5.7.3. Retail & E-commerce
- 5.7.4. Banking, Financial Services, and Insurance (BFSI)
- 5.7.5. Healthcare
- 5.7.6. Telecommunications
- 5.7.7. Travel & Hospitality
- 5.7.8. Government
- 5.7.9. Others
- 5.8. Western Europe Chatbot Market Analysis, Opportunity and Forecast, By Country , 2016-2032
- 5.8.1. Western Europe Chatbot Market Analysis by Country : Introduction
- 5.8.2. Market Size Absolute $ Opportunity Analysis and Forecast, Country , 2016-2032
- 5.8.2.1. Germany
- 5.8.2.2. France
- 5.8.2.3. The UK
- 5.8.2.4. Spain
- 5.8.2.5. Italy
- 5.8.2.6. Portugal
- 5.8.2.7. Ireland
- 5.8.2.8. Austria
- 5.8.2.9. Switzerland
- 5.8.2.10. Benelux
- 5.8.2.11. Nordic
- 5.8.2.12. Rest of Western Europe
- 6. Eastern Europe Chatbot Market Analysis, Opportunity and Forecast, 2016-2032
- 6.1. Eastern Europe Chatbot Market Analysis, 2016-2021
- 6.2. Eastern Europe Chatbot Market Opportunity and Forecast, 2023-2032
- 6.3. Eastern Europe Chatbot Market Analysis, Opportunity and Forecast, By Platform Type, 2016-2032
- 6.3.1. Eastern Europe Chatbot Market Analysis by Platform Type: Introduction
- 6.3.2. Market Size Absolute $ Opportunity Analysis and Forecast, By Platform Type, 2016-2032
- 6.3.3. Web-based
- 6.3.4. Mobile-based
- 6.4. Eastern Europe Chatbot Market Analysis, Opportunity and Forecast, By Deployment Type, 2016-2032
- 6.4.1. Eastern Europe Chatbot Market Analysis by Deployment Type: Introduction
- 6.4.2. Market Size Absolute $ Opportunity Analysis and Forecast, By Deployment Type, 2016-2032
- 6.4.3. Cloud-based
- 6.4.4. On-premises
- 6.5. Eastern Europe Chatbot Market Analysis, Opportunity and Forecast, By Service Type, 2016-2032
- 6.5.1. Eastern Europe Chatbot Market Analysis by Service Type: Introduction
- 6.5.2. Market Size Absolute $ Opportunity Analysis and Forecast, By Service Type, 2016-2032
- 6.5.3. Rule-based Chatbots
- 6.5.4. AI-based Chatbots
- 6.6. Eastern Europe Chatbot Market Analysis, Opportunity and Forecast, By Usage Type, 2016-2032
- 6.6.1. Eastern Europe Chatbot Market Analysis by Usage Type: Introduction
- 6.6.2. Market Size Absolute $ Opportunity Analysis and Forecast, By Usage Type, 2016-2032
- 6.6.3. Customer Service
- 6.6.4. Marketing
- 6.6.5. Sales
- 6.6.6. Others
- 6.7. Eastern Europe Chatbot Market Analysis, Opportunity and Forecast, By Industry Vertical, 2016-2032
- 6.7.1. Eastern Europe Chatbot Market Analysis by Industry Vertical: Introduction
- 6.7.2. Market Size Absolute $ Opportunity Analysis and Forecast, By Industry Vertical, 2016-2032
- 6.7.3. Retail & E-commerce
- 6.7.4. Banking, Financial Services, and Insurance (BFSI)
- 6.7.5. Healthcare
- 6.7.6. Telecommunications
- 6.7.7. Travel & Hospitality
- 6.7.8. Government
- 6.7.9. Others
- 6.8. Eastern Europe Chatbot Market Analysis, Opportunity and Forecast, By Country , 2016-2032
- 6.8.1. Eastern Europe Chatbot Market Analysis by Country : Introduction
- 6.8.2. Market Size Absolute $ Opportunity Analysis and Forecast, Country , 2016-2032
- 6.8.2.1. Russia
- 6.8.2.2. Poland
- 6.8.2.3. The Czech Republic
- 6.8.2.4. Greece
- 6.8.2.5. Rest of Eastern Europe
- 7. APAC Chatbot Market Analysis, Opportunity and Forecast, 2016-2032
- 7.1. APAC Chatbot Market Analysis, 2016-2021
- 7.2. APAC Chatbot Market Opportunity and Forecast, 2023-2032
- 7.3. APAC Chatbot Market Analysis, Opportunity and Forecast, By Platform Type, 2016-2032
- 7.3.1. APAC Chatbot Market Analysis by Platform Type: Introduction
- 7.3.2. Market Size Absolute $ Opportunity Analysis and Forecast, By Platform Type, 2016-2032
- 7.3.3. Web-based
- 7.3.4. Mobile-based
- 7.4. APAC Chatbot Market Analysis, Opportunity and Forecast, By Deployment Type, 2016-2032
- 7.4.1. APAC Chatbot Market Analysis by Deployment Type: Introduction
- 7.4.2. Market Size Absolute $ Opportunity Analysis and Forecast, By Deployment Type, 2016-2032
- 7.4.3. Cloud-based
- 7.4.4. On-premises
- 7.5. APAC Chatbot Market Analysis, Opportunity and Forecast, By Service Type, 2016-2032
- 7.5.1. APAC Chatbot Market Analysis by Service Type: Introduction
- 7.5.2. Market Size Absolute $ Opportunity Analysis and Forecast, By Service Type, 2016-2032
- 7.5.3. Rule-based Chatbots
- 7.5.4. AI-based Chatbots
- 7.6. APAC Chatbot Market Analysis, Opportunity and Forecast, By Usage Type, 2016-2032
- 7.6.1. APAC Chatbot Market Analysis by Usage Type: Introduction
- 7.6.2. Market Size Absolute $ Opportunity Analysis and Forecast, By Usage Type, 2016-2032
- 7.6.3. Customer Service
- 7.6.4. Marketing
- 7.6.5. Sales
- 7.6.6. Others
- 7.7. APAC Chatbot Market Analysis, Opportunity and Forecast, By Industry Vertical, 2016-2032
- 7.7.1. APAC Chatbot Market Analysis by Industry Vertical: Introduction
- 7.7.2. Market Size Absolute $ Opportunity Analysis and Forecast, By Industry Vertical, 2016-2032
- 7.7.3. Retail & E-commerce
- 7.7.4. Banking, Financial Services, and Insurance (BFSI)
- 7.7.5. Healthcare
- 7.7.6. Telecommunications
- 7.7.7. Travel & Hospitality
- 7.7.8. Government
- 7.7.9. Others
- 7.8. APAC Chatbot Market Analysis, Opportunity and Forecast, By Country , 2016-2032
- 7.8.1. APAC Chatbot Market Analysis by Country : Introduction
- 7.8.2. Market Size Absolute $ Opportunity Analysis and Forecast, Country , 2016-2032
- 7.8.2.1. China
- 7.8.2.2. Japan
- 7.8.2.3. South Korea
- 7.8.2.4. India
- 7.8.2.5. Australia & New Zeland
- 7.8.2.6. Indonesia
- 7.8.2.7. Malaysia
- 7.8.2.8. Philippines
- 7.8.2.9. Singapore
- 7.8.2.10. Thailand
- 7.8.2.11. Vietnam
- 7.8.2.12. Rest of APAC
- 8. Latin America Chatbot Market Analysis, Opportunity and Forecast, 2016-2032
- 8.1. Latin America Chatbot Market Analysis, 2016-2021
- 8.2. Latin America Chatbot Market Opportunity and Forecast, 2023-2032
- 8.3. Latin America Chatbot Market Analysis, Opportunity and Forecast, By Platform Type, 2016-2032
- 8.3.1. Latin America Chatbot Market Analysis by Platform Type: Introduction
- 8.3.2. Market Size Absolute $ Opportunity Analysis and Forecast, By Platform Type, 2016-2032
- 8.3.3. Web-based
- 8.3.4. Mobile-based
- 8.4. Latin America Chatbot Market Analysis, Opportunity and Forecast, By Deployment Type, 2016-2032
- 8.4.1. Latin America Chatbot Market Analysis by Deployment Type: Introduction
- 8.4.2. Market Size Absolute $ Opportunity Analysis and Forecast, By Deployment Type, 2016-2032
- 8.4.3. Cloud-based
- 8.4.4. On-premises
- 8.5. Latin America Chatbot Market Analysis, Opportunity and Forecast, By Service Type, 2016-2032
- 8.5.1. Latin America Chatbot Market Analysis by Service Type: Introduction
- 8.5.2. Market Size Absolute $ Opportunity Analysis and Forecast, By Service Type, 2016-2032
- 8.5.3. Rule-based Chatbots
- 8.5.4. AI-based Chatbots
- 8.6. Latin America Chatbot Market Analysis, Opportunity and Forecast, By Usage Type, 2016-2032
- 8.6.1. Latin America Chatbot Market Analysis by Usage Type: Introduction
- 8.6.2. Market Size Absolute $ Opportunity Analysis and Forecast, By Usage Type, 2016-2032
- 8.6.3. Customer Service
- 8.6.4. Marketing
- 8.6.5. Sales
- 8.6.6. Others
- 8.7. Latin America Chatbot Market Analysis, Opportunity and Forecast, By Industry Vertical, 2016-2032
- 8.7.1. Latin America Chatbot Market Analysis by Industry Vertical: Introduction
- 8.7.2. Market Size Absolute $ Opportunity Analysis and Forecast, By Industry Vertical, 2016-2032
- 8.7.3. Retail & E-commerce
- 8.7.4. Banking, Financial Services, and Insurance (BFSI)
- 8.7.5. Healthcare
- 8.7.6. Telecommunications
- 8.7.7. Travel & Hospitality
- 8.7.8. Government
- 8.7.9. Others
- 8.8. Latin America Chatbot Market Analysis, Opportunity and Forecast, By Country , 2016-2032
- 8.8.1. Latin America Chatbot Market Analysis by Country : Introduction
- 8.8.2. Market Size Absolute $ Opportunity Analysis and Forecast, Country , 2016-2032
- 8.8.2.1. Brazil
- 8.8.2.2. Colombia
- 8.8.2.3. Chile
- 8.8.2.4. Argentina
- 8.8.2.5. Costa Rica
- 8.8.2.6. Rest of Latin America
- 9. Middle East & Africa Chatbot Market Analysis, Opportunity and Forecast, 2016-2032
- 9.1. Middle East & Africa Chatbot Market Analysis, 2016-2021
- 9.2. Middle East & Africa Chatbot Market Opportunity and Forecast, 2023-2032
- 9.3. Middle East & Africa Chatbot Market Analysis, Opportunity and Forecast, By Platform Type, 2016-2032
- 9.3.1. Middle East & Africa Chatbot Market Analysis by Platform Type: Introduction
- 9.3.2. Market Size Absolute $ Opportunity Analysis and Forecast, By Platform Type, 2016-2032
- 9.3.3. Web-based
- 9.3.4. Mobile-based
- 9.4. Middle East & Africa Chatbot Market Analysis, Opportunity and Forecast, By Deployment Type, 2016-2032
- 9.4.1. Middle East & Africa Chatbot Market Analysis by Deployment Type: Introduction
- 9.4.2. Market Size Absolute $ Opportunity Analysis and Forecast, By Deployment Type, 2016-2032
- 9.4.3. Cloud-based
- 9.4.4. On-premises
- 9.5. Middle East & Africa Chatbot Market Analysis, Opportunity and Forecast, By Service Type, 2016-2032
- 9.5.1. Middle East & Africa Chatbot Market Analysis by Service Type: Introduction
- 9.5.2. Market Size Absolute $ Opportunity Analysis and Forecast, By Service Type, 2016-2032
- 9.5.3. Rule-based Chatbots
- 9.5.4. AI-based Chatbots
- 9.6. Middle East & Africa Chatbot Market Analysis, Opportunity and Forecast, By Usage Type, 2016-2032
- 9.6.1. Middle East & Africa Chatbot Market Analysis by Usage Type: Introduction
- 9.6.2. Market Size Absolute $ Opportunity Analysis and Forecast, By Usage Type, 2016-2032
- 9.6.3. Customer Service
- 9.6.4. Marketing
- 9.6.5. Sales
- 9.6.6. Others
- 9.7. Middle East & Africa Chatbot Market Analysis, Opportunity and Forecast, By Industry Vertical, 2016-2032
- 9.7.1. Middle East & Africa Chatbot Market Analysis by Industry Vertical: Introduction
- 9.7.2. Market Size Absolute $ Opportunity Analysis and Forecast, By Industry Vertical, 2016-2032
- 9.7.3. Retail & E-commerce
- 9.7.4. Banking, Financial Services, and Insurance (BFSI)
- 9.7.5. Healthcare
- 9.7.6. Telecommunications
- 9.7.7. Travel & Hospitality
- 9.7.8. Government
- 9.7.9. Others
- 9.8. Middle East & Africa Chatbot Market Analysis, Opportunity and Forecast, By Country , 2016-2032
- 9.8.1. Middle East & Africa Chatbot Market Analysis by Country : Introduction
- 9.8.2. Market Size Absolute $ Opportunity Analysis and Forecast, Country , 2016-2032
- 9.8.2.1. Algeria
- 9.8.2.2. Egypt
- 9.8.2.3. Israel
- 9.8.2.4. Kuwait
- 9.8.2.5. Nigeria
- 9.8.2.6. Saudi Arabia
- 9.8.2.7. South Africa
- 9.8.2.8. Turkey
- 9.8.2.9. The UAE
- 9.8.2.10. Rest of MEA
- 10. Global Chatbot Market Analysis, Opportunity and Forecast, By Region , 2016-2032
- 10.1. Global Chatbot Market Analysis by Region : Introduction
- 10.2. Market Size Absolute $ Opportunity Analysis and Forecast, By Region , 2016-2032
- 10.2.1. North America
- 10.2.2. Western Europe
- 10.2.3. Eastern Europe
- 10.2.4. APAC
- 10.2.5. Latin America
- 10.2.6. Middle East & Africa
- 11. Global Chatbot Market Competitive Landscape, Market Share Analysis, and Company Profiles
- 11.1. Market Share Analysis
- 11.2. Company Profiles
- 11.3. IBM Corporation
- 11.3.1. Company Overview
- 11.3.2. Financial Highlights
- 11.3.3. Product Portfolio
- 11.3.4. SWOT Analysis
- 11.3.5. Key Strategies and Developments
- 11.4. Google LLC
- 11.4.1. Company Overview
- 11.4.2. Financial Highlights
- 11.4.3. Product Portfolio
- 11.4.4. SWOT Analysis
- 11.4.5. Key Strategies and Developments
- 11.5. Microsoft Corporation
- 11.5.1. Company Overview
- 11.5.2. Financial Highlights
- 11.5.3. Product Portfolio
- 11.5.4. SWOT Analysis
- 11.5.5. Key Strategies and Developments
- 11.6. Amazon Web Services, Inc.
- 11.6.1. Company Overview
- 11.6.2. Financial Highlights
- 11.6.3. Product Portfolio
- 11.6.4. SWOT Analysis
- 11.6.5. Key Strategies and Developments
- 11.7. Facebook, Inc.
- 11.7.1. Company Overview
- 11.7.2. Financial Highlights
- 11.7.3. Product Portfolio
- 11.7.4. SWOT Analysis
- 11.7.5. Key Strategies and Developments
- 11.8. Nuance Communications, Inc.
- 11.8.1. Company Overview
- 11.8.2. Financial Highlights
- 11.8.3. Product Portfolio
- 11.8.4. SWOT Analysis
- 11.8.5. Key Strategies and Developments
- 11.9. Oracle Corporation
- 11.9.1. Company Overview
- 11.9.2. Financial Highlights
- 11.9.3. Product Portfolio
- 11.9.4. SWOT Analysis
- 11.9.5. Key Strategies and Developments
- 11.10. Inbenta Technologies Inc.
- 11.10.1. Company Overview
- 11.10.2. Financial Highlights
- 11.10.3. Product Portfolio
- 11.10.4. SWOT Analysis
- 11.10.5. Key Strategies and Developments
- 11.11. Artificial Solutions
- 11.11.1. Company Overview
- 11.11.2. Financial Highlights
- 11.11.3. Product Portfolio
- 11.11.4. SWOT Analysis
- 11.11.5. Key Strategies and Developments
- 11.12. Rasa Technologies GmbH
- 11.12.1. Company Overview
- 11.12.2. Financial Highlights
- 11.12.3. Product Portfolio
- 11.12.4. SWOT Analysis
- 11.12.5. Key Strategies and Developments
- 11.13.1. Company Overview
- 11.13.2. Financial Highlights
- 11.13.3. Product Portfolio
- 11.13.4. SWOT Analysis
- 11.13.5. Key Strategies and Developments
- 11.14. SAP SE
- 11.14.1. Company Overview
- 11.14.2. Financial Highlights
- 11.14.3. Product Portfolio
- 11.14.4. SWOT Analysis
- 11.14.5. Key Strategies and Developments
- 11.15. LivePerson, Inc.
- 11.15.1. Company Overview
- 11.15.2. Financial Highlights
- 11.15.3. Product Portfolio
- 11.15.4. SWOT Analysis
- 11.15.5. Key Strategies and Developments
- 12. Assumptions and Acronyms
- 13. Research Methodology
- 14. Contact
"
- List of Figures
- "
- Figure 1: Global Chatbot Market Revenue (US$ Mn) Market Share by Platform Type in 2022
- Figure 2: Global Chatbot Market Attractiveness Analysis by Platform Type, 2016-2032
- Figure 3: Global Chatbot Market Revenue (US$ Mn) Market Share by Deployment Typein 2022
- Figure 4: Global Chatbot Market Attractiveness Analysis by Deployment Type, 2016-2032
- Figure 5: Global Chatbot Market Revenue (US$ Mn) Market Share by Service Typein 2022
- Figure 6: Global Chatbot Market Attractiveness Analysis by Service Type, 2016-2032
- Figure 7: Global Chatbot Market Revenue (US$ Mn) Market Share by Usage Typein 2022
- Figure 8: Global Chatbot Market Attractiveness Analysis by Usage Type, 2016-2032
- Figure 9: Global Chatbot Market Revenue (US$ Mn) Market Share by Industry Verticalin 2022
- Figure 10: Global Chatbot Market Attractiveness Analysis by Industry Vertical, 2016-2032
- Figure 11: Global Chatbot Market Revenue (US$ Mn) Market Share by Region in 2022
- Figure 12: Global Chatbot Market Attractiveness Analysis by Region, 2016-2032
- Figure 13: Global Chatbot Market Revenue (US$ Mn) (2016-2032)
- Figure 14: Global Chatbot Market Revenue (US$ Mn) Comparison by Region (2016-2032)
- Figure 15: Global Chatbot Market Revenue (US$ Mn) Comparison by Platform Type (2016-2032)
- Figure 16: Global Chatbot Market Revenue (US$ Mn) Comparison by Deployment Type (2016-2032)
- Figure 17: Global Chatbot Market Revenue (US$ Mn) Comparison by Service Type (2016-2032)
- Figure 18: Global Chatbot Market Revenue (US$ Mn) Comparison by Usage Type (2016-2032)
- Figure 19: Global Chatbot Market Revenue (US$ Mn) Comparison by Industry Vertical (2016-2032)
- Figure 20: Global Chatbot Market Y-o-Y Growth Rate Comparison by Region (2016-2032)
- Figure 21: Global Chatbot Market Y-o-Y Growth Rate Comparison by Platform Type (2016-2032)
- Figure 22: Global Chatbot Market Y-o-Y Growth Rate Comparison by Deployment Type (2016-2032)
- Figure 23: Global Chatbot Market Y-o-Y Growth Rate Comparison by Service Type (2016-2032)
- Figure 24: Global Chatbot Market Y-o-Y Growth Rate Comparison by Usage Type (2016-2032)
- Figure 25: Global Chatbot Market Y-o-Y Growth Rate Comparison by Industry Vertical (2016-2032)
- Figure 26: Global Chatbot Market Share Comparison by Region (2016-2032)
- Figure 27: Global Chatbot Market Share Comparison by Platform Type (2016-2032)
- Figure 28: Global Chatbot Market Share Comparison by Deployment Type (2016-2032)
- Figure 29: Global Chatbot Market Share Comparison by Service Type (2016-2032)
- Figure 30: Global Chatbot Market Share Comparison by Usage Type (2016-2032)
- Figure 31: Global Chatbot Market Share Comparison by Industry Vertical (2016-2032)
- Figure 32: North America Chatbot Market Revenue (US$ Mn) Market Share by Platform Typein 2022
- Figure 33: North America Chatbot Market Attractiveness Analysis by Platform Type, 2016-2032
- Figure 34: North America Chatbot Market Revenue (US$ Mn) Market Share by Deployment Typein 2022
- Figure 35: North America Chatbot Market Attractiveness Analysis by Deployment Type, 2016-2032
- Figure 36: North America Chatbot Market Revenue (US$ Mn) Market Share by Service Typein 2022
- Figure 37: North America Chatbot Market Attractiveness Analysis by Service Type, 2016-2032
- Figure 38: North America Chatbot Market Revenue (US$ Mn) Market Share by Usage Typein 2022
- Figure 39: North America Chatbot Market Attractiveness Analysis by Usage Type, 2016-2032
- Figure 40: North America Chatbot Market Revenue (US$ Mn) Market Share by Industry Verticalin 2022
- Figure 41: North America Chatbot Market Attractiveness Analysis by Industry Vertical, 2016-2032
- Figure 42: North America Chatbot Market Revenue (US$ Mn) Market Share by Country in 2022
- Figure 43: North America Chatbot Market Attractiveness Analysis by Country, 2016-2032
- Figure 44: North America Chatbot Market Revenue (US$ Mn) (2016-2032)
- Figure 45: North America Chatbot Market Revenue (US$ Mn) Comparison by Country (2016-2032)
- Figure 46: North America Chatbot Market Revenue (US$ Mn) Comparison by Platform Type (2016-2032)
- Figure 47: North America Chatbot Market Revenue (US$ Mn) Comparison by Deployment Type (2016-2032)
- Figure 48: North America Chatbot Market Revenue (US$ Mn) Comparison by Service Type (2016-2032)
- Figure 49: North America Chatbot Market Revenue (US$ Mn) Comparison by Usage Type (2016-2032)
- Figure 50: North America Chatbot Market Revenue (US$ Mn) Comparison by Industry Vertical (2016-2032)
- Figure 51: North America Chatbot Market Y-o-Y Growth Rate Comparison by Country (2016-2032)
- Figure 52: North America Chatbot Market Y-o-Y Growth Rate Comparison by Platform Type (2016-2032)
- Figure 53: North America Chatbot Market Y-o-Y Growth Rate Comparison by Deployment Type (2016-2032)
- Figure 54: North America Chatbot Market Y-o-Y Growth Rate Comparison by Service Type (2016-2032)
- Figure 55: North America Chatbot Market Y-o-Y Growth Rate Comparison by Usage Type (2016-2032)
- Figure 56: North America Chatbot Market Y-o-Y Growth Rate Comparison by Industry Vertical (2016-2032)
- Figure 57: North America Chatbot Market Share Comparison by Country (2016-2032)
- Figure 58: North America Chatbot Market Share Comparison by Platform Type (2016-2032)
- Figure 59: North America Chatbot Market Share Comparison by Deployment Type (2016-2032)
- Figure 60: North America Chatbot Market Share Comparison by Service Type (2016-2032)
- Figure 61: North America Chatbot Market Share Comparison by Usage Type (2016-2032)
- Figure 62: North America Chatbot Market Share Comparison by Industry Vertical (2016-2032)
- Figure 63: Western Europe Chatbot Market Revenue (US$ Mn) Market Share by Platform Typein 2022
- Figure 64: Western Europe Chatbot Market Attractiveness Analysis by Platform Type, 2016-2032
- Figure 65: Western Europe Chatbot Market Revenue (US$ Mn) Market Share by Deployment Typein 2022
- Figure 66: Western Europe Chatbot Market Attractiveness Analysis by Deployment Type, 2016-2032
- Figure 67: Western Europe Chatbot Market Revenue (US$ Mn) Market Share by Service Typein 2022
- Figure 68: Western Europe Chatbot Market Attractiveness Analysis by Service Type, 2016-2032
- Figure 69: Western Europe Chatbot Market Revenue (US$ Mn) Market Share by Usage Typein 2022
- Figure 70: Western Europe Chatbot Market Attractiveness Analysis by Usage Type, 2016-2032
- Figure 71: Western Europe Chatbot Market Revenue (US$ Mn) Market Share by Industry Verticalin 2022
- Figure 72: Western Europe Chatbot Market Attractiveness Analysis by Industry Vertical, 2016-2032
- Figure 73: Western Europe Chatbot Market Revenue (US$ Mn) Market Share by Country in 2022
- Figure 74: Western Europe Chatbot Market Attractiveness Analysis by Country, 2016-2032
- Figure 75: Western Europe Chatbot Market Revenue (US$ Mn) (2016-2032)
- Figure 76: Western Europe Chatbot Market Revenue (US$ Mn) Comparison by Country (2016-2032)
- Figure 77: Western Europe Chatbot Market Revenue (US$ Mn) Comparison by Platform Type (2016-2032)
- Figure 78: Western Europe Chatbot Market Revenue (US$ Mn) Comparison by Deployment Type (2016-2032)
- Figure 79: Western Europe Chatbot Market Revenue (US$ Mn) Comparison by Service Type (2016-2032)
- Figure 80: Western Europe Chatbot Market Revenue (US$ Mn) Comparison by Usage Type (2016-2032)
- Figure 81: Western Europe Chatbot Market Revenue (US$ Mn) Comparison by Industry Vertical (2016-2032)
- Figure 82: Western Europe Chatbot Market Y-o-Y Growth Rate Comparison by Country (2016-2032)
- Figure 83: Western Europe Chatbot Market Y-o-Y Growth Rate Comparison by Platform Type (2016-2032)
- Figure 84: Western Europe Chatbot Market Y-o-Y Growth Rate Comparison by Deployment Type (2016-2032)
- Figure 85: Western Europe Chatbot Market Y-o-Y Growth Rate Comparison by Service Type (2016-2032)
- Figure 86: Western Europe Chatbot Market Y-o-Y Growth Rate Comparison by Usage Type (2016-2032)
- Figure 87: Western Europe Chatbot Market Y-o-Y Growth Rate Comparison by Industry Vertical (2016-2032)
- Figure 88: Western Europe Chatbot Market Share Comparison by Country (2016-2032)
- Figure 89: Western Europe Chatbot Market Share Comparison by Platform Type (2016-2032)
- Figure 90: Western Europe Chatbot Market Share Comparison by Deployment Type (2016-2032)
- Figure 91: Western Europe Chatbot Market Share Comparison by Service Type (2016-2032)
- Figure 92: Western Europe Chatbot Market Share Comparison by Usage Type (2016-2032)
- Figure 93: Western Europe Chatbot Market Share Comparison by Industry Vertical (2016-2032)
- Figure 94: Eastern Europe Chatbot Market Revenue (US$ Mn) Market Share by Platform Typein 2022
- Figure 95: Eastern Europe Chatbot Market Attractiveness Analysis by Platform Type, 2016-2032
- Figure 96: Eastern Europe Chatbot Market Revenue (US$ Mn) Market Share by Deployment Typein 2022
- Figure 97: Eastern Europe Chatbot Market Attractiveness Analysis by Deployment Type, 2016-2032
- Figure 98: Eastern Europe Chatbot Market Revenue (US$ Mn) Market Share by Service Typein 2022
- Figure 99: Eastern Europe Chatbot Market Attractiveness Analysis by Service Type, 2016-2032
- Figure 100: Eastern Europe Chatbot Market Revenue (US$ Mn) Market Share by Usage Typein 2022
- Figure 101: Eastern Europe Chatbot Market Attractiveness Analysis by Usage Type, 2016-2032
- Figure 102: Eastern Europe Chatbot Market Revenue (US$ Mn) Market Share by Industry Verticalin 2022
- Figure 103: Eastern Europe Chatbot Market Attractiveness Analysis by Industry Vertical, 2016-2032
- Figure 104: Eastern Europe Chatbot Market Revenue (US$ Mn) Market Share by Country in 2022
- Figure 105: Eastern Europe Chatbot Market Attractiveness Analysis by Country, 2016-2032
- Figure 106: Eastern Europe Chatbot Market Revenue (US$ Mn) (2016-2032)
- Figure 107: Eastern Europe Chatbot Market Revenue (US$ Mn) Comparison by Country (2016-2032)
- Figure 108: Eastern Europe Chatbot Market Revenue (US$ Mn) Comparison by Platform Type (2016-2032)
- Figure 109: Eastern Europe Chatbot Market Revenue (US$ Mn) Comparison by Deployment Type (2016-2032)
- Figure 110: Eastern Europe Chatbot Market Revenue (US$ Mn) Comparison by Service Type (2016-2032)
- Figure 111: Eastern Europe Chatbot Market Revenue (US$ Mn) Comparison by Usage Type (2016-2032)
- Figure 112: Eastern Europe Chatbot Market Revenue (US$ Mn) Comparison by Industry Vertical (2016-2032)
- Figure 113: Eastern Europe Chatbot Market Y-o-Y Growth Rate Comparison by Country (2016-2032)
- Figure 114: Eastern Europe Chatbot Market Y-o-Y Growth Rate Comparison by Platform Type (2016-2032)
- Figure 115: Eastern Europe Chatbot Market Y-o-Y Growth Rate Comparison by Deployment Type (2016-2032)
- Figure 116: Eastern Europe Chatbot Market Y-o-Y Growth Rate Comparison by Service Type (2016-2032)
- Figure 117: Eastern Europe Chatbot Market Y-o-Y Growth Rate Comparison by Usage Type (2016-2032)
- Figure 118: Eastern Europe Chatbot Market Y-o-Y Growth Rate Comparison by Industry Vertical (2016-2032)
- Figure 119: Eastern Europe Chatbot Market Share Comparison by Country (2016-2032)
- Figure 120: Eastern Europe Chatbot Market Share Comparison by Platform Type (2016-2032)
- Figure 121: Eastern Europe Chatbot Market Share Comparison by Deployment Type (2016-2032)
- Figure 122: Eastern Europe Chatbot Market Share Comparison by Service Type (2016-2032)
- Figure 123: Eastern Europe Chatbot Market Share Comparison by Usage Type (2016-2032)
- Figure 124: Eastern Europe Chatbot Market Share Comparison by Industry Vertical (2016-2032)
- Figure 125: APAC Chatbot Market Revenue (US$ Mn) Market Share by Platform Typein 2022
- Figure 126: APAC Chatbot Market Attractiveness Analysis by Platform Type, 2016-2032
- Figure 127: APAC Chatbot Market Revenue (US$ Mn) Market Share by Deployment Typein 2022
- Figure 128: APAC Chatbot Market Attractiveness Analysis by Deployment Type, 2016-2032
- Figure 129: APAC Chatbot Market Revenue (US$ Mn) Market Share by Service Typein 2022
- Figure 130: APAC Chatbot Market Attractiveness Analysis by Service Type, 2016-2032
- Figure 131: APAC Chatbot Market Revenue (US$ Mn) Market Share by Usage Typein 2022
- Figure 132: APAC Chatbot Market Attractiveness Analysis by Usage Type, 2016-2032
- Figure 133: APAC Chatbot Market Revenue (US$ Mn) Market Share by Industry Verticalin 2022
- Figure 134: APAC Chatbot Market Attractiveness Analysis by Industry Vertical, 2016-2032
- Figure 135: APAC Chatbot Market Revenue (US$ Mn) Market Share by Country in 2022
- Figure 136: APAC Chatbot Market Attractiveness Analysis by Country, 2016-2032
- Figure 137: APAC Chatbot Market Revenue (US$ Mn) (2016-2032)
- Figure 138: APAC Chatbot Market Revenue (US$ Mn) Comparison by Country (2016-2032)
- Figure 139: APAC Chatbot Market Revenue (US$ Mn) Comparison by Platform Type (2016-2032)
- Figure 140: APAC Chatbot Market Revenue (US$ Mn) Comparison by Deployment Type (2016-2032)
- Figure 141: APAC Chatbot Market Revenue (US$ Mn) Comparison by Service Type (2016-2032)
- Figure 142: APAC Chatbot Market Revenue (US$ Mn) Comparison by Usage Type (2016-2032)
- Figure 143: APAC Chatbot Market Revenue (US$ Mn) Comparison by Industry Vertical (2016-2032)
- Figure 144: APAC Chatbot Market Y-o-Y Growth Rate Comparison by Country (2016-2032)
- Figure 145: APAC Chatbot Market Y-o-Y Growth Rate Comparison by Platform Type (2016-2032)
- Figure 146: APAC Chatbot Market Y-o-Y Growth Rate Comparison by Deployment Type (2016-2032)
- Figure 147: APAC Chatbot Market Y-o-Y Growth Rate Comparison by Service Type (2016-2032)
- Figure 148: APAC Chatbot Market Y-o-Y Growth Rate Comparison by Usage Type (2016-2032)
- Figure 149: APAC Chatbot Market Y-o-Y Growth Rate Comparison by Industry Vertical (2016-2032)
- Figure 150: APAC Chatbot Market Share Comparison by Country (2016-2032)
- Figure 151: APAC Chatbot Market Share Comparison by Platform Type (2016-2032)
- Figure 152: APAC Chatbot Market Share Comparison by Deployment Type (2016-2032)
- Figure 153: APAC Chatbot Market Share Comparison by Service Type (2016-2032)
- Figure 154: APAC Chatbot Market Share Comparison by Usage Type (2016-2032)
- Figure 155: APAC Chatbot Market Share Comparison by Industry Vertical (2016-2032)
- Figure 156: Latin America Chatbot Market Revenue (US$ Mn) Market Share by Platform Typein 2022
- Figure 157: Latin America Chatbot Market Attractiveness Analysis by Platform Type, 2016-2032
- Figure 158: Latin America Chatbot Market Revenue (US$ Mn) Market Share by Deployment Typein 2022
- Figure 159: Latin America Chatbot Market Attractiveness Analysis by Deployment Type, 2016-2032
- Figure 160: Latin America Chatbot Market Revenue (US$ Mn) Market Share by Service Typein 2022
- Figure 161: Latin America Chatbot Market Attractiveness Analysis by Service Type, 2016-2032
- Figure 162: Latin America Chatbot Market Revenue (US$ Mn) Market Share by Usage Typein 2022
- Figure 163: Latin America Chatbot Market Attractiveness Analysis by Usage Type, 2016-2032
- Figure 164: Latin America Chatbot Market Revenue (US$ Mn) Market Share by Industry Verticalin 2022
- Figure 165: Latin America Chatbot Market Attractiveness Analysis by Industry Vertical, 2016-2032
- Figure 166: Latin America Chatbot Market Revenue (US$ Mn) Market Share by Country in 2022
- Figure 167: Latin America Chatbot Market Attractiveness Analysis by Country, 2016-2032
- Figure 168: Latin America Chatbot Market Revenue (US$ Mn) (2016-2032)
- Figure 169: Latin America Chatbot Market Revenue (US$ Mn) Comparison by Country (2016-2032)
- Figure 170: Latin America Chatbot Market Revenue (US$ Mn) Comparison by Platform Type (2016-2032)
- Figure 171: Latin America Chatbot Market Revenue (US$ Mn) Comparison by Deployment Type (2016-2032)
- Figure 172: Latin America Chatbot Market Revenue (US$ Mn) Comparison by Service Type (2016-2032)
- Figure 173: Latin America Chatbot Market Revenue (US$ Mn) Comparison by Usage Type (2016-2032)
- Figure 174: Latin America Chatbot Market Revenue (US$ Mn) Comparison by Industry Vertical (2016-2032)
- Figure 175: Latin America Chatbot Market Y-o-Y Growth Rate Comparison by Country (2016-2032)
- Figure 176: Latin America Chatbot Market Y-o-Y Growth Rate Comparison by Platform Type (2016-2032)
- Figure 177: Latin America Chatbot Market Y-o-Y Growth Rate Comparison by Deployment Type (2016-2032)
- Figure 178: Latin America Chatbot Market Y-o-Y Growth Rate Comparison by Service Type (2016-2032)
- Figure 179: Latin America Chatbot Market Y-o-Y Growth Rate Comparison by Usage Type (2016-2032)
- Figure 180: Latin America Chatbot Market Y-o-Y Growth Rate Comparison by Industry Vertical (2016-2032)
- Figure 181: Latin America Chatbot Market Share Comparison by Country (2016-2032)
- Figure 182: Latin America Chatbot Market Share Comparison by Platform Type (2016-2032)
- Figure 183: Latin America Chatbot Market Share Comparison by Deployment Type (2016-2032)
- Figure 184: Latin America Chatbot Market Share Comparison by Service Type (2016-2032)
- Figure 185: Latin America Chatbot Market Share Comparison by Usage Type (2016-2032)
- Figure 186: Latin America Chatbot Market Share Comparison by Industry Vertical (2016-2032)
- Figure 187: Middle East & Africa Chatbot Market Revenue (US$ Mn) Market Share by Platform Typein 2022
- Figure 188: Middle East & Africa Chatbot Market Attractiveness Analysis by Platform Type, 2016-2032
- Figure 189: Middle East & Africa Chatbot Market Revenue (US$ Mn) Market Share by Deployment Typein 2022
- Figure 190: Middle East & Africa Chatbot Market Attractiveness Analysis by Deployment Type, 2016-2032
- Figure 191: Middle East & Africa Chatbot Market Revenue (US$ Mn) Market Share by Service Typein 2022
- Figure 192: Middle East & Africa Chatbot Market Attractiveness Analysis by Service Type, 2016-2032
- Figure 193: Middle East & Africa Chatbot Market Revenue (US$ Mn) Market Share by Usage Typein 2022
- Figure 194: Middle East & Africa Chatbot Market Attractiveness Analysis by Usage Type, 2016-2032
- Figure 195: Middle East & Africa Chatbot Market Revenue (US$ Mn) Market Share by Industry Verticalin 2022
- Figure 196: Middle East & Africa Chatbot Market Attractiveness Analysis by Industry Vertical, 2016-2032
- Figure 197: Middle East & Africa Chatbot Market Revenue (US$ Mn) Market Share by Country in 2022
- Figure 198: Middle East & Africa Chatbot Market Attractiveness Analysis by Country, 2016-2032
- Figure 199: Middle East & Africa Chatbot Market Revenue (US$ Mn) (2016-2032)
- Figure 200: Middle East & Africa Chatbot Market Revenue (US$ Mn) Comparison by Country (2016-2032)
- Figure 201: Middle East & Africa Chatbot Market Revenue (US$ Mn) Comparison by Platform Type (2016-2032)
- Figure 202: Middle East & Africa Chatbot Market Revenue (US$ Mn) Comparison by Deployment Type (2016-2032)
- Figure 203: Middle East & Africa Chatbot Market Revenue (US$ Mn) Comparison by Service Type (2016-2032)
- Figure 204: Middle East & Africa Chatbot Market Revenue (US$ Mn) Comparison by Usage Type (2016-2032)
- Figure 205: Middle East & Africa Chatbot Market Revenue (US$ Mn) Comparison by Industry Vertical (2016-2032)
- Figure 206: Middle East & Africa Chatbot Market Y-o-Y Growth Rate Comparison by Country (2016-2032)
- Figure 207: Middle East & Africa Chatbot Market Y-o-Y Growth Rate Comparison by Platform Type (2016-2032)
- Figure 208: Middle East & Africa Chatbot Market Y-o-Y Growth Rate Comparison by Deployment Type (2016-2032)
- Figure 209: Middle East & Africa Chatbot Market Y-o-Y Growth Rate Comparison by Service Type (2016-2032)
- Figure 210: Middle East & Africa Chatbot Market Y-o-Y Growth Rate Comparison by Usage Type (2016-2032)
- Figure 211: Middle East & Africa Chatbot Market Y-o-Y Growth Rate Comparison by Industry Vertical (2016-2032)
- Figure 212: Middle East & Africa Chatbot Market Share Comparison by Country (2016-2032)
- Figure 213: Middle East & Africa Chatbot Market Share Comparison by Platform Type (2016-2032)
- Figure 214: Middle East & Africa Chatbot Market Share Comparison by Deployment Type (2016-2032)
- Figure 215: Middle East & Africa Chatbot Market Share Comparison by Service Type (2016-2032)
- Figure 216: Middle East & Africa Chatbot Market Share Comparison by Usage Type (2016-2032)
- Figure 217: Middle East & Africa Chatbot Market Share Comparison by Industry Vertical (2016-2032)
"
- List of Tables
- "
- Table 1: Global Chatbot Market Comparison by Platform Type (2016-2032)
- Table 2: Global Chatbot Market Comparison by Deployment Type (2016-2032)
- Table 3: Global Chatbot Market Comparison by Service Type (2016-2032)
- Table 4: Global Chatbot Market Comparison by Usage Type (2016-2032)
- Table 5: Global Chatbot Market Comparison by Industry Vertical (2016-2032)
- Table 6: Global Chatbot Market Revenue (US$ Mn) Comparison by Region (2016-2032)
- Table 7: Global Chatbot Market Revenue (US$ Mn) (2016-2032)
- Table 8: Global Chatbot Market Revenue (US$ Mn) Comparison by Region (2016-2032)
- Table 9: Global Chatbot Market Revenue (US$ Mn) Comparison by Platform Type (2016-2032)
- Table 10: Global Chatbot Market Revenue (US$ Mn) Comparison by Deployment Type (2016-2032)
- Table 11: Global Chatbot Market Revenue (US$ Mn) Comparison by Service Type (2016-2032)
- Table 12: Global Chatbot Market Revenue (US$ Mn) Comparison by Usage Type (2016-2032)
- Table 13: Global Chatbot Market Revenue (US$ Mn) Comparison by Industry Vertical (2016-2032)
- Table 14: Global Chatbot Market Y-o-Y Growth Rate Comparison by Region (2016-2032)
- Table 15: Global Chatbot Market Y-o-Y Growth Rate Comparison by Platform Type (2016-2032)
- Table 16: Global Chatbot Market Y-o-Y Growth Rate Comparison by Deployment Type (2016-2032)
- Table 17: Global Chatbot Market Y-o-Y Growth Rate Comparison by Service Type (2016-2032)
- Table 18: Global Chatbot Market Y-o-Y Growth Rate Comparison by Usage Type (2016-2032)
- Table 19: Global Chatbot Market Y-o-Y Growth Rate Comparison by Industry Vertical (2016-2032)
- Table 20: Global Chatbot Market Share Comparison by Region (2016-2032)
- Table 21: Global Chatbot Market Share Comparison by Platform Type (2016-2032)
- Table 22: Global Chatbot Market Share Comparison by Deployment Type (2016-2032)
- Table 23: Global Chatbot Market Share Comparison by Service Type (2016-2032)
- Table 24: Global Chatbot Market Share Comparison by Usage Type (2016-2032)
- Table 25: Global Chatbot Market Share Comparison by Industry Vertical (2016-2032)
- Table 26: North America Chatbot Market Comparison by Deployment Type (2016-2032)
- Table 27: North America Chatbot Market Comparison by Service Type (2016-2032)
- Table 28: North America Chatbot Market Comparison by Usage Type (2016-2032)
- Table 29: North America Chatbot Market Comparison by Industry Vertical (2016-2032)
- Table 30: North America Chatbot Market Revenue (US$ Mn) Comparison by Country (2016-2032)
- Table 31: North America Chatbot Market Revenue (US$ Mn) (2016-2032)
- Table 32: North America Chatbot Market Revenue (US$ Mn) Comparison by Country (2016-2032)
- Table 33: North America Chatbot Market Revenue (US$ Mn) Comparison by Platform Type (2016-2032)
- Table 34: North America Chatbot Market Revenue (US$ Mn) Comparison by Deployment Type (2016-2032)
- Table 35: North America Chatbot Market Revenue (US$ Mn) Comparison by Service Type (2016-2032)
- Table 36: North America Chatbot Market Revenue (US$ Mn) Comparison by Usage Type (2016-2032)
- Table 37: North America Chatbot Market Revenue (US$ Mn) Comparison by Industry Vertical (2016-2032)
- Table 38: North America Chatbot Market Y-o-Y Growth Rate Comparison by Country (2016-2032)
- Table 39: North America Chatbot Market Y-o-Y Growth Rate Comparison by Platform Type (2016-2032)
- Table 40: North America Chatbot Market Y-o-Y Growth Rate Comparison by Deployment Type (2016-2032)
- Table 41: North America Chatbot Market Y-o-Y Growth Rate Comparison by Service Type (2016-2032)
- Table 42: North America Chatbot Market Y-o-Y Growth Rate Comparison by Usage Type (2016-2032)
- Table 43: North America Chatbot Market Y-o-Y Growth Rate Comparison by Industry Vertical (2016-2032)
- Table 44: North America Chatbot Market Share Comparison by Country (2016-2032)
- Table 45: North America Chatbot Market Share Comparison by Platform Type (2016-2032)
- Table 46: North America Chatbot Market Share Comparison by Deployment Type (2016-2032)
- Table 47: North America Chatbot Market Share Comparison by Service Type (2016-2032)
- Table 48: North America Chatbot Market Share Comparison by Usage Type (2016-2032)
- Table 49: North America Chatbot Market Share Comparison by Industry Vertical (2016-2032)
- Table 50: Western Europe Chatbot Market Comparison by Platform Type (2016-2032)
- Table 51: Western Europe Chatbot Market Comparison by Deployment Type (2016-2032)
- Table 52: Western Europe Chatbot Market Comparison by Service Type (2016-2032)
- Table 53: Western Europe Chatbot Market Comparison by Usage Type (2016-2032)
- Table 54: Western Europe Chatbot Market Comparison by Industry Vertical (2016-2032)
- Table 55: Western Europe Chatbot Market Revenue (US$ Mn) Comparison by Country (2016-2032)
- Table 56: Western Europe Chatbot Market Revenue (US$ Mn) (2016-2032)
- Table 57: Western Europe Chatbot Market Revenue (US$ Mn) Comparison by Country (2016-2032)
- Table 58: Western Europe Chatbot Market Revenue (US$ Mn) Comparison by Platform Type (2016-2032)
- Table 59: Western Europe Chatbot Market Revenue (US$ Mn) Comparison by Deployment Type (2016-2032)
- Table 60: Western Europe Chatbot Market Revenue (US$ Mn) Comparison by Service Type (2016-2032)
- Table 61: Western Europe Chatbot Market Revenue (US$ Mn) Comparison by Usage Type (2016-2032)
- Table 62: Western Europe Chatbot Market Revenue (US$ Mn) Comparison by Industry Vertical (2016-2032)
- Table 63: Western Europe Chatbot Market Y-o-Y Growth Rate Comparison by Country (2016-2032)
- Table 64: Western Europe Chatbot Market Y-o-Y Growth Rate Comparison by Platform Type (2016-2032)
- Table 65: Western Europe Chatbot Market Y-o-Y Growth Rate Comparison by Deployment Type (2016-2032)
- Table 66: Western Europe Chatbot Market Y-o-Y Growth Rate Comparison by Service Type (2016-2032)
- Table 67: Western Europe Chatbot Market Y-o-Y Growth Rate Comparison by Usage Type (2016-2032)
- Table 68: Western Europe Chatbot Market Y-o-Y Growth Rate Comparison by Industry Vertical (2016-2032)
- Table 69: Western Europe Chatbot Market Share Comparison by Country (2016-2032)
- Table 70: Western Europe Chatbot Market Share Comparison by Platform Type (2016-2032)
- Table 71: Western Europe Chatbot Market Share Comparison by Deployment Type (2016-2032)
- Table 72: Western Europe Chatbot Market Share Comparison by Service Type (2016-2032)
- Table 73: Western Europe Chatbot Market Share Comparison by Usage Type (2016-2032)
- Table 74: Western Europe Chatbot Market Share Comparison by Industry Vertical (2016-2032)
- Table 75: Eastern Europe Chatbot Market Comparison by Platform Type (2016-2032)
- Table 76: Eastern Europe Chatbot Market Comparison by Deployment Type (2016-2032)
- Table 77: Eastern Europe Chatbot Market Comparison by Service Type (2016-2032)
- Table 78: Eastern Europe Chatbot Market Comparison by Usage Type (2016-2032)
- Table 79: Eastern Europe Chatbot Market Comparison by Industry Vertical (2016-2032)
- Table 80: Eastern Europe Chatbot Market Revenue (US$ Mn) Comparison by Country (2016-2032)
- Table 81: Eastern Europe Chatbot Market Revenue (US$ Mn) (2016-2032)
- Table 82: Eastern Europe Chatbot Market Revenue (US$ Mn) Comparison by Country (2016-2032)
- Table 83: Eastern Europe Chatbot Market Revenue (US$ Mn) Comparison by Platform Type (2016-2032)
- Table 84: Eastern Europe Chatbot Market Revenue (US$ Mn) Comparison by Deployment Type (2016-2032)
- Table 85: Eastern Europe Chatbot Market Revenue (US$ Mn) Comparison by Service Type (2016-2032)
- Table 86: Eastern Europe Chatbot Market Revenue (US$ Mn) Comparison by Usage Type (2016-2032)
- Table 87: Eastern Europe Chatbot Market Revenue (US$ Mn) Comparison by Industry Vertical (2016-2032)
- Table 88: Eastern Europe Chatbot Market Y-o-Y Growth Rate Comparison by Country (2016-2032)
- Table 89: Eastern Europe Chatbot Market Y-o-Y Growth Rate Comparison by Platform Type (2016-2032)
- Table 90: Eastern Europe Chatbot Market Y-o-Y Growth Rate Comparison by Deployment Type (2016-2032)
- Table 91: Eastern Europe Chatbot Market Y-o-Y Growth Rate Comparison by Service Type (2016-2032)
- Table 92: Eastern Europe Chatbot Market Y-o-Y Growth Rate Comparison by Usage Type (2016-2032)
- Table 93: Eastern Europe Chatbot Market Y-o-Y Growth Rate Comparison by Industry Vertical (2016-2032)
- Table 94: Eastern Europe Chatbot Market Share Comparison by Country (2016-2032)
- Table 95: Eastern Europe Chatbot Market Share Comparison by Platform Type (2016-2032)
- Table 96: Eastern Europe Chatbot Market Share Comparison by Deployment Type (2016-2032)
- Table 97: Eastern Europe Chatbot Market Share Comparison by Service Type (2016-2032)
- Table 98: Eastern Europe Chatbot Market Share Comparison by Usage Type (2016-2032)
- Table 99: Eastern Europe Chatbot Market Share Comparison by Industry Vertical (2016-2032)
- Table 100: APAC Chatbot Market Comparison by Platform Type (2016-2032)
- Table 101: APAC Chatbot Market Comparison by Deployment Type (2016-2032)
- Table 102: APAC Chatbot Market Comparison by Service Type (2016-2032)
- Table 103: APAC Chatbot Market Comparison by Usage Type (2016-2032)
- Table 104: APAC Chatbot Market Comparison by Industry Vertical (2016-2032)
- Table 105: APAC Chatbot Market Revenue (US$ Mn) Comparison by Country (2016-2032)
- Table 106: APAC Chatbot Market Revenue (US$ Mn) (2016-2032)
- Table 107: APAC Chatbot Market Revenue (US$ Mn) Comparison by Country (2016-2032)
- Table 108: APAC Chatbot Market Revenue (US$ Mn) Comparison by Platform Type (2016-2032)
- Table 109: APAC Chatbot Market Revenue (US$ Mn) Comparison by Deployment Type (2016-2032)
- Table 110: APAC Chatbot Market Revenue (US$ Mn) Comparison by Service Type (2016-2032)
- Table 111: APAC Chatbot Market Revenue (US$ Mn) Comparison by Usage Type (2016-2032)
- Table 112: APAC Chatbot Market Revenue (US$ Mn) Comparison by Industry Vertical (2016-2032)
- Table 113: APAC Chatbot Market Y-o-Y Growth Rate Comparison by Country (2016-2032)
- Table 114: APAC Chatbot Market Y-o-Y Growth Rate Comparison by Platform Type (2016-2032)
- Table 115: APAC Chatbot Market Y-o-Y Growth Rate Comparison by Deployment Type (2016-2032)
- Table 116: APAC Chatbot Market Y-o-Y Growth Rate Comparison by Service Type (2016-2032)
- Table 117: APAC Chatbot Market Y-o-Y Growth Rate Comparison by Usage Type (2016-2032)
- Table 118: APAC Chatbot Market Y-o-Y Growth Rate Comparison by Industry Vertical (2016-2032)
- Table 119: APAC Chatbot Market Share Comparison by Country (2016-2032)
- Table 120: APAC Chatbot Market Share Comparison by Platform Type (2016-2032)
- Table 121: APAC Chatbot Market Share Comparison by Deployment Type (2016-2032)
- Table 122: APAC Chatbot Market Share Comparison by Service Type (2016-2032)
- Table 123: APAC Chatbot Market Share Comparison by Usage Type (2016-2032)
- Table 124: APAC Chatbot Market Share Comparison by Industry Vertical (2016-2032)
- Table 125: Latin America Chatbot Market Comparison by Platform Type (2016-2032)
- Table 126: Latin America Chatbot Market Comparison by Deployment Type (2016-2032)
- Table 127: Latin America Chatbot Market Comparison by Service Type (2016-2032)
- Table 128: Latin America Chatbot Market Comparison by Usage Type (2016-2032)
- Table 129: Latin America Chatbot Market Comparison by Industry Vertical (2016-2032)
- Table 130: Latin America Chatbot Market Revenue (US$ Mn) Comparison by Country (2016-2032)
- Table 131: Latin America Chatbot Market Revenue (US$ Mn) (2016-2032)
- Table 132: Latin America Chatbot Market Revenue (US$ Mn) Comparison by Country (2016-2032)
- Table 133: Latin America Chatbot Market Revenue (US$ Mn) Comparison by Platform Type (2016-2032)
- Table 134: Latin America Chatbot Market Revenue (US$ Mn) Comparison by Deployment Type (2016-2032)
- Table 135: Latin America Chatbot Market Revenue (US$ Mn) Comparison by Service Type (2016-2032)
- Table 136: Latin America Chatbot Market Revenue (US$ Mn) Comparison by Usage Type (2016-2032)
- Table 137: Latin America Chatbot Market Revenue (US$ Mn) Comparison by Industry Vertical (2016-2032)
- Table 138: Latin America Chatbot Market Y-o-Y Growth Rate Comparison by Country (2016-2032)
- Table 139: Latin America Chatbot Market Y-o-Y Growth Rate Comparison by Platform Type (2016-2032)
- Table 140: Latin America Chatbot Market Y-o-Y Growth Rate Comparison by Deployment Type (2016-2032)
- Table 141: Latin America Chatbot Market Y-o-Y Growth Rate Comparison by Service Type (2016-2032)
- Table 142: Latin America Chatbot Market Y-o-Y Growth Rate Comparison by Usage Type (2016-2032)
- Table 143: Latin America Chatbot Market Y-o-Y Growth Rate Comparison by Industry Vertical (2016-2032)
- Table 144: Latin America Chatbot Market Share Comparison by Country (2016-2032)
- Table 145: Latin America Chatbot Market Share Comparison by Platform Type (2016-2032)
- Table 146: Latin America Chatbot Market Share Comparison by Deployment Type (2016-2032)
- Table 147: Latin America Chatbot Market Share Comparison by Service Type (2016-2032)
- Table 148: Latin America Chatbot Market Share Comparison by Usage Type (2016-2032)
- Table 149: Latin America Chatbot Market Share Comparison by Industry Vertical (2016-2032)
- Table 150: Middle East & Africa Chatbot Market Comparison by Platform Type (2016-2032)
- Table 151: Middle East & Africa Chatbot Market Comparison by Deployment Type (2016-2032)
- Table 152: Middle East & Africa Chatbot Market Comparison by Service Type (2016-2032)
- Table 153: Middle East & Africa Chatbot Market Comparison by Usage Type (2016-2032)
- Table 154: Middle East & Africa Chatbot Market Comparison by Industry Vertical (2016-2032)
- Table 155: Middle East & Africa Chatbot Market Revenue (US$ Mn) Comparison by Country (2016-2032)
- Table 156: Middle East & Africa Chatbot Market Revenue (US$ Mn) (2016-2032)
- Table 157: Middle East & Africa Chatbot Market Revenue (US$ Mn) Comparison by Country (2016-2032)
- Table 158: Middle East & Africa Chatbot Market Revenue (US$ Mn) Comparison by Platform Type (2016-2032)
- Table 159: Middle East & Africa Chatbot Market Revenue (US$ Mn) Comparison by Deployment Type (2016-2032)
- Table 160: Middle East & Africa Chatbot Market Revenue (US$ Mn) Comparison by Service Type (2016-2032)
- Table 161: Middle East & Africa Chatbot Market Revenue (US$ Mn) Comparison by Usage Type (2016-2032)
- Table 162: Middle East & Africa Chatbot Market Revenue (US$ Mn) Comparison by Industry Vertical (2016-2032)
- Table 163: Middle East & Africa Chatbot Market Y-o-Y Growth Rate Comparison by Country (2016-2032)
- Table 164: Middle East & Africa Chatbot Market Y-o-Y Growth Rate Comparison by Platform Type (2016-2032)
- Table 165: Middle East & Africa Chatbot Market Y-o-Y Growth Rate Comparison by Deployment Type (2016-2032)
- Table 166: Middle East & Africa Chatbot Market Y-o-Y Growth Rate Comparison by Service Type (2016-2032)
- Table 167: Middle East & Africa Chatbot Market Y-o-Y Growth Rate Comparison by Usage Type (2016-2032)
- Table 168: Middle East & Africa Chatbot Market Y-o-Y Growth Rate Comparison by Industry Vertical (2016-2032)
- Table 169: Middle East & Africa Chatbot Market Share Comparison by Country (2016-2032)
- Table 170: Middle East & Africa Chatbot Market Share Comparison by Platform Type (2016-2032)
- Table 171: Middle East & Africa Chatbot Market Share Comparison by Deployment Type (2016-2032)
- Table 172: Middle East & Africa Chatbot Market Share Comparison by Service Type (2016-2032)
- Table 173: Middle East & Africa Chatbot Market Share Comparison by Usage Type (2016-2032)
- Table 174: Middle East & Africa Chatbot Market Share Comparison by Industry Vertical (2016-2032)
- 1. Executive Summary
-
- IBM Corporation
- Google LLC
- Microsoft Corporation
- Amazon Web Services, Inc.
- Facebook, Inc.
- Nuance Communications, Inc.
- Oracle Corporation
- Inbenta Technologies Inc.
- Artificial Solutions
- Rasa Technologies GmbH
- SAP SE
- Kore.ai, Inc.
- LivePerson, Inc.
Our Clients


View Our Licence Options
