Carmine Market Report By Form (Powder, Liquid, Crystal, Granules), By Application (Food and Beverages, Cosmetics and Personal Care, Pharmaceuticals, Others), By Region and Companies - Industry Segment Outlook, Market Assessment, Competition Scenario, Trends and Forecast 2024-2033
-
48767
-
July 2024
-
321
-


-
This report was compiled by Shreyas Rokade Shreyas Rokade is a seasoned Research Analyst with CMFE, bringing extensive expertise in market research and consulting, with a strong background in Chemical Engineering. Correspondence Team Lead-CMFE Linkedin | Detailed Market research Methodology Our methodology involves a mix of primary research, including interviews with leading mental health experts, and secondary research from reputable medical journals and databases. View Detailed Methodology Page
-
Quick Navigation
Report Overview
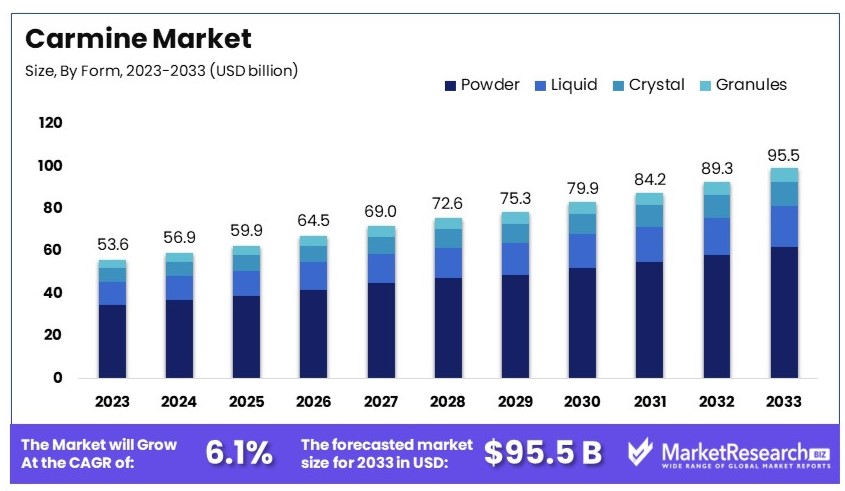
The Global Carmine Market size is expected to be worth around USD 95.5 Billion by 2033, from USD 53.6 Billion in 2023, growing at a CAGR of 6.1% during the forecast period from 2024 to 2033.
The Carmine Market pertains to the production and sales of carmine dye, a natural colorant derived from cochineal insects. This market caters to industries such as food and beverages, cosmetics, and pharmaceuticals, where carmine is valued for its vivid red color and natural origins.
With growing consumer preference for natural additives over synthetic alternatives, the carmine market is seeing a surge in demand. The key drivers for this market are the expanding food industry, regulatory support for natural ingredients, and advancements in extraction and processing technologies.
The carmine market is experiencing steady growth, driven by its widespread application in various industries. Carmine, a natural red dye derived from cochineal insects, is used extensively in the food, cosmetic, and pharmaceutical sectors. Approximately 70,000 insects are required to produce one pound of carmine, highlighting the intensive production process involved.
In the pharmaceutical industry, carmine serves as a coloring agent in tablets and capsules, ensuring product differentiation and consumer appeal. Regulatory frameworks significantly impact the market dynamics, with specific guidelines in place across different regions. For instance, in the European Union, carmine is listed as E120, and its usage is strictly regulated to ensure consumer safety. Similarly, the United States has established permissible levels for carmine in food and pharmaceutical products, emphasizing the importance of compliance with safety standards.
The food and beverage industry remains a significant driver of demand for carmine. Consumers' preference for natural and clean-label products fuels this demand. Carmine is favored for its vibrant color and natural origin, aligning with the growing trend towards natural additives over synthetic alternatives.
Innovation and technological advancements are also shaping the market. Producers are investing in more efficient extraction processes to enhance yield and reduce production costs. This focus on innovation ensures the sustainability of carmine production and meets the increasing global demand.
Strategic partnerships and collaborations within the industry further bolster market growth. Companies are working together to expand their product offerings and market reach, driving competitive advantage.
Key Takeaways
- Market Value: The Carmine Market was valued at USD 53.6 billion in 2023 and is expected to reach USD 95.5 billion by 2033, with a CAGR of 6.1%.
- Form Analysis: Powder form dominates with 65%, due to its ease of use and stability.
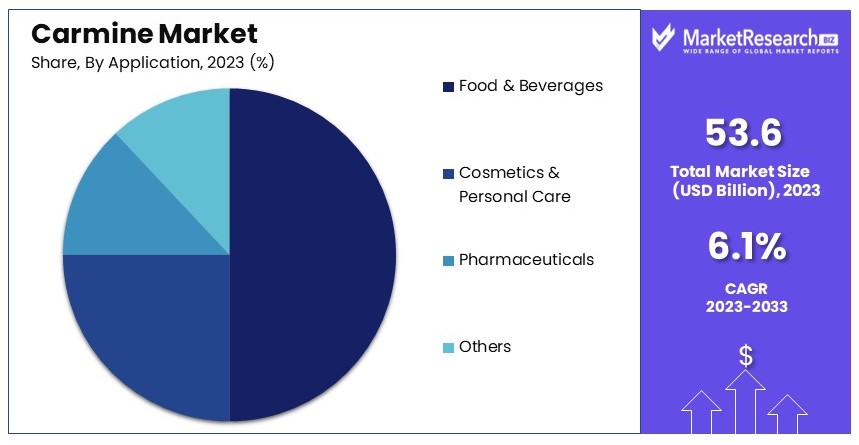
- Application Analysis: Food and Beverages lead with 50%, driven by natural colorant demand.
- End User Analysis: Food and Beverages sector dominates with 60%, highlighting its major use in this industry.
- Dominant Region: Europe leads with 37.3%, driven by stringent regulations on artificial colors.
- Analyst Viewpoint: The market shows steady growth with moderate competition, expected to rise with the increasing demand for natural colorants.
- Growth Opportunities: Key players can focus on expanding their natural colorant portfolio and exploring new applications in cosmetics and pharmaceuticals.
Driving Factors
Rising Demand from the Food and Beverage Industry Drives Market Growth
The food and beverage sector significantly contributes to the growth of the carmine market. Carmine, prized for its vibrant natural color, is increasingly favored over synthetic dyes in products like juices, yogurts, and confectioneries.
This trend is driven by consumer demand for natural and clean-label ingredients, reflecting a broader shift towards healthier and more sustainable consumption habits. For instance, several leading beverage companies have adopted carmine to align with the preferences of health-conscious consumers. This shift not only supports market growth by increasing the use of carmine in existing products but also encourages innovation in new products that prioritize natural ingredients.
Expansion of the Cosmetics and Personal Care Market Fuels Carmine Demand
The cosmetics and personal care industry plays a crucial role in the expanding market for carmine. Used extensively as a pigment in products like lipsticks, blushes, and eye shadows, carmine benefits from the growing consumer inclination towards natural and organic cosmetics.
With rising disposable incomes and evolving lifestyle choices, particularly in emerging markets, there is a notable surge in demand for carmine. High-end cosmetic brands are increasingly incorporating carmine into their product lines to meet consumer demands for sustainability and natural composition, thereby driving market growth.
Increasing Use in the Pharmaceutical Industry Supports Market Expansion
Carmine's role in the pharmaceutical industry is becoming increasingly significant. As a natural coloring agent, it is used in a variety of products, including tablets, capsules, and syrups. The pharmaceutical sector's growth, especially in developing regions, augments the demand for natural ingredients like carmine.
This trend is driven by both regulatory pressures to reduce synthetic additives and consumer preference for naturally-derived medicinal products. Many pharmaceutical companies are integrating carmine into their formulations to enhance appeal and ensure compliance with safety standards, thus propelling the carmine market forward.
Restraining Factors
Ethical Concerns and Vegetarian/Vegan Preferences Restrain Carmine Market Growth
Ethical concerns and vegetarian/vegan preferences significantly limit the carmine market. Carmine, derived from the cochineal insect, raises ethical issues among consumers, particularly vegans and vegetarians. These groups avoid products containing carmine, reducing its market potential.
Additionally, concerns about the ethical treatment of insects during extraction further deter some consumers. The growing demand for cruelty-free and plant-based products amplifies this issue. This ethical consideration restricts the market for carmine as more consumers opt for alternatives, slowing market growth.
Regulatory Challenges and Labeling Requirements Restrain Carmine Market Growth
Regulatory challenges and labeling requirements pose significant obstacles to the carmine market. Carmine is subject to strict labeling regulations in various regions due to its potential allergen status. These regulations increase compliance costs for manufacturers, who must ensure proper labeling to avoid legal issues.
For example, changes in regulations or stricter labeling requirements can create additional challenges for market participants. Compliance with these regulations can be costly and time-consuming, potentially discouraging the use of carmine in products. This regulatory burden limits market growth as manufacturers seek alternative colorants that are easier and cheaper to comply with.
Form Analysis
Powder dominates with 65% due to its versatility and ease of integration in various products.
In the carmine market, the form in which carmine is used varies significantly, with powder, liquid, crystal, and granules as the main forms. Powdered carmine is the most prevalent, favored for its ease of integration into various products, from cosmetics to food items. Its fine texture allows for seamless blending, offering consistent color quality that is crucial in end products.
Liquid carmine is also used extensively, particularly in beverages and liquid cosmetics, where it provides vibrant color without the sedimentation associated with powders. Crystals and granules are less common but are utilized in specific applications where gradual release of color or easier handling during the manufacturing process is required.
The dominance of powdered carmine is due to its broad applicability, including ease of storage and transport, and its effectiveness in a wide range of product pH levels. It remains a staple in industries that value natural and vibrant colors.
Application Analysis
Food and Beverages dominate with 50% due to increasing consumer demand for natural food colorants.
Carmine finds applications across various industries, including food and beverages, cosmetics and personal care, pharmaceuticals, and others. The largest market share belongs to the food and beverages sector, driven by growing consumer preferences for natural ingredients over synthetic colorants. Within this sector, carmine is valued for its vibrant red color, making it a popular choice in products like meats, sausages, confectionery, and beverages.
Cosmetics and personal care is another significant application area, where carmine is used in products such as lipsticks and blushes due to its excellent compatibility with other ingredients and its natural origin, which is highly appealing in today’s market.
Pharmaceuticals also utilize carmine, particularly in coatings for pills and tablets, where natural colorants are increasingly preferred over synthetic alternatives.
The "others" category includes smaller-scale applications like textile dyes and inks, where carmine’s natural properties are beneficial, though these markets are relatively niche compared to food and cosmetics.
Key Market Segments
By Form
- Powder
- Liquid
- Crystal
- Granules
By Application
- Food and Beverages
- Cosmetics and Personal Care
- Pharmaceuticals
- Others
Growth Opportunities
Development of Sustainable and Ethical Sourcing Practices Offers Growth Opportunity
Focusing on sustainable and ethical sourcing practices for carmine can drive market growth. Companies can address ethical concerns by implementing fair trade practices, ensuring the humane treatment of cochineal insects, and promoting transparency in the supply chain.
These initiatives enhance consumer trust and meet the growing demand for sustainability. By adopting these practices, companies can differentiate their products and appeal to a broader, more conscientious consumer base. Promoting ethical sourcing can significantly boost the reputation and market potential of carmine products.
Innovation in Product Applications Offers Growth Opportunity
The versatility of carmine as a natural coloring agent presents numerous opportunities for innovation. Companies can explore new applications in industries like textiles, printing, and cosmeceuticals.
Continuous research and development efforts can identify novel uses for carmine, expanding its market reach. For instance, incorporating carmine in new textile dyes or cosmetic products can attract diverse consumer segments. By innovating and diversifying product applications, companies can drive growth and open new market avenues for carmine.
Trending Factors
Clean-Label and Natural Product Trends Are Trending Factors
The growing preference for clean-label and natural products is a significant trend driving the demand for carmine. Consumers are increasingly conscious of the ingredients in their products and are seeking natural alternatives to synthetic additives.
This trend creates a favorable market environment for carmine, a natural coloring agent. As more consumers and manufacturers prioritize clean-label ingredients, the demand for carmine will continue to rise, expanding its market potential and solidifying its place in various industries.
Sustainable and Eco-Friendly Practices Are Trending Factors
Sustainability and eco-friendliness are becoming crucial considerations for consumers and businesses. Carmine, being of natural origin and biodegradable, aligns well with these trends. Its use supports environmentally conscious choices and helps companies reduce their ecological footprint.
By promoting the sustainable aspects of carmine, businesses can attract environmentally aware consumers and strengthen their market position. The growing emphasis on sustainability will drive the demand for carmine, making it a preferred choice in the market.
Regional Analysis
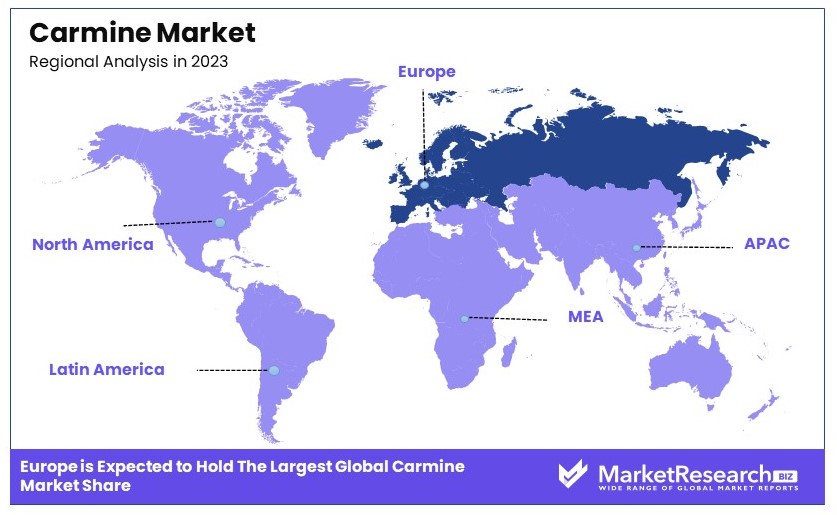
Europe Dominates with 37.3% Market Share in the Carmine Market
Europe's substantial 37.3% share of the global carmine market is driven by its robust food and beverage industry, where carmine is extensively used as a natural food coloring. The region's strong emphasis on natural and non-synthetic ingredients aligns with consumer preferences for clean-label products. Additionally, Europe's stringent regulations on artificial colorants further boost the demand for natural alternatives like carmine.
The European carmine market benefits from high consumer awareness and demand for natural products. The region's advanced food processing technology and innovation also play crucial roles, enabling high-quality carmine production. Europe's strategic geographic location facilitates easy export to both Eastern Europe and neighboring regions, enhancing its market dynamics.
The future of Europe's dominance in the carmine market appears secure, supported by ongoing trends towards natural and organic food products. As European consumers continue to prioritize health and sustainability, the demand for natural colorants like carmine is expected to grow. Technological advancements in extraction and processing techniques are also anticipated to improve yield and reduce costs, further strengthening Europe's market position.
Regional Market Shares and Dynamics:
North America: North America holds approximately 25% of the global carmine market. The region's market is driven by increasing consumer preference for natural products and stringent FDA regulations regarding food additives. The U.S. leads in the demand for carmine used in cosmetics and pharmaceuticals, contributing to its substantial market share.
Asia Pacific: Asia Pacific accounts for about 20% of the market. Rapid industrial growth, especially in the food and beverage sector in countries like China and India, supports the demand for natural colorants. However, regulatory variability across countries affects market uniformity.
Middle East & Africa: This region captures around 10% of the market. Growth is primarily driven by expanding food industries and rising consumer awareness about product ingredients. The Middle East, in particular, shows potential due to its increasing investments in food safety and standards.
Latin America: Latin America holds roughly 8% of the market. Countries like Brazil and Mexico have growing food processing sectors that demand natural ingredients, including carmine, supporting gradual market growth.
Key Regions and Countries
- North America
- The US
- Canada
- Mexico
- Western Europe
- Germany
- France
- The UK
- Spain
- Italy
- Portugal
- Ireland
- Austria
- Switzerland
- Benelux
- Nordic
- Rest of Western Europe
- Eastern Europe
- Russia
- Poland
- The Czech Republic
- Greece
- Rest of Eastern Europe
- APAC
- China
- Japan
- South Korea
- India
- Australia & New Zealand
- Indonesia
- Malaysia
- Philippines
- Singapore
- Thailand
- Vietnam
- Rest of APAC
- Latin America
- Brazil
- Colombia
- Chile
- Argentina
- Costa Rica
- Rest of Latin America
- Middle East & Africa
- Algeria
- Egypt
- Israel
- Kuwait
- Nigeria
- Saudi Arabia
- South Africa
- Turkey
- United Arab Emirates
- Rest of MEA
Key Players Analysis
The Carmine Market includes several key players. Amerilure, Inc. and Chr. Hansen Holding A/S are market leaders with extensive product lines and strong R&D capabilities. They focus on high-quality natural colors and global distribution.
Sensient Colors LLC and Proquimac Pfc SA are notable for their innovative color solutions and strong market presence. Their strategic focus on sustainability and product development enhances their positions.
BioconColors and Naturex S.A. excel in producing eco-friendly and organic carmine products. They leverage strong regional networks and advanced extraction techniques.
Roha Dyechem Pvt. Ltd. and DyStar Singapore Pte Ltd. are recognized for their extensive product portfolios and focus on quality. Their strategies include expanding their market reach and enhancing customer satisfaction.
DDW The Color House and IFC Solutions stand out for their customized solutions and reliable products. Their emphasis on innovation and client partnerships boosts their market influence.
ColorMaker, Inc. and Vinayak Ingredients (India) Pvt. Ltd. are significant players with their focus on natural ingredients and sustainable practices. They prioritize research and expanding product lines.
Colores Naturales de México S.A. de C.V. and GNT Group B.V. are known for their advanced production methods and high-quality carmine. Their strong emphasis on sustainability and customer needs enhances their market positions.
Holland Ingredients B.V. is notable for its specialized natural color solutions and commitment to quality. Its strategic positioning in niche markets enhances its influence.
Overall, the market features a mix of global leaders and specialized firms, each contributing to growth through innovation, sustainability, and strategic partnerships.
Market Key Players
- Amerilure, Inc.
- Chr. Hansen Holding A/S
- Sensient Colors LLC
- Proquimac Pfc SA
- BioconColors
- Naturex S.A.
- Roha Dyechem Pvt. Ltd.
- DyStar Singapore Pte Ltd.
- DDW The Color House
- IFC Solutions
- ColorMaker, Inc.
- Vinayak Ingredients (India) Pvt. Ltd.
- Colores Naturales de México S.A. de C.V.
- GNT Group B.V.
- Holland Ingredients B.V.
Recent Developments
- 2022: Sensient Technologies Corporation, a key player in the carmine market, acquired Mazza Innovation to expand its natural ingredient portfolio.
Report Scope
Report Features Description Market Value (2023) USD 53.6 Billion Forecast Revenue (2033) USD 95.5 Billion CAGR (2024-2033) 6.1% Base Year for Estimation 2023 Historic Period 2018-2023 Forecast Period 2024-2033 Report Coverage Revenue Forecast, Market Dynamics, Competitive Landscape, Recent Developments Segments Covered By Form (Powder, Liquid, Crystal, Granules), By Application (Food and Beverages, Cosmetics and Personal Care, Pharmaceuticals, Others) Regional Analysis North America - The US, Canada, & Mexico; Western Europe - Germany, France, The UK, Spain, Italy, Portugal, Ireland, Austria, Switzerland, Benelux, Nordic, & Rest of Western Europe; Eastern Europe - Russia, Poland, The Czech Republic, Greece, & Rest of Eastern Europe; APAC - China, Japan, South Korea, India, Australia & New Zealand, Indonesia, Malaysia, Philippines, Singapore, Thailand, Vietnam, & Rest of APAC; Latin America - Brazil, Colombia, Chile, Argentina, Costa Rica, & Rest of Latin America; Middle East & Africa - Algeria, Egypt, Israel, Kuwait, Nigeria, Saudi Arabia, South Africa, Turkey, United Arab Emirates, & Rest of MEA Competitive Landscape Amerilure, Inc., Chr. Hansen Holding A/S, Sensient Colors LLC, Proquimac Pfc SA, BioconColors, Naturex S.A., Roha Dyechem Pvt. Ltd., DyStar Singapore Pte Ltd., DDW The Color House, IFC Solutions, ColorMaker, Inc., Vinayak Ingredients (India) Pvt. Ltd., Colores Naturales de México S.A. de C.V., GNT Group B.V., Holland Ingredients B.V. Customization Scope Customization for segments, region/country-level will be provided. Moreover, additional customization can be done based on the requirements. Purchase Options We have three licenses to opt for: Single User License, Multi-User License (Up to 5 Users), Corporate Use License (Unlimited User and Printable PDF) -
- 1. Executive Summary
- 1.1. Definition
- 1.2. Taxonomy
- 1.3. Research Scope
- 1.4. Key Analysis
- 1.5. Key Findings by Major Segments
- 1.6. Top strategies by Major Players
- 2. Global Carmine Market Overview
- 2.1. Carmine Market Dynamics
- 2.1.1. Drivers
- 2.1.2. Opportunities
- 2.1.3. Restraints
- 2.1.4. Challenges
- 2.2. Macro-economic Factors
- 2.3. Regulatory Framework
- 2.4. Market Investment Feasibility Index
- 2.5. PEST Analysis
- 2.6. PORTER’S Five Force Analysis
- 2.7. Drivers & Restraints Impact Analysis
- 2.8. Industry Chain Analysis
- 2.9. Cost Structure Analysis
- 2.10. Marketing Strategy
- 2.11. Russia-Ukraine War Impact Analysis
- 2.12. Opportunity Map Analysis
- 2.13. Market Competition Scenario Analysis
- 2.14. Product Life Cycle Analysis
- 2.15. Opportunity Orbits
- 2.16. Manufacturer Intensity Map
- 2.17. Major Companies sales by Value & Volume
- 2.1. Carmine Market Dynamics
- 3. Global Carmine Market Analysis, Opportunity and Forecast, 2016-2032
- 3.1. Global Carmine Market Analysis, 2016-2021
- 3.2. Global Carmine Market Opportunity and Forecast, 2023-2032
- 3.3. Global Carmine Market Analysis, Opportunity and Forecast, By Form, 2016-2032
- 3.3.1. Global Carmine Market Analysis by Form: Introduction
- 3.3.2. Market Size Absolute $ Opportunity Analysis and Forecast, By Form, 2016-2032
- 3.3.3. Powder
- 3.3.4. Liquid
- 3.3.5. Crystal
- 3.3.6. Granules
- 3.4. Global Carmine Market Analysis, Opportunity and Forecast, By Application, 2016-2032
- 3.4.1. Global Carmine Market Analysis by Application: Introduction
- 3.4.2. Market Size Absolute $ Opportunity Analysis and Forecast, By Application, 2016-2032
- 3.4.3. Food and Beverages
- 3.4.4. Cosmetics and Personal Care
- 3.4.5. Pharmaceuticals
- 3.4.6. Others
- 3.5. Global Carmine Market Analysis, Opportunity and Forecast, By End-User, 2016-2032
- 3.5.1. Global Carmine Market Analysis by End-User: Introduction
- 3.5.2. Market Size Absolute $ Opportunity Analysis and Forecast, By End-User, 2016-2032
- 3.5.3. Cosmetics
- 3.5.4. Pharmaceuticals
- 3.5.5. Food and Beverages
- 3.5.6. Dairy and Frozen Products
- 3.5.7. Bakery and Confectionery
- 3.5.8. Beverages
- 3.5.9. Others
- 4. North America Carmine Market Analysis, Opportunity and Forecast, 2016-2032
- 4.1. North America Carmine Market Analysis, 2016-2021
- 4.2. North America Carmine Market Opportunity and Forecast, 2023-2032
- 4.3. North America Carmine Market Analysis, Opportunity and Forecast, By Form, 2016-2032
- 4.3.1. North America Carmine Market Analysis by Form: Introduction
- 4.3.2. Market Size Absolute $ Opportunity Analysis and Forecast, By Form, 2016-2032
- 4.3.3. Powder
- 4.3.4. Liquid
- 4.3.5. Crystal
- 4.3.6. Granules
- 4.4. North America Carmine Market Analysis, Opportunity and Forecast, By Application, 2016-2032
- 4.4.1. North America Carmine Market Analysis by Application: Introduction
- 4.4.2. Market Size Absolute $ Opportunity Analysis and Forecast, By Application, 2016-2032
- 4.4.3. Food and Beverages
- 4.4.4. Cosmetics and Personal Care
- 4.4.5. Pharmaceuticals
- 4.4.6. Others
- 4.5. North America Carmine Market Analysis, Opportunity and Forecast, By End-User, 2016-2032
- 4.5.1. North America Carmine Market Analysis by End-User: Introduction
- 4.5.2. Market Size Absolute $ Opportunity Analysis and Forecast, By End-User, 2016-2032
- 4.5.3. Cosmetics
- 4.5.4. Pharmaceuticals
- 4.5.5. Food and Beverages
- 4.5.6. Dairy and Frozen Products
- 4.5.7. Bakery and Confectionery
- 4.5.8. Beverages
- 4.5.9. Others
- 4.6. North America Carmine Market Analysis, Opportunity and Forecast, By Country , 2016-2032
- 4.6.1. North America Carmine Market Analysis by Country : Introduction
- 4.6.2. Market Size Absolute $ Opportunity Analysis and Forecast, Country , 2016-2032
- 4.6.2.1. The US
- 4.6.2.2. Canada
- 4.6.2.3. Mexico
- 5. Western Europe Carmine Market Analysis, Opportunity and Forecast, 2016-2032
- 5.1. Western Europe Carmine Market Analysis, 2016-2021
- 5.2. Western Europe Carmine Market Opportunity and Forecast, 2023-2032
- 5.3. Western Europe Carmine Market Analysis, Opportunity and Forecast, By Form, 2016-2032
- 5.3.1. Western Europe Carmine Market Analysis by Form: Introduction
- 5.3.2. Market Size Absolute $ Opportunity Analysis and Forecast, By Form, 2016-2032
- 5.3.3. Powder
- 5.3.4. Liquid
- 5.3.5. Crystal
- 5.3.6. Granules
- 5.4. Western Europe Carmine Market Analysis, Opportunity and Forecast, By Application, 2016-2032
- 5.4.1. Western Europe Carmine Market Analysis by Application: Introduction
- 5.4.2. Market Size Absolute $ Opportunity Analysis and Forecast, By Application, 2016-2032
- 5.4.3. Food and Beverages
- 5.4.4. Cosmetics and Personal Care
- 5.4.5. Pharmaceuticals
- 5.4.6. Others
- 5.5. Western Europe Carmine Market Analysis, Opportunity and Forecast, By End-User, 2016-2032
- 5.5.1. Western Europe Carmine Market Analysis by End-User: Introduction
- 5.5.2. Market Size Absolute $ Opportunity Analysis and Forecast, By End-User, 2016-2032
- 5.5.3. Cosmetics
- 5.5.4. Pharmaceuticals
- 5.5.5. Food and Beverages
- 5.5.6. Dairy and Frozen Products
- 5.5.7. Bakery and Confectionery
- 5.5.8. Beverages
- 5.5.9. Others
- 5.6. Western Europe Carmine Market Analysis, Opportunity and Forecast, By Country , 2016-2032
- 5.6.1. Western Europe Carmine Market Analysis by Country : Introduction
- 5.6.2. Market Size Absolute $ Opportunity Analysis and Forecast, Country , 2016-2032
- 5.6.2.1. Germany
- 5.6.2.2. France
- 5.6.2.3. The UK
- 5.6.2.4. Spain
- 5.6.2.5. Italy
- 5.6.2.6. Portugal
- 5.6.2.7. Ireland
- 5.6.2.8. Austria
- 5.6.2.9. Switzerland
- 5.6.2.10. Benelux
- 5.6.2.11. Nordic
- 5.6.2.12. Rest of Western Europe
- 6. Eastern Europe Carmine Market Analysis, Opportunity and Forecast, 2016-2032
- 6.1. Eastern Europe Carmine Market Analysis, 2016-2021
- 6.2. Eastern Europe Carmine Market Opportunity and Forecast, 2023-2032
- 6.3. Eastern Europe Carmine Market Analysis, Opportunity and Forecast, By Form, 2016-2032
- 6.3.1. Eastern Europe Carmine Market Analysis by Form: Introduction
- 6.3.2. Market Size Absolute $ Opportunity Analysis and Forecast, By Form, 2016-2032
- 6.3.3. Powder
- 6.3.4. Liquid
- 6.3.5. Crystal
- 6.3.6. Granules
- 6.4. Eastern Europe Carmine Market Analysis, Opportunity and Forecast, By Application, 2016-2032
- 6.4.1. Eastern Europe Carmine Market Analysis by Application: Introduction
- 6.4.2. Market Size Absolute $ Opportunity Analysis and Forecast, By Application, 2016-2032
- 6.4.3. Food and Beverages
- 6.4.4. Cosmetics and Personal Care
- 6.4.5. Pharmaceuticals
- 6.4.6. Others
- 6.5. Eastern Europe Carmine Market Analysis, Opportunity and Forecast, By End-User, 2016-2032
- 6.5.1. Eastern Europe Carmine Market Analysis by End-User: Introduction
- 6.5.2. Market Size Absolute $ Opportunity Analysis and Forecast, By End-User, 2016-2032
- 6.5.3. Cosmetics
- 6.5.4. Pharmaceuticals
- 6.5.5. Food and Beverages
- 6.5.6. Dairy and Frozen Products
- 6.5.7. Bakery and Confectionery
- 6.5.8. Beverages
- 6.5.9. Others
- 6.6. Eastern Europe Carmine Market Analysis, Opportunity and Forecast, By Country , 2016-2032
- 6.6.1. Eastern Europe Carmine Market Analysis by Country : Introduction
- 6.6.2. Market Size Absolute $ Opportunity Analysis and Forecast, Country , 2016-2032
- 6.6.2.1. Russia
- 6.6.2.2. Poland
- 6.6.2.3. The Czech Republic
- 6.6.2.4. Greece
- 6.6.2.5. Rest of Eastern Europe
- 7. APAC Carmine Market Analysis, Opportunity and Forecast, 2016-2032
- 7.1. APAC Carmine Market Analysis, 2016-2021
- 7.2. APAC Carmine Market Opportunity and Forecast, 2023-2032
- 7.3. APAC Carmine Market Analysis, Opportunity and Forecast, By Form, 2016-2032
- 7.3.1. APAC Carmine Market Analysis by Form: Introduction
- 7.3.2. Market Size Absolute $ Opportunity Analysis and Forecast, By Form, 2016-2032
- 7.3.3. Powder
- 7.3.4. Liquid
- 7.3.5. Crystal
- 7.3.6. Granules
- 7.4. APAC Carmine Market Analysis, Opportunity and Forecast, By Application, 2016-2032
- 7.4.1. APAC Carmine Market Analysis by Application: Introduction
- 7.4.2. Market Size Absolute $ Opportunity Analysis and Forecast, By Application, 2016-2032
- 7.4.3. Food and Beverages
- 7.4.4. Cosmetics and Personal Care
- 7.4.5. Pharmaceuticals
- 7.4.6. Others
- 7.5. APAC Carmine Market Analysis, Opportunity and Forecast, By End-User, 2016-2032
- 7.5.1. APAC Carmine Market Analysis by End-User: Introduction
- 7.5.2. Market Size Absolute $ Opportunity Analysis and Forecast, By End-User, 2016-2032
- 7.5.3. Cosmetics
- 7.5.4. Pharmaceuticals
- 7.5.5. Food and Beverages
- 7.5.6. Dairy and Frozen Products
- 7.5.7. Bakery and Confectionery
- 7.5.8. Beverages
- 7.5.9. Others
- 7.6. APAC Carmine Market Analysis, Opportunity and Forecast, By Country , 2016-2032
- 7.6.1. APAC Carmine Market Analysis by Country : Introduction
- 7.6.2. Market Size Absolute $ Opportunity Analysis and Forecast, Country , 2016-2032
- 7.6.2.1. China
- 7.6.2.2. Japan
- 7.6.2.3. South Korea
- 7.6.2.4. India
- 7.6.2.5. Australia & New Zeland
- 7.6.2.6. Indonesia
- 7.6.2.7. Malaysia
- 7.6.2.8. Philippines
- 7.6.2.9. Singapore
- 7.6.2.10. Thailand
- 7.6.2.11. Vietnam
- 7.6.2.12. Rest of APAC
- 8. Latin America Carmine Market Analysis, Opportunity and Forecast, 2016-2032
- 8.1. Latin America Carmine Market Analysis, 2016-2021
- 8.2. Latin America Carmine Market Opportunity and Forecast, 2023-2032
- 8.3. Latin America Carmine Market Analysis, Opportunity and Forecast, By Form, 2016-2032
- 8.3.1. Latin America Carmine Market Analysis by Form: Introduction
- 8.3.2. Market Size Absolute $ Opportunity Analysis and Forecast, By Form, 2016-2032
- 8.3.3. Powder
- 8.3.4. Liquid
- 8.3.5. Crystal
- 8.3.6. Granules
- 8.4. Latin America Carmine Market Analysis, Opportunity and Forecast, By Application, 2016-2032
- 8.4.1. Latin America Carmine Market Analysis by Application: Introduction
- 8.4.2. Market Size Absolute $ Opportunity Analysis and Forecast, By Application, 2016-2032
- 8.4.3. Food and Beverages
- 8.4.4. Cosmetics and Personal Care
- 8.4.5. Pharmaceuticals
- 8.4.6. Others
- 8.5. Latin America Carmine Market Analysis, Opportunity and Forecast, By End-User, 2016-2032
- 8.5.1. Latin America Carmine Market Analysis by End-User: Introduction
- 8.5.2. Market Size Absolute $ Opportunity Analysis and Forecast, By End-User, 2016-2032
- 8.5.3. Cosmetics
- 8.5.4. Pharmaceuticals
- 8.5.5. Food and Beverages
- 8.5.6. Dairy and Frozen Products
- 8.5.7. Bakery and Confectionery
- 8.5.8. Beverages
- 8.5.9. Others
- 8.6. Latin America Carmine Market Analysis, Opportunity and Forecast, By Country , 2016-2032
- 8.6.1. Latin America Carmine Market Analysis by Country : Introduction
- 8.6.2. Market Size Absolute $ Opportunity Analysis and Forecast, Country , 2016-2032
- 8.6.2.1. Brazil
- 8.6.2.2. Colombia
- 8.6.2.3. Chile
- 8.6.2.4. Argentina
- 8.6.2.5. Costa Rica
- 8.6.2.6. Rest of Latin America
- 9. Middle East & Africa Carmine Market Analysis, Opportunity and Forecast, 2016-2032
- 9.1. Middle East & Africa Carmine Market Analysis, 2016-2021
- 9.2. Middle East & Africa Carmine Market Opportunity and Forecast, 2023-2032
- 9.3. Middle East & Africa Carmine Market Analysis, Opportunity and Forecast, By Form, 2016-2032
- 9.3.1. Middle East & Africa Carmine Market Analysis by Form: Introduction
- 9.3.2. Market Size Absolute $ Opportunity Analysis and Forecast, By Form, 2016-2032
- 9.3.3. Powder
- 9.3.4. Liquid
- 9.3.5. Crystal
- 9.3.6. Granules
- 9.4. Middle East & Africa Carmine Market Analysis, Opportunity and Forecast, By Application, 2016-2032
- 9.4.1. Middle East & Africa Carmine Market Analysis by Application: Introduction
- 9.4.2. Market Size Absolute $ Opportunity Analysis and Forecast, By Application, 2016-2032
- 9.4.3. Food and Beverages
- 9.4.4. Cosmetics and Personal Care
- 9.4.5. Pharmaceuticals
- 9.4.6. Others
- 9.5. Middle East & Africa Carmine Market Analysis, Opportunity and Forecast, By End-User, 2016-2032
- 9.5.1. Middle East & Africa Carmine Market Analysis by End-User: Introduction
- 9.5.2. Market Size Absolute $ Opportunity Analysis and Forecast, By End-User, 2016-2032
- 9.5.3. Cosmetics
- 9.5.4. Pharmaceuticals
- 9.5.5. Food and Beverages
- 9.5.6. Dairy and Frozen Products
- 9.5.7. Bakery and Confectionery
- 9.5.8. Beverages
- 9.5.9. Others
- 9.6. Middle East & Africa Carmine Market Analysis, Opportunity and Forecast, By Country , 2016-2032
- 9.6.1. Middle East & Africa Carmine Market Analysis by Country : Introduction
- 9.6.2. Market Size Absolute $ Opportunity Analysis and Forecast, Country , 2016-2032
- 9.6.2.1. Algeria
- 9.6.2.2. Egypt
- 9.6.2.3. Israel
- 9.6.2.4. Kuwait
- 9.6.2.5. Nigeria
- 9.6.2.6. Saudi Arabia
- 9.6.2.7. South Africa
- 9.6.2.8. Turkey
- 9.6.2.9. The UAE
- 9.6.2.10. Rest of MEA
- 10. Global Carmine Market Analysis, Opportunity and Forecast, By Region , 2016-2032
- 10.1. Global Carmine Market Analysis by Region : Introduction
- 10.2. Market Size Absolute $ Opportunity Analysis and Forecast, By Region , 2016-2032
- 10.2.1. North America
- 10.2.2. Western Europe
- 10.2.3. Eastern Europe
- 10.2.4. APAC
- 10.2.5. Latin America
- 10.2.6. Middle East & Africa
- 11. Global Carmine Market Competitive Landscape, Market Share Analysis, and Company Profiles
- 11.1. Market Share Analysis
- 11.2. Company Profiles
- 11.3. Amerilure, Inc.
- 11.3.1. Company Overview
- 11.3.2. Financial Highlights
- 11.3.3. Product Portfolio
- 11.3.4. SWOT Analysis
- 11.3.5. Key Strategies and Developments
- 11.4. Chr. Hansen Holding A/S
- 11.4.1. Company Overview
- 11.4.2. Financial Highlights
- 11.4.3. Product Portfolio
- 11.4.4. SWOT Analysis
- 11.4.5. Key Strategies and Developments
- 11.5. Sensient Colors LLC
- 11.5.1. Company Overview
- 11.5.2. Financial Highlights
- 11.5.3. Product Portfolio
- 11.5.4. SWOT Analysis
- 11.5.5. Key Strategies and Developments
- 11.6. Proquimac Pfc SA
- 11.6.1. Company Overview
- 11.6.2. Financial Highlights
- 11.6.3. Product Portfolio
- 11.6.4. SWOT Analysis
- 11.6.5. Key Strategies and Developments
- 11.7. BioconColors
- 11.7.1. Company Overview
- 11.7.2. Financial Highlights
- 11.7.3. Product Portfolio
- 11.7.4. SWOT Analysis
- 11.7.5. Key Strategies and Developments
- 11.8. Naturex S.A.
- 11.8.1. Company Overview
- 11.8.2. Financial Highlights
- 11.8.3. Product Portfolio
- 11.8.4. SWOT Analysis
- 11.8.5. Key Strategies and Developments
- 11.9. Roha Dyechem Pvt. Ltd.
- 11.9.1. Company Overview
- 11.9.2. Financial Highlights
- 11.9.3. Product Portfolio
- 11.9.4. SWOT Analysis
- 11.9.5. Key Strategies and Developments
- 11.10. DyStar Singapore Pte Ltd.
- 11.10.1. Company Overview
- 11.10.2. Financial Highlights
- 11.10.3. Product Portfolio
- 11.10.4. SWOT Analysis
- 11.10.5. Key Strategies and Developments
- 11.11. DDW The Color House
- 11.11.1. Company Overview
- 11.11.2. Financial Highlights
- 11.11.3. Product Portfolio
- 11.11.4. SWOT Analysis
- 11.11.5. Key Strategies and Developments
- 11.12. IFC Solutions
- 11.12.1. Company Overview
- 11.12.2. Financial Highlights
- 11.12.3. Product Portfolio
- 11.12.4. SWOT Analysis
- 11.12.5. Key Strategies and Developments
- 11.13.1. Company Overview
- 11.13.2. Financial Highlights
- 11.13.3. Product Portfolio
- 11.13.4. SWOT Analysis
- 11.13.5. Key Strategies and Developments
- 11.14. ColorMaker, Inc.
- 11.14.1. Company Overview
- 11.14.2. Financial Highlights
- 11.14.3. Product Portfolio
- 11.14.4. SWOT Analysis
- 11.14.5. Key Strategies and Developments
- 11.15. Colores Naturales de México S.A. de C.V.
- 11.15.1. Company Overview
- 11.15.2. Financial Highlights
- 11.15.3. Product Portfolio
- 11.15.4. SWOT Analysis
- 11.15.5. Key Strategies and Developments
- 11.16. GNT Group B.V.
- 11.16.1. Company Overview
- 11.16.2. Financial Highlights
- 11.16.3. Product Portfolio
- 11.16.4. SWOT Analysis
- 11.16.5. Key Strategies and Developments
- 11.17. Holland Ingredients B.V.
- 11.17.1. Company Overview
- 11.17.2. Financial Highlights
- 11.17.3. Product Portfolio
- 11.17.4. SWOT Analysis
- 11.17.5. Key Strategies and Developments
- 12. Assumptions and Acronyms
- 13. Research Methodology
- 14. Contact
"
- List of Figures
- "
- Figure 1: Global Carmine Market Revenue (US$ Mn) Market Share by Form in 2022
- Figure 2: Global Carmine Market Attractiveness Analysis by Form, 2016-2032
- Figure 3: Global Carmine Market Revenue (US$ Mn) Market Share by Applicationin 2022
- Figure 4: Global Carmine Market Attractiveness Analysis by Application, 2016-2032
- Figure 5: Global Carmine Market Revenue (US$ Mn) Market Share by End-Userin 2022
- Figure 6: Global Carmine Market Attractiveness Analysis by End-User, 2016-2032
- Figure 7: Global Carmine Market Revenue (US$ Mn) Market Share by Region in 2022
- Figure 8: Global Carmine Market Attractiveness Analysis by Region, 2016-2032
- Figure 9: Global Carmine Market Revenue (US$ Mn) (2016-2032)
- Figure 10: Global Carmine Market Revenue (US$ Mn) Comparison by Region (2016-2032)
- Figure 11: Global Carmine Market Revenue (US$ Mn) Comparison by Form (2016-2032)
- Figure 12: Global Carmine Market Revenue (US$ Mn) Comparison by Application (2016-2032)
- Figure 13: Global Carmine Market Revenue (US$ Mn) Comparison by End-User (2016-2032)
- Figure 14: Global Carmine Market Y-o-Y Growth Rate Comparison by Region (2016-2032)
- Figure 15: Global Carmine Market Y-o-Y Growth Rate Comparison by Form (2016-2032)
- Figure 16: Global Carmine Market Y-o-Y Growth Rate Comparison by Application (2016-2032)
- Figure 17: Global Carmine Market Y-o-Y Growth Rate Comparison by End-User (2016-2032)
- Figure 18: Global Carmine Market Share Comparison by Region (2016-2032)
- Figure 19: Global Carmine Market Share Comparison by Form (2016-2032)
- Figure 20: Global Carmine Market Share Comparison by Application (2016-2032)
- Figure 21: Global Carmine Market Share Comparison by End-User (2016-2032)
- Figure 22: North America Carmine Market Revenue (US$ Mn) Market Share by Formin 2022
- Figure 23: North America Carmine Market Attractiveness Analysis by Form, 2016-2032
- Figure 24: North America Carmine Market Revenue (US$ Mn) Market Share by Applicationin 2022
- Figure 25: North America Carmine Market Attractiveness Analysis by Application, 2016-2032
- Figure 26: North America Carmine Market Revenue (US$ Mn) Market Share by End-Userin 2022
- Figure 27: North America Carmine Market Attractiveness Analysis by End-User, 2016-2032
- Figure 28: North America Carmine Market Revenue (US$ Mn) Market Share by Country in 2022
- Figure 29: North America Carmine Market Attractiveness Analysis by Country, 2016-2032
- Figure 30: North America Carmine Market Revenue (US$ Mn) (2016-2032)
- Figure 31: North America Carmine Market Revenue (US$ Mn) Comparison by Country (2016-2032)
- Figure 32: North America Carmine Market Revenue (US$ Mn) Comparison by Form (2016-2032)
- Figure 33: North America Carmine Market Revenue (US$ Mn) Comparison by Application (2016-2032)
- Figure 34: North America Carmine Market Revenue (US$ Mn) Comparison by End-User (2016-2032)
- Figure 35: North America Carmine Market Y-o-Y Growth Rate Comparison by Country (2016-2032)
- Figure 36: North America Carmine Market Y-o-Y Growth Rate Comparison by Form (2016-2032)
- Figure 37: North America Carmine Market Y-o-Y Growth Rate Comparison by Application (2016-2032)
- Figure 38: North America Carmine Market Y-o-Y Growth Rate Comparison by End-User (2016-2032)
- Figure 39: North America Carmine Market Share Comparison by Country (2016-2032)
- Figure 40: North America Carmine Market Share Comparison by Form (2016-2032)
- Figure 41: North America Carmine Market Share Comparison by Application (2016-2032)
- Figure 42: North America Carmine Market Share Comparison by End-User (2016-2032)
- Figure 43: Western Europe Carmine Market Revenue (US$ Mn) Market Share by Formin 2022
- Figure 44: Western Europe Carmine Market Attractiveness Analysis by Form, 2016-2032
- Figure 45: Western Europe Carmine Market Revenue (US$ Mn) Market Share by Applicationin 2022
- Figure 46: Western Europe Carmine Market Attractiveness Analysis by Application, 2016-2032
- Figure 47: Western Europe Carmine Market Revenue (US$ Mn) Market Share by End-Userin 2022
- Figure 48: Western Europe Carmine Market Attractiveness Analysis by End-User, 2016-2032
- Figure 49: Western Europe Carmine Market Revenue (US$ Mn) Market Share by Country in 2022
- Figure 50: Western Europe Carmine Market Attractiveness Analysis by Country, 2016-2032
- Figure 51: Western Europe Carmine Market Revenue (US$ Mn) (2016-2032)
- Figure 52: Western Europe Carmine Market Revenue (US$ Mn) Comparison by Country (2016-2032)
- Figure 53: Western Europe Carmine Market Revenue (US$ Mn) Comparison by Form (2016-2032)
- Figure 54: Western Europe Carmine Market Revenue (US$ Mn) Comparison by Application (2016-2032)
- Figure 55: Western Europe Carmine Market Revenue (US$ Mn) Comparison by End-User (2016-2032)
- Figure 56: Western Europe Carmine Market Y-o-Y Growth Rate Comparison by Country (2016-2032)
- Figure 57: Western Europe Carmine Market Y-o-Y Growth Rate Comparison by Form (2016-2032)
- Figure 58: Western Europe Carmine Market Y-o-Y Growth Rate Comparison by Application (2016-2032)
- Figure 59: Western Europe Carmine Market Y-o-Y Growth Rate Comparison by End-User (2016-2032)
- Figure 60: Western Europe Carmine Market Share Comparison by Country (2016-2032)
- Figure 61: Western Europe Carmine Market Share Comparison by Form (2016-2032)
- Figure 62: Western Europe Carmine Market Share Comparison by Application (2016-2032)
- Figure 63: Western Europe Carmine Market Share Comparison by End-User (2016-2032)
- Figure 64: Eastern Europe Carmine Market Revenue (US$ Mn) Market Share by Formin 2022
- Figure 65: Eastern Europe Carmine Market Attractiveness Analysis by Form, 2016-2032
- Figure 66: Eastern Europe Carmine Market Revenue (US$ Mn) Market Share by Applicationin 2022
- Figure 67: Eastern Europe Carmine Market Attractiveness Analysis by Application, 2016-2032
- Figure 68: Eastern Europe Carmine Market Revenue (US$ Mn) Market Share by End-Userin 2022
- Figure 69: Eastern Europe Carmine Market Attractiveness Analysis by End-User, 2016-2032
- Figure 70: Eastern Europe Carmine Market Revenue (US$ Mn) Market Share by Country in 2022
- Figure 71: Eastern Europe Carmine Market Attractiveness Analysis by Country, 2016-2032
- Figure 72: Eastern Europe Carmine Market Revenue (US$ Mn) (2016-2032)
- Figure 73: Eastern Europe Carmine Market Revenue (US$ Mn) Comparison by Country (2016-2032)
- Figure 74: Eastern Europe Carmine Market Revenue (US$ Mn) Comparison by Form (2016-2032)
- Figure 75: Eastern Europe Carmine Market Revenue (US$ Mn) Comparison by Application (2016-2032)
- Figure 76: Eastern Europe Carmine Market Revenue (US$ Mn) Comparison by End-User (2016-2032)
- Figure 77: Eastern Europe Carmine Market Y-o-Y Growth Rate Comparison by Country (2016-2032)
- Figure 78: Eastern Europe Carmine Market Y-o-Y Growth Rate Comparison by Form (2016-2032)
- Figure 79: Eastern Europe Carmine Market Y-o-Y Growth Rate Comparison by Application (2016-2032)
- Figure 80: Eastern Europe Carmine Market Y-o-Y Growth Rate Comparison by End-User (2016-2032)
- Figure 81: Eastern Europe Carmine Market Share Comparison by Country (2016-2032)
- Figure 82: Eastern Europe Carmine Market Share Comparison by Form (2016-2032)
- Figure 83: Eastern Europe Carmine Market Share Comparison by Application (2016-2032)
- Figure 84: Eastern Europe Carmine Market Share Comparison by End-User (2016-2032)
- Figure 85: APAC Carmine Market Revenue (US$ Mn) Market Share by Formin 2022
- Figure 86: APAC Carmine Market Attractiveness Analysis by Form, 2016-2032
- Figure 87: APAC Carmine Market Revenue (US$ Mn) Market Share by Applicationin 2022
- Figure 88: APAC Carmine Market Attractiveness Analysis by Application, 2016-2032
- Figure 89: APAC Carmine Market Revenue (US$ Mn) Market Share by End-Userin 2022
- Figure 90: APAC Carmine Market Attractiveness Analysis by End-User, 2016-2032
- Figure 91: APAC Carmine Market Revenue (US$ Mn) Market Share by Country in 2022
- Figure 92: APAC Carmine Market Attractiveness Analysis by Country, 2016-2032
- Figure 93: APAC Carmine Market Revenue (US$ Mn) (2016-2032)
- Figure 94: APAC Carmine Market Revenue (US$ Mn) Comparison by Country (2016-2032)
- Figure 95: APAC Carmine Market Revenue (US$ Mn) Comparison by Form (2016-2032)
- Figure 96: APAC Carmine Market Revenue (US$ Mn) Comparison by Application (2016-2032)
- Figure 97: APAC Carmine Market Revenue (US$ Mn) Comparison by End-User (2016-2032)
- Figure 98: APAC Carmine Market Y-o-Y Growth Rate Comparison by Country (2016-2032)
- Figure 99: APAC Carmine Market Y-o-Y Growth Rate Comparison by Form (2016-2032)
- Figure 100: APAC Carmine Market Y-o-Y Growth Rate Comparison by Application (2016-2032)
- Figure 101: APAC Carmine Market Y-o-Y Growth Rate Comparison by End-User (2016-2032)
- Figure 102: APAC Carmine Market Share Comparison by Country (2016-2032)
- Figure 103: APAC Carmine Market Share Comparison by Form (2016-2032)
- Figure 104: APAC Carmine Market Share Comparison by Application (2016-2032)
- Figure 105: APAC Carmine Market Share Comparison by End-User (2016-2032)
- Figure 106: Latin America Carmine Market Revenue (US$ Mn) Market Share by Formin 2022
- Figure 107: Latin America Carmine Market Attractiveness Analysis by Form, 2016-2032
- Figure 108: Latin America Carmine Market Revenue (US$ Mn) Market Share by Applicationin 2022
- Figure 109: Latin America Carmine Market Attractiveness Analysis by Application, 2016-2032
- Figure 110: Latin America Carmine Market Revenue (US$ Mn) Market Share by End-Userin 2022
- Figure 111: Latin America Carmine Market Attractiveness Analysis by End-User, 2016-2032
- Figure 112: Latin America Carmine Market Revenue (US$ Mn) Market Share by Country in 2022
- Figure 113: Latin America Carmine Market Attractiveness Analysis by Country, 2016-2032
- Figure 114: Latin America Carmine Market Revenue (US$ Mn) (2016-2032)
- Figure 115: Latin America Carmine Market Revenue (US$ Mn) Comparison by Country (2016-2032)
- Figure 116: Latin America Carmine Market Revenue (US$ Mn) Comparison by Form (2016-2032)
- Figure 117: Latin America Carmine Market Revenue (US$ Mn) Comparison by Application (2016-2032)
- Figure 118: Latin America Carmine Market Revenue (US$ Mn) Comparison by End-User (2016-2032)
- Figure 119: Latin America Carmine Market Y-o-Y Growth Rate Comparison by Country (2016-2032)
- Figure 120: Latin America Carmine Market Y-o-Y Growth Rate Comparison by Form (2016-2032)
- Figure 121: Latin America Carmine Market Y-o-Y Growth Rate Comparison by Application (2016-2032)
- Figure 122: Latin America Carmine Market Y-o-Y Growth Rate Comparison by End-User (2016-2032)
- Figure 123: Latin America Carmine Market Share Comparison by Country (2016-2032)
- Figure 124: Latin America Carmine Market Share Comparison by Form (2016-2032)
- Figure 125: Latin America Carmine Market Share Comparison by Application (2016-2032)
- Figure 126: Latin America Carmine Market Share Comparison by End-User (2016-2032)
- Figure 127: Middle East & Africa Carmine Market Revenue (US$ Mn) Market Share by Formin 2022
- Figure 128: Middle East & Africa Carmine Market Attractiveness Analysis by Form, 2016-2032
- Figure 129: Middle East & Africa Carmine Market Revenue (US$ Mn) Market Share by Applicationin 2022
- Figure 130: Middle East & Africa Carmine Market Attractiveness Analysis by Application, 2016-2032
- Figure 131: Middle East & Africa Carmine Market Revenue (US$ Mn) Market Share by End-Userin 2022
- Figure 132: Middle East & Africa Carmine Market Attractiveness Analysis by End-User, 2016-2032
- Figure 133: Middle East & Africa Carmine Market Revenue (US$ Mn) Market Share by Country in 2022
- Figure 134: Middle East & Africa Carmine Market Attractiveness Analysis by Country, 2016-2032
- Figure 135: Middle East & Africa Carmine Market Revenue (US$ Mn) (2016-2032)
- Figure 136: Middle East & Africa Carmine Market Revenue (US$ Mn) Comparison by Country (2016-2032)
- Figure 137: Middle East & Africa Carmine Market Revenue (US$ Mn) Comparison by Form (2016-2032)
- Figure 138: Middle East & Africa Carmine Market Revenue (US$ Mn) Comparison by Application (2016-2032)
- Figure 139: Middle East & Africa Carmine Market Revenue (US$ Mn) Comparison by End-User (2016-2032)
- Figure 140: Middle East & Africa Carmine Market Y-o-Y Growth Rate Comparison by Country (2016-2032)
- Figure 141: Middle East & Africa Carmine Market Y-o-Y Growth Rate Comparison by Form (2016-2032)
- Figure 142: Middle East & Africa Carmine Market Y-o-Y Growth Rate Comparison by Application (2016-2032)
- Figure 143: Middle East & Africa Carmine Market Y-o-Y Growth Rate Comparison by End-User (2016-2032)
- Figure 144: Middle East & Africa Carmine Market Share Comparison by Country (2016-2032)
- Figure 145: Middle East & Africa Carmine Market Share Comparison by Form (2016-2032)
- Figure 146: Middle East & Africa Carmine Market Share Comparison by Application (2016-2032)
- Figure 147: Middle East & Africa Carmine Market Share Comparison by End-User (2016-2032)
"
- List of Tables
- "
- Table 1: Global Carmine Market Comparison by Form (2016-2032)
- Table 2: Global Carmine Market Comparison by Application (2016-2032)
- Table 3: Global Carmine Market Comparison by End-User (2016-2032)
- Table 4: Global Carmine Market Revenue (US$ Mn) Comparison by Region (2016-2032)
- Table 5: Global Carmine Market Revenue (US$ Mn) (2016-2032)
- Table 6: Global Carmine Market Revenue (US$ Mn) Comparison by Region (2016-2032)
- Table 7: Global Carmine Market Revenue (US$ Mn) Comparison by Form (2016-2032)
- Table 8: Global Carmine Market Revenue (US$ Mn) Comparison by Application (2016-2032)
- Table 9: Global Carmine Market Revenue (US$ Mn) Comparison by End-User (2016-2032)
- Table 10: Global Carmine Market Y-o-Y Growth Rate Comparison by Region (2016-2032)
- Table 11: Global Carmine Market Y-o-Y Growth Rate Comparison by Form (2016-2032)
- Table 12: Global Carmine Market Y-o-Y Growth Rate Comparison by Application (2016-2032)
- Table 13: Global Carmine Market Y-o-Y Growth Rate Comparison by End-User (2016-2032)
- Table 14: Global Carmine Market Share Comparison by Region (2016-2032)
- Table 15: Global Carmine Market Share Comparison by Form (2016-2032)
- Table 16: Global Carmine Market Share Comparison by Application (2016-2032)
- Table 17: Global Carmine Market Share Comparison by End-User (2016-2032)
- Table 18: North America Carmine Market Comparison by Application (2016-2032)
- Table 19: North America Carmine Market Comparison by End-User (2016-2032)
- Table 20: North America Carmine Market Revenue (US$ Mn) Comparison by Country (2016-2032)
- Table 21: North America Carmine Market Revenue (US$ Mn) (2016-2032)
- Table 22: North America Carmine Market Revenue (US$ Mn) Comparison by Country (2016-2032)
- Table 23: North America Carmine Market Revenue (US$ Mn) Comparison by Form (2016-2032)
- Table 24: North America Carmine Market Revenue (US$ Mn) Comparison by Application (2016-2032)
- Table 25: North America Carmine Market Revenue (US$ Mn) Comparison by End-User (2016-2032)
- Table 26: North America Carmine Market Y-o-Y Growth Rate Comparison by Country (2016-2032)
- Table 27: North America Carmine Market Y-o-Y Growth Rate Comparison by Form (2016-2032)
- Table 28: North America Carmine Market Y-o-Y Growth Rate Comparison by Application (2016-2032)
- Table 29: North America Carmine Market Y-o-Y Growth Rate Comparison by End-User (2016-2032)
- Table 30: North America Carmine Market Share Comparison by Country (2016-2032)
- Table 31: North America Carmine Market Share Comparison by Form (2016-2032)
- Table 32: North America Carmine Market Share Comparison by Application (2016-2032)
- Table 33: North America Carmine Market Share Comparison by End-User (2016-2032)
- Table 34: Western Europe Carmine Market Comparison by Form (2016-2032)
- Table 35: Western Europe Carmine Market Comparison by Application (2016-2032)
- Table 36: Western Europe Carmine Market Comparison by End-User (2016-2032)
- Table 37: Western Europe Carmine Market Revenue (US$ Mn) Comparison by Country (2016-2032)
- Table 38: Western Europe Carmine Market Revenue (US$ Mn) (2016-2032)
- Table 39: Western Europe Carmine Market Revenue (US$ Mn) Comparison by Country (2016-2032)
- Table 40: Western Europe Carmine Market Revenue (US$ Mn) Comparison by Form (2016-2032)
- Table 41: Western Europe Carmine Market Revenue (US$ Mn) Comparison by Application (2016-2032)
- Table 42: Western Europe Carmine Market Revenue (US$ Mn) Comparison by End-User (2016-2032)
- Table 43: Western Europe Carmine Market Y-o-Y Growth Rate Comparison by Country (2016-2032)
- Table 44: Western Europe Carmine Market Y-o-Y Growth Rate Comparison by Form (2016-2032)
- Table 45: Western Europe Carmine Market Y-o-Y Growth Rate Comparison by Application (2016-2032)
- Table 46: Western Europe Carmine Market Y-o-Y Growth Rate Comparison by End-User (2016-2032)
- Table 47: Western Europe Carmine Market Share Comparison by Country (2016-2032)
- Table 48: Western Europe Carmine Market Share Comparison by Form (2016-2032)
- Table 49: Western Europe Carmine Market Share Comparison by Application (2016-2032)
- Table 50: Western Europe Carmine Market Share Comparison by End-User (2016-2032)
- Table 51: Eastern Europe Carmine Market Comparison by Form (2016-2032)
- Table 52: Eastern Europe Carmine Market Comparison by Application (2016-2032)
- Table 53: Eastern Europe Carmine Market Comparison by End-User (2016-2032)
- Table 54: Eastern Europe Carmine Market Revenue (US$ Mn) Comparison by Country (2016-2032)
- Table 55: Eastern Europe Carmine Market Revenue (US$ Mn) (2016-2032)
- Table 56: Eastern Europe Carmine Market Revenue (US$ Mn) Comparison by Country (2016-2032)
- Table 57: Eastern Europe Carmine Market Revenue (US$ Mn) Comparison by Form (2016-2032)
- Table 58: Eastern Europe Carmine Market Revenue (US$ Mn) Comparison by Application (2016-2032)
- Table 59: Eastern Europe Carmine Market Revenue (US$ Mn) Comparison by End-User (2016-2032)
- Table 60: Eastern Europe Carmine Market Y-o-Y Growth Rate Comparison by Country (2016-2032)
- Table 61: Eastern Europe Carmine Market Y-o-Y Growth Rate Comparison by Form (2016-2032)
- Table 62: Eastern Europe Carmine Market Y-o-Y Growth Rate Comparison by Application (2016-2032)
- Table 63: Eastern Europe Carmine Market Y-o-Y Growth Rate Comparison by End-User (2016-2032)
- Table 64: Eastern Europe Carmine Market Share Comparison by Country (2016-2032)
- Table 65: Eastern Europe Carmine Market Share Comparison by Form (2016-2032)
- Table 66: Eastern Europe Carmine Market Share Comparison by Application (2016-2032)
- Table 67: Eastern Europe Carmine Market Share Comparison by End-User (2016-2032)
- Table 68: APAC Carmine Market Comparison by Form (2016-2032)
- Table 69: APAC Carmine Market Comparison by Application (2016-2032)
- Table 70: APAC Carmine Market Comparison by End-User (2016-2032)
- Table 71: APAC Carmine Market Revenue (US$ Mn) Comparison by Country (2016-2032)
- Table 72: APAC Carmine Market Revenue (US$ Mn) (2016-2032)
- Table 73: APAC Carmine Market Revenue (US$ Mn) Comparison by Country (2016-2032)
- Table 74: APAC Carmine Market Revenue (US$ Mn) Comparison by Form (2016-2032)
- Table 75: APAC Carmine Market Revenue (US$ Mn) Comparison by Application (2016-2032)
- Table 76: APAC Carmine Market Revenue (US$ Mn) Comparison by End-User (2016-2032)
- Table 77: APAC Carmine Market Y-o-Y Growth Rate Comparison by Country (2016-2032)
- Table 78: APAC Carmine Market Y-o-Y Growth Rate Comparison by Form (2016-2032)
- Table 79: APAC Carmine Market Y-o-Y Growth Rate Comparison by Application (2016-2032)
- Table 80: APAC Carmine Market Y-o-Y Growth Rate Comparison by End-User (2016-2032)
- Table 81: APAC Carmine Market Share Comparison by Country (2016-2032)
- Table 82: APAC Carmine Market Share Comparison by Form (2016-2032)
- Table 83: APAC Carmine Market Share Comparison by Application (2016-2032)
- Table 84: APAC Carmine Market Share Comparison by End-User (2016-2032)
- Table 85: Latin America Carmine Market Comparison by Form (2016-2032)
- Table 86: Latin America Carmine Market Comparison by Application (2016-2032)
- Table 87: Latin America Carmine Market Comparison by End-User (2016-2032)
- Table 88: Latin America Carmine Market Revenue (US$ Mn) Comparison by Country (2016-2032)
- Table 89: Latin America Carmine Market Revenue (US$ Mn) (2016-2032)
- Table 90: Latin America Carmine Market Revenue (US$ Mn) Comparison by Country (2016-2032)
- Table 91: Latin America Carmine Market Revenue (US$ Mn) Comparison by Form (2016-2032)
- Table 92: Latin America Carmine Market Revenue (US$ Mn) Comparison by Application (2016-2032)
- Table 93: Latin America Carmine Market Revenue (US$ Mn) Comparison by End-User (2016-2032)
- Table 94: Latin America Carmine Market Y-o-Y Growth Rate Comparison by Country (2016-2032)
- Table 95: Latin America Carmine Market Y-o-Y Growth Rate Comparison by Form (2016-2032)
- Table 96: Latin America Carmine Market Y-o-Y Growth Rate Comparison by Application (2016-2032)
- Table 97: Latin America Carmine Market Y-o-Y Growth Rate Comparison by End-User (2016-2032)
- Table 98: Latin America Carmine Market Share Comparison by Country (2016-2032)
- Table 99: Latin America Carmine Market Share Comparison by Form (2016-2032)
- Table 100: Latin America Carmine Market Share Comparison by Application (2016-2032)
- Table 101: Latin America Carmine Market Share Comparison by End-User (2016-2032)
- Table 102: Middle East & Africa Carmine Market Comparison by Form (2016-2032)
- Table 103: Middle East & Africa Carmine Market Comparison by Application (2016-2032)
- Table 104: Middle East & Africa Carmine Market Comparison by End-User (2016-2032)
- Table 105: Middle East & Africa Carmine Market Revenue (US$ Mn) Comparison by Country (2016-2032)
- Table 106: Middle East & Africa Carmine Market Revenue (US$ Mn) (2016-2032)
- Table 107: Middle East & Africa Carmine Market Revenue (US$ Mn) Comparison by Country (2016-2032)
- Table 108: Middle East & Africa Carmine Market Revenue (US$ Mn) Comparison by Form (2016-2032)
- Table 109: Middle East & Africa Carmine Market Revenue (US$ Mn) Comparison by Application (2016-2032)
- Table 110: Middle East & Africa Carmine Market Revenue (US$ Mn) Comparison by End-User (2016-2032)
- Table 111: Middle East & Africa Carmine Market Y-o-Y Growth Rate Comparison by Country (2016-2032)
- Table 112: Middle East & Africa Carmine Market Y-o-Y Growth Rate Comparison by Form (2016-2032)
- Table 113: Middle East & Africa Carmine Market Y-o-Y Growth Rate Comparison by Application (2016-2032)
- Table 114: Middle East & Africa Carmine Market Y-o-Y Growth Rate Comparison by End-User (2016-2032)
- Table 115: Middle East & Africa Carmine Market Share Comparison by Country (2016-2032)
- Table 116: Middle East & Africa Carmine Market Share Comparison by Form (2016-2032)
- Table 117: Middle East & Africa Carmine Market Share Comparison by Application (2016-2032)
- Table 118: Middle East & Africa Carmine Market Share Comparison by End-User (2016-2032)
- 1. Executive Summary
-
- Amerilure, Inc.
- Chr. Hansen Holding A/S
- Sensient Colors LLC
- Proquimac Pfc SA
- BioconColors
- Naturex S.A.
- Roha Dyechem Pvt. Ltd.
- DyStar Singapore Pte Ltd.
- DDW The Color House
- IFC Solutions
- ColorMaker, Inc.
- Vinayak Ingredients (India) Pvt. Ltd.
- Colores Naturales de México S.A. de C.V.
- GNT Group B.V.
- Holland Ingredients B.V.
Our Clients


View Our Licence Options
