
Caramel Market Report By Product Types (Liquid Caramels, Soft Caramels, Hard Caramels, Chewy Caramels, Caramel Toppings/Sauces), By Flavors (Traditional Caramel, Salted Caramel, Chocolate Caramel, Fruit-Flavored Caramel, Coffee/Espresso Caramel), By Distribution Channels (Retail Stores, Online Retailers, Others), By End-Use Applications, By Region and Companies - Industry Segment Outlook, Market Assessment, Competition Scenario, Trends and Forecast 2024-2033
-
12162
-
March 2024
-
161
-


-
This report was compiled by Shreyas Rokade Shreyas Rokade is a seasoned Research Analyst with CMFE, bringing extensive expertise in market research and consulting, with a strong background in Chemical Engineering. Correspondence Team Lead-CMFE Linkedin | Detailed Market research Methodology Our methodology involves a mix of primary research, including interviews with leading mental health experts, and secondary research from reputable medical journals and databases. View Detailed Methodology Page
-
Quick Navigation
Report Overview
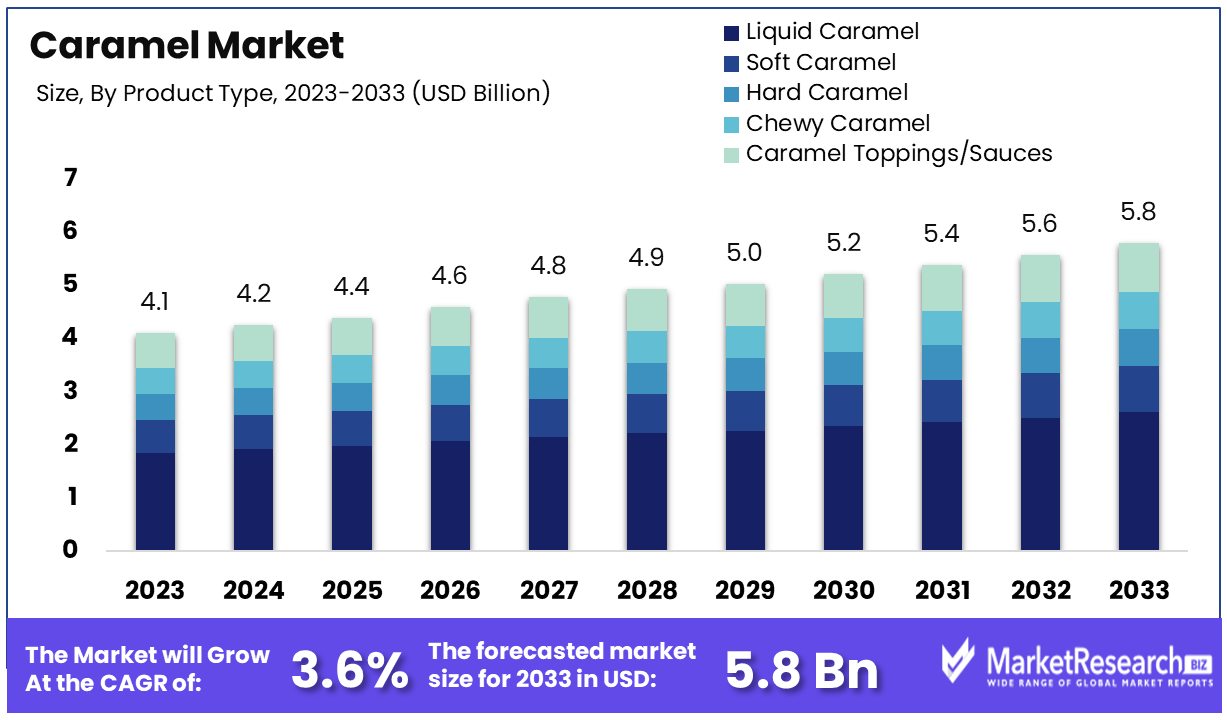
The Global Caramel Market size is expected to be worth around USD 5.8 Billion by 2033, from USD 4.1 Billion in 2023, growing at a CAGR of 3.60% during the forecast period from 2024 to 2033. The surge in demand for the confectionary food items and change in customer preference are some of the main key driving factors for the caramel market.
Caramel is defined as the versatile confectionary ingredient and flavouring agent which is well-known for its rich, sweet taste and golden brown colour. It is designed through the process of heating sugar which is either alone or with other ingredients such as butter or cream to a particular temperature.
As the sugar gets caramelizes, it undergoes a chemical change that result in the characteristic caramel flavour and color. It is made in different types of form that comprises of soft, caramel sauce, chewy candies and hard caramelized sugar for decoration. It is broadly used in deserts like chocolates, cakes, adding sweetness, hint of bitterness and candies.
Moreover, caramel is popular flavouring in beverages such as cocktails, liqueurs and coffee. It can be incorporated into savory dishes to put complexity and balance to sauces and marinades. With such unique taste and versatility, caramel remains a beloved ingredient in cooking creation globally.
According to an article published by foodbev media in March 2023, highlights that Mondelez International owned Cadbury Caramel has launched a new salted caramel flavour that range in the UK. Moreover, the tablet has classic Cadbury chocolate with a smooth caramel centre and widens on the achievement of its small blocks format which costs RRP £1.49.
These salted caramel nibbles highlight a Cadbury milk chocolate that coats around a soft caramel centre that values RRP £1.50 for a sharing bag. Additionally, the salted caramel fingers witness an extra of salted caramel to the old chocolate and biscuit confections that costs RRP £1.85.
Caramel has a great importance that acts as a mere sweetener to versatile culinary enhancers. The richness in caramel adds more complex flavour profiles to both sweet and savory dishes that augments the whole gastronomic experience.
Moreover, the chefs are using caramel in new ways such as in the sauces, beverages and savory dishes to get an ideal blend of the sweetness and depth. This dynamic ingredient has become a central part in the modern cuisine and rise above its conventional role that inspires the chefs to push the boundaries of trying different types of flavours. The demand for the caramel will increase due to its requirement in the confectionary food items and in the food & beverages industry that will help in market expansion in the coming years.
Key Takeaways
- Market Value Projection: The Global Caramel Market is anticipated to reach around USD 5.8 Billion by 2033, marking growth from USD 4.1 Billion in 2023, with a CAGR of 3.60% during the forecast period from 2024 to 2033.
- Major Segments:
- Product Types: Liquid Caramels lead as the dominant sub-segment due to their versatility, capturing a significant market share. Other segments like Soft Caramels, Hard Caramels, Chewy Caramels, and Caramel Toppings/Sauces contribute diversely to the market.
- Flavors: Traditional Caramel remains a cornerstone flavor, while emerging flavors like Salted Caramel, Chocolate Caramel, and Others introduce contemporary twists, catering to evolving consumer preferences.
- Distribution Channels: Online Retailers emerge as the dominant distribution channel, reflecting changing consumer behaviors driven by convenience and variety. Retail Stores, Specialty Stores, Supermarkets/Hypermarkets, and Convenience Stores complement online platforms, creating a comprehensive market ecosystem.
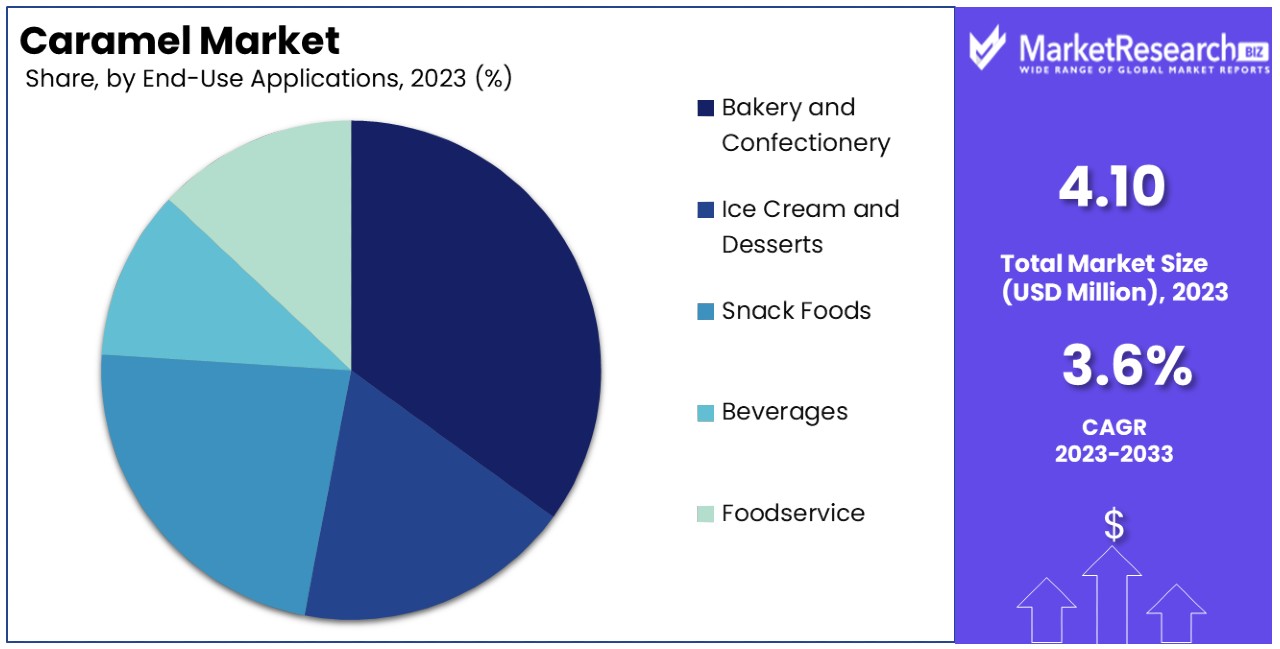
- End-Use Applications: Bakery and Confectionery lead as the dominant end-use application, driven by caramel's versatility and flavor enhancement capabilities. Ice Cream and Desserts, Snack Foods, Beverages, and Foodservice sectors contribute to market diversification.
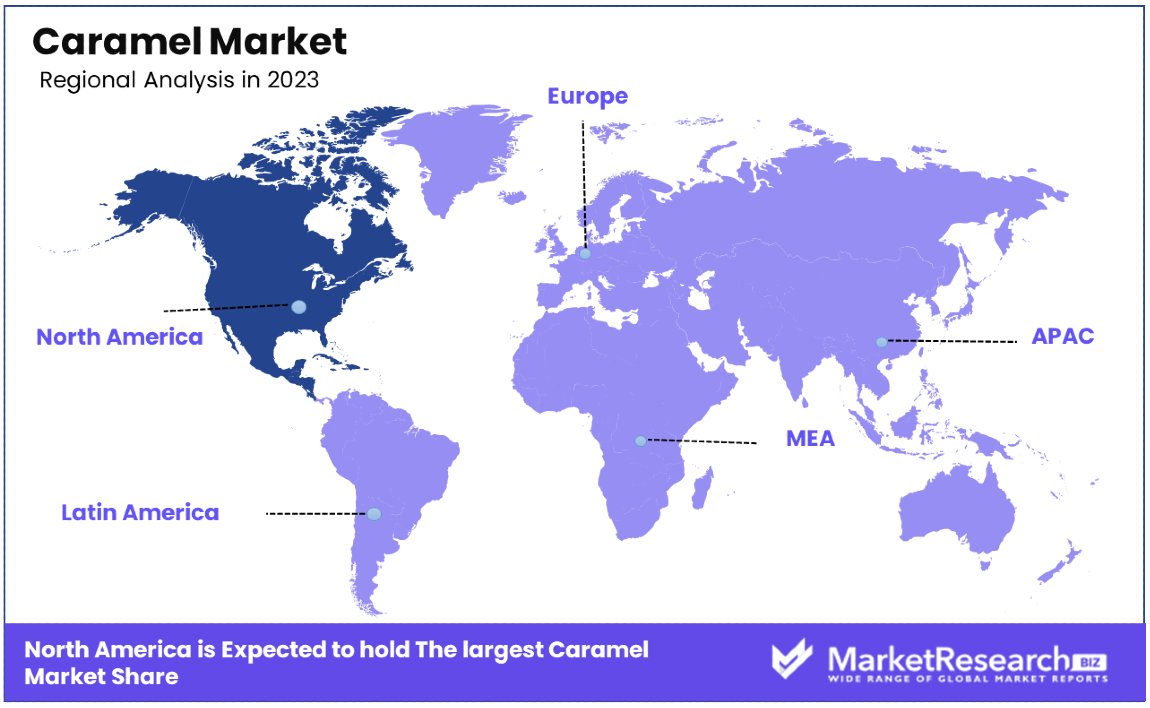
- Regional Dynamics: North America dominates the caramel market with a 30% market share, reflecting a strong tradition of confectionery and evolving consumer preferences. Europe holds approximately 25% of the market share.
- Analyst Viewpoint: Analysts foresee steady growth in the caramel market, driven by product innovation, evolving consumer tastes, and expanding distribution channels. The market's adaptability to emerging flavors and consumer preferences presents opportunities for continued growth and market expansion.
- Growth Opportunities: Opportunities lie in the development of new flavors, leveraging online retail channels, exploring applications in emerging markets, and enhancing product visibility through strategic partnerships and marketing initiatives. Innovation in flavor profiles and packaging formats, alongside sustainable practices, presents avenues for differentiation and growth in the caramel market.
Driving Factors
Growing Demand for Premium Confectionery Products Drives Market Growth
The caramel market is experiencing robust growth, fueled by a rising consumer preference for premium confectionery products. Caramel's unique taste and texture enhance the appeal of high-end chocolates, candies, and bakery items, meeting the demand for indulgent experiences.
Luxury brands like Godiva and Lindt have expanded their offerings with caramel-filled delights, tapping into this trend. The U.S. confectionery industry, employing nearly 58,000 people and supporting an additional 700,000 jobs, showcases the economic significance of this segment. This shift towards premiumization in confectionery underscores the caramel market's expansion, highlighting its essential role in crafting luxurious and flavorful products.
Rise of Artisanal and Specialty Food Trends Fuels Market Expansion
The burgeoning artisanal and specialty food movement is propelling the caramel market forward. Consumers' growing appetite for handcrafted, small-batch products with unique flavors has spotlighted artisanal caramel producers. Brands , known for their gourmet caramel sauces and candies, exemplify the market's shift towards quality and authenticity. This trend not only diversifies the market but also emphasizes the value of craftsmanship and high-quality ingredients in driving consumer interest and market growth.
Increasing Use in Beverages and Desserts Enriches Market Dynamics
Caramel's versatility is a significant driver of its increased usage in beverages and desserts, marking a 14.92% popularity surge in the past year. Its integration into a wide array of products, from Starbucks' Caramel Macchiato to Häagen-Dazs Caramel Cone ice cream, demonstrates its expansive role beyond traditional confectionery. This adaptability in various culinary applications underlines caramel's growing influence in the food and beverage sector, contributing to its widespread consumption and enhancing its market presence.
Growth of the Foodservice Industry Bolsters Caramel Demand
The expansion of the foodservice industry plays a pivotal role in the caramel market's growth. Caramel's application as a versatile ingredient in restaurants, cafés, and catering services—ranging from dessert toppings to glazes for meats—underscores its importance in adding value and flavor to dishes. The industry's creativity in incorporating caramel into menu items not only meets consumer demand for indulgent flavors but also stimulates further market development, showcasing caramel's enduring appeal in the culinary world.
Restraining Factors
Health Concerns and Sugar Consumption Restrain Market Growth
The increasing consumer awareness of health risks linked to high sugar intake significantly impacts the caramel market. Caramel, being rich in sugar, faces scrutiny from health-conscious consumers aiming to reduce obesity, diabetes, and other related health issues.
The World Health Organization's recommendation to limit free sugars adds to the challenge, influencing consumers to curtail their consumption of sugar-dense products like caramel confectioneries. This shift towards healthier eating habits and reduced sugar consumption presents a notable barrier to the market's growth, as consumers increasingly opt for lower-sugar alternatives.
Competition from Alternative Sweeteners and Flavors Limits Market Expansion
The emergence of alternative sweeteners and innovative flavors within the confectionery sector poses a substantial threat to the traditional caramel market. As consumer preferences evolve towards healthier and more diverse taste profiles, products incorporating natural sweeteners (e.g., stevia, monk fruit) or exotic flavors (e.g., matcha, yuzu) gain traction.
Brands capitalizing on this trend, such as Unreal and SmartSweets, offer lower-calorie options that appeal to health-conscious consumers, challenging the dominance of caramel-based treats. This competitive landscape, enriched by alternatives, constrains the caramel market's growth potential, diverting consumer interest towards novel and health-aligned options.
Product Types Analysis
Within the caramel market, Liquid Caramels stand out as the dominant sub-segment. This preference is likely due to their versatility and ease of use in various culinary applications, from baking and confectionery to beverages. Liquid caramels serve as an essential ingredient in both home cooking and professional food services, enabling a wide range of flavor profiles and textures in dishes.
Other sub-segments, including Soft Caramels, Hard Caramels, Chewy Caramels, and Caramel Toppings/Sauces, each contribute to the market's diversity. Soft and chewy caramels are favored for their texture and are often consumed as standalone treats or used in desserts. Hard caramels appeal to those who enjoy a longer-lasting caramel experience, often used as lozenges or in candy dishes. Caramel toppings and sauces, while similar to liquid caramels, are specifically designed for use as garnishes, adding a rich, sweet layer to desserts and drinks. Each of these sub-segments caters to different consumer preferences, contributing to the overall growth and dynamism of the caramel market.
Flavors Analysis
In the realm of flavors, Traditional Caramel is the cornerstone of the market, revered for its classic, rich taste that appeals to a broad audience. This enduring popularity underscores the timeless appeal of caramel's signature sweetness and depth of flavor, making it a staple in both traditional and innovative recipes.
Emerging flavors like Salted Caramel, Chocolate Caramel, and Fruit-Flavored Caramel, including apple and raspberry, introduce a contemporary twist to the traditional caramel profile. Salted caramel, in particular, has seen a surge in popularity, balancing sweetness with savory notes to create a complex, layered flavor experience. Chocolate caramel combines two beloved confectionery elements, catering to consumers seeking a decadent treat. Fruit-flavored caramels offer a refreshing contrast to the rich sweetness of traditional caramel, appealing to those looking for a unique and often lighter taste. Coffee/Espresso Caramel taps into the growing trend of coffee-flavored sweets, offering a sophisticated, adult-oriented flavor profile that complements the natural richness of caramel.
Distribution Channels
The distribution channel analysis for the caramel market reveals a significant evolution in consumer purchasing behaviors, primarily driven by technological advancements and changing lifestyle dynamics. Among these, Online Retailers emerge as the dominant sub-segment, a testament to the digital era's influence on shopping habits. This shift can be attributed to the convenience, variety, and competitive pricing offered by online platforms, attracting a broad spectrum of consumers.
The remaining sub-segments, including Retail Stores, Specialty Stores, Supermarkets/Hypermarkets, and Convenience Stores, though not leading, play crucial roles in the market's expansion. Supermarkets/Hypermarkets, for instance, offer extensive visibility and accessibility to caramel products, facilitating impulse purchases. Specialty Stores contribute by catering to niche markets with premium offerings, whereas Convenience Stores serve immediate consumption needs. Together, these channels complement the digital marketplace, creating a comprehensive ecosystem for the caramel market's growth.
End-Use Applications
In the domain of end-use applications, Bakery and Confectionery stands out as the dominant sub-segment, accounting for a significant 32% of the caramel market. This prominence is rooted in traditional and enduring consumer preferences for sweet treats, where caramel's versatility and flavor enhancement capabilities are unparalleled. Bakery and Confectionery's dominance is further bolstered by ongoing innovations in caramel products, such as salted caramel, which have rejuvenated interest and expanded its use in various recipes.
The other sub-segments, namely Ice Cream and Desserts, Snack Foods, Beverages, and Foodservice, contribute to the market's diversification and adaptability. Ice Cream and Desserts, for instance, benefit from caramel's appeal as a core or complementary flavor, driving consumer demand. Snack Foods and Beverages explore the ingredient's potential in creating new taste experiences, whereas the Foodservice sector leverages caramel to elevate the culinary appeal of dishes. Each of these sub-segments, by embracing caramel in unique applications, supports the market's overall growth trajectory, underlining the ingredient's versatility and enduring popularity.
Key Market Segments
By Product Types
- Liquid Caramel
- Soft Caramel
- Hard Caramel
- Chewy Caramel
- Caramel Toppings/Sauces
By Flavors
- Traditional Caramel
- Salted Caramel
- Chocolate Caramel
- Fruit-Flavored Caramel
- Coffee/Espresso Caramel
By Distribution Channels
- Retail Stores
- Online Retailers
- Specialty Stores
- Supermarkets/Hypermarkets
- Convenience Stores
By End-Use Applications
- Bakery and Confectionery
- Ice Cream and Desserts
- Snack Foods
- Beverages
- Foodservice
Growth Opportunities
Product Premiumization and Indulgence Offers Growth Opportunity
The trend towards product premiumization and indulgence in the caramel market signifies a substantial growth avenue. Consumers' growing appetite for luxury and unique sensory experiences has paved the way for brands to innovate with artisanal, high-end caramel products.
By leveraging superior ingredients, inventive flavors, and premium packaging, companies are well-positioned to meet the rising demand for gourmet experiences. This consumer willingness to invest in premium, indulgent caramel items, distinguished by their quality and uniqueness, is a pivotal factor driving market growth. Brands like Fat Toad Farm and Liddabit Sweets exemplify success in this segment, with their focus on small-batch, handcrafted caramel products that resonate with consumers seeking distinctiveness and superior taste.
Expansion into Emerging Markets Offers Growth Opportunity
Emerging markets represent a fertile ground for the caramel market's expansion, fueled by economic advancements and increased consumer spending power. Regions such as Asia-Pacific and Latin America are witnessing a surge in demand for confectionery and indulgent treats, driven by a growing middle class with disposable income to spare.
The key to unlocking this potential lies in understanding and adapting to the diverse taste preferences and cultural inclinations of these markets. Companies like Hershey's and Nestlé have already made strides in this direction, introducing caramel-infused products tailored to local tastes, such as caramel-flavored chocolates in India and caramel KitKat in Asia. This strategic focus on localization, coupled with an appreciation of regional tastes, positions caramel manufacturers to capitalize on the expanding opportunities within these dynamic markets.
Trending Factors
Clean Label and Natural Ingredients Are Trending Factors
The move towards clean label and natural ingredients marks a significant trend within the caramel market. This shift is driven by consumers' increasing preference for products composed of simple, recognizable, and minimally processed ingredients, such as cane sugar, cream, and butter, avoiding artificial additives or preservatives.
The demand highlights a growing concern among consumers about artificial ingredients in their food and a desire for transparency regarding product contents. Brands have successfully tapped into this trend, offering organic and non-GMO caramel products that promise purity and simplicity. This consumer-driven movement not only underscores a shift towards healthier eating habits but also opens avenues for growth among manufacturers committed to clean, natural ingredient lists.
Plant-Based and Vegan Caramel Are Trending Factors
The expansion of the plant-based and vegan diet trend into the caramel market illustrates the sector's adaptability to evolving consumer preferences. As more individuals adopt these dietary lifestyles, the demand for caramel products that cater to plant-based and vegan preferences grows. Manufacturers are responding by exploring and incorporating plant-based alternatives to traditional dairy ingredients, such as using coconut milk and cashew butter.
This innovation addresses the needs of consumers with dietary restrictions or those who choose plant-based products for ethical or health reasons. Brands with their vegan caramel sauces made from ingredients like coconut milk and maple syrup, are at the forefront of this trend. This pivot to plant-based and vegan options is not just a response to consumer demand but a proactive step towards inclusivity and sustainability in the caramel market.
Regional Analysis
North America Dominates with 30% Market Share
North America holds a pivotal position in the global caramel market, commanding a 30% share. This dominance is attributed to several key factors including high consumer disposable income, a strong presence of leading confectionery and food & beverage manufacturers, and a growing preference for premium and indulgent products.
The region's market dynamics are influenced by innovative product launches, with a focus on clean label and natural ingredients, responding to the health-conscious trends among North American consumers. Additionally, the rise in plant-based and vegan options has catered to the diverse dietary preferences prevalent in this market.
Looking forward, North America's influence on the global caramel market is expected to continue. The region's ongoing drive for innovation, coupled with its substantial consumer base willing to pay for premium products, sets the stage for sustained growth. The trend towards healthier, more natural products is likely to shape future market offerings, with North America leading these changes.
For other regions, the market share and growth rate vary, reflecting diverse consumer preferences and economic conditions:
- Europe: Holding a significant market share of approximately 25%, Europe's caramel market is driven by a rich tradition of confectionery and a strong focus on quality and artisanal products. The region is also seeing a rise in demand for clean label ingredients.
- Asia Pacific: This region is rapidly growing, currently accounting for 20% of the market, fueled by economic development, increasing disposable incomes, and a growing interest in Western-style confections.
- Middle East & Africa: With around 10% market share, this region presents a growing interest in caramel products, driven by expanding retail sectors and urbanization.
- Latin America: Also holding a 10% share, Latin America's market is influenced by local sweet traditions and a growing middle class with increasing purchasing power.
Key Regions and Countries
- North America
- The US
- Canada
- Mexico
- Western Europe
- Germany
- France
- The UK
- Spain
- Italy
- Portugal
- Ireland
- Austria
- Switzerland
- Benelux
- Nordic
- Rest of Western Europe
- Eastern Europe
- Russia
- Poland
- The Czech Republic
- Greece
- Rest of Eastern Europe
- APAC
- China
- Japan
- South Korea
- India
- Australia & New Zealand
- Indonesia
- Malaysia
- Philippines
- Singapore
- Thailand
- Vietnam
- Rest of APAC
- Latin America
- Brazil
- Colombia
- Chile
- Argentina
- Costa Rica
- Rest of Latin America
- Middle East & Africa
- Algeria
- Egypt
- Israel
- Kuwait
- Nigeria
- Saudi Arabia
- South Africa
- Turkey
- United Arab Emirates
- Rest of MEA
Key Players Analysis
In the landscape of the Caramel Market, key players such as Goetze's Candy Company Inc, Dallas Caramel Company, Mondelez International, Cadbury Caramel, Godiva, Lindt, Fat Toad Farm, Liddabit Sweets, Tierra Farm, Hershey's, Nestlé, and Greenville Caramel Company significantly shape market trends and consumer preferences.
Their strategic positioning underscores the robust demand for caramel and confectionery products, with a notable impact on the consumption and sales of these items. These companies have been pivotal in catering to the evolving demand for caramel flavors products and caramel-based products, driving product innovations and development. Their efforts have contributed to a broad product category range and enhanced product availability, enriching the variety of confectionery products available to consumers.
These private companies have also played a crucial role in expanding the sales of beverages and introducing variety in beverages, aligning with the demand forecast for both caramel products and related confectionery items. Through their commitment to diversifying Bakery Products Confectionery Products, these key players have reinforced the market's growth potential.
Their contributions are not just limited to increasing the assortment within the traditional confectionery space but also extend to innovating caramel flavors and formats, thereby meeting consumer demands for novelty and variety in the Caramel Market. This collective approach by the Caramel Market- Key Company List has fortified the market's resilience and adaptability, ensuring sustained interest and engagement from a diverse consumer base.
Market Key Players
- Goetze's Candy Company Inc
- Cargill, Inc.
- Dallas Caramel Company
- Mondelez International
- Cadbury Caramel
- Godiva
- Lindt
- Fat Toad Farm
- Liddabit Sweets
- Tierra Farm
- Hershey's
- Nestlé
- Greenville Caramel Company
Recent Developments
- On November 2023, Sanders Candy, an iconic caramel and chocolate confection company with a heritage dating back to 1875, declared the first-ever National Sea Salt Caramel Day.
- On November 2023, the Reese's brand unveiled the Reese's Caramel Big Cup, introducing a layer of caramel to its classic peanut butter cup in a Big Cup format for the first time ever.
- On November 2023, the Hershey Company's Reese's brand introduced the new Caramel Big Cup, a delightful fusion of Reese's classic peanut cup with a layer of caramel, marking a significant flavor innovation for the renowned confectionery maker.
- On September 2023, Marble Slab Creamery introduced a delectable new flavor to its menu - the Caramel Churro Crunch Ice Cream and Shake.
Report Scope
Report Features Description Market Value (2023) USD 4.1 Billion Forecast Revenue (2033) USD 5.8 Billion CAGR (2024-2033) 3.60% Base Year for Estimation 2023 Historic Period 2018-2023 Forecast Period 2024-2033 Report Coverage Revenue Forecast, Market Dynamics, Competitive Landscape, Recent Developments Segments Covered By Product Types (Liquid Caramels, Soft Caramels, Hard Caramels, Chewy Caramels, Caramel Toppings/Sauces), By Flavors (Traditional Caramel, Salted Caramel, Chocolate Caramel, Fruit-Flavored Caramel, Coffee/Espresso Caramel), By Distribution Channels (Retail Stores, Online Retailers, Specialty Stores, Supermarkets/Hypermarkets, Convenience Stores), By End-Use Applications (Bakery and Confectionery, Ice Cream and Desserts, Snack Foods, Beverages, Foodservice) Regional Analysis North America - The US, Canada, & Mexico; Western Europe - Germany, France, The UK, Spain, Italy, Portugal, Ireland, Austria, Switzerland, Benelux, Nordic, & Rest of Western Europe; Eastern Europe - Russia, Poland, The Czech Republic, Greece, & Rest of Eastern Europe; APAC - China, Japan, South Korea, India, Australia & New Zealand, Indonesia, Malaysia, Philippines, Singapore, Thailand, Vietnam, & Rest of APAC; Latin America - Brazil, Colombia, Chile, Argentina, Costa Rica, & Rest of Latin America; Middle East & Africa - Algeria, Egypt, Israel, Kuwait, Nigeria, Saudi Arabia, South Africa, Turkey, United Arab Emirates, & Rest of MEA Competitive Landscape Goetze's Candy Company Inc, Dallas Caramel Company, Mondelez International, Cadbury Caramel, Godiva, Lindt, Fat Toad Farm, Liddabit Sweets, Tierra Farm, Hershey's, Nestlé, Greenville Caramel Company Customization Scope Customization for segments, region/country-level will be provided. Moreover, additional customization can be done based on the requirements. Purchase Options We have three licenses to opt for: Single User License, Multi-User License (Up to 5 Users), Corporate Use License (Unlimited User and Printable PDF) -
- 1. Executive Summary
- 1.1. Definition
- 1.2. Taxonomy
- 1.3. Research Scope
- 1.4. Key Analysis
- 1.5. Key Findings by Major Segments
- 1.6. Top strategies by Major Players
- 2. Global Caramel Market Overview
- 2.1. Caramel Market Dynamics
- 2.1.1. Drivers
- 2.1.2. Opportunities
- 2.1.3. Restraints
- 2.1.4. Challenges
- 2.2. Macro-economic Factors
- 2.3. Regulatory Framework
- 2.4. Market Investment Feasibility Index
- 2.5. PEST Analysis
- 2.6. PORTER’S Five Force Analysis
- 2.7. Drivers & Restraints Impact Analysis
- 2.8. Industry Chain Analysis
- 2.9. Cost Structure Analysis
- 2.10. Marketing Strategy
- 2.11. Russia-Ukraine War Impact Analysis
- 2.12. Opportunity Map Analysis
- 2.13. Market Competition Scenario Analysis
- 2.14. Product Life Cycle Analysis
- 2.15. Opportunity Orbits
- 2.16. Manufacturer Intensity Map
- 2.17. Major Companies sales by Value & Volume
- 2.1. Caramel Market Dynamics
- 3. Global Caramel Market Analysis, Opportunity and Forecast, 2016-2032
- 3.1. Global Caramel Market Analysis, 2016-2021
- 3.2. Global Caramel Market Opportunity and Forecast, 2023-2032
- 3.3. Global Caramel Market Analysis, Opportunity and Forecast, By Function Analysis, 2016-2032
- 3.3.1. Global Caramel Market Analysis by Function Analysis: Introduction
- 3.3.2. Market Size Absolute $ Opportunity Analysis and Forecast, By Function Analysis, 2016-2032
- 3.3.3. Colors
- 3.3.4. Toppings
- 3.3.5. Fillings
- 3.3.6. Flavors
- 3.3.7. Others
- 3.4. Global Caramel Market Analysis, Opportunity and Forecast, By Insights Analysis, 2016-2032
- 3.4.1. Global Caramel Market Analysis by Insights Analysis: Introduction
- 3.4.2. Market Size Absolute $ Opportunity Analysis and Forecast, By Insights Analysis, 2016-2032
- 3.4.3. Solid & Semi-Solid
- 3.4.4. Liquid
- 3.5. Global Caramel Market Analysis, Opportunity and Forecast, By Application Analysis, 2016-2032
- 3.5.1. Global Caramel Market Analysis by Application Analysis: Introduction
- 3.5.2. Market Size Absolute $ Opportunity Analysis and Forecast, By Application Analysis, 2016-2032
- 3.5.3. Bakery
- 3.5.4. Beverages
- 3.5.5. Dairy & Frozen Desserts
- 3.5.6. Snacks
- 3.5.7. Others
- 3.6. Global Caramel Market Analysis, Opportunity and Forecast, By , 2016-2032
- 3.6.1. Global Caramel Market Analysis by : Introduction
- 3.6.2. Market Size Absolute $ Opportunity Analysis and Forecast, By , 2016-2032
- 4. North America Caramel Market Analysis, Opportunity and Forecast, 2016-2032
- 4.1. North America Caramel Market Analysis, 2016-2021
- 4.2. North America Caramel Market Opportunity and Forecast, 2023-2032
- 4.3. North America Caramel Market Analysis, Opportunity and Forecast, By Function Analysis, 2016-2032
- 4.3.1. North America Caramel Market Analysis by Function Analysis: Introduction
- 4.3.2. Market Size Absolute $ Opportunity Analysis and Forecast, By Function Analysis, 2016-2032
- 4.3.3. Colors
- 4.3.4. Toppings
- 4.3.5. Fillings
- 4.3.6. Flavors
- 4.3.7. Others
- 4.4. North America Caramel Market Analysis, Opportunity and Forecast, By Insights Analysis, 2016-2032
- 4.4.1. North America Caramel Market Analysis by Insights Analysis: Introduction
- 4.4.2. Market Size Absolute $ Opportunity Analysis and Forecast, By Insights Analysis, 2016-2032
- 4.4.3. Solid & Semi-Solid
- 4.4.4. Liquid
- 4.5. North America Caramel Market Analysis, Opportunity and Forecast, By Application Analysis, 2016-2032
- 4.5.1. North America Caramel Market Analysis by Application Analysis: Introduction
- 4.5.2. Market Size Absolute $ Opportunity Analysis and Forecast, By Application Analysis, 2016-2032
- 4.5.3. Bakery
- 4.5.4. Beverages
- 4.5.5. Dairy & Frozen Desserts
- 4.5.6. Snacks
- 4.5.7. Others
- 4.6. North America Caramel Market Analysis, Opportunity and Forecast, By , 2016-2032
- 4.6.1. North America Caramel Market Analysis by : Introduction
- 4.6.2. Market Size Absolute $ Opportunity Analysis and Forecast, By , 2016-2032
- 4.7. North America Caramel Market Analysis, Opportunity and Forecast, By Country , 2016-2032
- 4.7.1. North America Caramel Market Analysis by Country : Introduction
- 4.7.2. Market Size Absolute $ Opportunity Analysis and Forecast, Country , 2016-2032
- 4.7.2.1. The US
- 4.7.2.2. Canada
- 4.7.2.3. Mexico
- 5. Western Europe Caramel Market Analysis, Opportunity and Forecast, 2016-2032
- 5.1. Western Europe Caramel Market Analysis, 2016-2021
- 5.2. Western Europe Caramel Market Opportunity and Forecast, 2023-2032
- 5.3. Western Europe Caramel Market Analysis, Opportunity and Forecast, By Function Analysis, 2016-2032
- 5.3.1. Western Europe Caramel Market Analysis by Function Analysis: Introduction
- 5.3.2. Market Size Absolute $ Opportunity Analysis and Forecast, By Function Analysis, 2016-2032
- 5.3.3. Colors
- 5.3.4. Toppings
- 5.3.5. Fillings
- 5.3.6. Flavors
- 5.3.7. Others
- 5.4. Western Europe Caramel Market Analysis, Opportunity and Forecast, By Insights Analysis, 2016-2032
- 5.4.1. Western Europe Caramel Market Analysis by Insights Analysis: Introduction
- 5.4.2. Market Size Absolute $ Opportunity Analysis and Forecast, By Insights Analysis, 2016-2032
- 5.4.3. Solid & Semi-Solid
- 5.4.4. Liquid
- 5.5. Western Europe Caramel Market Analysis, Opportunity and Forecast, By Application Analysis, 2016-2032
- 5.5.1. Western Europe Caramel Market Analysis by Application Analysis: Introduction
- 5.5.2. Market Size Absolute $ Opportunity Analysis and Forecast, By Application Analysis, 2016-2032
- 5.5.3. Bakery
- 5.5.4. Beverages
- 5.5.5. Dairy & Frozen Desserts
- 5.5.6. Snacks
- 5.5.7. Others
- 5.6. Western Europe Caramel Market Analysis, Opportunity and Forecast, By , 2016-2032
- 5.6.1. Western Europe Caramel Market Analysis by : Introduction
- 5.6.2. Market Size Absolute $ Opportunity Analysis and Forecast, By , 2016-2032
- 5.7. Western Europe Caramel Market Analysis, Opportunity and Forecast, By Country , 2016-2032
- 5.7.1. Western Europe Caramel Market Analysis by Country : Introduction
- 5.7.2. Market Size Absolute $ Opportunity Analysis and Forecast, Country , 2016-2032
- 5.7.2.1. Germany
- 5.7.2.2. France
- 5.7.2.3. The UK
- 5.7.2.4. Spain
- 5.7.2.5. Italy
- 5.7.2.6. Portugal
- 5.7.2.7. Ireland
- 5.7.2.8. Austria
- 5.7.2.9. Switzerland
- 5.7.2.10. Benelux
- 5.7.2.11. Nordic
- 5.7.2.12. Rest of Western Europe
- 6. Eastern Europe Caramel Market Analysis, Opportunity and Forecast, 2016-2032
- 6.1. Eastern Europe Caramel Market Analysis, 2016-2021
- 6.2. Eastern Europe Caramel Market Opportunity and Forecast, 2023-2032
- 6.3. Eastern Europe Caramel Market Analysis, Opportunity and Forecast, By Function Analysis, 2016-2032
- 6.3.1. Eastern Europe Caramel Market Analysis by Function Analysis: Introduction
- 6.3.2. Market Size Absolute $ Opportunity Analysis and Forecast, By Function Analysis, 2016-2032
- 6.3.3. Colors
- 6.3.4. Toppings
- 6.3.5. Fillings
- 6.3.6. Flavors
- 6.3.7. Others
- 6.4. Eastern Europe Caramel Market Analysis, Opportunity and Forecast, By Insights Analysis, 2016-2032
- 6.4.1. Eastern Europe Caramel Market Analysis by Insights Analysis: Introduction
- 6.4.2. Market Size Absolute $ Opportunity Analysis and Forecast, By Insights Analysis, 2016-2032
- 6.4.3. Solid & Semi-Solid
- 6.4.4. Liquid
- 6.5. Eastern Europe Caramel Market Analysis, Opportunity and Forecast, By Application Analysis, 2016-2032
- 6.5.1. Eastern Europe Caramel Market Analysis by Application Analysis: Introduction
- 6.5.2. Market Size Absolute $ Opportunity Analysis and Forecast, By Application Analysis, 2016-2032
- 6.5.3. Bakery
- 6.5.4. Beverages
- 6.5.5. Dairy & Frozen Desserts
- 6.5.6. Snacks
- 6.5.7. Others
- 6.6. Eastern Europe Caramel Market Analysis, Opportunity and Forecast, By , 2016-2032
- 6.6.1. Eastern Europe Caramel Market Analysis by : Introduction
- 6.6.2. Market Size Absolute $ Opportunity Analysis and Forecast, By , 2016-2032
- 6.7. Eastern Europe Caramel Market Analysis, Opportunity and Forecast, By Country , 2016-2032
- 6.7.1. Eastern Europe Caramel Market Analysis by Country : Introduction
- 6.7.2. Market Size Absolute $ Opportunity Analysis and Forecast, Country , 2016-2032
- 6.7.2.1. Russia
- 6.7.2.2. Poland
- 6.7.2.3. The Czech Republic
- 6.7.2.4. Greece
- 6.7.2.5. Rest of Eastern Europe
- 7. APAC Caramel Market Analysis, Opportunity and Forecast, 2016-2032
- 7.1. APAC Caramel Market Analysis, 2016-2021
- 7.2. APAC Caramel Market Opportunity and Forecast, 2023-2032
- 7.3. APAC Caramel Market Analysis, Opportunity and Forecast, By Function Analysis, 2016-2032
- 7.3.1. APAC Caramel Market Analysis by Function Analysis: Introduction
- 7.3.2. Market Size Absolute $ Opportunity Analysis and Forecast, By Function Analysis, 2016-2032
- 7.3.3. Colors
- 7.3.4. Toppings
- 7.3.5. Fillings
- 7.3.6. Flavors
- 7.3.7. Others
- 7.4. APAC Caramel Market Analysis, Opportunity and Forecast, By Insights Analysis, 2016-2032
- 7.4.1. APAC Caramel Market Analysis by Insights Analysis: Introduction
- 7.4.2. Market Size Absolute $ Opportunity Analysis and Forecast, By Insights Analysis, 2016-2032
- 7.4.3. Solid & Semi-Solid
- 7.4.4. Liquid
- 7.5. APAC Caramel Market Analysis, Opportunity and Forecast, By Application Analysis, 2016-2032
- 7.5.1. APAC Caramel Market Analysis by Application Analysis: Introduction
- 7.5.2. Market Size Absolute $ Opportunity Analysis and Forecast, By Application Analysis, 2016-2032
- 7.5.3. Bakery
- 7.5.4. Beverages
- 7.5.5. Dairy & Frozen Desserts
- 7.5.6. Snacks
- 7.5.7. Others
- 7.6. APAC Caramel Market Analysis, Opportunity and Forecast, By , 2016-2032
- 7.6.1. APAC Caramel Market Analysis by : Introduction
- 7.6.2. Market Size Absolute $ Opportunity Analysis and Forecast, By , 2016-2032
- 7.7. APAC Caramel Market Analysis, Opportunity and Forecast, By Country , 2016-2032
- 7.7.1. APAC Caramel Market Analysis by Country : Introduction
- 7.7.2. Market Size Absolute $ Opportunity Analysis and Forecast, Country , 2016-2032
- 7.7.2.1. China
- 7.7.2.2. Japan
- 7.7.2.3. South Korea
- 7.7.2.4. India
- 7.7.2.5. Australia & New Zeland
- 7.7.2.6. Indonesia
- 7.7.2.7. Malaysia
- 7.7.2.8. Philippines
- 7.7.2.9. Singapore
- 7.7.2.10. Thailand
- 7.7.2.11. Vietnam
- 7.7.2.12. Rest of APAC
- 8. Latin America Caramel Market Analysis, Opportunity and Forecast, 2016-2032
- 8.1. Latin America Caramel Market Analysis, 2016-2021
- 8.2. Latin America Caramel Market Opportunity and Forecast, 2023-2032
- 8.3. Latin America Caramel Market Analysis, Opportunity and Forecast, By Function Analysis, 2016-2032
- 8.3.1. Latin America Caramel Market Analysis by Function Analysis: Introduction
- 8.3.2. Market Size Absolute $ Opportunity Analysis and Forecast, By Function Analysis, 2016-2032
- 8.3.3. Colors
- 8.3.4. Toppings
- 8.3.5. Fillings
- 8.3.6. Flavors
- 8.3.7. Others
- 8.4. Latin America Caramel Market Analysis, Opportunity and Forecast, By Insights Analysis, 2016-2032
- 8.4.1. Latin America Caramel Market Analysis by Insights Analysis: Introduction
- 8.4.2. Market Size Absolute $ Opportunity Analysis and Forecast, By Insights Analysis, 2016-2032
- 8.4.3. Solid & Semi-Solid
- 8.4.4. Liquid
- 8.5. Latin America Caramel Market Analysis, Opportunity and Forecast, By Application Analysis, 2016-2032
- 8.5.1. Latin America Caramel Market Analysis by Application Analysis: Introduction
- 8.5.2. Market Size Absolute $ Opportunity Analysis and Forecast, By Application Analysis, 2016-2032
- 8.5.3. Bakery
- 8.5.4. Beverages
- 8.5.5. Dairy & Frozen Desserts
- 8.5.6. Snacks
- 8.5.7. Others
- 8.6. Latin America Caramel Market Analysis, Opportunity and Forecast, By , 2016-2032
- 8.6.1. Latin America Caramel Market Analysis by : Introduction
- 8.6.2. Market Size Absolute $ Opportunity Analysis and Forecast, By , 2016-2032
- 8.7. Latin America Caramel Market Analysis, Opportunity and Forecast, By Country , 2016-2032
- 8.7.1. Latin America Caramel Market Analysis by Country : Introduction
- 8.7.2. Market Size Absolute $ Opportunity Analysis and Forecast, Country , 2016-2032
- 8.7.2.1. Brazil
- 8.7.2.2. Colombia
- 8.7.2.3. Chile
- 8.7.2.4. Argentina
- 8.7.2.5. Costa Rica
- 8.7.2.6. Rest of Latin America
- 9. Middle East & Africa Caramel Market Analysis, Opportunity and Forecast, 2016-2032
- 9.1. Middle East & Africa Caramel Market Analysis, 2016-2021
- 9.2. Middle East & Africa Caramel Market Opportunity and Forecast, 2023-2032
- 9.3. Middle East & Africa Caramel Market Analysis, Opportunity and Forecast, By Function Analysis, 2016-2032
- 9.3.1. Middle East & Africa Caramel Market Analysis by Function Analysis: Introduction
- 9.3.2. Market Size Absolute $ Opportunity Analysis and Forecast, By Function Analysis, 2016-2032
- 9.3.3. Colors
- 9.3.4. Toppings
- 9.3.5. Fillings
- 9.3.6. Flavors
- 9.3.7. Others
- 9.4. Middle East & Africa Caramel Market Analysis, Opportunity and Forecast, By Insights Analysis, 2016-2032
- 9.4.1. Middle East & Africa Caramel Market Analysis by Insights Analysis: Introduction
- 9.4.2. Market Size Absolute $ Opportunity Analysis and Forecast, By Insights Analysis, 2016-2032
- 9.4.3. Solid & Semi-Solid
- 9.4.4. Liquid
- 9.5. Middle East & Africa Caramel Market Analysis, Opportunity and Forecast, By Application Analysis, 2016-2032
- 9.5.1. Middle East & Africa Caramel Market Analysis by Application Analysis: Introduction
- 9.5.2. Market Size Absolute $ Opportunity Analysis and Forecast, By Application Analysis, 2016-2032
- 9.5.3. Bakery
- 9.5.4. Beverages
- 9.5.5. Dairy & Frozen Desserts
- 9.5.6. Snacks
- 9.5.7. Others
- 9.6. Middle East & Africa Caramel Market Analysis, Opportunity and Forecast, By , 2016-2032
- 9.6.1. Middle East & Africa Caramel Market Analysis by : Introduction
- 9.6.2. Market Size Absolute $ Opportunity Analysis and Forecast, By , 2016-2032
- 9.7. Middle East & Africa Caramel Market Analysis, Opportunity and Forecast, By Country , 2016-2032
- 9.7.1. Middle East & Africa Caramel Market Analysis by Country : Introduction
- 9.7.2. Market Size Absolute $ Opportunity Analysis and Forecast, Country , 2016-2032
- 9.7.2.1. Algeria
- 9.7.2.2. Egypt
- 9.7.2.3. Israel
- 9.7.2.4. Kuwait
- 9.7.2.5. Nigeria
- 9.7.2.6. Saudi Arabia
- 9.7.2.7. South Africa
- 9.7.2.8. Turkey
- 9.7.2.9. The UAE
- 9.7.2.10. Rest of MEA
- 10. Global Caramel Market Analysis, Opportunity and Forecast, By Region , 2016-2032
- 10.1. Global Caramel Market Analysis by Region : Introduction
- 10.2. Market Size Absolute $ Opportunity Analysis and Forecast, By Region , 2016-2032
- 10.2.1. North America
- 10.2.2. Western Europe
- 10.2.3. Eastern Europe
- 10.2.4. APAC
- 10.2.5. Latin America
- 10.2.6. Middle East & Africa
- 11. Global Caramel Market Competitive Landscape, Market Share Analysis, and Company Profiles
- 11.1. Market Share Analysis
- 11.2. Company Profiles
- 11.3. Cargill, Inc.
- 11.3.1. Company Overview
- 11.3.2. Financial Highlights
- 11.3.3. Product Portfolio
- 11.3.4. SWOT Analysis
- 11.3.5. Key Strategies and Developments
- 11.4. Kerry Group PLC
- 11.4.1. Company Overview
- 11.4.2. Financial Highlights
- 11.4.3. Product Portfolio
- 11.4.4. SWOT Analysis
- 11.4.5. Key Strategies and Developments
- 11.5. Bakels Worldwide
- 11.5.1. Company Overview
- 11.5.2. Financial Highlights
- 11.5.3. Product Portfolio
- 11.5.4. SWOT Analysis
- 11.5.5. Key Strategies and Developments
- 11.6. Barry Callebaut AG
- 11.6.1. Company Overview
- 11.6.2. Financial Highlights
- 11.6.3. Product Portfolio
- 11.6.4. SWOT Analysis
- 11.6.5. Key Strategies and Developments
- 11.7. Nigay SAS
- 11.7.1. Company Overview
- 11.7.2. Financial Highlights
- 11.7.3. Product Portfolio
- 11.7.4. SWOT Analysis
- 11.7.5. Key Strategies and Developments
- 11.8. Sethness Products Company
- 11.8.1. Company Overview
- 11.8.2. Financial Highlights
- 11.8.3. Product Portfolio
- 11.8.4. SWOT Analysis
- 11.8.5. Key Strategies and Developments
- 11.9. Metarom Group
- 11.9.1. Company Overview
- 11.9.2. Financial Highlights
- 11.9.3. Product Portfolio
- 11.9.4. SWOT Analysis
- 11.9.5. Key Strategies and Developments
- 11.10. Puratos NV/SA
- 11.10.1. Company Overview
- 11.10.2. Financial Highlights
- 11.10.3. Product Portfolio
- 11.10.4. SWOT Analysis
- 11.10.5. Key Strategies and Developments
- 11.11. Göteborgsfood Budapest Ltd.
- 11.11.1. Company Overview
- 11.11.2. Financial Highlights
- 11.11.3. Product Portfolio
- 11.11.4. SWOT Analysis
- 11.11.5. Key Strategies and Developments
- 11.12. Martin Braun Backmittel and Essences KG
- 11.12.1. Company Overview
- 11.12.2. Financial Highlights
- 11.12.3. Product Portfolio
- 11.12.4. SWOT Analysis
- 11.12.5. Key Strategies and Developments
- 12. Assumptions and Acronyms
- 13. Research Methodology
- 14. Contact
- List of Figures
- Figure 1: Global Caramel Market Revenue (US$ Mn) Market Share by Function Analysis in 2022
- Figure 2: Global Caramel Market Attractiveness Analysis by Function Analysis, 2016-2032
- Figure 3: Global Caramel Market Revenue (US$ Mn) Market Share by Insights Analysisin 2022
- Figure 4: Global Caramel Market Attractiveness Analysis by Insights Analysis, 2016-2032
- Figure 5: Global Caramel Market Revenue (US$ Mn) Market Share by Application Analysisin 2022
- Figure 6: Global Caramel Market Attractiveness Analysis by Application Analysis, 2016-2032
- Figure 7: Global Caramel Market Revenue (US$ Mn) Market Share by in 2022
- Figure 8: Global Caramel Market Attractiveness Analysis by , 2016-2032
- Figure 9: Global Caramel Market Revenue (US$ Mn) Market Share by Region in 2022
- Figure 10: Global Caramel Market Attractiveness Analysis by Region, 2016-2032
- Figure 11: Global Caramel Market Revenue (US$ Mn) (2016-2032)
- Figure 12: Global Caramel Market Revenue (US$ Mn) Comparison by Region (2016-2032)
- Figure 13: Global Caramel Market Revenue (US$ Mn) Comparison by Function Analysis (2016-2032)
- Figure 14: Global Caramel Market Revenue (US$ Mn) Comparison by Insights Analysis (2016-2032)
- Figure 15: Global Caramel Market Revenue (US$ Mn) Comparison by Application Analysis (2016-2032)
- Figure 16: Global Caramel Market Revenue (US$ Mn) Comparison by (2016-2032)
- Figure 17: Global Caramel Market Y-o-Y Growth Rate Comparison by Region (2016-2032)
- Figure 18: Global Caramel Market Y-o-Y Growth Rate Comparison by Function Analysis (2016-2032)
- Figure 19: Global Caramel Market Y-o-Y Growth Rate Comparison by Insights Analysis (2016-2032)
- Figure 20: Global Caramel Market Y-o-Y Growth Rate Comparison by Application Analysis (2016-2032)
- Figure 21: Global Caramel Market Y-o-Y Growth Rate Comparison by (2016-2032)
- Figure 22: Global Caramel Market Share Comparison by Region (2016-2032)
- Figure 23: Global Caramel Market Share Comparison by Function Analysis (2016-2032)
- Figure 24: Global Caramel Market Share Comparison by Insights Analysis (2016-2032)
- Figure 25: Global Caramel Market Share Comparison by Application Analysis (2016-2032)
- Figure 26: Global Caramel Market Share Comparison by (2016-2032)
- Figure 27: North America Caramel Market Revenue (US$ Mn) Market Share by Function Analysisin 2022
- Figure 28: North America Caramel Market Attractiveness Analysis by Function Analysis, 2016-2032
- Figure 29: North America Caramel Market Revenue (US$ Mn) Market Share by Insights Analysisin 2022
- Figure 30: North America Caramel Market Attractiveness Analysis by Insights Analysis, 2016-2032
- Figure 31: North America Caramel Market Revenue (US$ Mn) Market Share by Application Analysisin 2022
- Figure 32: North America Caramel Market Attractiveness Analysis by Application Analysis, 2016-2032
- Figure 33: North America Caramel Market Revenue (US$ Mn) Market Share by in 2022
- Figure 34: North America Caramel Market Attractiveness Analysis by , 2016-2032
- Figure 35: North America Caramel Market Revenue (US$ Mn) Market Share by Country in 2022
- Figure 36: North America Caramel Market Attractiveness Analysis by Country, 2016-2032
- Figure 37: North America Caramel Market Revenue (US$ Mn) (2016-2032)
- Figure 38: North America Caramel Market Revenue (US$ Mn) Comparison by Country (2016-2032)
- Figure 39: North America Caramel Market Revenue (US$ Mn) Comparison by Function Analysis (2016-2032)
- Figure 40: North America Caramel Market Revenue (US$ Mn) Comparison by Insights Analysis (2016-2032)
- Figure 41: North America Caramel Market Revenue (US$ Mn) Comparison by Application Analysis (2016-2032)
- Figure 42: North America Caramel Market Revenue (US$ Mn) Comparison by (2016-2032)
- Figure 43: North America Caramel Market Y-o-Y Growth Rate Comparison by Country (2016-2032)
- Figure 44: North America Caramel Market Y-o-Y Growth Rate Comparison by Function Analysis (2016-2032)
- Figure 45: North America Caramel Market Y-o-Y Growth Rate Comparison by Insights Analysis (2016-2032)
- Figure 46: North America Caramel Market Y-o-Y Growth Rate Comparison by Application Analysis (2016-2032)
- Figure 47: North America Caramel Market Y-o-Y Growth Rate Comparison by (2016-2032)
- Figure 48: North America Caramel Market Share Comparison by Country (2016-2032)
- Figure 49: North America Caramel Market Share Comparison by Function Analysis (2016-2032)
- Figure 50: North America Caramel Market Share Comparison by Insights Analysis (2016-2032)
- Figure 51: North America Caramel Market Share Comparison by Application Analysis (2016-2032)
- Figure 52: North America Caramel Market Share Comparison by (2016-2032)
- Figure 53: Western Europe Caramel Market Revenue (US$ Mn) Market Share by Function Analysisin 2022
- Figure 54: Western Europe Caramel Market Attractiveness Analysis by Function Analysis, 2016-2032
- Figure 55: Western Europe Caramel Market Revenue (US$ Mn) Market Share by Insights Analysisin 2022
- Figure 56: Western Europe Caramel Market Attractiveness Analysis by Insights Analysis, 2016-2032
- Figure 57: Western Europe Caramel Market Revenue (US$ Mn) Market Share by Application Analysisin 2022
- Figure 58: Western Europe Caramel Market Attractiveness Analysis by Application Analysis, 2016-2032
- Figure 59: Western Europe Caramel Market Revenue (US$ Mn) Market Share by in 2022
- Figure 60: Western Europe Caramel Market Attractiveness Analysis by , 2016-2032
- Figure 61: Western Europe Caramel Market Revenue (US$ Mn) Market Share by Country in 2022
- Figure 62: Western Europe Caramel Market Attractiveness Analysis by Country, 2016-2032
- Figure 63: Western Europe Caramel Market Revenue (US$ Mn) (2016-2032)
- Figure 64: Western Europe Caramel Market Revenue (US$ Mn) Comparison by Country (2016-2032)
- Figure 65: Western Europe Caramel Market Revenue (US$ Mn) Comparison by Function Analysis (2016-2032)
- Figure 66: Western Europe Caramel Market Revenue (US$ Mn) Comparison by Insights Analysis (2016-2032)
- Figure 67: Western Europe Caramel Market Revenue (US$ Mn) Comparison by Application Analysis (2016-2032)
- Figure 68: Western Europe Caramel Market Revenue (US$ Mn) Comparison by (2016-2032)
- Figure 69: Western Europe Caramel Market Y-o-Y Growth Rate Comparison by Country (2016-2032)
- Figure 70: Western Europe Caramel Market Y-o-Y Growth Rate Comparison by Function Analysis (2016-2032)
- Figure 71: Western Europe Caramel Market Y-o-Y Growth Rate Comparison by Insights Analysis (2016-2032)
- Figure 72: Western Europe Caramel Market Y-o-Y Growth Rate Comparison by Application Analysis (2016-2032)
- Figure 73: Western Europe Caramel Market Y-o-Y Growth Rate Comparison by (2016-2032)
- Figure 74: Western Europe Caramel Market Share Comparison by Country (2016-2032)
- Figure 75: Western Europe Caramel Market Share Comparison by Function Analysis (2016-2032)
- Figure 76: Western Europe Caramel Market Share Comparison by Insights Analysis (2016-2032)
- Figure 77: Western Europe Caramel Market Share Comparison by Application Analysis (2016-2032)
- Figure 78: Western Europe Caramel Market Share Comparison by (2016-2032)
- Figure 79: Eastern Europe Caramel Market Revenue (US$ Mn) Market Share by Function Analysisin 2022
- Figure 80: Eastern Europe Caramel Market Attractiveness Analysis by Function Analysis, 2016-2032
- Figure 81: Eastern Europe Caramel Market Revenue (US$ Mn) Market Share by Insights Analysisin 2022
- Figure 82: Eastern Europe Caramel Market Attractiveness Analysis by Insights Analysis, 2016-2032
- Figure 83: Eastern Europe Caramel Market Revenue (US$ Mn) Market Share by Application Analysisin 2022
- Figure 84: Eastern Europe Caramel Market Attractiveness Analysis by Application Analysis, 2016-2032
- Figure 85: Eastern Europe Caramel Market Revenue (US$ Mn) Market Share by in 2022
- Figure 86: Eastern Europe Caramel Market Attractiveness Analysis by , 2016-2032
- Figure 87: Eastern Europe Caramel Market Revenue (US$ Mn) Market Share by Country in 2022
- Figure 88: Eastern Europe Caramel Market Attractiveness Analysis by Country, 2016-2032
- Figure 89: Eastern Europe Caramel Market Revenue (US$ Mn) (2016-2032)
- Figure 90: Eastern Europe Caramel Market Revenue (US$ Mn) Comparison by Country (2016-2032)
- Figure 91: Eastern Europe Caramel Market Revenue (US$ Mn) Comparison by Function Analysis (2016-2032)
- Figure 92: Eastern Europe Caramel Market Revenue (US$ Mn) Comparison by Insights Analysis (2016-2032)
- Figure 93: Eastern Europe Caramel Market Revenue (US$ Mn) Comparison by Application Analysis (2016-2032)
- Figure 94: Eastern Europe Caramel Market Revenue (US$ Mn) Comparison by (2016-2032)
- Figure 95: Eastern Europe Caramel Market Y-o-Y Growth Rate Comparison by Country (2016-2032)
- Figure 96: Eastern Europe Caramel Market Y-o-Y Growth Rate Comparison by Function Analysis (2016-2032)
- Figure 97: Eastern Europe Caramel Market Y-o-Y Growth Rate Comparison by Insights Analysis (2016-2032)
- Figure 98: Eastern Europe Caramel Market Y-o-Y Growth Rate Comparison by Application Analysis (2016-2032)
- Figure 99: Eastern Europe Caramel Market Y-o-Y Growth Rate Comparison by (2016-2032)
- Figure 100: Eastern Europe Caramel Market Share Comparison by Country (2016-2032)
- Figure 101: Eastern Europe Caramel Market Share Comparison by Function Analysis (2016-2032)
- Figure 102: Eastern Europe Caramel Market Share Comparison by Insights Analysis (2016-2032)
- Figure 103: Eastern Europe Caramel Market Share Comparison by Application Analysis (2016-2032)
- Figure 104: Eastern Europe Caramel Market Share Comparison by (2016-2032)
- Figure 105: APAC Caramel Market Revenue (US$ Mn) Market Share by Function Analysisin 2022
- Figure 106: APAC Caramel Market Attractiveness Analysis by Function Analysis, 2016-2032
- Figure 107: APAC Caramel Market Revenue (US$ Mn) Market Share by Insights Analysisin 2022
- Figure 108: APAC Caramel Market Attractiveness Analysis by Insights Analysis, 2016-2032
- Figure 109: APAC Caramel Market Revenue (US$ Mn) Market Share by Application Analysisin 2022
- Figure 110: APAC Caramel Market Attractiveness Analysis by Application Analysis, 2016-2032
- Figure 111: APAC Caramel Market Revenue (US$ Mn) Market Share by in 2022
- Figure 112: APAC Caramel Market Attractiveness Analysis by , 2016-2032
- Figure 113: APAC Caramel Market Revenue (US$ Mn) Market Share by Country in 2022
- Figure 114: APAC Caramel Market Attractiveness Analysis by Country, 2016-2032
- Figure 115: APAC Caramel Market Revenue (US$ Mn) (2016-2032)
- Figure 116: APAC Caramel Market Revenue (US$ Mn) Comparison by Country (2016-2032)
- Figure 117: APAC Caramel Market Revenue (US$ Mn) Comparison by Function Analysis (2016-2032)
- Figure 118: APAC Caramel Market Revenue (US$ Mn) Comparison by Insights Analysis (2016-2032)
- Figure 119: APAC Caramel Market Revenue (US$ Mn) Comparison by Application Analysis (2016-2032)
- Figure 120: APAC Caramel Market Revenue (US$ Mn) Comparison by (2016-2032)
- Figure 121: APAC Caramel Market Y-o-Y Growth Rate Comparison by Country (2016-2032)
- Figure 122: APAC Caramel Market Y-o-Y Growth Rate Comparison by Function Analysis (2016-2032)
- Figure 123: APAC Caramel Market Y-o-Y Growth Rate Comparison by Insights Analysis (2016-2032)
- Figure 124: APAC Caramel Market Y-o-Y Growth Rate Comparison by Application Analysis (2016-2032)
- Figure 125: APAC Caramel Market Y-o-Y Growth Rate Comparison by (2016-2032)
- Figure 126: APAC Caramel Market Share Comparison by Country (2016-2032)
- Figure 127: APAC Caramel Market Share Comparison by Function Analysis (2016-2032)
- Figure 128: APAC Caramel Market Share Comparison by Insights Analysis (2016-2032)
- Figure 129: APAC Caramel Market Share Comparison by Application Analysis (2016-2032)
- Figure 130: APAC Caramel Market Share Comparison by (2016-2032)
- Figure 131: Latin America Caramel Market Revenue (US$ Mn) Market Share by Function Analysisin 2022
- Figure 132: Latin America Caramel Market Attractiveness Analysis by Function Analysis, 2016-2032
- Figure 133: Latin America Caramel Market Revenue (US$ Mn) Market Share by Insights Analysisin 2022
- Figure 134: Latin America Caramel Market Attractiveness Analysis by Insights Analysis, 2016-2032
- Figure 135: Latin America Caramel Market Revenue (US$ Mn) Market Share by Application Analysisin 2022
- Figure 136: Latin America Caramel Market Attractiveness Analysis by Application Analysis, 2016-2032
- Figure 137: Latin America Caramel Market Revenue (US$ Mn) Market Share by in 2022
- Figure 138: Latin America Caramel Market Attractiveness Analysis by , 2016-2032
- Figure 139: Latin America Caramel Market Revenue (US$ Mn) Market Share by Country in 2022
- Figure 140: Latin America Caramel Market Attractiveness Analysis by Country, 2016-2032
- Figure 141: Latin America Caramel Market Revenue (US$ Mn) (2016-2032)
- Figure 142: Latin America Caramel Market Revenue (US$ Mn) Comparison by Country (2016-2032)
- Figure 143: Latin America Caramel Market Revenue (US$ Mn) Comparison by Function Analysis (2016-2032)
- Figure 144: Latin America Caramel Market Revenue (US$ Mn) Comparison by Insights Analysis (2016-2032)
- Figure 145: Latin America Caramel Market Revenue (US$ Mn) Comparison by Application Analysis (2016-2032)
- Figure 146: Latin America Caramel Market Revenue (US$ Mn) Comparison by (2016-2032)
- Figure 147: Latin America Caramel Market Y-o-Y Growth Rate Comparison by Country (2016-2032)
- Figure 148: Latin America Caramel Market Y-o-Y Growth Rate Comparison by Function Analysis (2016-2032)
- Figure 149: Latin America Caramel Market Y-o-Y Growth Rate Comparison by Insights Analysis (2016-2032)
- Figure 150: Latin America Caramel Market Y-o-Y Growth Rate Comparison by Application Analysis (2016-2032)
- Figure 151: Latin America Caramel Market Y-o-Y Growth Rate Comparison by (2016-2032)
- Figure 152: Latin America Caramel Market Share Comparison by Country (2016-2032)
- Figure 153: Latin America Caramel Market Share Comparison by Function Analysis (2016-2032)
- Figure 154: Latin America Caramel Market Share Comparison by Insights Analysis (2016-2032)
- Figure 155: Latin America Caramel Market Share Comparison by Application Analysis (2016-2032)
- Figure 156: Latin America Caramel Market Share Comparison by (2016-2032)
- Figure 157: Middle East & Africa Caramel Market Revenue (US$ Mn) Market Share by Function Analysisin 2022
- Figure 158: Middle East & Africa Caramel Market Attractiveness Analysis by Function Analysis, 2016-2032
- Figure 159: Middle East & Africa Caramel Market Revenue (US$ Mn) Market Share by Insights Analysisin 2022
- Figure 160: Middle East & Africa Caramel Market Attractiveness Analysis by Insights Analysis, 2016-2032
- Figure 161: Middle East & Africa Caramel Market Revenue (US$ Mn) Market Share by Application Analysisin 2022
- Figure 162: Middle East & Africa Caramel Market Attractiveness Analysis by Application Analysis, 2016-2032
- Figure 163: Middle East & Africa Caramel Market Revenue (US$ Mn) Market Share by in 2022
- Figure 164: Middle East & Africa Caramel Market Attractiveness Analysis by , 2016-2032
- Figure 165: Middle East & Africa Caramel Market Revenue (US$ Mn) Market Share by Country in 2022
- Figure 166: Middle East & Africa Caramel Market Attractiveness Analysis by Country, 2016-2032
- Figure 167: Middle East & Africa Caramel Market Revenue (US$ Mn) (2016-2032)
- Figure 168: Middle East & Africa Caramel Market Revenue (US$ Mn) Comparison by Country (2016-2032)
- Figure 169: Middle East & Africa Caramel Market Revenue (US$ Mn) Comparison by Function Analysis (2016-2032)
- Figure 170: Middle East & Africa Caramel Market Revenue (US$ Mn) Comparison by Insights Analysis (2016-2032)
- Figure 171: Middle East & Africa Caramel Market Revenue (US$ Mn) Comparison by Application Analysis (2016-2032)
- Figure 172: Middle East & Africa Caramel Market Revenue (US$ Mn) Comparison by (2016-2032)
- Figure 173: Middle East & Africa Caramel Market Y-o-Y Growth Rate Comparison by Country (2016-2032)
- Figure 174: Middle East & Africa Caramel Market Y-o-Y Growth Rate Comparison by Function Analysis (2016-2032)
- Figure 175: Middle East & Africa Caramel Market Y-o-Y Growth Rate Comparison by Insights Analysis (2016-2032)
- Figure 176: Middle East & Africa Caramel Market Y-o-Y Growth Rate Comparison by Application Analysis (2016-2032)
- Figure 177: Middle East & Africa Caramel Market Y-o-Y Growth Rate Comparison by (2016-2032)
- Figure 178: Middle East & Africa Caramel Market Share Comparison by Country (2016-2032)
- Figure 179: Middle East & Africa Caramel Market Share Comparison by Function Analysis (2016-2032)
- Figure 180: Middle East & Africa Caramel Market Share Comparison by Insights Analysis (2016-2032)
- Figure 181: Middle East & Africa Caramel Market Share Comparison by Application Analysis (2016-2032)
- Figure 182: Middle East & Africa Caramel Market Share Comparison by (2016-2032)
List of Tables
- Table 1: Global Caramel Market Comparison by Function Analysis (2016-2032)
- Table 2: Global Caramel Market Comparison by Insights Analysis (2016-2032)
- Table 3: Global Caramel Market Comparison by Application Analysis (2016-2032)
- Table 4: Global Caramel Market Comparison by (2016-2032)
- Table 5: Global Caramel Market Revenue (US$ Mn) Comparison by Region (2016-2032)
- Table 6: Global Caramel Market Revenue (US$ Mn) (2016-2032)
- Table 7: Global Caramel Market Revenue (US$ Mn) Comparison by Region (2016-2032)
- Table 8: Global Caramel Market Revenue (US$ Mn) Comparison by Function Analysis (2016-2032)
- Table 9: Global Caramel Market Revenue (US$ Mn) Comparison by Insights Analysis (2016-2032)
- Table 10: Global Caramel Market Revenue (US$ Mn) Comparison by Application Analysis (2016-2032)
- Table 11: Global Caramel Market Revenue (US$ Mn) Comparison by (2016-2032)
- Table 12: Global Caramel Market Y-o-Y Growth Rate Comparison by Region (2016-2032)
- Table 13: Global Caramel Market Y-o-Y Growth Rate Comparison by Function Analysis (2016-2032)
- Table 14: Global Caramel Market Y-o-Y Growth Rate Comparison by Insights Analysis (2016-2032)
- Table 15: Global Caramel Market Y-o-Y Growth Rate Comparison by Application Analysis (2016-2032)
- Table 16: Global Caramel Market Y-o-Y Growth Rate Comparison by (2016-2032)
- Table 17: Global Caramel Market Share Comparison by Region (2016-2032)
- Table 18: Global Caramel Market Share Comparison by Function Analysis (2016-2032)
- Table 19: Global Caramel Market Share Comparison by Insights Analysis (2016-2032)
- Table 20: Global Caramel Market Share Comparison by Application Analysis (2016-2032)
- Table 21: Global Caramel Market Share Comparison by (2016-2032)
- Table 22: North America Caramel Market Comparison by Insights Analysis (2016-2032)
- Table 23: North America Caramel Market Comparison by Application Analysis (2016-2032)
- Table 24: North America Caramel Market Comparison by (2016-2032)
- Table 25: North America Caramel Market Revenue (US$ Mn) Comparison by Country (2016-2032)
- Table 26: North America Caramel Market Revenue (US$ Mn) (2016-2032)
- Table 27: North America Caramel Market Revenue (US$ Mn) Comparison by Country (2016-2032)
- Table 28: North America Caramel Market Revenue (US$ Mn) Comparison by Function Analysis (2016-2032)
- Table 29: North America Caramel Market Revenue (US$ Mn) Comparison by Insights Analysis (2016-2032)
- Table 30: North America Caramel Market Revenue (US$ Mn) Comparison by Application Analysis (2016-2032)
- Table 31: North America Caramel Market Revenue (US$ Mn) Comparison by (2016-2032)
- Table 32: North America Caramel Market Y-o-Y Growth Rate Comparison by Country (2016-2032)
- Table 33: North America Caramel Market Y-o-Y Growth Rate Comparison by Function Analysis (2016-2032)
- Table 34: North America Caramel Market Y-o-Y Growth Rate Comparison by Insights Analysis (2016-2032)
- Table 35: North America Caramel Market Y-o-Y Growth Rate Comparison by Application Analysis (2016-2032)
- Table 36: North America Caramel Market Y-o-Y Growth Rate Comparison by (2016-2032)
- Table 37: North America Caramel Market Share Comparison by Country (2016-2032)
- Table 38: North America Caramel Market Share Comparison by Function Analysis (2016-2032)
- Table 39: North America Caramel Market Share Comparison by Insights Analysis (2016-2032)
- Table 40: North America Caramel Market Share Comparison by Application Analysis (2016-2032)
- Table 41: North America Caramel Market Share Comparison by (2016-2032)
- Table 42: Western Europe Caramel Market Comparison by Function Analysis (2016-2032)
- Table 43: Western Europe Caramel Market Comparison by Insights Analysis (2016-2032)
- Table 44: Western Europe Caramel Market Comparison by Application Analysis (2016-2032)
- Table 45: Western Europe Caramel Market Comparison by (2016-2032)
- Table 46: Western Europe Caramel Market Revenue (US$ Mn) Comparison by Country (2016-2032)
- Table 47: Western Europe Caramel Market Revenue (US$ Mn) (2016-2032)
- Table 48: Western Europe Caramel Market Revenue (US$ Mn) Comparison by Country (2016-2032)
- Table 49: Western Europe Caramel Market Revenue (US$ Mn) Comparison by Function Analysis (2016-2032)
- Table 50: Western Europe Caramel Market Revenue (US$ Mn) Comparison by Insights Analysis (2016-2032)
- Table 51: Western Europe Caramel Market Revenue (US$ Mn) Comparison by Application Analysis (2016-2032)
- Table 52: Western Europe Caramel Market Revenue (US$ Mn) Comparison by (2016-2032)
- Table 53: Western Europe Caramel Market Y-o-Y Growth Rate Comparison by Country (2016-2032)
- Table 54: Western Europe Caramel Market Y-o-Y Growth Rate Comparison by Function Analysis (2016-2032)
- Table 55: Western Europe Caramel Market Y-o-Y Growth Rate Comparison by Insights Analysis (2016-2032)
- Table 56: Western Europe Caramel Market Y-o-Y Growth Rate Comparison by Application Analysis (2016-2032)
- Table 57: Western Europe Caramel Market Y-o-Y Growth Rate Comparison by (2016-2032)
- Table 58: Western Europe Caramel Market Share Comparison by Country (2016-2032)
- Table 59: Western Europe Caramel Market Share Comparison by Function Analysis (2016-2032)
- Table 60: Western Europe Caramel Market Share Comparison by Insights Analysis (2016-2032)
- Table 61: Western Europe Caramel Market Share Comparison by Application Analysis (2016-2032)
- Table 62: Western Europe Caramel Market Share Comparison by (2016-2032)
- Table 63: Eastern Europe Caramel Market Comparison by Function Analysis (2016-2032)
- Table 64: Eastern Europe Caramel Market Comparison by Insights Analysis (2016-2032)
- Table 65: Eastern Europe Caramel Market Comparison by Application Analysis (2016-2032)
- Table 66: Eastern Europe Caramel Market Comparison by (2016-2032)
- Table 67: Eastern Europe Caramel Market Revenue (US$ Mn) Comparison by Country (2016-2032)
- Table 68: Eastern Europe Caramel Market Revenue (US$ Mn) (2016-2032)
- Table 69: Eastern Europe Caramel Market Revenue (US$ Mn) Comparison by Country (2016-2032)
- Table 70: Eastern Europe Caramel Market Revenue (US$ Mn) Comparison by Function Analysis (2016-2032)
- Table 71: Eastern Europe Caramel Market Revenue (US$ Mn) Comparison by Insights Analysis (2016-2032)
- Table 72: Eastern Europe Caramel Market Revenue (US$ Mn) Comparison by Application Analysis (2016-2032)
- Table 73: Eastern Europe Caramel Market Revenue (US$ Mn) Comparison by (2016-2032)
- Table 74: Eastern Europe Caramel Market Y-o-Y Growth Rate Comparison by Country (2016-2032)
- Table 75: Eastern Europe Caramel Market Y-o-Y Growth Rate Comparison by Function Analysis (2016-2032)
- Table 76: Eastern Europe Caramel Market Y-o-Y Growth Rate Comparison by Insights Analysis (2016-2032)
- Table 77: Eastern Europe Caramel Market Y-o-Y Growth Rate Comparison by Application Analysis (2016-2032)
- Table 78: Eastern Europe Caramel Market Y-o-Y Growth Rate Comparison by (2016-2032)
- Table 79: Eastern Europe Caramel Market Share Comparison by Country (2016-2032)
- Table 80: Eastern Europe Caramel Market Share Comparison by Function Analysis (2016-2032)
- Table 81: Eastern Europe Caramel Market Share Comparison by Insights Analysis (2016-2032)
- Table 82: Eastern Europe Caramel Market Share Comparison by Application Analysis (2016-2032)
- Table 83: Eastern Europe Caramel Market Share Comparison by (2016-2032)
- Table 84: APAC Caramel Market Comparison by Function Analysis (2016-2032)
- Table 85: APAC Caramel Market Comparison by Insights Analysis (2016-2032)
- Table 86: APAC Caramel Market Comparison by Application Analysis (2016-2032)
- Table 87: APAC Caramel Market Comparison by (2016-2032)
- Table 88: APAC Caramel Market Revenue (US$ Mn) Comparison by Country (2016-2032)
- Table 89: APAC Caramel Market Revenue (US$ Mn) (2016-2032)
- Table 90: APAC Caramel Market Revenue (US$ Mn) Comparison by Country (2016-2032)
- Table 91: APAC Caramel Market Revenue (US$ Mn) Comparison by Function Analysis (2016-2032)
- Table 92: APAC Caramel Market Revenue (US$ Mn) Comparison by Insights Analysis (2016-2032)
- Table 93: APAC Caramel Market Revenue (US$ Mn) Comparison by Application Analysis (2016-2032)
- Table 94: APAC Caramel Market Revenue (US$ Mn) Comparison by (2016-2032)
- Table 95: APAC Caramel Market Y-o-Y Growth Rate Comparison by Country (2016-2032)
- Table 96: APAC Caramel Market Y-o-Y Growth Rate Comparison by Function Analysis (2016-2032)
- Table 97: APAC Caramel Market Y-o-Y Growth Rate Comparison by Insights Analysis (2016-2032)
- Table 98: APAC Caramel Market Y-o-Y Growth Rate Comparison by Application Analysis (2016-2032)
- Table 99: APAC Caramel Market Y-o-Y Growth Rate Comparison by (2016-2032)
- Table 100: APAC Caramel Market Share Comparison by Country (2016-2032)
- Table 101: APAC Caramel Market Share Comparison by Function Analysis (2016-2032)
- Table 102: APAC Caramel Market Share Comparison by Insights Analysis (2016-2032)
- Table 103: APAC Caramel Market Share Comparison by Application Analysis (2016-2032)
- Table 104: APAC Caramel Market Share Comparison by (2016-2032)
- Table 105: Latin America Caramel Market Comparison by Function Analysis (2016-2032)
- Table 106: Latin America Caramel Market Comparison by Insights Analysis (2016-2032)
- Table 107: Latin America Caramel Market Comparison by Application Analysis (2016-2032)
- Table 108: Latin America Caramel Market Comparison by (2016-2032)
- Table 109: Latin America Caramel Market Revenue (US$ Mn) Comparison by Country (2016-2032)
- Table 110: Latin America Caramel Market Revenue (US$ Mn) (2016-2032)
- Table 111: Latin America Caramel Market Revenue (US$ Mn) Comparison by Country (2016-2032)
- Table 112: Latin America Caramel Market Revenue (US$ Mn) Comparison by Function Analysis (2016-2032)
- Table 113: Latin America Caramel Market Revenue (US$ Mn) Comparison by Insights Analysis (2016-2032)
- Table 114: Latin America Caramel Market Revenue (US$ Mn) Comparison by Application Analysis (2016-2032)
- Table 115: Latin America Caramel Market Revenue (US$ Mn) Comparison by (2016-2032)
- Table 116: Latin America Caramel Market Y-o-Y Growth Rate Comparison by Country (2016-2032)
- Table 117: Latin America Caramel Market Y-o-Y Growth Rate Comparison by Function Analysis (2016-2032)
- Table 118: Latin America Caramel Market Y-o-Y Growth Rate Comparison by Insights Analysis (2016-2032)
- Table 119: Latin America Caramel Market Y-o-Y Growth Rate Comparison by Application Analysis (2016-2032)
- Table 120: Latin America Caramel Market Y-o-Y Growth Rate Comparison by (2016-2032)
- Table 121: Latin America Caramel Market Share Comparison by Country (2016-2032)
- Table 122: Latin America Caramel Market Share Comparison by Function Analysis (2016-2032)
- Table 123: Latin America Caramel Market Share Comparison by Insights Analysis (2016-2032)
- Table 124: Latin America Caramel Market Share Comparison by Application Analysis (2016-2032)
- Table 125: Latin America Caramel Market Share Comparison by (2016-2032)
- Table 126: Middle East & Africa Caramel Market Comparison by Function Analysis (2016-2032)
- Table 127: Middle East & Africa Caramel Market Comparison by Insights Analysis (2016-2032)
- Table 128: Middle East & Africa Caramel Market Comparison by Application Analysis (2016-2032)
- Table 129: Middle East & Africa Caramel Market Comparison by (2016-2032)
- Table 130: Middle East & Africa Caramel Market Revenue (US$ Mn) Comparison by Country (2016-2032)
- Table 131: Middle East & Africa Caramel Market Revenue (US$ Mn) (2016-2032)
- Table 132: Middle East & Africa Caramel Market Revenue (US$ Mn) Comparison by Country (2016-2032)
- Table 133: Middle East & Africa Caramel Market Revenue (US$ Mn) Comparison by Function Analysis (2016-2032)
- Table 134: Middle East & Africa Caramel Market Revenue (US$ Mn) Comparison by Insights Analysis (2016-2032)
- Table 135: Middle East & Africa Caramel Market Revenue (US$ Mn) Comparison by Application Analysis (2016-2032)
- Table 136: Middle East & Africa Caramel Market Revenue (US$ Mn) Comparison by (2016-2032)
- Table 137: Middle East & Africa Caramel Market Y-o-Y Growth Rate Comparison by Country (2016-2032)
- Table 138: Middle East & Africa Caramel Market Y-o-Y Growth Rate Comparison by Function Analysis (2016-2032)
- Table 139: Middle East & Africa Caramel Market Y-o-Y Growth Rate Comparison by Insights Analysis (2016-2032)
- Table 140: Middle East & Africa Caramel Market Y-o-Y Growth Rate Comparison by Application Analysis (2016-2032)
- Table 141: Middle East & Africa Caramel Market Y-o-Y Growth Rate Comparison by (2016-2032)
- Table 142: Middle East & Africa Caramel Market Share Comparison by Country (2016-2032)
- Table 143: Middle East & Africa Caramel Market Share Comparison by Function Analysis (2016-2032)
- Table 144: Middle East & Africa Caramel Market Share Comparison by Insights Analysis (2016-2032)
- Table 145: Middle East & Africa Caramel Market Share Comparison by Application Analysis (2016-2032)
- Table 146: Middle East & Africa Caramel Market Share Comparison by (2016-2032)
- 1. Executive Summary
-
- Goetze's Candy Company Inc
- Cargill, Inc.
- Dallas Caramel Company
- Mondelez International
- Cadbury Caramel
- Godiva
- Lindt
- Fat Toad Farm
- Liddabit Sweets
- Tierra Farm
- Hershey's
- Nestlé
- Greenville Caramel Company
Our Clients


View Our Licence Options
