
Cancer Biomarkers Market By Type (Protein Biomarker, Genetic Biomarker, Others), By Tumor Type (Breast Cancer, Lung Cancer, Others), By Technology (Omics, Imaging, Immunoassays), By Application (Drug discovery and Development, Diagnostics, Others), By Region And Companies - Industry Segment Outlook, Market Assessment, Competition Scenario, Trends, And Forecast 2023-2032
-
4115
-
May 2023
-
173
-


-
This report was compiled by Correspondence Linkedin | Detailed Market research Methodology Our methodology involves a mix of primary research, including interviews with leading mental health experts, and secondary research from reputable medical journals and databases. View Detailed Methodology Page
-
Quick Navigation
Report Overview
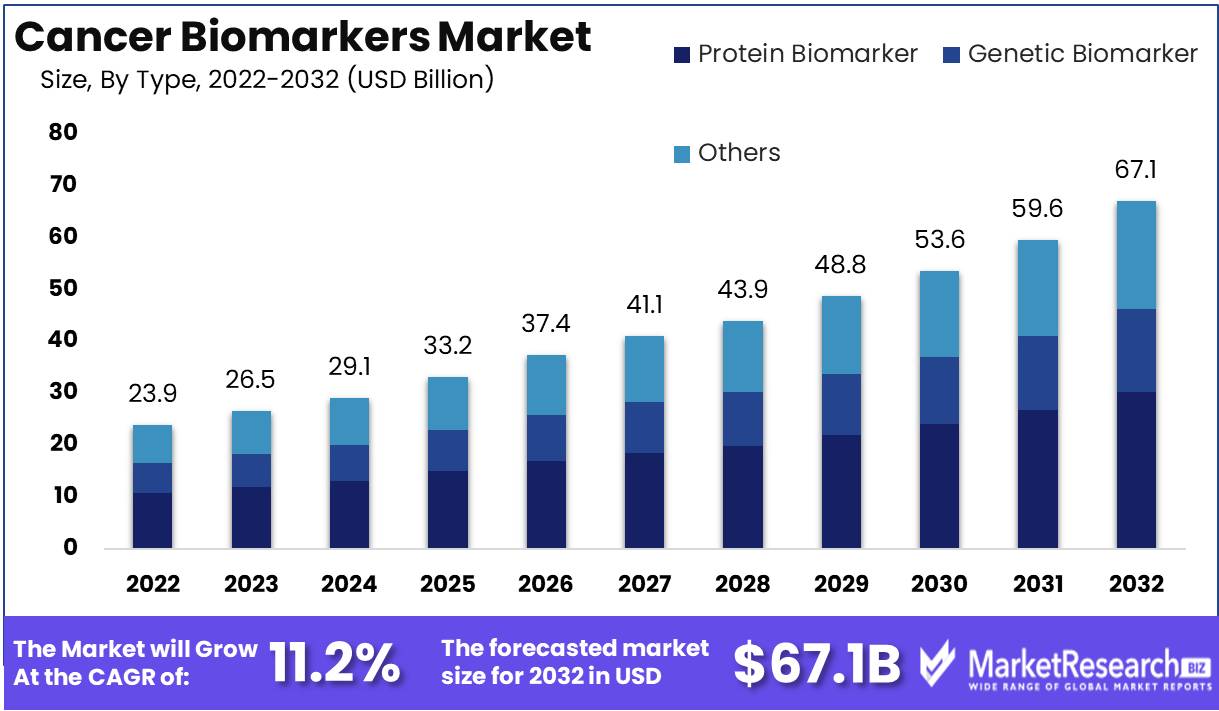
Cancer Biomarkers Market size is expected to be worth around USD 67.1 Bn by 2032 from USD 23.9 Bn in 2022, growing at a CAGR of 11.2% during the forecast period from 2023 to 2032.
The Cancer Biomarkers Market represents an integral element in oncology research and diagnostics. As cancer is an ever-evolving global health challenge, its identification and utilization have assumed increased significance over the years. According to WHO research, one-third of cancer fatalities can be attributed to modifiable risk factors such as tobacco use, unhealthy diet, sedentary lifestyles, excessive alcohol consumption, or excessive stress levels - thus necessitating robust biomarkers for early detection, prognosis, and treatment stratification
American Cancer Society journals predict an alarming surge in cancer prevalence since 2010, as its projected number of new cancer cases climbed from 1.6 million diagnoses in 2010 to an expected 1.9 million diagnoses by 2022. With such alarming increases, the cancer biomarkers market is playing an essential part in both research and clinical practice for cancer treatment and research.
Cancer biomarkers play a critical role beyond mere detection. Biomarkers offer invaluable insights into the molecular makeup of various cancer types, providing greater precision when understanding disease progression and prognosis as well as personalized treatment regimens that minimize collateral damage caused by traditional one-size-fits-all approaches. This move towards precision medicine has led to an explosion in demand for innovative biomarker technologies resulting in substantial industry growth for cancer biomarkers.
Current trends in the field are driving market expansion significantly. Advancements in high-throughput omics technologies such as genomics, proteomics, and metabolomics are leading to novel biomarkers with superior sensitivity and specificity being discovered. Furthermore, artificial intelligence and machine learning applications have expedited biomarker discovery, as well as data analysis efforts, helping healthcare providers, recognize early cancer detection and targeted therapies as key components of therapy delivery strategies - further fuelling industry expansion.
Driving factors
Catalyst for Market Growth of Biomarkers
The global landscape is witnessing a staggering increase in cancer cases, which is driving unprecedented demand for effective treatments and therapies. The rising incidence of cancer has been a key factor in the expansion of the cancer biomarkers market. This increase in demand has given rise to the concept of personalized medicine, which aims to revolutionize the field by developing targeted treatments based on the unique genetic composition of each individual. The introduction of genomic and proteomic technologies has played a pivotal role in making personalized medicine a reality, thereby driving the biomarker market to new heights.
Promoting Biomarker Innovations for Cancer
Significant advancements in cancer diagnostics have emerged as a result of the exponential increase in global healthcare expenditures. Governments and healthcare organizations around the world have significantly increased their expenditure on cancer research and treatment, fostering innovation. Growing awareness of the importance of early cancer detection has accelerated the adoption of cutting-edge technologies in cancer diagnosis. Revolutionary advances, such as liquid biopsies, highly sensitive and specific diagnostic tests, and innovative imaging technologies, have reshaped cancer diagnosis and treatment. In the Cancer Biomarkers Market, Personalized Medicine Biomarkers are paving the way for precise and targeted therapies, improving patient outcomes.
Driving Biomarker Discovery in Cancer
Through robust funding for research programs aimed at discovering new and effective cancer treatments, governments across the globe are driving the expansion of the cancer biomarker market. This increase in government funding has stimulated an increase in cancer biomarker development research and development activities. In response, key participants in the biomarker market are increasing their investments, thereby expediting the development of cancer biomarker research and propelling the market's growth trajectory.
The demands for cancer biomarkers have surged in recent years due to their pivotal role in the diagnosis and treatment of cancer. The adoption of cancer biomarkers has been instrumental in enhancing precision medicine approaches, thereby improving the treatment of cancer. Consequently, the development of cancer biomarkers continues to be a focal point for researchers and healthcare providers alike. As a result, the cancer biomarkers market is witnessing exponential growth, with companies vying for market share, driving the overall cancer biomarkers market growth.
Enhancing Individualized Cancer Treatment
In the Cancer Biomarkers market, the increasing adoption of companion diagnostics is a significant trend. On the basis of their patients' genetic profiles, these ground-breaking tests play a crucial role in assisting physicians in selecting the most appropriate treatments for their patients. The advent of companion diagnostics has revolutionized the treatment landscape by facilitating the development of targeted therapies. This paradigm shift towards personalized medicine has significantly contributed to the expansion of the biomarker market, driving it forward with unyielding force.
Exploring the Future
While the Cancer Biomarkers market is thriving, prospective market disruptors are on the horizon. Changes in regulations have the ability to reshape the competitive landscape, necessitating that businesses adapt to and adhere to new rules and standards. In addition, emerging technologies such as artificial intelligence and machine learning have enormous potential to shape the market's future. In order to maintain a competitive advantage in this dynamic industry, businesses will need to be aware of emerging key trends, comprehend changes in consumer behavior, and embrace technological advancements.
Restraining Factors
High Expenses Linked to Cancer Biomarker Testing
The exorbitant cost of cancer biomarker testing is one of the most important limiting factors. Due to the rising cost of healthcare and the need for sophisticated diagnostic tests and instruments, the price of these tests is increasing. Not all patients can afford cancer biomarker tests, which can be expensive.
This prohibitive cost affects not only patients but also healthcare providers and insurers. The exorbitant price restricts the number of patients who can receive these tests. It also restricts how often a patient can be evaluated.
Lack of Standardization in Biomarker Testing for Cancer
The absence of standardized testing methods is another significant factor limiting the testing of cancer biomarkers. Different laboratories use distinct testing procedures, resulting in variable test results. Variability can result in incorrect diagnoses.
Inconsistent testing procedures also make it difficult to compare results from different laboratories. This lack of standardization also affects the interpretation of test results, which can cause confusion among medical professionals.
Reimbursement Issues
In addition to reimbursement concerns, testing for cancer biomarkers is hampered by other factors. Insurance companies have their own coverage policies and guidelines for medical examinations. These policies specify the coverage criteria, including the type of diagnostic test, the frequency of testing, and the patient-specific criteria.
The restrictive policies of insurance companies limit the number of patients who can afford cancer biomarker testing. Due to this issue, many patients do not receive the required diagnostic procedures, which hinders early detection and treatment.
Sensitivity and Specificity of Certain Cancer Biomarkers
The sensitivity and specificity of certain biomarkers for malignancy are limited. It indicates that the biomarker may not always accurately detect the presence of cancer. Depending on the purpose of the test, this lack of sensitivity and specificity may produce false-positive or false-negative results.
This factor also limits the ability of physicians to rely solely on these biomarkers to diagnose cancer. Additionally, physicians must consider the patient's medical history, imaging exams, and biopsy results.
Strict Regulatory Policies
The Cancer Biomarkers market is subject to stringent regulatory policies established by governing bodies. Before biomarkers are made available to the public, these bodies ensure that they meet safety, efficiency, and effectiveness standards.
However, these regulations also make bringing new biomarkers to market a time-consuming and expensive procedure for companies. It is crucial to ensure that the Cancer Biomarkers market provides safe and dependable tests. However, these policies can also limit the availability of new diagnostic options.
Type Analysis
The field of Cancer biomarker types has gained significant momentum over the past few years, with an increasing focus on protein biomarkers. This segment's growth dominates the market and is expected to continue its market growth trajectory in the coming years. With the rise in chronic diseases and the demand for precision medicine, the adoption of protein biomarkers is increasing rapidly.
The protein biomarkers segment has generated substantial interest due to their ability to provide insights into types of cancer diagnosis, prognosis, and drug response. It involves the analysis of proteins expressed by cancer cells, aiding in early detection, personalized treatment, and efficient monitoring of biomarkers in cancer patients. Consumer trends and behavior towards the protein biomarkers segment are not yet well established. However, there is a growing prevalence of cancer awareness among consumers regarding the role of biomarkers in cancer diagnosis and treatment.
Tumor Type Analysis
Breast cancer is a significant segment in the Cancer Biomarkers market, contributing to a substantial chunk of the overall revenue. It is the second most prevalent cancer worldwide, and the accuracy of its diagnosis and treatment has a direct impact on patient outcomes. The breast cancer segment is one of the largest segments in the cancer biomarkers market.
Consumer trends and behavior towards breast cancer biomarkers are relatively positive, given the increasing awareness of the disease among the general population. There is a significant demand for facilities that provide accurate and cost-effective diagnostic and treatment options for breast cancer. The breast cancer segment in the cancer biomarkers market is expected to register a fast market growth rate over the coming years.
The prevalence of breast cancer continues to be a significant global health concern. Successfully treating cancer is essential for patients' well-being. Ongoing research also delves into cancer in breast milk, a unique aspect within the cancer biomarkers market. Progress in early detection and treatment strategies plays a vital role in addressing this widespread issue and improving breast cancer care.
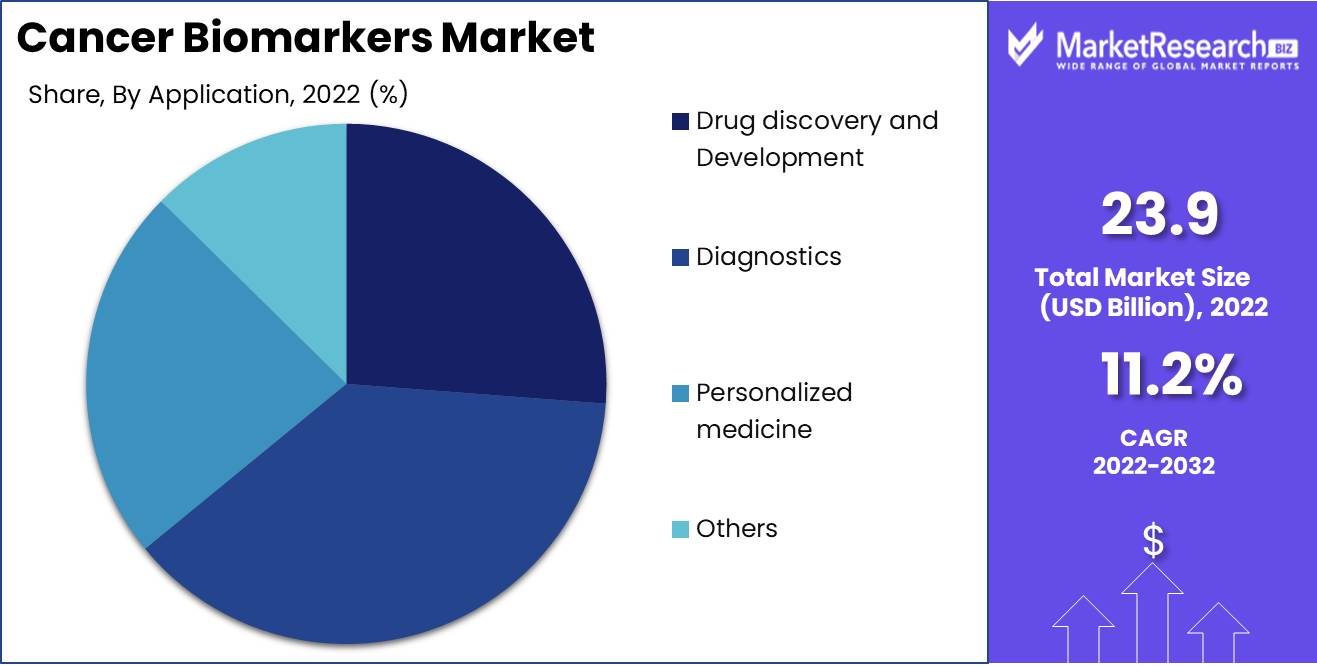
Application Analysis
The Diagnostics segment dominates the Cancer Biomarkers market, making it a significant area of focus for medical researchers and healthcare providers. The primary aim of biomarkers for diagnosis is to aid clinicians in identifying cancerous cells accurately. This can be achieved by analyzing various biomolecules such as oral proteins and peptides, as well as DNA.
Regarding future trends and behavior toward diagnosis biomarkers, patients are increasingly seeking personalized medicine options that can provide accurate, efficient, and cost-effective diagnoses of cancer. The breast cancer diagnosis segment is expected to register the fastest segment growth rate over the forthcoming years. The rise in the incidence of cancer and the demand for precision medicine approaches are driving the growth of this segment.
Within the dynamic landscape of the cancer biomarkers market, the diagnosis segment thrives, powered by advanced diagnostic techniques. DNA cancer biomarkers assume a central role, facilitating early detection and tailored treatment approaches. This symbiotic relationship between technology and biology propels advancements in cancer diagnosis and therapy.
Key Market Segments
By Type
- Protein Biomarker
- Genetic Biomarker
- Others (cell, viral, and carbohydrate biomarkers)
By Tumor Type
- Breast Cancer
- Lung Cancer
- Colorectal Cancer
- Melanoma
- Leukemia
- Others
By Technology
- Omics
- Imaging
- Immunoassays
- Cytogenetics
- Bioinformatics
By Application
- Drug discovery and Development
- Diagnostics
- Personalized medicine
- Others
Growth Opportunity
The Key to Cancer Treatment
Early detection and diagnosis are essential to improving treatment outcomes for cancer, the primary cause of mortality worldwide. In the detection and diagnosis of this formidable disease, cancer biomarkers have brought about a paradigm shift. Produced by cancer cells or the body in response to cancer, these biomarkers play a crucial role in detecting cancer, tracking its progression, and predicting treatment responses.
Powered by numerous growth drivers
The global market for cancer biomarkers is anticipated to experience substantial expansion due to a number of important factors. Increasing growth factors for non-invasive cancer diagnostics tests, the development of novel biomarkers for early detection, the expanding role of liquid biopsy, the emphasis on companion diagnostics for targeted therapy, and the surge in cancer biomarker research and development in emerging economies are all contributing to the market growth.
Non-Invasive Diagnostics
Non-invasive cancer diagnostic tests are gaining popularity because they are more accurate and less invasive than traditional invasive tests such as biopsies. A noninvasive test that analyzes biofluids such as blood or urine, liquid biopsy has emerged as a promising technology for early cancer detection. By detecting cancer at an early stage, liquid biopsy makes treatment strategies more effective.
Leading the way in Early Detection and Diagnosis
The development of novel cancer biomarkers for early detection and diagnosis is a major factor driving the Cancer Biomarkers market. Researchers have identified biomarkers that can detect cancer in its earliest phases when treatment is most effective. Genomics and proteomics have played crucial roles in the discovery of these promising biomarkers.
The rapid development of Cancer Biomarkers fuels the adoption of Cancer Biomarkers, shaping the Cancer Biomarkers market's growth.
Liquid Biopsy
The use of liquid biopsies as a cancer diagnostic instrument is increasing rapidly. This noninvasive test examines biofluids such as blood or urine to detect malignancy. Liquid biopsy has several advantages over invasive biopsy procedures, including reduced invasiveness, a lower risk of complications, and the ability to detect cancer at an early stage, allowing for timely and targeted treatment interventions.
Latest Trends
Precision Medicine and Biomarkers
Precision medicine is a new approach to treating cancer that identifies the specific genetic mutations that cause cancer and targets them with therapies that have fewer adverse effects than conventional chemotherapies. Cancers with mutations in essential genes, such as the BRCA gene in breast cancer or the EGFR gene in lung cancer, respond well to precision medicine.
Biomarker testing is an indispensable component of precision medicine because it identifies the specific genetic mutations that cause cancer and determines which targeted therapies are most likely to be effective for a given patient. The growing use of precision medicine in cancer treatment has increased the demand for biomarker testing, which is now a standard practice in many cancer clinics around the globe.
Testing of Biomarkers for Cancer Screening
Biomarker testing is increasingly used for cancer screening, especially in high-risk populations such as those with a familial history of cancer or a history of exposure to carcinogenic substances like tobacco smoking. Biomarker testing can help reduce the incidence of late-stage cancer, which is typically more difficult to treat and has a poorer prognosis.
Multi-Marker Panels for Cancer Diagnosis
A recent development in the field of cancer diagnosis, multi-marker panels entail testing for multiple biomarkers simultaneously. Multimarker panels have the potential to increase the accuracy of cancer diagnosis, particularly when a single biomarker is insufficiently specific to differentiate between various cancer types or stages.
Advances in biomarker discovery technologies, such as mass spectrometry, next-generation sequencing, and gene expression profiling, have enabled the development of multi-marker panels. Multimarker panels are currently being utilized in clinical trials and are anticipated to become routine in the near future.
AI in Biomarker Analysis for Cancer
Artificial intelligence (AI) is an additional significant market trend that influences the Cancer Biomarkers market. By outsourcing biomarker discovery, validation, and interpretation, artificial intelligence has the potential to revolutionize cancer biomarker analysis. AI is capable of analyzing enormous quantities of data and recognizing patterns that are invisible to the human eye.
Several areas of cancer research already employ AI, including biomarkers in drug discovery, precision medicine, and biomarker analysis. In the coming years, machine learning and natural language processing are anticipated to play an increasingly crucial role in the Cancer Biomarkers market.
Collaborations and partnerships
Collaborations and partnerships between major participants in the Cancer Biomarkers market are an additional significant market trend that is reshaping the industry trends. Collaboration is essential for generating innovation and advancing biomarker research in the field of cancer. The expertise, technologies, and capabilities of multiple organizations can be combined through collaborations to accelerate progress and achieve advancements that would not be possible otherwise.
Due to the multidisciplinary character of the Cancer Biomarkers market, collaborations and partnerships are of particular importance. Collaborations require a comprehensive comprehension of the scientific, clinical, and commercial aspects of the industry, as well as strong communication, decision-making, and project management skills.
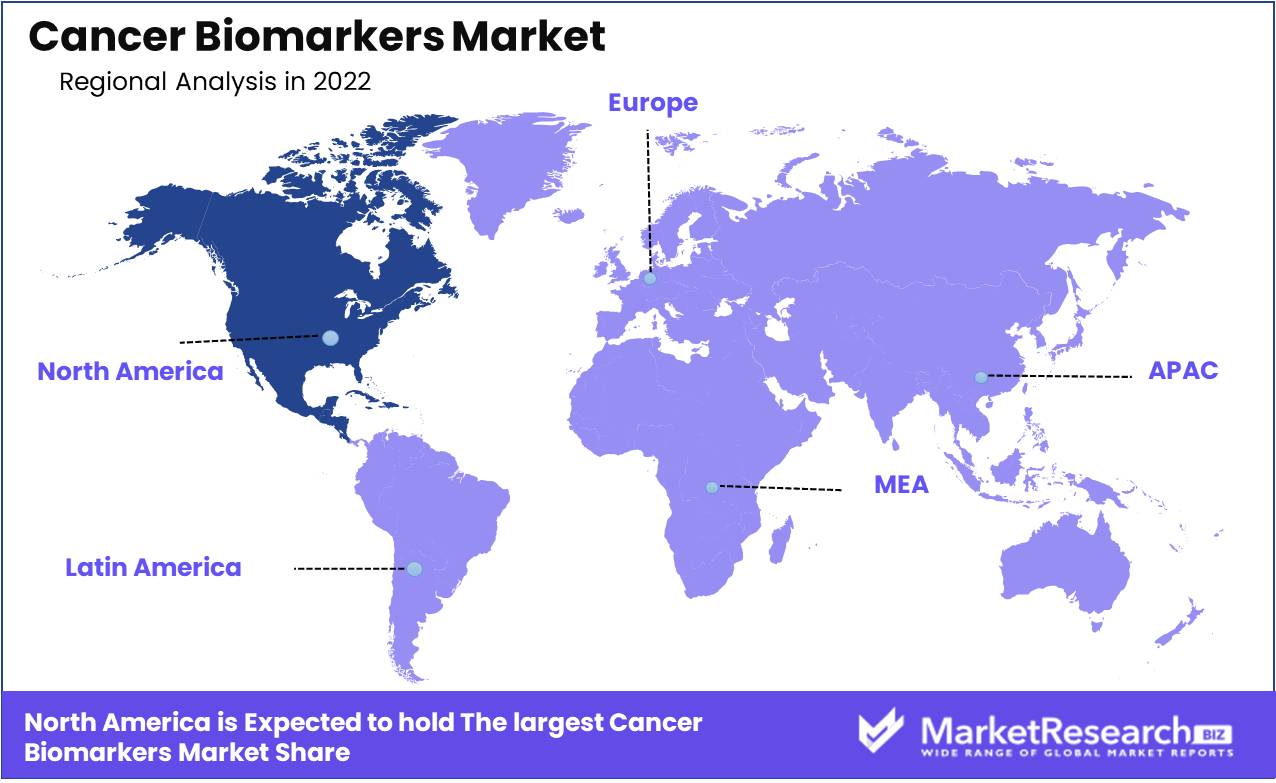
Regional Analysis
There are some major regions are as follows: North America, Europe, the Asia Pacific, Latin America, and the Middle East and Africa. In addition, the high amount rate of cancer in the region propels the industry growth. Furthermore, there are major types of cancer biomarker diagnostics that are covered under health insurance in the region.
Market Dominant in North America for Cancer Research and Treatment. Cancer is one of the world's deadliest diseases, causing millions of fatalities annually. Although cancer affects individuals all over the world, North America is the largest market for cancer research and treatment. Due to the high incidence of cancer and growing investments in cancer research and treatment, North America is the center of innovation in the field.
Cancer centers throughout North America offer patients with cancer a comprehensive range of treatments and services. These centers consist of teams of physicians, researchers, and support personnel who provide individualized treatment for cancer patients. Many of these centers also provide patients with access to innovative treatments and therapies through clinical trials.
Cancer prevention efforts in North America have also advanced, with initiatives aimed at reducing tobacco use, promoting a healthy lifestyle, and early cancer detection. The American Cancer Society has been at the forefront of cancer prevention, advocating for policies that reduce cancer risk and offer assistance to those affected by the disease.
Key Regions and Countries
North America
- US
- Canada
- Mexico
Western Europe
- Germany
- France
- The UK
- Spain
- Italy
- Portugal
- Ireland
- Austria
- Switzerland
- Benelux
- Nordic
- Rest of Western Europe
Eastern Europe
- Russia
- Poland
- The Czech Republic
- Greece
- Rest of Eastern Europe
APAC
- China
- Japan
- South Korea
- India
- Australia & New Zealand
- Indonesia
- Malaysia
- Philippines
- Singapore
- Thailand
- Vietnam
- Rest of APAC
Latin America
- Brazil
- Colombia
- Chile
- Argentina
- Costa Rica
- Rest of Latin America
Middle East & Africa
- Algeria
- Egypt
- Israel
- Kuwait
- Nigeria
- Saudi Arabia
- South Africa
- Turkey
- United Arab Emirates
- Rest of MEA
Key Players Analysis
With numerous major competitors, the Cancer Biomarkers market is expanding quickly. Numerous companies are significantly investing in research and development to advance the technology for the diagnosis and treatment of malignancies using biomarkers. There are some major players are as follows: Abbott Laboratories Inc., F. Hoffmann-La Roche AG, Merck & Co., Inc., Thermo Fisher Scientific Inc., and Bio-Rad Laboratories Inc. are some of the market's most significant key players.
Abbott Laboratories is one of the important key market players and most influential firms revolutionizing the diagnostics industry. The major market players is well-known for developing diagnostic products with accurate and reliable results, such as cancer biomarkers. The oncology division of Abbott Laboratories Inc. provides a vast array of diagnostic tests, including the Vysis ALK Break Apart FISH Probe Kit, which is used to identify ALK gene rearrangements in non-small cell lung cancer.
In the Cancer Biomarkers market, F. Hoffmann-La Roche Ltd. is an important key market player. The company designs and manufactures an extensive array of diagnostic solutions, including in vitro diagnostic tests and biomarker assays. Among its most prominent products is the EGFR mutation test tool, which allows medical professionals to identify specific types of EGFR gene mutations.
Merck & Co., Inc. has earned a reputation for producing a vast array of innovative medications, vaccines, and diagnostic products. The company's biomarker portfolio consists of a diagnostic test that measures PD-L1 protein expression levels in patients with certain forms of cancer. The level of PD-L1 expression can serve as an indicator of which patients may benefit from immunotherapy.
Thermo Fisher Scientific Inc. designs and distributes an extensive array of life sciences products for research, diagnostics, and clinical applications. The company's cancer biomarker portfolio contains a variety of tests used to diagnose and monitor specific forms of cancer, as well as monitor the efficacy of cancer treatments.
Bio-Rad Laboratories Inc. is a prominent player in the cancer biomarkers market, offering innovative diagnostic solutions and research instruments. The company provides a variety of immunoassay-based products, such as the Bio-Plex Pro Human Cancer Biomarker Panel 1, which identifies cancer biomarkers in serum, plasma, and tissue samples.
Top Key Players in Cancer Biomarkers Market
- Thermo Fisher Scientific Inc.
- Bio-Rad Laboratories, Inc.
- F. Hoffmann-La Roche Ltd.
- QIAGEN N.V.
- illumina Inc.
- Agilent Technologies Inc.
- Abbott Laboratories Inc.
- Becton, Dickinson, and Company
- Myriad Genetics, Inc.
- Sysmex Corporation
- Siemens AG
- BioMerieux SA
- Hologic, Inc.
- Epigenomics AG
- BioVision Inc.
- Meso Scale Diagnostics LLC
- Seegene Technologies Inc.
Recent Development
- In 2022, Abbott Laboratories Inc. introduced Lingo, a consumer-oriented bio wearable designed to monitor vital body signals, helping individuals gain a deeper understanding of their overall health and make improvements. This innovative device allows biohackers to access continuous data streams, eliminating the need for periodic finger-prick tests, urine samples, and breath readings.
- In 2022, OncoDNA, a genomics and prognostics company, unveiled the OncoDEEP kit. This comprehensive kit provides a streamlined workflow solution for laboratories equipped with Next-Generation Sequencing (NGS) capabilities, enabling them to conduct thorough biomarker testing, perform advanced data analysis, and assist oncologists in tailoring the most effective and personalized cancer treatments for their patients.
- In 2021, FoundationOne CDx was updated to include genomic profiling tests for solid tumors. This means that the test can now provide a more comprehensive analysis of a patient's tumor, which can help doctors make more informed treatment decisions.
- In 2020, Qiagen and NeoGenomics partnered up to develop companion diagnostic tests for cancer therapies. These tests are designed to help doctors select the most effective treatment for a patient based on the genetic makeup of their tumor.
Report Scope:
Report Features Description Market Value (2022) USD 23.9 Bn Forecast Revenue (2032) USD 67.1 Bn CAGR (2023-2032) 11.2% Base Year for Estimation 2022 Historic Period 2016-2022 Forecast Period 2023-2032 Report Coverage Revenue Forecast, Market Dynamics, COVID-19 Impact, Competitive Landscape, Recent Developments Segments Covered By Type (Protein Biomarker, Genetic Biomarker, Others (cell, viral, and carbohydrate biomarkers))
By Tumor Type (Breast Cancer, Lung Cancer, Colorectal Cancer, Melanoma, Leukemia, Others), By Technology (Omics, Imaging, Immunoassays, Cytogenetics, Bioinformatics), Application (Drug discovery and Development, Diagnostics, Personalized medicine, Others)Regional Analysis North America – The US, Canada, & Mexico; Western Europe – Germany, France, The UK, Spain, Italy, Portugal, Ireland, Austria, Switzerland, Benelux, Nordic, & Rest of Western Europe; Eastern Europe – Russia, Poland, The Czech Republic, Greece, & Rest of Eastern Europe; APAC – China, Japan, South Korea, India, Australia & New Zealand, Indonesia, Malaysia, Philippines, Singapore, Thailand, Vietnam, & Rest of APAC; Latin America – Brazil, Colombia, Chile, Argentina, Costa Rica, & Rest of Latin America; Middle East & Africa – Algeria, Egypt, Israel, Kuwait, Nigeria, Saudi Arabia, South Africa, Turkey, United Arab Emirates, & Rest of MEA Competitive Landscape Thermo Fisher Scientific Inc., Bio-Rad Laboratories, Inc., F. Hoffmann-La Roche Ltd., QIAGEN N.V., illumina Inc., Agilent Technologies Inc., Abbott Laboratories Inc., Becton, Dickinson and Company, Myriad Genetics, Inc., Sysmex Corporation, Siemens AG, BioMerieux SA, Hologic Inc., Epigenomics AG, BioVision Inc., Meso Scale Diagnostics LLC, Seegene Technologies Inc. Customization Scope Customization for segments, region/country-level will be provided. Moreover, additional customization can be done based on the requirements. Purchase Options We have three licenses to opt for: Single User License, Multi-User License (Up to 5 Users), Corporate Use License (Unlimited User and Printable PDF) -
- 1. Executive Summary
- 1.1. Definition
- 1.2. Taxonomy
- 1.3. Research Scope
- 1.4. Key Analysis
- 1.5. Key Findings by Major Segments
- 1.6. Top strategies by Major Players
- 2. Global Cancer Biomarkers Market Overview
- 2.1. Cancer Biomarkers Market Dynamics
- 2.1.1. Drivers
- 2.1.2. Opportunities
- 2.1.3. Restraints
- 2.1.4. Challenges
- 2.2. Macro-economic Factors
- 2.3. Regulatory Framework
- 2.4. Market Investment Feasibility Index
- 2.5. PEST Analysis
- 2.6. PORTER’S Five Force Analysis
- 2.7. Drivers & Restraints Impact Analysis
- 2.8. Industry Chain Analysis
- 2.9. Cost Structure Analysis
- 2.10. Marketing Strategy
- 2.11. Russia-Ukraine War Impact Analysis
- 2.12. Opportunity Map Analysis
- 2.13. Market Competition Scenario Analysis
- 2.14. Product Life Cycle Analysis
- 2.15. Opportunity Orbits
- 2.16. Manufacturer Intensity Map
- 2.17. Major Companies sales by Value & Volume
- 2.1. Cancer Biomarkers Market Dynamics
- 3. Global Cancer Biomarkers Market Analysis, Opportunity and Forecast, 2016-2032
- 3.1. Global Cancer Biomarkers Market Analysis, 2016-2021
- 3.2. Global Cancer Biomarkers Market Opportunity and Forecast, 2023-2032
- 3.3. Global Cancer Biomarkers Market Analysis, Opportunity and Forecast, By By Type, 2016-2032
- 3.3.1. Global Cancer Biomarkers Market Analysis by By Type: Introduction
- 3.3.2. Market Size Absolute $ Opportunity Analysis and Forecast, By By Type, 2016-2032
- 3.3.3. Protein Biomarker
- 3.3.4. Genetic Biomarker
- 3.3.5. Others (cell, viral, and carbohydrate biomarkers)
- 3.4. Global Cancer Biomarkers Market Analysis, Opportunity and Forecast, By By Tumor Type, 2016-2032
- 3.4.1. Global Cancer Biomarkers Market Analysis by By Tumor Type: Introduction
- 3.4.2. Market Size Absolute $ Opportunity Analysis and Forecast, By By Tumor Type, 2016-2032
- 3.4.3. Breast Cancer
- 3.4.4. Lung Cancer
- 3.4.5. Colorectal Cancer
- 3.4.6. Melanoma
- 3.4.7. Leukemia
- 3.4.8. Others
- 3.5. Global Cancer Biomarkers Market Analysis, Opportunity and Forecast, By By Technology, 2016-2032
- 3.5.1. Global Cancer Biomarkers Market Analysis by By Technology: Introduction
- 3.5.2. Market Size Absolute $ Opportunity Analysis and Forecast, By By Technology, 2016-2032
- 3.5.3. Omics
- 3.5.4. Imaging
- 3.5.5. Immunoassays
- 3.5.6. Cytogenetics
- 3.5.7. Bioinformatics
- 3.6. Global Cancer Biomarkers Market Analysis, Opportunity and Forecast, By By Application, 2016-2032
- 3.6.1. Global Cancer Biomarkers Market Analysis by By Application: Introduction
- 3.6.2. Market Size Absolute $ Opportunity Analysis and Forecast, By By Application, 2016-2032
- 3.6.3. Drug discovery and Development
- 3.6.4. Diagnostics
- 3.6.5. Personalized medicine
- 3.6.6. Others
- 4. North America Cancer Biomarkers Market Analysis, Opportunity and Forecast, 2016-2032
- 4.1. North America Cancer Biomarkers Market Analysis, 2016-2021
- 4.2. North America Cancer Biomarkers Market Opportunity and Forecast, 2023-2032
- 4.3. North America Cancer Biomarkers Market Analysis, Opportunity and Forecast, By By Type, 2016-2032
- 4.3.1. North America Cancer Biomarkers Market Analysis by By Type: Introduction
- 4.3.2. Market Size Absolute $ Opportunity Analysis and Forecast, By By Type, 2016-2032
- 4.3.3. Protein Biomarker
- 4.3.4. Genetic Biomarker
- 4.3.5. Others (cell, viral, and carbohydrate biomarkers)
- 4.4. North America Cancer Biomarkers Market Analysis, Opportunity and Forecast, By By Tumor Type, 2016-2032
- 4.4.1. North America Cancer Biomarkers Market Analysis by By Tumor Type: Introduction
- 4.4.2. Market Size Absolute $ Opportunity Analysis and Forecast, By By Tumor Type, 2016-2032
- 4.4.3. Breast Cancer
- 4.4.4. Lung Cancer
- 4.4.5. Colorectal Cancer
- 4.4.6. Melanoma
- 4.4.7. Leukemia
- 4.4.8. Others
- 4.5. North America Cancer Biomarkers Market Analysis, Opportunity and Forecast, By By Technology, 2016-2032
- 4.5.1. North America Cancer Biomarkers Market Analysis by By Technology: Introduction
- 4.5.2. Market Size Absolute $ Opportunity Analysis and Forecast, By By Technology, 2016-2032
- 4.5.3. Omics
- 4.5.4. Imaging
- 4.5.5. Immunoassays
- 4.5.6. Cytogenetics
- 4.5.7. Bioinformatics
- 4.6. North America Cancer Biomarkers Market Analysis, Opportunity and Forecast, By By Application, 2016-2032
- 4.6.1. North America Cancer Biomarkers Market Analysis by By Application: Introduction
- 4.6.2. Market Size Absolute $ Opportunity Analysis and Forecast, By By Application, 2016-2032
- 4.6.3. Drug discovery and Development
- 4.6.4. Diagnostics
- 4.6.5. Personalized medicine
- 4.6.6. Others
- 4.7. North America Cancer Biomarkers Market Analysis, Opportunity and Forecast, By Country , 2016-2032
- 4.7.1. North America Cancer Biomarkers Market Analysis by Country : Introduction
- 4.7.2. Market Size Absolute $ Opportunity Analysis and Forecast, Country , 2016-2032
- 4.7.2.1. The US
- 4.7.2.2. Canada
- 4.7.2.3. Mexico
- 5. Western Europe Cancer Biomarkers Market Analysis, Opportunity and Forecast, 2016-2032
- 5.1. Western Europe Cancer Biomarkers Market Analysis, 2016-2021
- 5.2. Western Europe Cancer Biomarkers Market Opportunity and Forecast, 2023-2032
- 5.3. Western Europe Cancer Biomarkers Market Analysis, Opportunity and Forecast, By By Type, 2016-2032
- 5.3.1. Western Europe Cancer Biomarkers Market Analysis by By Type: Introduction
- 5.3.2. Market Size Absolute $ Opportunity Analysis and Forecast, By By Type, 2016-2032
- 5.3.3. Protein Biomarker
- 5.3.4. Genetic Biomarker
- 5.3.5. Others (cell, viral, and carbohydrate biomarkers)
- 5.4. Western Europe Cancer Biomarkers Market Analysis, Opportunity and Forecast, By By Tumor Type, 2016-2032
- 5.4.1. Western Europe Cancer Biomarkers Market Analysis by By Tumor Type: Introduction
- 5.4.2. Market Size Absolute $ Opportunity Analysis and Forecast, By By Tumor Type, 2016-2032
- 5.4.3. Breast Cancer
- 5.4.4. Lung Cancer
- 5.4.5. Colorectal Cancer
- 5.4.6. Melanoma
- 5.4.7. Leukemia
- 5.4.8. Others
- 5.5. Western Europe Cancer Biomarkers Market Analysis, Opportunity and Forecast, By By Technology, 2016-2032
- 5.5.1. Western Europe Cancer Biomarkers Market Analysis by By Technology: Introduction
- 5.5.2. Market Size Absolute $ Opportunity Analysis and Forecast, By By Technology, 2016-2032
- 5.5.3. Omics
- 5.5.4. Imaging
- 5.5.5. Immunoassays
- 5.5.6. Cytogenetics
- 5.5.7. Bioinformatics
- 5.6. Western Europe Cancer Biomarkers Market Analysis, Opportunity and Forecast, By By Application, 2016-2032
- 5.6.1. Western Europe Cancer Biomarkers Market Analysis by By Application: Introduction
- 5.6.2. Market Size Absolute $ Opportunity Analysis and Forecast, By By Application, 2016-2032
- 5.6.3. Drug discovery and Development
- 5.6.4. Diagnostics
- 5.6.5. Personalized medicine
- 5.6.6. Others
- 5.7. Western Europe Cancer Biomarkers Market Analysis, Opportunity and Forecast, By Country , 2016-2032
- 5.7.1. Western Europe Cancer Biomarkers Market Analysis by Country : Introduction
- 5.7.2. Market Size Absolute $ Opportunity Analysis and Forecast, Country , 2016-2032
- 5.7.2.1. Germany
- 5.7.2.2. France
- 5.7.2.3. The UK
- 5.7.2.4. Spain
- 5.7.2.5. Italy
- 5.7.2.6. Portugal
- 5.7.2.7. Ireland
- 5.7.2.8. Austria
- 5.7.2.9. Switzerland
- 5.7.2.10. Benelux
- 5.7.2.11. Nordic
- 5.7.2.12. Rest of Western Europe
- 6. Eastern Europe Cancer Biomarkers Market Analysis, Opportunity and Forecast, 2016-2032
- 6.1. Eastern Europe Cancer Biomarkers Market Analysis, 2016-2021
- 6.2. Eastern Europe Cancer Biomarkers Market Opportunity and Forecast, 2023-2032
- 6.3. Eastern Europe Cancer Biomarkers Market Analysis, Opportunity and Forecast, By By Type, 2016-2032
- 6.3.1. Eastern Europe Cancer Biomarkers Market Analysis by By Type: Introduction
- 6.3.2. Market Size Absolute $ Opportunity Analysis and Forecast, By By Type, 2016-2032
- 6.3.3. Protein Biomarker
- 6.3.4. Genetic Biomarker
- 6.3.5. Others (cell, viral, and carbohydrate biomarkers)
- 6.4. Eastern Europe Cancer Biomarkers Market Analysis, Opportunity and Forecast, By By Tumor Type, 2016-2032
- 6.4.1. Eastern Europe Cancer Biomarkers Market Analysis by By Tumor Type: Introduction
- 6.4.2. Market Size Absolute $ Opportunity Analysis and Forecast, By By Tumor Type, 2016-2032
- 6.4.3. Breast Cancer
- 6.4.4. Lung Cancer
- 6.4.5. Colorectal Cancer
- 6.4.6. Melanoma
- 6.4.7. Leukemia
- 6.4.8. Others
- 6.5. Eastern Europe Cancer Biomarkers Market Analysis, Opportunity and Forecast, By By Technology, 2016-2032
- 6.5.1. Eastern Europe Cancer Biomarkers Market Analysis by By Technology: Introduction
- 6.5.2. Market Size Absolute $ Opportunity Analysis and Forecast, By By Technology, 2016-2032
- 6.5.3. Omics
- 6.5.4. Imaging
- 6.5.5. Immunoassays
- 6.5.6. Cytogenetics
- 6.5.7. Bioinformatics
- 6.6. Eastern Europe Cancer Biomarkers Market Analysis, Opportunity and Forecast, By By Application, 2016-2032
- 6.6.1. Eastern Europe Cancer Biomarkers Market Analysis by By Application: Introduction
- 6.6.2. Market Size Absolute $ Opportunity Analysis and Forecast, By By Application, 2016-2032
- 6.6.3. Drug discovery and Development
- 6.6.4. Diagnostics
- 6.6.5. Personalized medicine
- 6.6.6. Others
- 6.7. Eastern Europe Cancer Biomarkers Market Analysis, Opportunity and Forecast, By Country , 2016-2032
- 6.7.1. Eastern Europe Cancer Biomarkers Market Analysis by Country : Introduction
- 6.7.2. Market Size Absolute $ Opportunity Analysis and Forecast, Country , 2016-2032
- 6.7.2.1. Russia
- 6.7.2.2. Poland
- 6.7.2.3. The Czech Republic
- 6.7.2.4. Greece
- 6.7.2.5. Rest of Eastern Europe
- 7. APAC Cancer Biomarkers Market Analysis, Opportunity and Forecast, 2016-2032
- 7.1. APAC Cancer Biomarkers Market Analysis, 2016-2021
- 7.2. APAC Cancer Biomarkers Market Opportunity and Forecast, 2023-2032
- 7.3. APAC Cancer Biomarkers Market Analysis, Opportunity and Forecast, By By Type, 2016-2032
- 7.3.1. APAC Cancer Biomarkers Market Analysis by By Type: Introduction
- 7.3.2. Market Size Absolute $ Opportunity Analysis and Forecast, By By Type, 2016-2032
- 7.3.3. Protein Biomarker
- 7.3.4. Genetic Biomarker
- 7.3.5. Others (cell, viral, and carbohydrate biomarkers)
- 7.4. APAC Cancer Biomarkers Market Analysis, Opportunity and Forecast, By By Tumor Type, 2016-2032
- 7.4.1. APAC Cancer Biomarkers Market Analysis by By Tumor Type: Introduction
- 7.4.2. Market Size Absolute $ Opportunity Analysis and Forecast, By By Tumor Type, 2016-2032
- 7.4.3. Breast Cancer
- 7.4.4. Lung Cancer
- 7.4.5. Colorectal Cancer
- 7.4.6. Melanoma
- 7.4.7. Leukemia
- 7.4.8. Others
- 7.5. APAC Cancer Biomarkers Market Analysis, Opportunity and Forecast, By By Technology, 2016-2032
- 7.5.1. APAC Cancer Biomarkers Market Analysis by By Technology: Introduction
- 7.5.2. Market Size Absolute $ Opportunity Analysis and Forecast, By By Technology, 2016-2032
- 7.5.3. Omics
- 7.5.4. Imaging
- 7.5.5. Immunoassays
- 7.5.6. Cytogenetics
- 7.5.7. Bioinformatics
- 7.6. APAC Cancer Biomarkers Market Analysis, Opportunity and Forecast, By By Application, 2016-2032
- 7.6.1. APAC Cancer Biomarkers Market Analysis by By Application: Introduction
- 7.6.2. Market Size Absolute $ Opportunity Analysis and Forecast, By By Application, 2016-2032
- 7.6.3. Drug discovery and Development
- 7.6.4. Diagnostics
- 7.6.5. Personalized medicine
- 7.6.6. Others
- 7.7. APAC Cancer Biomarkers Market Analysis, Opportunity and Forecast, By Country , 2016-2032
- 7.7.1. APAC Cancer Biomarkers Market Analysis by Country : Introduction
- 7.7.2. Market Size Absolute $ Opportunity Analysis and Forecast, Country , 2016-2032
- 7.7.2.1. China
- 7.7.2.2. Japan
- 7.7.2.3. South Korea
- 7.7.2.4. India
- 7.7.2.5. Australia & New Zeland
- 7.7.2.6. Indonesia
- 7.7.2.7. Malaysia
- 7.7.2.8. Philippines
- 7.7.2.9. Singapore
- 7.7.2.10. Thailand
- 7.7.2.11. Vietnam
- 7.7.2.12. Rest of APAC
- 8. Latin America Cancer Biomarkers Market Analysis, Opportunity and Forecast, 2016-2032
- 8.1. Latin America Cancer Biomarkers Market Analysis, 2016-2021
- 8.2. Latin America Cancer Biomarkers Market Opportunity and Forecast, 2023-2032
- 8.3. Latin America Cancer Biomarkers Market Analysis, Opportunity and Forecast, By By Type, 2016-2032
- 8.3.1. Latin America Cancer Biomarkers Market Analysis by By Type: Introduction
- 8.3.2. Market Size Absolute $ Opportunity Analysis and Forecast, By By Type, 2016-2032
- 8.3.3. Protein Biomarker
- 8.3.4. Genetic Biomarker
- 8.3.5. Others (cell, viral, and carbohydrate biomarkers)
- 8.4. Latin America Cancer Biomarkers Market Analysis, Opportunity and Forecast, By By Tumor Type, 2016-2032
- 8.4.1. Latin America Cancer Biomarkers Market Analysis by By Tumor Type: Introduction
- 8.4.2. Market Size Absolute $ Opportunity Analysis and Forecast, By By Tumor Type, 2016-2032
- 8.4.3. Breast Cancer
- 8.4.4. Lung Cancer
- 8.4.5. Colorectal Cancer
- 8.4.6. Melanoma
- 8.4.7. Leukemia
- 8.4.8. Others
- 8.5. Latin America Cancer Biomarkers Market Analysis, Opportunity and Forecast, By By Technology, 2016-2032
- 8.5.1. Latin America Cancer Biomarkers Market Analysis by By Technology: Introduction
- 8.5.2. Market Size Absolute $ Opportunity Analysis and Forecast, By By Technology, 2016-2032
- 8.5.3. Omics
- 8.5.4. Imaging
- 8.5.5. Immunoassays
- 8.5.6. Cytogenetics
- 8.5.7. Bioinformatics
- 8.6. Latin America Cancer Biomarkers Market Analysis, Opportunity and Forecast, By By Application, 2016-2032
- 8.6.1. Latin America Cancer Biomarkers Market Analysis by By Application: Introduction
- 8.6.2. Market Size Absolute $ Opportunity Analysis and Forecast, By By Application, 2016-2032
- 8.6.3. Drug discovery and Development
- 8.6.4. Diagnostics
- 8.6.5. Personalized medicine
- 8.6.6. Others
- 8.7. Latin America Cancer Biomarkers Market Analysis, Opportunity and Forecast, By Country , 2016-2032
- 8.7.1. Latin America Cancer Biomarkers Market Analysis by Country : Introduction
- 8.7.2. Market Size Absolute $ Opportunity Analysis and Forecast, Country , 2016-2032
- 8.7.2.1. Brazil
- 8.7.2.2. Colombia
- 8.7.2.3. Chile
- 8.7.2.4. Argentina
- 8.7.2.5. Costa Rica
- 8.7.2.6. Rest of Latin America
- 9. Middle East & Africa Cancer Biomarkers Market Analysis, Opportunity and Forecast, 2016-2032
- 9.1. Middle East & Africa Cancer Biomarkers Market Analysis, 2016-2021
- 9.2. Middle East & Africa Cancer Biomarkers Market Opportunity and Forecast, 2023-2032
- 9.3. Middle East & Africa Cancer Biomarkers Market Analysis, Opportunity and Forecast, By By Type, 2016-2032
- 9.3.1. Middle East & Africa Cancer Biomarkers Market Analysis by By Type: Introduction
- 9.3.2. Market Size Absolute $ Opportunity Analysis and Forecast, By By Type, 2016-2032
- 9.3.3. Protein Biomarker
- 9.3.4. Genetic Biomarker
- 9.3.5. Others (cell, viral, and carbohydrate biomarkers)
- 9.4. Middle East & Africa Cancer Biomarkers Market Analysis, Opportunity and Forecast, By By Tumor Type, 2016-2032
- 9.4.1. Middle East & Africa Cancer Biomarkers Market Analysis by By Tumor Type: Introduction
- 9.4.2. Market Size Absolute $ Opportunity Analysis and Forecast, By By Tumor Type, 2016-2032
- 9.4.3. Breast Cancer
- 9.4.4. Lung Cancer
- 9.4.5. Colorectal Cancer
- 9.4.6. Melanoma
- 9.4.7. Leukemia
- 9.4.8. Others
- 9.5. Middle East & Africa Cancer Biomarkers Market Analysis, Opportunity and Forecast, By By Technology, 2016-2032
- 9.5.1. Middle East & Africa Cancer Biomarkers Market Analysis by By Technology: Introduction
- 9.5.2. Market Size Absolute $ Opportunity Analysis and Forecast, By By Technology, 2016-2032
- 9.5.3. Omics
- 9.5.4. Imaging
- 9.5.5. Immunoassays
- 9.5.6. Cytogenetics
- 9.5.7. Bioinformatics
- 9.6. Middle East & Africa Cancer Biomarkers Market Analysis, Opportunity and Forecast, By By Application, 2016-2032
- 9.6.1. Middle East & Africa Cancer Biomarkers Market Analysis by By Application: Introduction
- 9.6.2. Market Size Absolute $ Opportunity Analysis and Forecast, By By Application, 2016-2032
- 9.6.3. Drug discovery and Development
- 9.6.4. Diagnostics
- 9.6.5. Personalized medicine
- 9.6.6. Others
- 9.7. Middle East & Africa Cancer Biomarkers Market Analysis, Opportunity and Forecast, By Country , 2016-2032
- 9.7.1. Middle East & Africa Cancer Biomarkers Market Analysis by Country : Introduction
- 9.7.2. Market Size Absolute $ Opportunity Analysis and Forecast, Country , 2016-2032
- 9.7.2.1. Algeria
- 9.7.2.2. Egypt
- 9.7.2.3. Israel
- 9.7.2.4. Kuwait
- 9.7.2.5. Nigeria
- 9.7.2.6. Saudi Arabia
- 9.7.2.7. South Africa
- 9.7.2.8. Turkey
- 9.7.2.9. The UAE
- 9.7.2.10. Rest of MEA
- 10. Global Cancer Biomarkers Market Analysis, Opportunity and Forecast, By Region , 2016-2032
- 10.1. Global Cancer Biomarkers Market Analysis by Region : Introduction
- 10.2. Market Size Absolute $ Opportunity Analysis and Forecast, By Region , 2016-2032
- 10.2.1. North America
- 10.2.2. Western Europe
- 10.2.3. Eastern Europe
- 10.2.4. APAC
- 10.2.5. Latin America
- 10.2.6. Middle East & Africa
- 11. Global Cancer Biomarkers Market Competitive Landscape, Market Share Analysis, and Company Profiles
- 11.1. Market Share Analysis
- 11.2. Company Profiles
- 11.3. DeLaval Inc.
- 11.3.1. Company Overview
- 11.3.2. Financial Highlights
- 11.3.3. Product Portfolio
- 11.3.4. SWOT Analysis
- 11.3.5. Key Strategies and Developments
- 11.4. Autonomous Solutions, Inc.
- 11.4.1. Company Overview
- 11.4.2. Financial Highlights
- 11.4.3. Product Portfolio
- 11.4.4. SWOT Analysis
- 11.4.5. Key Strategies and Developments
- 11.5. Agco Corporation
- 11.5.1. Company Overview
- 11.5.2. Financial Highlights
- 11.5.3. Product Portfolio
- 11.5.4. SWOT Analysis
- 11.5.5. Key Strategies and Developments
- 11.6. GEA Group
- 11.6.1. Company Overview
- 11.6.2. Financial Highlights
- 11.6.3. Product Portfolio
- 11.6.4. SWOT Analysis
- 11.6.5. Key Strategies and Developments
- 11.7. Harvest Automation, Inc.
- 11.7.1. Company Overview
- 11.7.2. Financial Highlights
- 11.7.3. Product Portfolio
- 11.7.4. SWOT Analysis
- 11.7.5. Key Strategies and Developments
- 11.8. Topcon Positioning Systems, Inc.
- 11.8.1. Company Overview
- 11.8.2. Financial Highlights
- 11.8.3. Product Portfolio
- 11.8.4. SWOT Analysis
- 11.8.5. Key Strategies and Developments
- 11.9. Blue River Technology
- 11.9.1. Company Overview
- 11.9.2. Financial Highlights
- 11.9.3. Product Portfolio
- 11.9.4. SWOT Analysis
- 11.9.5. Key Strategies and Developments
- 11.10. AGROBOT-Soluciones Robóticas Agrícolas SL
- 11.10.1. Company Overview
- 11.10.2. Financial Highlights
- 11.10.3. Product Portfolio
- 11.10.4. SWOT Analysis
- 11.10.5. Key Strategies and Developments
- 11.11. Harvest Automation
- 11.11.1. Company Overview
- 11.11.2. Financial Highlights
- 11.11.3. Product Portfolio
- 11.11.4. SWOT Analysis
- 11.11.5. Key Strategies and Developments
- 11.12. Lely Holding S.À.R.L
- 11.12.1. Company Overview
- 11.12.2. Financial Highlights
- 11.12.3. Product Portfolio
- 11.12.4. SWOT Analysis
- 11.12.5. Key Strategies and Developments
- 12. Assumptions and Acronyms
- 13. Research Methodology
- 14. Contact
- List of Figures
- Figure 1: Global Cancer Biomarkers Market Revenue (US$ Mn) Market Share by By Type in 2022
- Figure 2: Global Cancer Biomarkers Market Attractiveness Analysis by By Type, 2016-2032
- Figure 3: Global Cancer Biomarkers Market Revenue (US$ Mn) Market Share by By Tumor Typein 2022
- Figure 4: Global Cancer Biomarkers Market Attractiveness Analysis by By Tumor Type, 2016-2032
- Figure 5: Global Cancer Biomarkers Market Revenue (US$ Mn) Market Share by By Technologyin 2022
- Figure 6: Global Cancer Biomarkers Market Attractiveness Analysis by By Technology, 2016-2032
- Figure 7: Global Cancer Biomarkers Market Revenue (US$ Mn) Market Share by By Applicationin 2022
- Figure 8: Global Cancer Biomarkers Market Attractiveness Analysis by By Application, 2016-2032
- Figure 9: Global Cancer Biomarkers Market Revenue (US$ Mn) Market Share by Region in 2022
- Figure 10: Global Cancer Biomarkers Market Attractiveness Analysis by Region, 2016-2032
- Figure 11: Global Cancer Biomarkers Market Revenue (US$ Mn) (2016-2032)
- Figure 12: Global Cancer Biomarkers Market Revenue (US$ Mn) Comparison by Region (2016-2032)
- Figure 13: Global Cancer Biomarkers Market Revenue (US$ Mn) Comparison by By Type (2016-2032)
- Figure 14: Global Cancer Biomarkers Market Revenue (US$ Mn) Comparison by By Tumor Type (2016-2032)
- Figure 15: Global Cancer Biomarkers Market Revenue (US$ Mn) Comparison by By Technology (2016-2032)
- Figure 16: Global Cancer Biomarkers Market Revenue (US$ Mn) Comparison by By Application (2016-2032)
- Figure 17: Global Cancer Biomarkers Market Y-o-Y Growth Rate Comparison by Region (2016-2032)
- Figure 18: Global Cancer Biomarkers Market Y-o-Y Growth Rate Comparison by By Type (2016-2032)
- Figure 19: Global Cancer Biomarkers Market Y-o-Y Growth Rate Comparison by By Tumor Type (2016-2032)
- Figure 20: Global Cancer Biomarkers Market Y-o-Y Growth Rate Comparison by By Technology (2016-2032)
- Figure 21: Global Cancer Biomarkers Market Y-o-Y Growth Rate Comparison by By Application (2016-2032)
- Figure 22: Global Cancer Biomarkers Market Share Comparison by Region (2016-2032)
- Figure 23: Global Cancer Biomarkers Market Share Comparison by By Type (2016-2032)
- Figure 24: Global Cancer Biomarkers Market Share Comparison by By Tumor Type (2016-2032)
- Figure 25: Global Cancer Biomarkers Market Share Comparison by By Technology (2016-2032)
- Figure 26: Global Cancer Biomarkers Market Share Comparison by By Application (2016-2032)
- Figure 27: North America Cancer Biomarkers Market Revenue (US$ Mn) Market Share by By Typein 2022
- Figure 28: North America Cancer Biomarkers Market Attractiveness Analysis by By Type, 2016-2032
- Figure 29: North America Cancer Biomarkers Market Revenue (US$ Mn) Market Share by By Tumor Typein 2022
- Figure 30: North America Cancer Biomarkers Market Attractiveness Analysis by By Tumor Type, 2016-2032
- Figure 31: North America Cancer Biomarkers Market Revenue (US$ Mn) Market Share by By Technologyin 2022
- Figure 32: North America Cancer Biomarkers Market Attractiveness Analysis by By Technology, 2016-2032
- Figure 33: North America Cancer Biomarkers Market Revenue (US$ Mn) Market Share by By Applicationin 2022
- Figure 34: North America Cancer Biomarkers Market Attractiveness Analysis by By Application, 2016-2032
- Figure 35: North America Cancer Biomarkers Market Revenue (US$ Mn) Market Share by Country in 2022
- Figure 36: North America Cancer Biomarkers Market Attractiveness Analysis by Country, 2016-2032
- Figure 37: North America Cancer Biomarkers Market Revenue (US$ Mn) (2016-2032)
- Figure 38: North America Cancer Biomarkers Market Revenue (US$ Mn) Comparison by Country (2016-2032)
- Figure 39: North America Cancer Biomarkers Market Revenue (US$ Mn) Comparison by By Type (2016-2032)
- Figure 40: North America Cancer Biomarkers Market Revenue (US$ Mn) Comparison by By Tumor Type (2016-2032)
- Figure 41: North America Cancer Biomarkers Market Revenue (US$ Mn) Comparison by By Technology (2016-2032)
- Figure 42: North America Cancer Biomarkers Market Revenue (US$ Mn) Comparison by By Application (2016-2032)
- Figure 43: North America Cancer Biomarkers Market Y-o-Y Growth Rate Comparison by Country (2016-2032)
- Figure 44: North America Cancer Biomarkers Market Y-o-Y Growth Rate Comparison by By Type (2016-2032)
- Figure 45: North America Cancer Biomarkers Market Y-o-Y Growth Rate Comparison by By Tumor Type (2016-2032)
- Figure 46: North America Cancer Biomarkers Market Y-o-Y Growth Rate Comparison by By Technology (2016-2032)
- Figure 47: North America Cancer Biomarkers Market Y-o-Y Growth Rate Comparison by By Application (2016-2032)
- Figure 48: North America Cancer Biomarkers Market Share Comparison by Country (2016-2032)
- Figure 49: North America Cancer Biomarkers Market Share Comparison by By Type (2016-2032)
- Figure 50: North America Cancer Biomarkers Market Share Comparison by By Tumor Type (2016-2032)
- Figure 51: North America Cancer Biomarkers Market Share Comparison by By Technology (2016-2032)
- Figure 52: North America Cancer Biomarkers Market Share Comparison by By Application (2016-2032)
- Figure 53: Western Europe Cancer Biomarkers Market Revenue (US$ Mn) Market Share by By Typein 2022
- Figure 54: Western Europe Cancer Biomarkers Market Attractiveness Analysis by By Type, 2016-2032
- Figure 55: Western Europe Cancer Biomarkers Market Revenue (US$ Mn) Market Share by By Tumor Typein 2022
- Figure 56: Western Europe Cancer Biomarkers Market Attractiveness Analysis by By Tumor Type, 2016-2032
- Figure 57: Western Europe Cancer Biomarkers Market Revenue (US$ Mn) Market Share by By Technologyin 2022
- Figure 58: Western Europe Cancer Biomarkers Market Attractiveness Analysis by By Technology, 2016-2032
- Figure 59: Western Europe Cancer Biomarkers Market Revenue (US$ Mn) Market Share by By Applicationin 2022
- Figure 60: Western Europe Cancer Biomarkers Market Attractiveness Analysis by By Application, 2016-2032
- Figure 61: Western Europe Cancer Biomarkers Market Revenue (US$ Mn) Market Share by Country in 2022
- Figure 62: Western Europe Cancer Biomarkers Market Attractiveness Analysis by Country, 2016-2032
- Figure 63: Western Europe Cancer Biomarkers Market Revenue (US$ Mn) (2016-2032)
- Figure 64: Western Europe Cancer Biomarkers Market Revenue (US$ Mn) Comparison by Country (2016-2032)
- Figure 65: Western Europe Cancer Biomarkers Market Revenue (US$ Mn) Comparison by By Type (2016-2032)
- Figure 66: Western Europe Cancer Biomarkers Market Revenue (US$ Mn) Comparison by By Tumor Type (2016-2032)
- Figure 67: Western Europe Cancer Biomarkers Market Revenue (US$ Mn) Comparison by By Technology (2016-2032)
- Figure 68: Western Europe Cancer Biomarkers Market Revenue (US$ Mn) Comparison by By Application (2016-2032)
- Figure 69: Western Europe Cancer Biomarkers Market Y-o-Y Growth Rate Comparison by Country (2016-2032)
- Figure 70: Western Europe Cancer Biomarkers Market Y-o-Y Growth Rate Comparison by By Type (2016-2032)
- Figure 71: Western Europe Cancer Biomarkers Market Y-o-Y Growth Rate Comparison by By Tumor Type (2016-2032)
- Figure 72: Western Europe Cancer Biomarkers Market Y-o-Y Growth Rate Comparison by By Technology (2016-2032)
- Figure 73: Western Europe Cancer Biomarkers Market Y-o-Y Growth Rate Comparison by By Application (2016-2032)
- Figure 74: Western Europe Cancer Biomarkers Market Share Comparison by Country (2016-2032)
- Figure 75: Western Europe Cancer Biomarkers Market Share Comparison by By Type (2016-2032)
- Figure 76: Western Europe Cancer Biomarkers Market Share Comparison by By Tumor Type (2016-2032)
- Figure 77: Western Europe Cancer Biomarkers Market Share Comparison by By Technology (2016-2032)
- Figure 78: Western Europe Cancer Biomarkers Market Share Comparison by By Application (2016-2032)
- Figure 79: Eastern Europe Cancer Biomarkers Market Revenue (US$ Mn) Market Share by By Typein 2022
- Figure 80: Eastern Europe Cancer Biomarkers Market Attractiveness Analysis by By Type, 2016-2032
- Figure 81: Eastern Europe Cancer Biomarkers Market Revenue (US$ Mn) Market Share by By Tumor Typein 2022
- Figure 82: Eastern Europe Cancer Biomarkers Market Attractiveness Analysis by By Tumor Type, 2016-2032
- Figure 83: Eastern Europe Cancer Biomarkers Market Revenue (US$ Mn) Market Share by By Technologyin 2022
- Figure 84: Eastern Europe Cancer Biomarkers Market Attractiveness Analysis by By Technology, 2016-2032
- Figure 85: Eastern Europe Cancer Biomarkers Market Revenue (US$ Mn) Market Share by By Applicationin 2022
- Figure 86: Eastern Europe Cancer Biomarkers Market Attractiveness Analysis by By Application, 2016-2032
- Figure 87: Eastern Europe Cancer Biomarkers Market Revenue (US$ Mn) Market Share by Country in 2022
- Figure 88: Eastern Europe Cancer Biomarkers Market Attractiveness Analysis by Country, 2016-2032
- Figure 89: Eastern Europe Cancer Biomarkers Market Revenue (US$ Mn) (2016-2032)
- Figure 90: Eastern Europe Cancer Biomarkers Market Revenue (US$ Mn) Comparison by Country (2016-2032)
- Figure 91: Eastern Europe Cancer Biomarkers Market Revenue (US$ Mn) Comparison by By Type (2016-2032)
- Figure 92: Eastern Europe Cancer Biomarkers Market Revenue (US$ Mn) Comparison by By Tumor Type (2016-2032)
- Figure 93: Eastern Europe Cancer Biomarkers Market Revenue (US$ Mn) Comparison by By Technology (2016-2032)
- Figure 94: Eastern Europe Cancer Biomarkers Market Revenue (US$ Mn) Comparison by By Application (2016-2032)
- Figure 95: Eastern Europe Cancer Biomarkers Market Y-o-Y Growth Rate Comparison by Country (2016-2032)
- Figure 96: Eastern Europe Cancer Biomarkers Market Y-o-Y Growth Rate Comparison by By Type (2016-2032)
- Figure 97: Eastern Europe Cancer Biomarkers Market Y-o-Y Growth Rate Comparison by By Tumor Type (2016-2032)
- Figure 98: Eastern Europe Cancer Biomarkers Market Y-o-Y Growth Rate Comparison by By Technology (2016-2032)
- Figure 99: Eastern Europe Cancer Biomarkers Market Y-o-Y Growth Rate Comparison by By Application (2016-2032)
- Figure 100: Eastern Europe Cancer Biomarkers Market Share Comparison by Country (2016-2032)
- Figure 101: Eastern Europe Cancer Biomarkers Market Share Comparison by By Type (2016-2032)
- Figure 102: Eastern Europe Cancer Biomarkers Market Share Comparison by By Tumor Type (2016-2032)
- Figure 103: Eastern Europe Cancer Biomarkers Market Share Comparison by By Technology (2016-2032)
- Figure 104: Eastern Europe Cancer Biomarkers Market Share Comparison by By Application (2016-2032)
- Figure 105: APAC Cancer Biomarkers Market Revenue (US$ Mn) Market Share by By Typein 2022
- Figure 106: APAC Cancer Biomarkers Market Attractiveness Analysis by By Type, 2016-2032
- Figure 107: APAC Cancer Biomarkers Market Revenue (US$ Mn) Market Share by By Tumor Typein 2022
- Figure 108: APAC Cancer Biomarkers Market Attractiveness Analysis by By Tumor Type, 2016-2032
- Figure 109: APAC Cancer Biomarkers Market Revenue (US$ Mn) Market Share by By Technologyin 2022
- Figure 110: APAC Cancer Biomarkers Market Attractiveness Analysis by By Technology, 2016-2032
- Figure 111: APAC Cancer Biomarkers Market Revenue (US$ Mn) Market Share by By Applicationin 2022
- Figure 112: APAC Cancer Biomarkers Market Attractiveness Analysis by By Application, 2016-2032
- Figure 113: APAC Cancer Biomarkers Market Revenue (US$ Mn) Market Share by Country in 2022
- Figure 114: APAC Cancer Biomarkers Market Attractiveness Analysis by Country, 2016-2032
- Figure 115: APAC Cancer Biomarkers Market Revenue (US$ Mn) (2016-2032)
- Figure 116: APAC Cancer Biomarkers Market Revenue (US$ Mn) Comparison by Country (2016-2032)
- Figure 117: APAC Cancer Biomarkers Market Revenue (US$ Mn) Comparison by By Type (2016-2032)
- Figure 118: APAC Cancer Biomarkers Market Revenue (US$ Mn) Comparison by By Tumor Type (2016-2032)
- Figure 119: APAC Cancer Biomarkers Market Revenue (US$ Mn) Comparison by By Technology (2016-2032)
- Figure 120: APAC Cancer Biomarkers Market Revenue (US$ Mn) Comparison by By Application (2016-2032)
- Figure 121: APAC Cancer Biomarkers Market Y-o-Y Growth Rate Comparison by Country (2016-2032)
- Figure 122: APAC Cancer Biomarkers Market Y-o-Y Growth Rate Comparison by By Type (2016-2032)
- Figure 123: APAC Cancer Biomarkers Market Y-o-Y Growth Rate Comparison by By Tumor Type (2016-2032)
- Figure 124: APAC Cancer Biomarkers Market Y-o-Y Growth Rate Comparison by By Technology (2016-2032)
- Figure 125: APAC Cancer Biomarkers Market Y-o-Y Growth Rate Comparison by By Application (2016-2032)
- Figure 126: APAC Cancer Biomarkers Market Share Comparison by Country (2016-2032)
- Figure 127: APAC Cancer Biomarkers Market Share Comparison by By Type (2016-2032)
- Figure 128: APAC Cancer Biomarkers Market Share Comparison by By Tumor Type (2016-2032)
- Figure 129: APAC Cancer Biomarkers Market Share Comparison by By Technology (2016-2032)
- Figure 130: APAC Cancer Biomarkers Market Share Comparison by By Application (2016-2032)
- Figure 131: Latin America Cancer Biomarkers Market Revenue (US$ Mn) Market Share by By Typein 2022
- Figure 132: Latin America Cancer Biomarkers Market Attractiveness Analysis by By Type, 2016-2032
- Figure 133: Latin America Cancer Biomarkers Market Revenue (US$ Mn) Market Share by By Tumor Typein 2022
- Figure 134: Latin America Cancer Biomarkers Market Attractiveness Analysis by By Tumor Type, 2016-2032
- Figure 135: Latin America Cancer Biomarkers Market Revenue (US$ Mn) Market Share by By Technologyin 2022
- Figure 136: Latin America Cancer Biomarkers Market Attractiveness Analysis by By Technology, 2016-2032
- Figure 137: Latin America Cancer Biomarkers Market Revenue (US$ Mn) Market Share by By Applicationin 2022
- Figure 138: Latin America Cancer Biomarkers Market Attractiveness Analysis by By Application, 2016-2032
- Figure 139: Latin America Cancer Biomarkers Market Revenue (US$ Mn) Market Share by Country in 2022
- Figure 140: Latin America Cancer Biomarkers Market Attractiveness Analysis by Country, 2016-2032
- Figure 141: Latin America Cancer Biomarkers Market Revenue (US$ Mn) (2016-2032)
- Figure 142: Latin America Cancer Biomarkers Market Revenue (US$ Mn) Comparison by Country (2016-2032)
- Figure 143: Latin America Cancer Biomarkers Market Revenue (US$ Mn) Comparison by By Type (2016-2032)
- Figure 144: Latin America Cancer Biomarkers Market Revenue (US$ Mn) Comparison by By Tumor Type (2016-2032)
- Figure 145: Latin America Cancer Biomarkers Market Revenue (US$ Mn) Comparison by By Technology (2016-2032)
- Figure 146: Latin America Cancer Biomarkers Market Revenue (US$ Mn) Comparison by By Application (2016-2032)
- Figure 147: Latin America Cancer Biomarkers Market Y-o-Y Growth Rate Comparison by Country (2016-2032)
- Figure 148: Latin America Cancer Biomarkers Market Y-o-Y Growth Rate Comparison by By Type (2016-2032)
- Figure 149: Latin America Cancer Biomarkers Market Y-o-Y Growth Rate Comparison by By Tumor Type (2016-2032)
- Figure 150: Latin America Cancer Biomarkers Market Y-o-Y Growth Rate Comparison by By Technology (2016-2032)
- Figure 151: Latin America Cancer Biomarkers Market Y-o-Y Growth Rate Comparison by By Application (2016-2032)
- Figure 152: Latin America Cancer Biomarkers Market Share Comparison by Country (2016-2032)
- Figure 153: Latin America Cancer Biomarkers Market Share Comparison by By Type (2016-2032)
- Figure 154: Latin America Cancer Biomarkers Market Share Comparison by By Tumor Type (2016-2032)
- Figure 155: Latin America Cancer Biomarkers Market Share Comparison by By Technology (2016-2032)
- Figure 156: Latin America Cancer Biomarkers Market Share Comparison by By Application (2016-2032)
- Figure 157: Middle East & Africa Cancer Biomarkers Market Revenue (US$ Mn) Market Share by By Typein 2022
- Figure 158: Middle East & Africa Cancer Biomarkers Market Attractiveness Analysis by By Type, 2016-2032
- Figure 159: Middle East & Africa Cancer Biomarkers Market Revenue (US$ Mn) Market Share by By Tumor Typein 2022
- Figure 160: Middle East & Africa Cancer Biomarkers Market Attractiveness Analysis by By Tumor Type, 2016-2032
- Figure 161: Middle East & Africa Cancer Biomarkers Market Revenue (US$ Mn) Market Share by By Technologyin 2022
- Figure 162: Middle East & Africa Cancer Biomarkers Market Attractiveness Analysis by By Technology, 2016-2032
- Figure 163: Middle East & Africa Cancer Biomarkers Market Revenue (US$ Mn) Market Share by By Applicationin 2022
- Figure 164: Middle East & Africa Cancer Biomarkers Market Attractiveness Analysis by By Application, 2016-2032
- Figure 165: Middle East & Africa Cancer Biomarkers Market Revenue (US$ Mn) Market Share by Country in 2022
- Figure 166: Middle East & Africa Cancer Biomarkers Market Attractiveness Analysis by Country, 2016-2032
- Figure 167: Middle East & Africa Cancer Biomarkers Market Revenue (US$ Mn) (2016-2032)
- Figure 168: Middle East & Africa Cancer Biomarkers Market Revenue (US$ Mn) Comparison by Country (2016-2032)
- Figure 169: Middle East & Africa Cancer Biomarkers Market Revenue (US$ Mn) Comparison by By Type (2016-2032)
- Figure 170: Middle East & Africa Cancer Biomarkers Market Revenue (US$ Mn) Comparison by By Tumor Type (2016-2032)
- Figure 171: Middle East & Africa Cancer Biomarkers Market Revenue (US$ Mn) Comparison by By Technology (2016-2032)
- Figure 172: Middle East & Africa Cancer Biomarkers Market Revenue (US$ Mn) Comparison by By Application (2016-2032)
- Figure 173: Middle East & Africa Cancer Biomarkers Market Y-o-Y Growth Rate Comparison by Country (2016-2032)
- Figure 174: Middle East & Africa Cancer Biomarkers Market Y-o-Y Growth Rate Comparison by By Type (2016-2032)
- Figure 175: Middle East & Africa Cancer Biomarkers Market Y-o-Y Growth Rate Comparison by By Tumor Type (2016-2032)
- Figure 176: Middle East & Africa Cancer Biomarkers Market Y-o-Y Growth Rate Comparison by By Technology (2016-2032)
- Figure 177: Middle East & Africa Cancer Biomarkers Market Y-o-Y Growth Rate Comparison by By Application (2016-2032)
- Figure 178: Middle East & Africa Cancer Biomarkers Market Share Comparison by Country (2016-2032)
- Figure 179: Middle East & Africa Cancer Biomarkers Market Share Comparison by By Type (2016-2032)
- Figure 180: Middle East & Africa Cancer Biomarkers Market Share Comparison by By Tumor Type (2016-2032)
- Figure 181: Middle East & Africa Cancer Biomarkers Market Share Comparison by By Technology (2016-2032)
- Figure 182: Middle East & Africa Cancer Biomarkers Market Share Comparison by By Application (2016-2032)
- List of Tables
- Table 1: Global Cancer Biomarkers Market Comparison by By Type (2016-2032)
- Table 2: Global Cancer Biomarkers Market Comparison by By Tumor Type (2016-2032)
- Table 3: Global Cancer Biomarkers Market Comparison by By Technology (2016-2032)
- Table 4: Global Cancer Biomarkers Market Comparison by By Application (2016-2032)
- Table 5: Global Cancer Biomarkers Market Revenue (US$ Mn) Comparison by Region (2016-2032)
- Table 6: Global Cancer Biomarkers Market Revenue (US$ Mn) (2016-2032)
- Table 7: Global Cancer Biomarkers Market Revenue (US$ Mn) Comparison by Region (2016-2032)
- Table 8: Global Cancer Biomarkers Market Revenue (US$ Mn) Comparison by By Type (2016-2032)
- Table 9: Global Cancer Biomarkers Market Revenue (US$ Mn) Comparison by By Tumor Type (2016-2032)
- Table 10: Global Cancer Biomarkers Market Revenue (US$ Mn) Comparison by By Technology (2016-2032)
- Table 11: Global Cancer Biomarkers Market Revenue (US$ Mn) Comparison by By Application (2016-2032)
- Table 12: Global Cancer Biomarkers Market Y-o-Y Growth Rate Comparison by Region (2016-2032)
- Table 13: Global Cancer Biomarkers Market Y-o-Y Growth Rate Comparison by By Type (2016-2032)
- Table 14: Global Cancer Biomarkers Market Y-o-Y Growth Rate Comparison by By Tumor Type (2016-2032)
- Table 15: Global Cancer Biomarkers Market Y-o-Y Growth Rate Comparison by By Technology (2016-2032)
- Table 16: Global Cancer Biomarkers Market Y-o-Y Growth Rate Comparison by By Application (2016-2032)
- Table 17: Global Cancer Biomarkers Market Share Comparison by Region (2016-2032)
- Table 18: Global Cancer Biomarkers Market Share Comparison by By Type (2016-2032)
- Table 19: Global Cancer Biomarkers Market Share Comparison by By Tumor Type (2016-2032)
- Table 20: Global Cancer Biomarkers Market Share Comparison by By Technology (2016-2032)
- Table 21: Global Cancer Biomarkers Market Share Comparison by By Application (2016-2032)
- Table 22: North America Cancer Biomarkers Market Comparison by By Tumor Type (2016-2032)
- Table 23: North America Cancer Biomarkers Market Comparison by By Technology (2016-2032)
- Table 24: North America Cancer Biomarkers Market Comparison by By Application (2016-2032)
- Table 25: North America Cancer Biomarkers Market Revenue (US$ Mn) Comparison by Country (2016-2032)
- Table 26: North America Cancer Biomarkers Market Revenue (US$ Mn) (2016-2032)
- Table 27: North America Cancer Biomarkers Market Revenue (US$ Mn) Comparison by Country (2016-2032)
- Table 28: North America Cancer Biomarkers Market Revenue (US$ Mn) Comparison by By Type (2016-2032)
- Table 29: North America Cancer Biomarkers Market Revenue (US$ Mn) Comparison by By Tumor Type (2016-2032)
- Table 30: North America Cancer Biomarkers Market Revenue (US$ Mn) Comparison by By Technology (2016-2032)
- Table 31: North America Cancer Biomarkers Market Revenue (US$ Mn) Comparison by By Application (2016-2032)
- Table 32: North America Cancer Biomarkers Market Y-o-Y Growth Rate Comparison by Country (2016-2032)
- Table 33: North America Cancer Biomarkers Market Y-o-Y Growth Rate Comparison by By Type (2016-2032)
- Table 34: North America Cancer Biomarkers Market Y-o-Y Growth Rate Comparison by By Tumor Type (2016-2032)
- Table 35: North America Cancer Biomarkers Market Y-o-Y Growth Rate Comparison by By Technology (2016-2032)
- Table 36: North America Cancer Biomarkers Market Y-o-Y Growth Rate Comparison by By Application (2016-2032)
- Table 37: North America Cancer Biomarkers Market Share Comparison by Country (2016-2032)
- Table 38: North America Cancer Biomarkers Market Share Comparison by By Type (2016-2032)
- Table 39: North America Cancer Biomarkers Market Share Comparison by By Tumor Type (2016-2032)
- Table 40: North America Cancer Biomarkers Market Share Comparison by By Technology (2016-2032)
- Table 41: North America Cancer Biomarkers Market Share Comparison by By Application (2016-2032)
- Table 42: Western Europe Cancer Biomarkers Market Comparison by By Type (2016-2032)
- Table 43: Western Europe Cancer Biomarkers Market Comparison by By Tumor Type (2016-2032)
- Table 44: Western Europe Cancer Biomarkers Market Comparison by By Technology (2016-2032)
- Table 45: Western Europe Cancer Biomarkers Market Comparison by By Application (2016-2032)
- Table 46: Western Europe Cancer Biomarkers Market Revenue (US$ Mn) Comparison by Country (2016-2032)
- Table 47: Western Europe Cancer Biomarkers Market Revenue (US$ Mn) (2016-2032)
- Table 48: Western Europe Cancer Biomarkers Market Revenue (US$ Mn) Comparison by Country (2016-2032)
- Table 49: Western Europe Cancer Biomarkers Market Revenue (US$ Mn) Comparison by By Type (2016-2032)
- Table 50: Western Europe Cancer Biomarkers Market Revenue (US$ Mn) Comparison by By Tumor Type (2016-2032)
- Table 51: Western Europe Cancer Biomarkers Market Revenue (US$ Mn) Comparison by By Technology (2016-2032)
- Table 52: Western Europe Cancer Biomarkers Market Revenue (US$ Mn) Comparison by By Application (2016-2032)
- Table 53: Western Europe Cancer Biomarkers Market Y-o-Y Growth Rate Comparison by Country (2016-2032)
- Table 54: Western Europe Cancer Biomarkers Market Y-o-Y Growth Rate Comparison by By Type (2016-2032)
- Table 55: Western Europe Cancer Biomarkers Market Y-o-Y Growth Rate Comparison by By Tumor Type (2016-2032)
- Table 56: Western Europe Cancer Biomarkers Market Y-o-Y Growth Rate Comparison by By Technology (2016-2032)
- Table 57: Western Europe Cancer Biomarkers Market Y-o-Y Growth Rate Comparison by By Application (2016-2032)
- Table 58: Western Europe Cancer Biomarkers Market Share Comparison by Country (2016-2032)
- Table 59: Western Europe Cancer Biomarkers Market Share Comparison by By Type (2016-2032)
- Table 60: Western Europe Cancer Biomarkers Market Share Comparison by By Tumor Type (2016-2032)
- Table 61: Western Europe Cancer Biomarkers Market Share Comparison by By Technology (2016-2032)
- Table 62: Western Europe Cancer Biomarkers Market Share Comparison by By Application (2016-2032)
- Table 63: Eastern Europe Cancer Biomarkers Market Comparison by By Type (2016-2032)
- Table 64: Eastern Europe Cancer Biomarkers Market Comparison by By Tumor Type (2016-2032)
- Table 65: Eastern Europe Cancer Biomarkers Market Comparison by By Technology (2016-2032)
- Table 66: Eastern Europe Cancer Biomarkers Market Comparison by By Application (2016-2032)
- Table 67: Eastern Europe Cancer Biomarkers Market Revenue (US$ Mn) Comparison by Country (2016-2032)
- Table 68: Eastern Europe Cancer Biomarkers Market Revenue (US$ Mn) (2016-2032)
- Table 69: Eastern Europe Cancer Biomarkers Market Revenue (US$ Mn) Comparison by Country (2016-2032)
- Table 70: Eastern Europe Cancer Biomarkers Market Revenue (US$ Mn) Comparison by By Type (2016-2032)
- Table 71: Eastern Europe Cancer Biomarkers Market Revenue (US$ Mn) Comparison by By Tumor Type (2016-2032)
- Table 72: Eastern Europe Cancer Biomarkers Market Revenue (US$ Mn) Comparison by By Technology (2016-2032)
- Table 73: Eastern Europe Cancer Biomarkers Market Revenue (US$ Mn) Comparison by By Application (2016-2032)
- Table 74: Eastern Europe Cancer Biomarkers Market Y-o-Y Growth Rate Comparison by Country (2016-2032)
- Table 75: Eastern Europe Cancer Biomarkers Market Y-o-Y Growth Rate Comparison by By Type (2016-2032)
- Table 76: Eastern Europe Cancer Biomarkers Market Y-o-Y Growth Rate Comparison by By Tumor Type (2016-2032)
- Table 77: Eastern Europe Cancer Biomarkers Market Y-o-Y Growth Rate Comparison by By Technology (2016-2032)
- Table 78: Eastern Europe Cancer Biomarkers Market Y-o-Y Growth Rate Comparison by By Application (2016-2032)
- Table 79: Eastern Europe Cancer Biomarkers Market Share Comparison by Country (2016-2032)
- Table 80: Eastern Europe Cancer Biomarkers Market Share Comparison by By Type (2016-2032)
- Table 81: Eastern Europe Cancer Biomarkers Market Share Comparison by By Tumor Type (2016-2032)
- Table 82: Eastern Europe Cancer Biomarkers Market Share Comparison by By Technology (2016-2032)
- Table 83: Eastern Europe Cancer Biomarkers Market Share Comparison by By Application (2016-2032)
- Table 84: APAC Cancer Biomarkers Market Comparison by By Type (2016-2032)
- Table 85: APAC Cancer Biomarkers Market Comparison by By Tumor Type (2016-2032)
- Table 86: APAC Cancer Biomarkers Market Comparison by By Technology (2016-2032)
- Table 87: APAC Cancer Biomarkers Market Comparison by By Application (2016-2032)
- Table 88: APAC Cancer Biomarkers Market Revenue (US$ Mn) Comparison by Country (2016-2032)
- Table 89: APAC Cancer Biomarkers Market Revenue (US$ Mn) (2016-2032)
- Table 90: APAC Cancer Biomarkers Market Revenue (US$ Mn) Comparison by Country (2016-2032)
- Table 91: APAC Cancer Biomarkers Market Revenue (US$ Mn) Comparison by By Type (2016-2032)
- Table 92: APAC Cancer Biomarkers Market Revenue (US$ Mn) Comparison by By Tumor Type (2016-2032)
- Table 93: APAC Cancer Biomarkers Market Revenue (US$ Mn) Comparison by By Technology (2016-2032)
- Table 94: APAC Cancer Biomarkers Market Revenue (US$ Mn) Comparison by By Application (2016-2032)
- Table 95: APAC Cancer Biomarkers Market Y-o-Y Growth Rate Comparison by Country (2016-2032)
- Table 96: APAC Cancer Biomarkers Market Y-o-Y Growth Rate Comparison by By Type (2016-2032)
- Table 97: APAC Cancer Biomarkers Market Y-o-Y Growth Rate Comparison by By Tumor Type (2016-2032)
- Table 98: APAC Cancer Biomarkers Market Y-o-Y Growth Rate Comparison by By Technology (2016-2032)
- Table 99: APAC Cancer Biomarkers Market Y-o-Y Growth Rate Comparison by By Application (2016-2032)
- Table 100: APAC Cancer Biomarkers Market Share Comparison by Country (2016-2032)
- Table 101: APAC Cancer Biomarkers Market Share Comparison by By Type (2016-2032)
- Table 102: APAC Cancer Biomarkers Market Share Comparison by By Tumor Type (2016-2032)
- Table 103: APAC Cancer Biomarkers Market Share Comparison by By Technology (2016-2032)
- Table 104: APAC Cancer Biomarkers Market Share Comparison by By Application (2016-2032)
- Table 105: Latin America Cancer Biomarkers Market Comparison by By Type (2016-2032)
- Table 106: Latin America Cancer Biomarkers Market Comparison by By Tumor Type (2016-2032)
- Table 107: Latin America Cancer Biomarkers Market Comparison by By Technology (2016-2032)
- Table 108: Latin America Cancer Biomarkers Market Comparison by By Application (2016-2032)
- Table 109: Latin America Cancer Biomarkers Market Revenue (US$ Mn) Comparison by Country (2016-2032)
- Table 110: Latin America Cancer Biomarkers Market Revenue (US$ Mn) (2016-2032)
- Table 111: Latin America Cancer Biomarkers Market Revenue (US$ Mn) Comparison by Country (2016-2032)
- Table 112: Latin America Cancer Biomarkers Market Revenue (US$ Mn) Comparison by By Type (2016-2032)
- Table 113: Latin America Cancer Biomarkers Market Revenue (US$ Mn) Comparison by By Tumor Type (2016-2032)
- Table 114: Latin America Cancer Biomarkers Market Revenue (US$ Mn) Comparison by By Technology (2016-2032)
- Table 115: Latin America Cancer Biomarkers Market Revenue (US$ Mn) Comparison by By Application (2016-2032)
- Table 116: Latin America Cancer Biomarkers Market Y-o-Y Growth Rate Comparison by Country (2016-2032)
- Table 117: Latin America Cancer Biomarkers Market Y-o-Y Growth Rate Comparison by By Type (2016-2032)
- Table 118: Latin America Cancer Biomarkers Market Y-o-Y Growth Rate Comparison by By Tumor Type (2016-2032)
- Table 119: Latin America Cancer Biomarkers Market Y-o-Y Growth Rate Comparison by By Technology (2016-2032)
- Table 120: Latin America Cancer Biomarkers Market Y-o-Y Growth Rate Comparison by By Application (2016-2032)
- Table 121: Latin America Cancer Biomarkers Market Share Comparison by Country (2016-2032)
- Table 122: Latin America Cancer Biomarkers Market Share Comparison by By Type (2016-2032)
- Table 123: Latin America Cancer Biomarkers Market Share Comparison by By Tumor Type (2016-2032)
- Table 124: Latin America Cancer Biomarkers Market Share Comparison by By Technology (2016-2032)
- Table 125: Latin America Cancer Biomarkers Market Share Comparison by By Application (2016-2032)
- Table 126: Middle East & Africa Cancer Biomarkers Market Comparison by By Type (2016-2032)
- Table 127: Middle East & Africa Cancer Biomarkers Market Comparison by By Tumor Type (2016-2032)
- Table 128: Middle East & Africa Cancer Biomarkers Market Comparison by By Technology (2016-2032)
- Table 129: Middle East & Africa Cancer Biomarkers Market Comparison by By Application (2016-2032)
- Table 130: Middle East & Africa Cancer Biomarkers Market Revenue (US$ Mn) Comparison by Country (2016-2032)
- Table 131: Middle East & Africa Cancer Biomarkers Market Revenue (US$ Mn) (2016-2032)
- Table 132: Middle East & Africa Cancer Biomarkers Market Revenue (US$ Mn) Comparison by Country (2016-2032)
- Table 133: Middle East & Africa Cancer Biomarkers Market Revenue (US$ Mn) Comparison by By Type (2016-2032)
- Table 134: Middle East & Africa Cancer Biomarkers Market Revenue (US$ Mn) Comparison by By Tumor Type (2016-2032)
- Table 135: Middle East & Africa Cancer Biomarkers Market Revenue (US$ Mn) Comparison by By Technology (2016-2032)
- Table 136: Middle East & Africa Cancer Biomarkers Market Revenue (US$ Mn) Comparison by By Application (2016-2032)
- Table 137: Middle East & Africa Cancer Biomarkers Market Y-o-Y Growth Rate Comparison by Country (2016-2032)
- Table 138: Middle East & Africa Cancer Biomarkers Market Y-o-Y Growth Rate Comparison by By Type (2016-2032)
- Table 139: Middle East & Africa Cancer Biomarkers Market Y-o-Y Growth Rate Comparison by By Tumor Type (2016-2032)
- Table 140: Middle East & Africa Cancer Biomarkers Market Y-o-Y Growth Rate Comparison by By Technology (2016-2032)
- Table 141: Middle East & Africa Cancer Biomarkers Market Y-o-Y Growth Rate Comparison by By Application (2016-2032)
- Table 142: Middle East & Africa Cancer Biomarkers Market Share Comparison by Country (2016-2032)
- Table 143: Middle East & Africa Cancer Biomarkers Market Share Comparison by By Type (2016-2032)
- Table 144: Middle East & Africa Cancer Biomarkers Market Share Comparison by By Tumor Type (2016-2032)
- Table 145: Middle East & Africa Cancer Biomarkers Market Share Comparison by By Technology (2016-2032)
- Table 146: Middle East & Africa Cancer Biomarkers Market Share Comparison by By Application (2016-2032)
- 1. Executive Summary
-
- Thermo Fisher Scientific Inc.
- Bio-Rad Laboratories, Inc.
- F. Hoffmann-La Roche Ltd.
- QIAGEN N.V.
- illumina Inc.
- Agilent Technologies Inc.
- Abbott Laboratories Inc.
- Becton, Dickinson, and Company
- Myriad Genetics, Inc.
- Sysmex Corporation
- Siemens AG
- BioMerieux SA
- Hologic, Inc.
- Epigenomics AG
- BioVision Inc.
- Meso Scale Diagnostics LLC
- Seegene Technologies Inc.
Our Clients


View Our Licence Options
