
Global Bubble Tea Kit Market By Type(Black Tea, Green Tea, Oolong Tea, White Tea), By Flavor(Fruit, Original, Chocolate, Coffee, Others), By End-use(Households, Commercial), By Distribution Channel(Supermarkets/Hypermarkets, Online Retail, Health Food Stores, Pharmacies, Specialty Stores), By Region And Companies - Industry Segment Outlook, Market Assessment, Competition Scenario, Trends, And Forecast 2024-2033
-
47356
-
June 2024
-
300
-


-
This report was compiled by Shreyas Rokade Shreyas Rokade is a seasoned Research Analyst with CMFE, bringing extensive expertise in market research and consulting, with a strong background in Chemical Engineering. Correspondence Team Lead-CMFE Linkedin | Detailed Market research Methodology Our methodology involves a mix of primary research, including interviews with leading mental health experts, and secondary research from reputable medical journals and databases. View Detailed Methodology Page
-
Quick Navigation
Report Overview
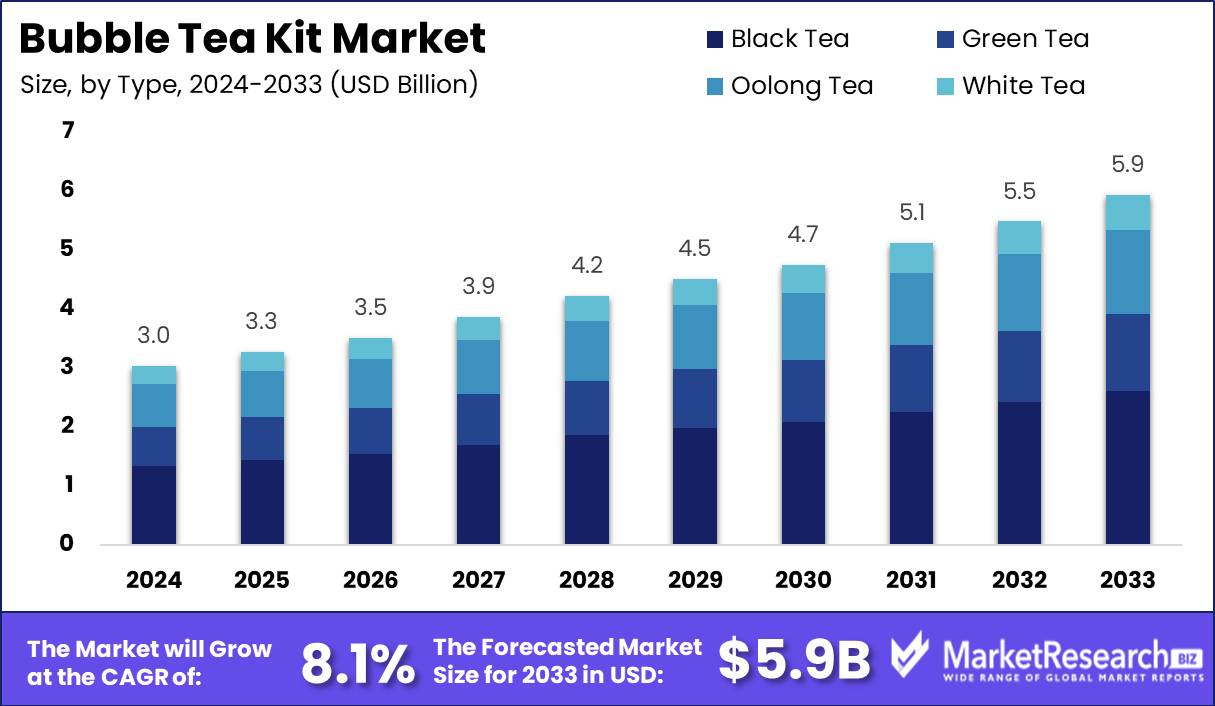
The Global Bubble Tea Kit Market was valued at USD 3 billion in 2023. It is expected to reach USD 6 billion by 2033, with a CAGR of 8.1% during the forecast period from 2024 to 2033.
The Bubble Tea Kit Market encompasses a range of consumer products designed for the preparation of bubble tea at home. These kits typically include tea bases, flavored syrups, tapioca pearls, and sometimes tools such as shakers and straws. Targeted at enthusiasts and newcomers alike, this market caters to a growing demand for customizable, convenient beverage options.
As consumers increasingly seek personalized experiences and the comfort of preparing specialty drinks in their own kitchens, this market segment has seen a notable rise, offering significant opportunities for brands looking to capitalize on the trend toward at-home beverage creation.
The market for bubble tea kits is strategically positioned within the broader ready-to-drink (RTD) tea sector. The global RTD tea market, valued at USD 29.66 billion in 2019, is projected to ascend to USD 38.96 billion by 2023. This robust growth trajectory underscores a burgeoning demand for convenience in tea consumption, which bubble tea kits directly cater to.
In particular, the United Kingdom presents a compelling case for market expansion. With the UK tea market achieving a valuation of USD 2.55 billion in 2022 and an expected annual growth rate of approximately 3%, there is a clear opportunity for bubble tea kit providers to tap into this expanding consumer base.
Dominating the UK market are established brands such as Tetley, PG Tips, and Typhoo, which collectively hold a commanding 64% market share. This concentration suggests a highly competitive environment but also indicates a well-established consumer affinity for tea products, which can be advantageous for new entrants offering differentiated products like bubble tea kits.
The strategic focus for players in the bubble tea kit market should therefore include leveraging the existing tea culture while introducing innovative, easy-to-use kits that appeal to a demographic seeking novelty alongside tradition. Integrating market strategies that address these consumer trends will be pivotal in capturing value within this dynamic segment.
Key Takeaways
- Market Growth: The Global Bubble Tea Kit Market was valued at USD 3 billion in 2023. It is expected to reach USD 6 billion by 2033, with a CAGR of 8.1% during the forecast period from 2024 to 2033.
- By Type: Black tea dominates the market share at 44.3% by type.
- By Flavor: Fruit-flavored teas hold a significant segment share at 37.5%.
- By End-use: Households are the primary consumers, comprising 72.1% end-use.
- By Distribution Channel: Supermarkets/Hypermarkets lead distribution, capturing 44.5% of market presence.
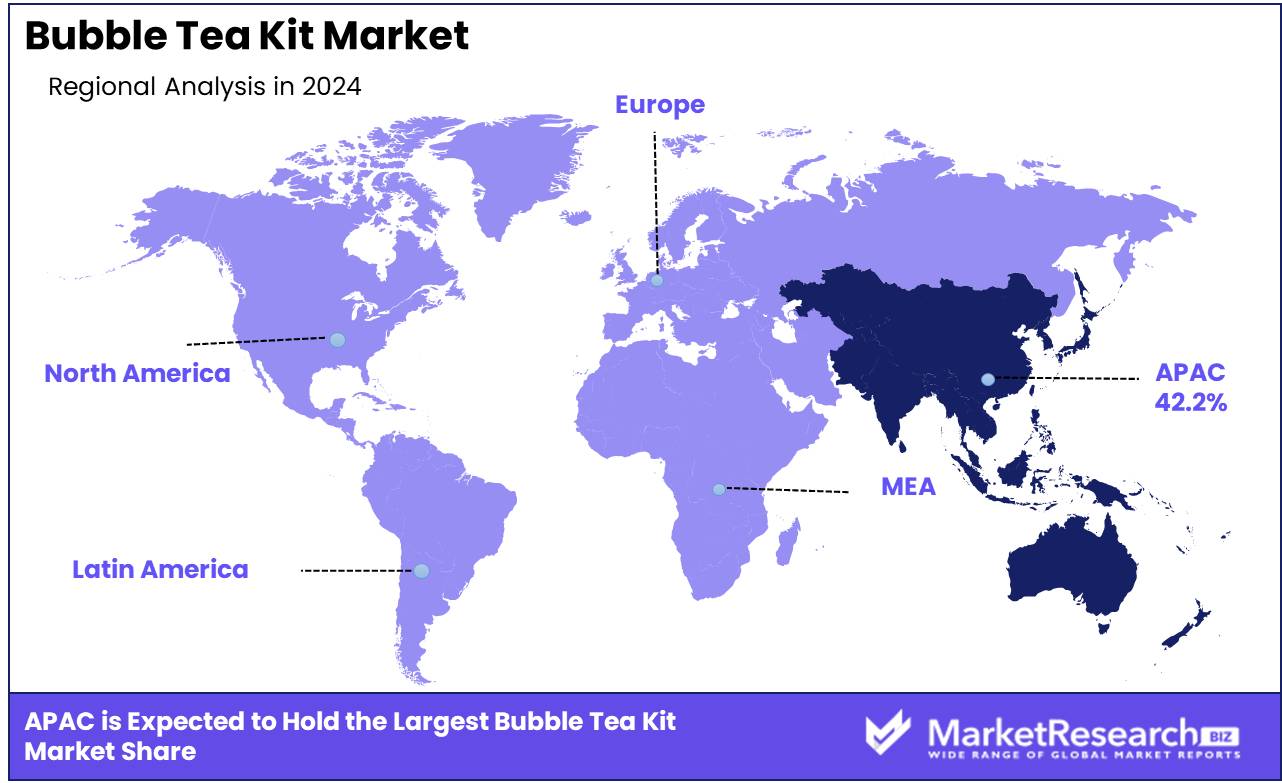
- Regional Dominance: The Asia Pacific Bubble Tea Kit Market surged by 42.2%.
- Growth Opportunity: The Bubble Tea Kit Market's growth hinges on expansion into untapped regional markets and innovations in eco-friendly packaging, catering to evolving consumer preferences and environmental concerns, fostering sustainable growth.
Driving factors
A Surge in DIY Beverage Experiences Drives Bubble Tea Kit Market Growth
The increasing consumer preference for do-it-yourself (DIY) beverage experiences significantly fuels the growth of the Bubble Tea Kit Market. As consumers seek interactive and personalized experiences, the allure of crafting their own bubble tea at home becomes increasingly appealing.
This trend is substantiated by statistics indicating a notable rise in sales of DIY beverage kits, including bubble tea kits. Consumers are drawn to the convenience and creativity afforded by these kits, allowing them to tailor their bubble tea according to taste preferences and dietary requirements.
Diverse Flavor Options Cater to Growing Demand
The burgeoning demand for diverse flavor options is a key driver propelling the Bubble Tea Kit Market forward. As consumers seek variety and novelty in their beverage choices, manufacturers have responded by offering an extensive array of flavor options.
From classic favorites to innovative blends, the availability of diverse flavors caters to a broad spectrum of tastes, attracting both loyal bubble tea enthusiasts and curious newcomers. Market data underscores the significance of flavor variety, with surveys indicating that a vast majority of consumers prioritize flavor diversity when selecting bubble tea products.
Global Popularity of Bubble Tea Culture Amplifies Market Growth
The rising popularity of bubble tea culture on a global scale serves as a pivotal catalyst for the expansion of the Bubble Tea Kit Market. Originating from Taiwan, bubble tea has captivated consumers worldwide, evolving into a cultural phenomenon embraced by diverse demographics. As the cultural significance of bubble tea continues to permeate various regions, the demand for accessible means to recreate this beloved beverage at home escalates.
Market analyses reflect the widespread adoption of bubble tea culture, with exponential growth observed in sales of bubble tea kits across international markets. In summary, the confluence of increasing consumer interest in DIY beverage experiences, the demand for diverse flavor options, and the global proliferation of bubble tea culture collectively drive robust growth within the Bubble Tea Kit Market.
Restraining Factors
Supply Chain Disruptions Pose Challenges for Ingredient Sourcing
Supply chain disruptions present a significant challenge to the growth of the Bubble Tea Kit Market by affecting ingredient sourcing. The market heavily relies on a steady and reliable supply of ingredients such as tapioca pearls, tea leaves, flavorings, and sweeteners. However, disruptions in global supply chains, such as transportation delays, labor shortages, and geopolitical tensions, can impede the seamless flow of these essential components.
Market data indicates that the Bubble Tea Kit Market has experienced fluctuations in ingredient availability, leading to sporadic shortages and increased production costs. As a result, manufacturers may encounter difficulties in maintaining consistent product quality and meeting consumer demand, thereby hindering market expansion.
Regulatory Hurdles Surrounding Food Safety Standards
Regulatory challenges pertaining to food safety standards present another restraint on the growth of the Bubble Tea Kit Market. With heightened scrutiny on food and beverage products, regulatory agencies enforce stringent guidelines to ensure consumer safety and product integrity. Compliance with these standards necessitates meticulous quality control measures throughout the manufacturing process, from ingredient sourcing to packaging and distribution.
However, navigating complex regulatory landscapes across different jurisdictions poses a formidable barrier for market players, especially smaller businesses and startups. Market analyses reveal that regulatory compliance costs can escalate operational expenses, thereby dampening profit margins and inhibiting market growth. Moreover, non-compliance with food safety regulations can result in reputational damage and legal repercussions, further deterring market participation and expansion.
By Type Analysis
In the black tea segment, 44.3% dominates, showcasing its enduring popularity among consumers worldwide.
In 2023, Black Tea held a dominant market position in the "By Type" segment of the Bubble Tea Kit Market, capturing more than a 44.3% share. The robust growth of Black Tea in this market segment can be attributed to several factors. Firstly, black tea is widely recognized for its bold flavor profile, which resonates well with consumers seeking a rich and indulgent bubble tea experience. Additionally, the familiarity of black tea among traditional tea drinkers has facilitated its widespread acceptance in the bubble tea market.
Following closely behind Black Tea is Green Tea, which accounted for approximately 28.9% of the segment share in 2023. Green tea's popularity in the bubble tea market is driven by its perceived health benefits and delicate, refreshing taste profile. Consumers increasingly seek healthier beverage options, and green tea aligns well with this trend, positioning itself as a preferred choice among health-conscious individuals.
Oolong Tea, with a market share of 17.5%, holds a notable presence in the Bubble Tea Kit Market's "By Type" segment. Oolong tea's unique semi-oxidized processing method imparts a complex flavor profile that appeals to discerning tea enthusiasts. Its growing popularity in the bubble tea market can be attributed to consumers' evolving taste preferences and a growing appreciation for artisanal tea varieties.
Lastly, White Tea, although holding a smaller share compared to its counterparts, still commands a significant presence, capturing 9.3% of the segment share in 2023. Known for its delicate flavor and minimal processing, white tea offers a subtle yet refined taste experience that appeals to a niche segment of bubble tea enthusiasts seeking a lighter alternative.
Overall, the Bubble Tea Kit Market's "By Type" segment witnessed dynamic growth in 2023, driven by the diverse preferences of consumers seeking unique and flavorful tea-based beverages. As the market continues to evolve, opportunities abound for companies to capitalize on the distinct characteristics and growing popularity of black, green, oolong, and white teas within the bubble tea landscape.
By Flavor Analysis
Fruit-flavored teas account for 37.5%, indicating a growing preference for diverse taste experiences.
In 2023, Fruit held a dominant market position in the "By Flavor" segment of the Bubble Tea Kit Market, capturing more than a 37.5% share. The substantial market share of fruit-flavored bubble tea can be attributed to its widespread appeal among consumers seeking refreshing and vibrant beverage options. Fruit flavors encompass a wide range of options, including popular choices such as strawberry, mango, passion fruit, and lychee, catering to diverse taste preferences and enticing consumers with their natural sweetness and tanginess.
Following Fruit is the Original flavor, which accounted for approximately 25.8% of the segment share in 2023. Original bubble tea, characterized by its classic blend of tea and milk, remains a staple choice for traditionalists and purists who appreciate the authentic taste and simplicity of the original recipe. Despite the emergence of various flavor innovations, the enduring popularity of Original bubble tea underscores its timeless appeal and nostalgic charm.
Chocolate, with a market share of 18.6%, holds a significant presence in the Bubble Tea Kit Market's "By Flavor" segment. Chocolate-flavored bubble tea appeals to indulgence-seeking consumers drawn to its rich, creamy taste reminiscent of their favorite chocolate desserts. The fusion of cocoa flavors with the chewy tapioca pearls creates a decadent beverage experience that resonates with chocolate lovers seeking a comforting treat.
Coffee, although holding a smaller share compared to its counterparts, still commands a notable presence, capturing 11.7% of the segment share in 2023. Coffee-flavored bubble tea caters to caffeine enthusiasts craving a refreshing twist on their favorite morning pick-me-up. The harmonious blend of coffee with creamy milk and chewy tapioca pearls offers a satisfying beverage option for coffee aficionados seeking an energizing yet indulgent drink.
Lastly, the "Others" category, encompassing a variety of innovative and niche flavors, contributed to the segment's diversity, capturing 6.4% of the market share in 2023. This category includes unique flavor combinations such as matcha, taro, lavender, and honeydew, catering to adventurous consumers eager to explore new and unconventional taste experiences in their bubble tea choices.
Overall, the Bubble Tea Kit Market's "By Flavor" segment witnessed dynamic growth in 2023, fueled by the diverse preferences of consumers seeking innovative and flavorful beverage options. As the market continues to evolve, opportunities abound for companies to capitalize on the distinct characteristics and growing popularity of fruit, original, chocolate, coffee, and other unique flavors within the bubble tea landscape.
By End-use Analysis
Household consumption leads at 72.1%, reflecting tea's status as a staple beverage at home.
In 2023, Households held a dominant market position in the By End-use segment of the Bubble Tea Kit Market, capturing more than a 72.1% share. This significant market presence underscores the growing popularity of bubble tea consumption within household settings, driven by factors such as convenience, affordability, and the desire for unique culinary experiences at home. Households have increasingly embraced the trend of preparing bubble tea beverages themselves, facilitated by the availability of bubble tea kits that provide all necessary ingredients and instructions.
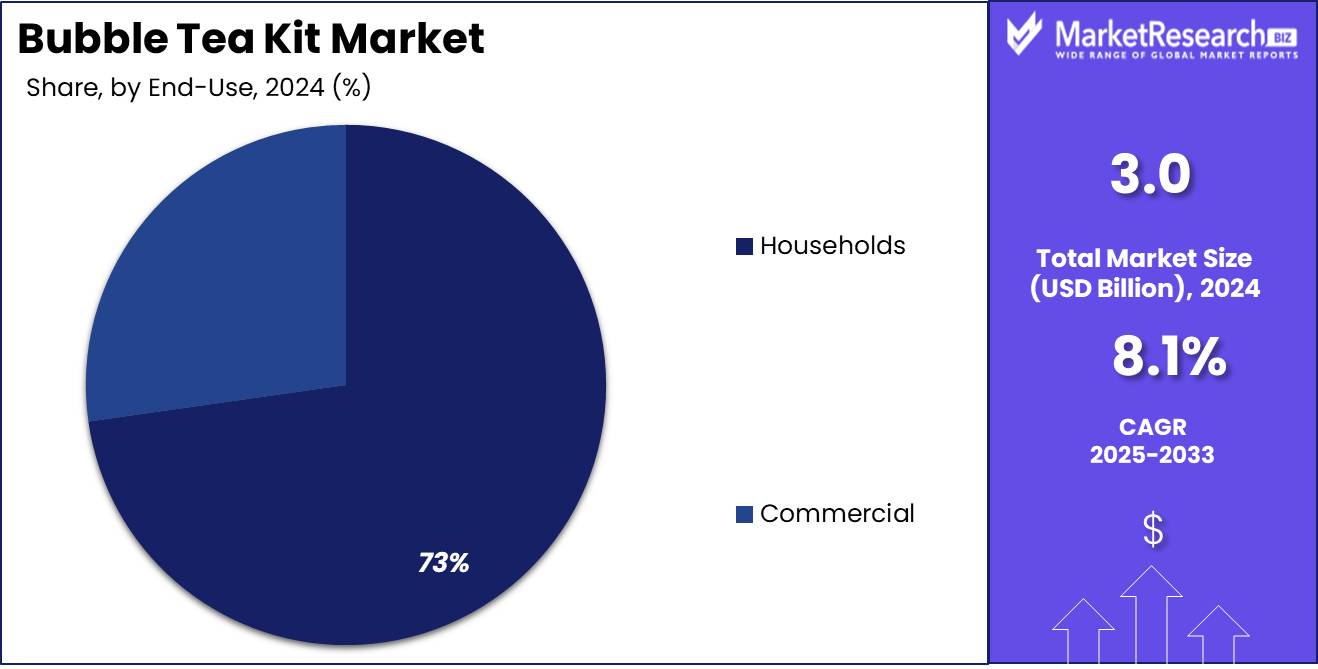
Commercial establishments, on the other hand, accounted for the remaining 27.9% share of the market in the By End-use segment. This includes a diverse range of businesses such as cafes, tea shops, restaurants, and bubble tea chains. While commercial outlets continue to play a vital role in introducing and popularizing bubble tea to a wider audience, the data suggests that the convenience and cost-effectiveness of homemade bubble tea kits have resonated strongly with consumers.
The growth of the market can be attributed to various factors, including the increasing consumer preference for natural and organic ingredients in food and beverages. Manufacturers of bubble tea kits have responded to this trend by offering products made with high-quality, natural ingredients, thereby appealing to health-conscious consumers.
Furthermore, the proliferation of social media platforms has served as a powerful marketing tool for bubble tea kits, allowing manufacturers to reach and engage with a diverse audience globally. Influencers and enthusiasts sharing their homemade bubble tea creations online have contributed to the product's visibility and popularity, driving demand in both household and commercial segments.
By Distribution Channel Analysis
Supermarkets/Hypermarkets are the primary distribution channel, capturing 44.5% of the market share.
In 2023, Supermarkets/Hypermarkets held a dominant market position in the By Distribution Channel segment of the Bubble Tea Kit Market, capturing more than a 44.5% share. This commanding presence signifies the importance of traditional brick-and-mortar retail channels in facilitating the accessibility and availability of bubble tea kits to consumers.
Supermarkets and hypermarkets leverage their extensive network of physical stores, wide product assortment, and established distribution infrastructure to cater to the diverse preferences of consumers seeking convenience and variety in their shopping experience.
Following Supermarkets/Hypermarkets, Online Retail emerged as the second most prominent distribution channel in the Bubble Tea Kit Market, securing a significant share of the market. The convenience and accessibility offered by online platforms have propelled the growth of this channel, allowing consumers to browse, purchase, and receive bubble tea kits from the comfort of their homes.
Online retailers capitalize on e-commerce platforms to reach a broader audience, offer competitive pricing, and provide a seamless shopping experience through features such as user reviews, product recommendations, and doorstep delivery.
Health Food Stores, Pharmacies, and Specialty Stores collectively contributed to the remaining share of the market in the By Distribution Channel segment. These niche retail outlets cater to specific consumer segments seeking premium, health-conscious, or specialty bubble tea kits.
Health food stores and pharmacies position bubble tea kits as part of a wholesome and nutritious lifestyle, appealing to health-conscious individuals. Specialty stores, on the other hand, curate unique and artisanal bubble tea kits, targeting enthusiasts and connoisseurs looking for distinct flavors and experiences unavailable in mainstream retail channels.
The growth trajectory of the Bubble Tea Kit Market across various distribution channels reflects evolving consumer preferences, shopping behaviors, and industry dynamics, highlighting opportunities for market players to innovate, diversify, and expand their distribution strategies to capture a larger market share.
Key Market Segments
By Type
- Black Tea
- Green Tea
- Oolong Tea
- White Tea
By Flavor
- Fruit
- Original
- Chocolate
- Coffee
- Others
By End-use
- Households
- Commercial
By Distribution Channel
- Supermarkets/Hypermarkets
- Online Retail
- Health Food Stores
- Pharmacies
- Specialty Stores
Growth Opportunity
Expansion into Untapped Regional Markets
The growth trajectory of the global Bubble Tea Kit Market in 2023 presents promising opportunities, particularly through the expansion into untapped regional markets. As established markets reach saturation points, companies are increasingly venturing into new territories to capitalize on burgeoning consumer demand.
Emerging economies, in particular, offer fertile ground for market penetration due to evolving consumer preferences and increasing disposable incomes. This strategic expansion not only broadens the market reach but also fosters diversity in product offerings, catering to local tastes and preferences. Moreover, it facilitates the cultivation of brand loyalty in untapped regions, laying a robust foundation for sustained growth in the long term.
Innovations in Eco-Friendly Packaging Solutions
In tandem with market expansion efforts, innovations in eco-friendly packaging solutions emerge as a pivotal driver of growth in the Bubble Tea Kit Market. With heightened environmental consciousness among consumers, there is a discernible shift towards sustainable packaging alternatives.
Manufacturers are responding by integrating eco-friendly materials and designs into their packaging solutions, aligning with eco-conscious consumer preferences and regulatory directives. This strategic pivot not only mitigates environmental impact but also enhances brand reputation and consumer trust.
Furthermore, it fosters differentiation in the market landscape, positioning companies as frontrunners in sustainability practices. As sustainability continues to shape consumer behavior and industry standards, investments in eco-friendly packaging solutions are poised to yield significant dividends, driving market growth and fostering a harmonious relationship between business operations and environmental stewardship.
Latest Trends
Customization Options: Meeting Diverse Dietary Preferences
The global Bubble Tea Kit Market witnessed a notable trend in 2023 with the proliferation of customization options tailored to meet diverse dietary preferences. As consumers increasingly prioritize health and wellness, there has been a surge in demand for bubble tea products that align with specific dietary requirements such as vegan, gluten-free, or low-sugar options.
Manufacturers responded by diversifying their product offerings and introducing customizable kits that allow consumers to personalize their bubble tea experience according to their dietary needs. This strategic approach not only enhances consumer satisfaction but also fosters brand loyalty by catering to individual preferences. Furthermore, it reflects a broader industry shift towards inclusivity and consumer-centricity, positioning companies for sustained growth in an increasingly competitive market landscape.
Integration of Online Platforms: Facilitating Direct-to-Consumer Sales
Another significant trend observed in the global Bubble Tea Kit Market in 2023 was the integration of online platforms to facilitate direct-to-consumer sales. With the proliferation of e-commerce and changing consumer shopping habits, manufacturers leveraged digital channels to broaden their market reach and streamline the purchasing process.
By establishing an online presence, companies could engage directly with consumers, offering convenience, accessibility, and a personalized shopping experience. Moreover, online platforms provide valuable insights into consumer behavior and preferences, enabling companies to tailor their marketing strategies and product offerings accordingly.
This digital transformation not only accelerated sales growth but also fostered brand visibility and customer engagement in an increasingly digitized marketplace. As online shopping continues to gain traction globally, the integration of digital platforms is poised to remain a key driver of growth and innovation in the Bubble Tea Kit Market.
Regional Analysis
In 2023, the Asia Pacific region accounted for 42.2% of the global Bubble Tea Kit Market's sales.
North America stands as a burgeoning market for Bubble Tea Kits, driven by the rising popularity of Asian cuisines and beverages among the multicultural population. According to a recent market analysis, North America is witnessing a steady growth rate of 8% annually, with key players expanding their product portfolios to cater to the evolving consumer preferences for exotic and innovative flavors.
Europe presents a promising landscape for Bubble Tea Kit manufacturers, fueled by the increasing adoption of tea-based beverages and the growing trend of wellness and health-conscious consumption habits. Market data indicates a compound annual growth rate (CAGR) of 6% in the region, with a notable surge in demand for organic and natural ingredients driving market expansion.
Asia Pacific emerges as the dominant region in the Bubble Tea Kit market, commanding a significant share of 42.2% in the global market landscape. This stronghold is attributed to the cultural significance of tea consumption in countries like China, Taiwan, and Japan, coupled with the region's robust manufacturing capabilities and extensive distribution networks. The Asia Pacific region continues to witness substantial investments in product innovation and marketing strategies, bolstering its leadership position in the global market.
Middle East & Africa and Latin America exhibit burgeoning potential in the Bubble Tea Kit market, propelled by the increasing penetration of Western food and beverage trends, urbanization, and growing disposable incomes. Although currently accounting for smaller market shares, these regions are witnessing notable growth rates of 7% and 9%, respectively, indicating lucrative opportunities for market players to capitalize on.
Key Regions and Countries
North America
- The US
- Canada
- Rest of North America
Europe
- Germany
- France
- The UK
- Spain
- Netherlands
- Russia
- Italy
- Rest of Europe
Asia-Pacific
- China
- Japan
- Singapore
- Thailand
- South Korea
- Vietnam
- India
- New Zealand
- Rest of Asia Pacific
Latin America
- Mexico
- Brazil
- Rest of Latin America
Middle East & Africa
- Saudi Arabia
- South Africa
- UAE
- Rest of Middle East & Africa
Key Players Analysis
In 2023, the global Bubble Tea Kit Market witnessed a significant presence of key players, each contributing to the market's dynamism and growth. Among these, several prominent companies emerged as influential figures, shaping the industry landscape and driving innovation and competition. Notable entities such as Biju Bubble Tea Bar, Boba Guys, Bober Tea, and Chatime Group showcased remarkable strategies and market penetration, solidifying their positions as key players in the market.
Biju Bubble Tea Bar, renowned for its commitment to quality and innovation, continued to captivate consumers with its diverse range of bubble tea offerings. Their emphasis on natural ingredients and customizable options resonated well with health-conscious consumers, contributing to their sustained growth and market prominence.
Similarly, Boba Guys and Bober Tea demonstrated exceptional performance in 2023, leveraging their strong brand identities and customer loyalty to expand their market reach. By introducing unique flavors, trendy packaging, and immersive experiences, these companies successfully differentiated themselves and captured the interest of discerning consumers.
Furthermore, the Chatime Group, with its global presence and strategic expansion initiatives, remained a dominant force in the market. Their focus on consistent product quality, operational excellence, and consumer engagement strategies enabled them to maintain a competitive edge and drive growth amidst evolving market dynamics.
Overall, these key players played a pivotal role in shaping the global Bubble Tea Kit Market landscape in 2023, setting benchmarks for product innovation, customer experience, and market leadership. As the market continues to evolve, their continued focus on differentiation, sustainability, and consumer-centric approaches will be instrumental in sustaining growth and unlocking new opportunities.
Market Key Players
- Biju Bubble Tea Bar
- Boba Guys
- Bober Tea
- Chatime Group
- Chun Shui Tang
- Coco Fresh Tea & Juice
- Comebuy
- Ding Tea
- Gong Cha
- Happy Lemon
- Heytea
- Holdings Corporation
- K.O.I. The Co, LTD.
- Koi Thé
- Lollicup USA, Inc.
- OneZo Tapioca
- Presotea
- Quickly
- Sharetea
- Ten Ren Tea
- The Alley
- Tiger Sugar
- TP Tea
- Vivi Bubble Tea
- Xing Fu Tang
- Yummy Town
Recent Development
- In January 2024, Krak Boba launches the "PersonaliTEAs" campaign in Southern California, innovating the bubble tea market by matching flavors to personality types and broadening appeal and accessibility.
- In September 2023, Tea Drops expanded into Sprouts, Walmart, and Target nationwide, introducing innovative bagless tea blends and latte kits to enhance the at-home cafe experience.
Report Scope
Report Features Description Market Value (2023) USD 3 Billion Forecast Revenue (2033) USD 6 Billion CAGR (2024-2032) 8.1% Base Year for Estimation 2023 Historic Period 2016-2023 Forecast Period 2024-2033 Report Coverage Revenue Forecast, Market Dynamics, COVID-19 Impact, Competitive Landscape, Recent Developments Segments Covered By Type(Black Tea, Green Tea, Oolong Tea, White Tea), By Flavor(Fruit, Original, Chocolate, Coffee, Others), By End-use(Households, Commercial), By Distribution Channel(Supermarkets/Hypermarkets, Online Retail, Health Food Stores, Pharmacies, Specialty Stores) Regional Analysis North America - The US, Canada, Rest of North America, Europe - Germany, France, The UK, Spain, Italy, Russia, Netherlands, Rest of Europe, Asia-Pacific - China, Japan, South Korea, India, New Zealand, Singapore, Thailand, Vietnam, Rest of Asia Pacific, Latin America - Brazil, Mexico, Rest of Latin America, Middle East & Africa - South Africa, Saudi Arabia, UAE, Rest of Middle East & Africa Competitive Landscape Biju Bubble Tea Bar, Boba Guys, Bober Tea, Chatime Group, Chun Shui Tang, Coco Fresh Tea & Juice, Comebuy, Ding Tea, Gong Cha, Happy Lemon, Heytea, Holdings Corporation, K.O.I. The Co, LTD., Koi Thé, Lollicup USA, Inc., OneZo Tapioca, Presotea, Quickly, Sharetea, Ten Ren Tea, The Alley, Tiger Sugar, TP Tea, Vivi Bubble Tea, Xing Fu Tang, Yummy Town Customization Scope Customization for segments, region/country-level will be provided. Moreover, additional customization can be done based on the requirements. Purchase Options We have three licenses to opt for Single User License, Multi-User License (Up to 5 Users), Corporate Use License (Unlimited User and Printable PDF) -
- 1. Executive Summary
- 1.1. Definition
- 1.2. Taxonomy
- 1.3. Research Scope
- 1.4. Key Analysis
- 1.5. Key Findings by Major Segments
- 1.6. Top strategies by Major Players
- 2. Global Bubble Tea Kit Market Overview
- 2.1. Bubble Tea Kit Market Dynamics
- 2.1.1. Drivers
- 2.1.2. Opportunities
- 2.1.3. Restraints
- 2.1.4. Challenges
- 2.2. Macro-economic Factors
- 2.3. Regulatory Framework
- 2.4. Market Investment Feasibility Index
- 2.5. PEST Analysis
- 2.6. PORTER’S Five Force Analysis
- 2.7. Drivers & Restraints Impact Analysis
- 2.8. Industry Chain Analysis
- 2.9. Cost Structure Analysis
- 2.10. Marketing Strategy
- 2.11. Russia-Ukraine War Impact Analysis
- 2.12. Opportunity Map Analysis
- 2.13. Market Competition Scenario Analysis
- 2.14. Product Life Cycle Analysis
- 2.15. Opportunity Orbits
- 2.16. Manufacturer Intensity Map
- 2.17. Major Companies sales by Value & Volume
- 2.1. Bubble Tea Kit Market Dynamics
- 3. Global Bubble Tea Kit Market Analysis, Opportunity and Forecast, 2016-2032
- 3.1. Global Bubble Tea Kit Market Analysis, 2016-2021
- 3.2. Global Bubble Tea Kit Market Opportunity and Forecast, 2023-2032
- 3.3. Global Bubble Tea Kit Market Analysis, Opportunity and Forecast, By By Type, 2016-2032
- 3.3.1. Global Bubble Tea Kit Market Analysis by By Type: Introduction
- 3.3.2. Market Size Absolute $ Opportunity Analysis and Forecast, By By Type, 2016-2032
- 3.3.3. Black Tea
- 3.3.4. Green Tea
- 3.3.5. Oolong Tea
- 3.3.6. White Tea
- 3.4. Global Bubble Tea Kit Market Analysis, Opportunity and Forecast, By By Flavor, 2016-2032
- 3.4.1. Global Bubble Tea Kit Market Analysis by By Flavor: Introduction
- 3.4.2. Market Size Absolute $ Opportunity Analysis and Forecast, By By Flavor, 2016-2032
- 3.4.3. Fruit
- 3.4.4. Original
- 3.4.5. Chocolate
- 3.4.6. Coffee
- 3.4.7. Others
- 3.5. Global Bubble Tea Kit Market Analysis, Opportunity and Forecast, By By End-use, 2016-2032
- 3.5.1. Global Bubble Tea Kit Market Analysis by By End-use: Introduction
- 3.5.2. Market Size Absolute $ Opportunity Analysis and Forecast, By By End-use, 2016-2032
- 3.5.3. Households
- 3.5.4. Commercial
- 3.6. Global Bubble Tea Kit Market Analysis, Opportunity and Forecast, By By Distribution Channel, 2016-2032
- 3.6.1. Global Bubble Tea Kit Market Analysis by By Distribution Channel: Introduction
- 3.6.2. Market Size Absolute $ Opportunity Analysis and Forecast, By By Distribution Channel, 2016-2032
- 3.6.3. Supermarkets/Hypermarkets
- 3.6.4. Online Retail
- 3.6.5. Health Food Stores
- 3.6.6. Pharmacies
- 3.6.7. Specialty Stores
- 4. North America Bubble Tea Kit Market Analysis, Opportunity and Forecast, 2016-2032
- 4.1. North America Bubble Tea Kit Market Analysis, 2016-2021
- 4.2. North America Bubble Tea Kit Market Opportunity and Forecast, 2023-2032
- 4.3. North America Bubble Tea Kit Market Analysis, Opportunity and Forecast, By By Type, 2016-2032
- 4.3.1. North America Bubble Tea Kit Market Analysis by By Type: Introduction
- 4.3.2. Market Size Absolute $ Opportunity Analysis and Forecast, By By Type, 2016-2032
- 4.3.3. Black Tea
- 4.3.4. Green Tea
- 4.3.5. Oolong Tea
- 4.3.6. White Tea
- 4.4. North America Bubble Tea Kit Market Analysis, Opportunity and Forecast, By By Flavor, 2016-2032
- 4.4.1. North America Bubble Tea Kit Market Analysis by By Flavor: Introduction
- 4.4.2. Market Size Absolute $ Opportunity Analysis and Forecast, By By Flavor, 2016-2032
- 4.4.3. Fruit
- 4.4.4. Original
- 4.4.5. Chocolate
- 4.4.6. Coffee
- 4.4.7. Others
- 4.5. North America Bubble Tea Kit Market Analysis, Opportunity and Forecast, By By End-use, 2016-2032
- 4.5.1. North America Bubble Tea Kit Market Analysis by By End-use: Introduction
- 4.5.2. Market Size Absolute $ Opportunity Analysis and Forecast, By By End-use, 2016-2032
- 4.5.3. Households
- 4.5.4. Commercial
- 4.6. North America Bubble Tea Kit Market Analysis, Opportunity and Forecast, By By Distribution Channel, 2016-2032
- 4.6.1. North America Bubble Tea Kit Market Analysis by By Distribution Channel: Introduction
- 4.6.2. Market Size Absolute $ Opportunity Analysis and Forecast, By By Distribution Channel, 2016-2032
- 4.6.3. Supermarkets/Hypermarkets
- 4.6.4. Online Retail
- 4.6.5. Health Food Stores
- 4.6.6. Pharmacies
- 4.6.7. Specialty Stores
- 4.7. North America Bubble Tea Kit Market Analysis, Opportunity and Forecast, By Country , 2016-2032
- 4.7.1. North America Bubble Tea Kit Market Analysis by Country : Introduction
- 4.7.2. Market Size Absolute $ Opportunity Analysis and Forecast, Country , 2016-2032
- 4.7.2.1. The US
- 4.7.2.2. Canada
- 4.7.2.3. Mexico
- 5. Western Europe Bubble Tea Kit Market Analysis, Opportunity and Forecast, 2016-2032
- 5.1. Western Europe Bubble Tea Kit Market Analysis, 2016-2021
- 5.2. Western Europe Bubble Tea Kit Market Opportunity and Forecast, 2023-2032
- 5.3. Western Europe Bubble Tea Kit Market Analysis, Opportunity and Forecast, By By Type, 2016-2032
- 5.3.1. Western Europe Bubble Tea Kit Market Analysis by By Type: Introduction
- 5.3.2. Market Size Absolute $ Opportunity Analysis and Forecast, By By Type, 2016-2032
- 5.3.3. Black Tea
- 5.3.4. Green Tea
- 5.3.5. Oolong Tea
- 5.3.6. White Tea
- 5.4. Western Europe Bubble Tea Kit Market Analysis, Opportunity and Forecast, By By Flavor, 2016-2032
- 5.4.1. Western Europe Bubble Tea Kit Market Analysis by By Flavor: Introduction
- 5.4.2. Market Size Absolute $ Opportunity Analysis and Forecast, By By Flavor, 2016-2032
- 5.4.3. Fruit
- 5.4.4. Original
- 5.4.5. Chocolate
- 5.4.6. Coffee
- 5.4.7. Others
- 5.5. Western Europe Bubble Tea Kit Market Analysis, Opportunity and Forecast, By By End-use, 2016-2032
- 5.5.1. Western Europe Bubble Tea Kit Market Analysis by By End-use: Introduction
- 5.5.2. Market Size Absolute $ Opportunity Analysis and Forecast, By By End-use, 2016-2032
- 5.5.3. Households
- 5.5.4. Commercial
- 5.6. Western Europe Bubble Tea Kit Market Analysis, Opportunity and Forecast, By By Distribution Channel, 2016-2032
- 5.6.1. Western Europe Bubble Tea Kit Market Analysis by By Distribution Channel: Introduction
- 5.6.2. Market Size Absolute $ Opportunity Analysis and Forecast, By By Distribution Channel, 2016-2032
- 5.6.3. Supermarkets/Hypermarkets
- 5.6.4. Online Retail
- 5.6.5. Health Food Stores
- 5.6.6. Pharmacies
- 5.6.7. Specialty Stores
- 5.7. Western Europe Bubble Tea Kit Market Analysis, Opportunity and Forecast, By Country , 2016-2032
- 5.7.1. Western Europe Bubble Tea Kit Market Analysis by Country : Introduction
- 5.7.2. Market Size Absolute $ Opportunity Analysis and Forecast, Country , 2016-2032
- 5.7.2.1. Germany
- 5.7.2.2. France
- 5.7.2.3. The UK
- 5.7.2.4. Spain
- 5.7.2.5. Italy
- 5.7.2.6. Portugal
- 5.7.2.7. Ireland
- 5.7.2.8. Austria
- 5.7.2.9. Switzerland
- 5.7.2.10. Benelux
- 5.7.2.11. Nordic
- 5.7.2.12. Rest of Western Europe
- 6. Eastern Europe Bubble Tea Kit Market Analysis, Opportunity and Forecast, 2016-2032
- 6.1. Eastern Europe Bubble Tea Kit Market Analysis, 2016-2021
- 6.2. Eastern Europe Bubble Tea Kit Market Opportunity and Forecast, 2023-2032
- 6.3. Eastern Europe Bubble Tea Kit Market Analysis, Opportunity and Forecast, By By Type, 2016-2032
- 6.3.1. Eastern Europe Bubble Tea Kit Market Analysis by By Type: Introduction
- 6.3.2. Market Size Absolute $ Opportunity Analysis and Forecast, By By Type, 2016-2032
- 6.3.3. Black Tea
- 6.3.4. Green Tea
- 6.3.5. Oolong Tea
- 6.3.6. White Tea
- 6.4. Eastern Europe Bubble Tea Kit Market Analysis, Opportunity and Forecast, By By Flavor, 2016-2032
- 6.4.1. Eastern Europe Bubble Tea Kit Market Analysis by By Flavor: Introduction
- 6.4.2. Market Size Absolute $ Opportunity Analysis and Forecast, By By Flavor, 2016-2032
- 6.4.3. Fruit
- 6.4.4. Original
- 6.4.5. Chocolate
- 6.4.6. Coffee
- 6.4.7. Others
- 6.5. Eastern Europe Bubble Tea Kit Market Analysis, Opportunity and Forecast, By By End-use, 2016-2032
- 6.5.1. Eastern Europe Bubble Tea Kit Market Analysis by By End-use: Introduction
- 6.5.2. Market Size Absolute $ Opportunity Analysis and Forecast, By By End-use, 2016-2032
- 6.5.3. Households
- 6.5.4. Commercial
- 6.6. Eastern Europe Bubble Tea Kit Market Analysis, Opportunity and Forecast, By By Distribution Channel, 2016-2032
- 6.6.1. Eastern Europe Bubble Tea Kit Market Analysis by By Distribution Channel: Introduction
- 6.6.2. Market Size Absolute $ Opportunity Analysis and Forecast, By By Distribution Channel, 2016-2032
- 6.6.3. Supermarkets/Hypermarkets
- 6.6.4. Online Retail
- 6.6.5. Health Food Stores
- 6.6.6. Pharmacies
- 6.6.7. Specialty Stores
- 6.7. Eastern Europe Bubble Tea Kit Market Analysis, Opportunity and Forecast, By Country , 2016-2032
- 6.7.1. Eastern Europe Bubble Tea Kit Market Analysis by Country : Introduction
- 6.7.2. Market Size Absolute $ Opportunity Analysis and Forecast, Country , 2016-2032
- 6.7.2.1. Russia
- 6.7.2.2. Poland
- 6.7.2.3. The Czech Republic
- 6.7.2.4. Greece
- 6.7.2.5. Rest of Eastern Europe
- 7. APAC Bubble Tea Kit Market Analysis, Opportunity and Forecast, 2016-2032
- 7.1. APAC Bubble Tea Kit Market Analysis, 2016-2021
- 7.2. APAC Bubble Tea Kit Market Opportunity and Forecast, 2023-2032
- 7.3. APAC Bubble Tea Kit Market Analysis, Opportunity and Forecast, By By Type, 2016-2032
- 7.3.1. APAC Bubble Tea Kit Market Analysis by By Type: Introduction
- 7.3.2. Market Size Absolute $ Opportunity Analysis and Forecast, By By Type, 2016-2032
- 7.3.3. Black Tea
- 7.3.4. Green Tea
- 7.3.5. Oolong Tea
- 7.3.6. White Tea
- 7.4. APAC Bubble Tea Kit Market Analysis, Opportunity and Forecast, By By Flavor, 2016-2032
- 7.4.1. APAC Bubble Tea Kit Market Analysis by By Flavor: Introduction
- 7.4.2. Market Size Absolute $ Opportunity Analysis and Forecast, By By Flavor, 2016-2032
- 7.4.3. Fruit
- 7.4.4. Original
- 7.4.5. Chocolate
- 7.4.6. Coffee
- 7.4.7. Others
- 7.5. APAC Bubble Tea Kit Market Analysis, Opportunity and Forecast, By By End-use, 2016-2032
- 7.5.1. APAC Bubble Tea Kit Market Analysis by By End-use: Introduction
- 7.5.2. Market Size Absolute $ Opportunity Analysis and Forecast, By By End-use, 2016-2032
- 7.5.3. Households
- 7.5.4. Commercial
- 7.6. APAC Bubble Tea Kit Market Analysis, Opportunity and Forecast, By By Distribution Channel, 2016-2032
- 7.6.1. APAC Bubble Tea Kit Market Analysis by By Distribution Channel: Introduction
- 7.6.2. Market Size Absolute $ Opportunity Analysis and Forecast, By By Distribution Channel, 2016-2032
- 7.6.3. Supermarkets/Hypermarkets
- 7.6.4. Online Retail
- 7.6.5. Health Food Stores
- 7.6.6. Pharmacies
- 7.6.7. Specialty Stores
- 7.7. APAC Bubble Tea Kit Market Analysis, Opportunity and Forecast, By Country , 2016-2032
- 7.7.1. APAC Bubble Tea Kit Market Analysis by Country : Introduction
- 7.7.2. Market Size Absolute $ Opportunity Analysis and Forecast, Country , 2016-2032
- 7.7.2.1. China
- 7.7.2.2. Japan
- 7.7.2.3. South Korea
- 7.7.2.4. India
- 7.7.2.5. Australia & New Zeland
- 7.7.2.6. Indonesia
- 7.7.2.7. Malaysia
- 7.7.2.8. Philippines
- 7.7.2.9. Singapore
- 7.7.2.10. Thailand
- 7.7.2.11. Vietnam
- 7.7.2.12. Rest of APAC
- 8. Latin America Bubble Tea Kit Market Analysis, Opportunity and Forecast, 2016-2032
- 8.1. Latin America Bubble Tea Kit Market Analysis, 2016-2021
- 8.2. Latin America Bubble Tea Kit Market Opportunity and Forecast, 2023-2032
- 8.3. Latin America Bubble Tea Kit Market Analysis, Opportunity and Forecast, By By Type, 2016-2032
- 8.3.1. Latin America Bubble Tea Kit Market Analysis by By Type: Introduction
- 8.3.2. Market Size Absolute $ Opportunity Analysis and Forecast, By By Type, 2016-2032
- 8.3.3. Black Tea
- 8.3.4. Green Tea
- 8.3.5. Oolong Tea
- 8.3.6. White Tea
- 8.4. Latin America Bubble Tea Kit Market Analysis, Opportunity and Forecast, By By Flavor, 2016-2032
- 8.4.1. Latin America Bubble Tea Kit Market Analysis by By Flavor: Introduction
- 8.4.2. Market Size Absolute $ Opportunity Analysis and Forecast, By By Flavor, 2016-2032
- 8.4.3. Fruit
- 8.4.4. Original
- 8.4.5. Chocolate
- 8.4.6. Coffee
- 8.4.7. Others
- 8.5. Latin America Bubble Tea Kit Market Analysis, Opportunity and Forecast, By By End-use, 2016-2032
- 8.5.1. Latin America Bubble Tea Kit Market Analysis by By End-use: Introduction
- 8.5.2. Market Size Absolute $ Opportunity Analysis and Forecast, By By End-use, 2016-2032
- 8.5.3. Households
- 8.5.4. Commercial
- 8.6. Latin America Bubble Tea Kit Market Analysis, Opportunity and Forecast, By By Distribution Channel, 2016-2032
- 8.6.1. Latin America Bubble Tea Kit Market Analysis by By Distribution Channel: Introduction
- 8.6.2. Market Size Absolute $ Opportunity Analysis and Forecast, By By Distribution Channel, 2016-2032
- 8.6.3. Supermarkets/Hypermarkets
- 8.6.4. Online Retail
- 8.6.5. Health Food Stores
- 8.6.6. Pharmacies
- 8.6.7. Specialty Stores
- 8.7. Latin America Bubble Tea Kit Market Analysis, Opportunity and Forecast, By Country , 2016-2032
- 8.7.1. Latin America Bubble Tea Kit Market Analysis by Country : Introduction
- 8.7.2. Market Size Absolute $ Opportunity Analysis and Forecast, Country , 2016-2032
- 8.7.2.1. Brazil
- 8.7.2.2. Colombia
- 8.7.2.3. Chile
- 8.7.2.4. Argentina
- 8.7.2.5. Costa Rica
- 8.7.2.6. Rest of Latin America
- 9. Middle East & Africa Bubble Tea Kit Market Analysis, Opportunity and Forecast, 2016-2032
- 9.1. Middle East & Africa Bubble Tea Kit Market Analysis, 2016-2021
- 9.2. Middle East & Africa Bubble Tea Kit Market Opportunity and Forecast, 2023-2032
- 9.3. Middle East & Africa Bubble Tea Kit Market Analysis, Opportunity and Forecast, By By Type, 2016-2032
- 9.3.1. Middle East & Africa Bubble Tea Kit Market Analysis by By Type: Introduction
- 9.3.2. Market Size Absolute $ Opportunity Analysis and Forecast, By By Type, 2016-2032
- 9.3.3. Black Tea
- 9.3.4. Green Tea
- 9.3.5. Oolong Tea
- 9.3.6. White Tea
- 9.4. Middle East & Africa Bubble Tea Kit Market Analysis, Opportunity and Forecast, By By Flavor, 2016-2032
- 9.4.1. Middle East & Africa Bubble Tea Kit Market Analysis by By Flavor: Introduction
- 9.4.2. Market Size Absolute $ Opportunity Analysis and Forecast, By By Flavor, 2016-2032
- 9.4.3. Fruit
- 9.4.4. Original
- 9.4.5. Chocolate
- 9.4.6. Coffee
- 9.4.7. Others
- 9.5. Middle East & Africa Bubble Tea Kit Market Analysis, Opportunity and Forecast, By By End-use, 2016-2032
- 9.5.1. Middle East & Africa Bubble Tea Kit Market Analysis by By End-use: Introduction
- 9.5.2. Market Size Absolute $ Opportunity Analysis and Forecast, By By End-use, 2016-2032
- 9.5.3. Households
- 9.5.4. Commercial
- 9.6. Middle East & Africa Bubble Tea Kit Market Analysis, Opportunity and Forecast, By By Distribution Channel, 2016-2032
- 9.6.1. Middle East & Africa Bubble Tea Kit Market Analysis by By Distribution Channel: Introduction
- 9.6.2. Market Size Absolute $ Opportunity Analysis and Forecast, By By Distribution Channel, 2016-2032
- 9.6.3. Supermarkets/Hypermarkets
- 9.6.4. Online Retail
- 9.6.5. Health Food Stores
- 9.6.6. Pharmacies
- 9.6.7. Specialty Stores
- 9.7. Middle East & Africa Bubble Tea Kit Market Analysis, Opportunity and Forecast, By Country , 2016-2032
- 9.7.1. Middle East & Africa Bubble Tea Kit Market Analysis by Country : Introduction
- 9.7.2. Market Size Absolute $ Opportunity Analysis and Forecast, Country , 2016-2032
- 9.7.2.1. Algeria
- 9.7.2.2. Egypt
- 9.7.2.3. Israel
- 9.7.2.4. Kuwait
- 9.7.2.5. Nigeria
- 9.7.2.6. Saudi Arabia
- 9.7.2.7. South Africa
- 9.7.2.8. Turkey
- 9.7.2.9. The UAE
- 9.7.2.10. Rest of MEA
- 10. Global Bubble Tea Kit Market Analysis, Opportunity and Forecast, By Region , 2016-2032
- 10.1. Global Bubble Tea Kit Market Analysis by Region : Introduction
- 10.2. Market Size Absolute $ Opportunity Analysis and Forecast, By Region , 2016-2032
- 10.2.1. North America
- 10.2.2. Western Europe
- 10.2.3. Eastern Europe
- 10.2.4. APAC
- 10.2.5. Latin America
- 10.2.6. Middle East & Africa
- 11. Global Bubble Tea Kit Market Competitive Landscape, Market Share Analysis, and Company Profiles
- 11.1. Market Share Analysis
- 11.2. Company Profiles
- 11.3. Biju Bubble Tea Bar
- 11.3.1. Company Overview
- 11.3.2. Financial Highlights
- 11.3.3. Product Portfolio
- 11.3.4. SWOT Analysis
- 11.3.5. Key Strategies and Developments
- 11.4. Boba Guys
- 11.4.1. Company Overview
- 11.4.2. Financial Highlights
- 11.4.3. Product Portfolio
- 11.4.4. SWOT Analysis
- 11.4.5. Key Strategies and Developments
- 11.5. Bober Tea
- 11.5.1. Company Overview
- 11.5.2. Financial Highlights
- 11.5.3. Product Portfolio
- 11.5.4. SWOT Analysis
- 11.5.5. Key Strategies and Developments
- 11.6. Chatime Group
- 11.6.1. Company Overview
- 11.6.2. Financial Highlights
- 11.6.3. Product Portfolio
- 11.6.4. SWOT Analysis
- 11.6.5. Key Strategies and Developments
- 11.7. Chun Shui Tang
- 11.7.1. Company Overview
- 11.7.2. Financial Highlights
- 11.7.3. Product Portfolio
- 11.7.4. SWOT Analysis
- 11.7.5. Key Strategies and Developments
- 11.8. Coco Fresh Tea & Juice
- 11.8.1. Company Overview
- 11.8.2. Financial Highlights
- 11.8.3. Product Portfolio
- 11.8.4. SWOT Analysis
- 11.8.5. Key Strategies and Developments
- 11.9. Comebuy
- 11.9.1. Company Overview
- 11.9.2. Financial Highlights
- 11.9.3. Product Portfolio
- 11.9.4. SWOT Analysis
- 11.9.5. Key Strategies and Developments
- 11.10. Ding Tea
- 11.10.1. Company Overview
- 11.10.2. Financial Highlights
- 11.10.3. Product Portfolio
- 11.10.4. SWOT Analysis
- 11.10.5. Key Strategies and Developments
- 11.11. Gong Cha
- 11.11.1. Company Overview
- 11.11.2. Financial Highlights
- 11.11.3. Product Portfolio
- 11.11.4. SWOT Analysis
- 11.11.5. Key Strategies and Developments
- 11.12. Happy Lemon
- 11.12.1. Company Overview
- 11.12.2. Financial Highlights
- 11.12.3. Product Portfolio
- 11.12.4. SWOT Analysis
- 11.12.5. Key Strategies and Developments
- 11.13.1. Company Overview
- 11.13.2. Financial Highlights
- 11.13.3. Product Portfolio
- 11.13.4. SWOT Analysis
- 11.13.5. Key Strategies and Developments
- 11.14. Heytea
- 11.14.1. Company Overview
- 11.14.2. Financial Highlights
- 11.14.3. Product Portfolio
- 11.14.4. SWOT Analysis
- 11.14.5. Key Strategies and Developments
- 11.15. K.O.I. The Co, LTD.
- 11.15.1. Company Overview
- 11.15.2. Financial Highlights
- 11.15.3. Product Portfolio
- 11.15.4. SWOT Analysis
- 11.15.5. Key Strategies and Developments
- 11.16. Koi Thé
- 11.16.1. Company Overview
- 11.16.2. Financial Highlights
- 11.16.3. Product Portfolio
- 11.16.4. SWOT Analysis
- 11.16.5. Key Strategies and Developments
- 11.17. Lollicup USA, Inc.
- 11.17.1. Company Overview
- 11.17.2. Financial Highlights
- 11.17.3. Product Portfolio
- 11.17.4. SWOT Analysis
- 11.17.5. Key Strategies and Developments
- 11.18. OneZo Tapioca
- 11.18.1. Company Overview
- 11.18.2. Financial Highlights
- 11.18.3. Product Portfolio
- 11.18.4. SWOT Analysis
- 11.18.5. Key Strategies and Developments
- 11.19. Presotea
- 11.19.1. Company Overview
- 11.19.2. Financial Highlights
- 11.19.3. Product Portfolio
- 11.19.4. SWOT Analysis
- 11.19.5. Key Strategies and Developments
- 11.20. Quickly
- 11.20.1. Company Overview
- 11.20.2. Financial Highlights
- 11.20.3. Product Portfolio
- 11.20.4. SWOT Analysis
- 11.20.5. Key Strategies and Developments
- 11.21. Sharetea
- 11.21.1. Company Overview
- 11.21.2. Financial Highlights
- 11.21.3. Product Portfolio
- 11.21.4. SWOT Analysis
- 11.21.5. Key Strategies and Developments
- 11.22. Ten Ren Tea
- 11.22.1. Company Overview
- 11.22.2. Financial Highlights
- 11.22.3. Product Portfolio
- 11.22.4. SWOT Analysis
- 11.22.5. Key Strategies and Developments
- 12. Assumptions and Acronyms
- 13. Research Methodology
- 14. Contact
"
- List of Figures
- "
- Figure 1: Global Bubble Tea Kit Market Revenue (US$ Mn) Market Share by By Type in 2022
- Figure 2: Global Bubble Tea Kit Market Market Attractiveness Analysis by By Type, 2016-2032
- Figure 3: Global Bubble Tea Kit Market Revenue (US$ Mn) Market Share by By Flavorin 2022
- Figure 4: Global Bubble Tea Kit Market Market Attractiveness Analysis by By Flavor, 2016-2032
- Figure 5: Global Bubble Tea Kit Market Revenue (US$ Mn) Market Share by By End-usein 2022
- Figure 6: Global Bubble Tea Kit Market Market Attractiveness Analysis by By End-use, 2016-2032
- Figure 7: Global Bubble Tea Kit Market Revenue (US$ Mn) Market Share by By Distribution Channelin 2022
- Figure 8: Global Bubble Tea Kit Market Market Attractiveness Analysis by By Distribution Channel, 2016-2032
- Figure 9: Global Bubble Tea Kit Market Revenue (US$ Mn) Market Share by Region in 2022
- Figure 10: Global Bubble Tea Kit Market Market Attractiveness Analysis by Region, 2016-2032
- Figure 11: Global Bubble Tea Kit Market Market Revenue (US$ Mn) (2016-2032)
- Figure 12: Global Bubble Tea Kit Market Market Revenue (US$ Mn) Comparison by Region (2016-2032)
- Figure 13: Global Bubble Tea Kit Market Market Revenue (US$ Mn) Comparison by By Type (2016-2032)
- Figure 14: Global Bubble Tea Kit Market Market Revenue (US$ Mn) Comparison by By Flavor (2016-2032)
- Figure 15: Global Bubble Tea Kit Market Market Revenue (US$ Mn) Comparison by By End-use (2016-2032)
- Figure 16: Global Bubble Tea Kit Market Market Revenue (US$ Mn) Comparison by By Distribution Channel (2016-2032)
- Figure 17: Global Bubble Tea Kit Market Market Y-o-Y Growth Rate Comparison by Region (2016-2032)
- Figure 18: Global Bubble Tea Kit Market Market Y-o-Y Growth Rate Comparison by By Type (2016-2032)
- Figure 19: Global Bubble Tea Kit Market Market Y-o-Y Growth Rate Comparison by By Flavor (2016-2032)
- Figure 20: Global Bubble Tea Kit Market Market Y-o-Y Growth Rate Comparison by By End-use (2016-2032)
- Figure 21: Global Bubble Tea Kit Market Market Y-o-Y Growth Rate Comparison by By Distribution Channel (2016-2032)
- Figure 22: Global Bubble Tea Kit Market Market Share Comparison by Region (2016-2032)
- Figure 23: Global Bubble Tea Kit Market Market Share Comparison by By Type (2016-2032)
- Figure 24: Global Bubble Tea Kit Market Market Share Comparison by By Flavor (2016-2032)
- Figure 25: Global Bubble Tea Kit Market Market Share Comparison by By End-use (2016-2032)
- Figure 26: Global Bubble Tea Kit Market Market Share Comparison by By Distribution Channel (2016-2032)
- Figure 27: North America Bubble Tea Kit Market Revenue (US$ Mn) Market Share by By Typein 2022
- Figure 28: North America Bubble Tea Kit Market Market Attractiveness Analysis by By Type, 2016-2032
- Figure 29: North America Bubble Tea Kit Market Revenue (US$ Mn) Market Share by By Flavorin 2022
- Figure 30: North America Bubble Tea Kit Market Market Attractiveness Analysis by By Flavor, 2016-2032
- Figure 31: North America Bubble Tea Kit Market Revenue (US$ Mn) Market Share by By End-usein 2022
- Figure 32: North America Bubble Tea Kit Market Market Attractiveness Analysis by By End-use, 2016-2032
- Figure 33: North America Bubble Tea Kit Market Revenue (US$ Mn) Market Share by By Distribution Channelin 2022
- Figure 34: North America Bubble Tea Kit Market Market Attractiveness Analysis by By Distribution Channel, 2016-2032
- Figure 35: North America Bubble Tea Kit Market Revenue (US$ Mn) Market Share by Country in 2022
- Figure 36: North America Bubble Tea Kit Market Market Attractiveness Analysis by Country, 2016-2032
- Figure 37: North America Bubble Tea Kit Market Market Revenue (US$ Mn) (2016-2032)
- Figure 38: North America Bubble Tea Kit Market Market Revenue (US$ Mn) Comparison by Country (2016-2032)
- Figure 39: North America Bubble Tea Kit Market Market Revenue (US$ Mn) Comparison by By Type (2016-2032)
- Figure 40: North America Bubble Tea Kit Market Market Revenue (US$ Mn) Comparison by By Flavor (2016-2032)
- Figure 41: North America Bubble Tea Kit Market Market Revenue (US$ Mn) Comparison by By End-use (2016-2032)
- Figure 42: North America Bubble Tea Kit Market Market Revenue (US$ Mn) Comparison by By Distribution Channel (2016-2032)
- Figure 43: North America Bubble Tea Kit Market Market Y-o-Y Growth Rate Comparison by Country (2016-2032)
- Figure 44: North America Bubble Tea Kit Market Market Y-o-Y Growth Rate Comparison by By Type (2016-2032)
- Figure 45: North America Bubble Tea Kit Market Market Y-o-Y Growth Rate Comparison by By Flavor (2016-2032)
- Figure 46: North America Bubble Tea Kit Market Market Y-o-Y Growth Rate Comparison by By End-use (2016-2032)
- Figure 47: North America Bubble Tea Kit Market Market Y-o-Y Growth Rate Comparison by By Distribution Channel (2016-2032)
- Figure 48: North America Bubble Tea Kit Market Market Share Comparison by Country (2016-2032)
- Figure 49: North America Bubble Tea Kit Market Market Share Comparison by By Type (2016-2032)
- Figure 50: North America Bubble Tea Kit Market Market Share Comparison by By Flavor (2016-2032)
- Figure 51: North America Bubble Tea Kit Market Market Share Comparison by By End-use (2016-2032)
- Figure 52: North America Bubble Tea Kit Market Market Share Comparison by By Distribution Channel (2016-2032)
- Figure 53: Western Europe Bubble Tea Kit Market Revenue (US$ Mn) Market Share by By Typein 2022
- Figure 54: Western Europe Bubble Tea Kit Market Market Attractiveness Analysis by By Type, 2016-2032
- Figure 55: Western Europe Bubble Tea Kit Market Revenue (US$ Mn) Market Share by By Flavorin 2022
- Figure 56: Western Europe Bubble Tea Kit Market Market Attractiveness Analysis by By Flavor, 2016-2032
- Figure 57: Western Europe Bubble Tea Kit Market Revenue (US$ Mn) Market Share by By End-usein 2022
- Figure 58: Western Europe Bubble Tea Kit Market Market Attractiveness Analysis by By End-use, 2016-2032
- Figure 59: Western Europe Bubble Tea Kit Market Revenue (US$ Mn) Market Share by By Distribution Channelin 2022
- Figure 60: Western Europe Bubble Tea Kit Market Market Attractiveness Analysis by By Distribution Channel, 2016-2032
- Figure 61: Western Europe Bubble Tea Kit Market Revenue (US$ Mn) Market Share by Country in 2022
- Figure 62: Western Europe Bubble Tea Kit Market Market Attractiveness Analysis by Country, 2016-2032
- Figure 63: Western Europe Bubble Tea Kit Market Market Revenue (US$ Mn) (2016-2032)
- Figure 64: Western Europe Bubble Tea Kit Market Market Revenue (US$ Mn) Comparison by Country (2016-2032)
- Figure 65: Western Europe Bubble Tea Kit Market Market Revenue (US$ Mn) Comparison by By Type (2016-2032)
- Figure 66: Western Europe Bubble Tea Kit Market Market Revenue (US$ Mn) Comparison by By Flavor (2016-2032)
- Figure 67: Western Europe Bubble Tea Kit Market Market Revenue (US$ Mn) Comparison by By End-use (2016-2032)
- Figure 68: Western Europe Bubble Tea Kit Market Market Revenue (US$ Mn) Comparison by By Distribution Channel (2016-2032)
- Figure 69: Western Europe Bubble Tea Kit Market Market Y-o-Y Growth Rate Comparison by Country (2016-2032)
- Figure 70: Western Europe Bubble Tea Kit Market Market Y-o-Y Growth Rate Comparison by By Type (2016-2032)
- Figure 71: Western Europe Bubble Tea Kit Market Market Y-o-Y Growth Rate Comparison by By Flavor (2016-2032)
- Figure 72: Western Europe Bubble Tea Kit Market Market Y-o-Y Growth Rate Comparison by By End-use (2016-2032)
- Figure 73: Western Europe Bubble Tea Kit Market Market Y-o-Y Growth Rate Comparison by By Distribution Channel (2016-2032)
- Figure 74: Western Europe Bubble Tea Kit Market Market Share Comparison by Country (2016-2032)
- Figure 75: Western Europe Bubble Tea Kit Market Market Share Comparison by By Type (2016-2032)
- Figure 76: Western Europe Bubble Tea Kit Market Market Share Comparison by By Flavor (2016-2032)
- Figure 77: Western Europe Bubble Tea Kit Market Market Share Comparison by By End-use (2016-2032)
- Figure 78: Western Europe Bubble Tea Kit Market Market Share Comparison by By Distribution Channel (2016-2032)
- Figure 79: Eastern Europe Bubble Tea Kit Market Revenue (US$ Mn) Market Share by By Typein 2022
- Figure 80: Eastern Europe Bubble Tea Kit Market Market Attractiveness Analysis by By Type, 2016-2032
- Figure 81: Eastern Europe Bubble Tea Kit Market Revenue (US$ Mn) Market Share by By Flavorin 2022
- Figure 82: Eastern Europe Bubble Tea Kit Market Market Attractiveness Analysis by By Flavor, 2016-2032
- Figure 83: Eastern Europe Bubble Tea Kit Market Revenue (US$ Mn) Market Share by By End-usein 2022
- Figure 84: Eastern Europe Bubble Tea Kit Market Market Attractiveness Analysis by By End-use, 2016-2032
- Figure 85: Eastern Europe Bubble Tea Kit Market Revenue (US$ Mn) Market Share by By Distribution Channelin 2022
- Figure 86: Eastern Europe Bubble Tea Kit Market Market Attractiveness Analysis by By Distribution Channel, 2016-2032
- Figure 87: Eastern Europe Bubble Tea Kit Market Revenue (US$ Mn) Market Share by Country in 2022
- Figure 88: Eastern Europe Bubble Tea Kit Market Market Attractiveness Analysis by Country, 2016-2032
- Figure 89: Eastern Europe Bubble Tea Kit Market Market Revenue (US$ Mn) (2016-2032)
- Figure 90: Eastern Europe Bubble Tea Kit Market Market Revenue (US$ Mn) Comparison by Country (2016-2032)
- Figure 91: Eastern Europe Bubble Tea Kit Market Market Revenue (US$ Mn) Comparison by By Type (2016-2032)
- Figure 92: Eastern Europe Bubble Tea Kit Market Market Revenue (US$ Mn) Comparison by By Flavor (2016-2032)
- Figure 93: Eastern Europe Bubble Tea Kit Market Market Revenue (US$ Mn) Comparison by By End-use (2016-2032)
- Figure 94: Eastern Europe Bubble Tea Kit Market Market Revenue (US$ Mn) Comparison by By Distribution Channel (2016-2032)
- Figure 95: Eastern Europe Bubble Tea Kit Market Market Y-o-Y Growth Rate Comparison by Country (2016-2032)
- Figure 96: Eastern Europe Bubble Tea Kit Market Market Y-o-Y Growth Rate Comparison by By Type (2016-2032)
- Figure 97: Eastern Europe Bubble Tea Kit Market Market Y-o-Y Growth Rate Comparison by By Flavor (2016-2032)
- Figure 98: Eastern Europe Bubble Tea Kit Market Market Y-o-Y Growth Rate Comparison by By End-use (2016-2032)
- Figure 99: Eastern Europe Bubble Tea Kit Market Market Y-o-Y Growth Rate Comparison by By Distribution Channel (2016-2032)
- Figure 100: Eastern Europe Bubble Tea Kit Market Market Share Comparison by Country (2016-2032)
- Figure 101: Eastern Europe Bubble Tea Kit Market Market Share Comparison by By Type (2016-2032)
- Figure 102: Eastern Europe Bubble Tea Kit Market Market Share Comparison by By Flavor (2016-2032)
- Figure 103: Eastern Europe Bubble Tea Kit Market Market Share Comparison by By End-use (2016-2032)
- Figure 104: Eastern Europe Bubble Tea Kit Market Market Share Comparison by By Distribution Channel (2016-2032)
- Figure 105: APAC Bubble Tea Kit Market Revenue (US$ Mn) Market Share by By Typein 2022
- Figure 106: APAC Bubble Tea Kit Market Market Attractiveness Analysis by By Type, 2016-2032
- Figure 107: APAC Bubble Tea Kit Market Revenue (US$ Mn) Market Share by By Flavorin 2022
- Figure 108: APAC Bubble Tea Kit Market Market Attractiveness Analysis by By Flavor, 2016-2032
- Figure 109: APAC Bubble Tea Kit Market Revenue (US$ Mn) Market Share by By End-usein 2022
- Figure 110: APAC Bubble Tea Kit Market Market Attractiveness Analysis by By End-use, 2016-2032
- Figure 111: APAC Bubble Tea Kit Market Revenue (US$ Mn) Market Share by By Distribution Channelin 2022
- Figure 112: APAC Bubble Tea Kit Market Market Attractiveness Analysis by By Distribution Channel, 2016-2032
- Figure 113: APAC Bubble Tea Kit Market Revenue (US$ Mn) Market Share by Country in 2022
- Figure 114: APAC Bubble Tea Kit Market Market Attractiveness Analysis by Country, 2016-2032
- Figure 115: APAC Bubble Tea Kit Market Market Revenue (US$ Mn) (2016-2032)
- Figure 116: APAC Bubble Tea Kit Market Market Revenue (US$ Mn) Comparison by Country (2016-2032)
- Figure 117: APAC Bubble Tea Kit Market Market Revenue (US$ Mn) Comparison by By Type (2016-2032)
- Figure 118: APAC Bubble Tea Kit Market Market Revenue (US$ Mn) Comparison by By Flavor (2016-2032)
- Figure 119: APAC Bubble Tea Kit Market Market Revenue (US$ Mn) Comparison by By End-use (2016-2032)
- Figure 120: APAC Bubble Tea Kit Market Market Revenue (US$ Mn) Comparison by By Distribution Channel (2016-2032)
- Figure 121: APAC Bubble Tea Kit Market Market Y-o-Y Growth Rate Comparison by Country (2016-2032)
- Figure 122: APAC Bubble Tea Kit Market Market Y-o-Y Growth Rate Comparison by By Type (2016-2032)
- Figure 123: APAC Bubble Tea Kit Market Market Y-o-Y Growth Rate Comparison by By Flavor (2016-2032)
- Figure 124: APAC Bubble Tea Kit Market Market Y-o-Y Growth Rate Comparison by By End-use (2016-2032)
- Figure 125: APAC Bubble Tea Kit Market Market Y-o-Y Growth Rate Comparison by By Distribution Channel (2016-2032)
- Figure 126: APAC Bubble Tea Kit Market Market Share Comparison by Country (2016-2032)
- Figure 127: APAC Bubble Tea Kit Market Market Share Comparison by By Type (2016-2032)
- Figure 128: APAC Bubble Tea Kit Market Market Share Comparison by By Flavor (2016-2032)
- Figure 129: APAC Bubble Tea Kit Market Market Share Comparison by By End-use (2016-2032)
- Figure 130: APAC Bubble Tea Kit Market Market Share Comparison by By Distribution Channel (2016-2032)
- Figure 131: Latin America Bubble Tea Kit Market Revenue (US$ Mn) Market Share by By Typein 2022
- Figure 132: Latin America Bubble Tea Kit Market Market Attractiveness Analysis by By Type, 2016-2032
- Figure 133: Latin America Bubble Tea Kit Market Revenue (US$ Mn) Market Share by By Flavorin 2022
- Figure 134: Latin America Bubble Tea Kit Market Market Attractiveness Analysis by By Flavor, 2016-2032
- Figure 135: Latin America Bubble Tea Kit Market Revenue (US$ Mn) Market Share by By End-usein 2022
- Figure 136: Latin America Bubble Tea Kit Market Market Attractiveness Analysis by By End-use, 2016-2032
- Figure 137: Latin America Bubble Tea Kit Market Revenue (US$ Mn) Market Share by By Distribution Channelin 2022
- Figure 138: Latin America Bubble Tea Kit Market Market Attractiveness Analysis by By Distribution Channel, 2016-2032
- Figure 139: Latin America Bubble Tea Kit Market Revenue (US$ Mn) Market Share by Country in 2022
- Figure 140: Latin America Bubble Tea Kit Market Market Attractiveness Analysis by Country, 2016-2032
- Figure 141: Latin America Bubble Tea Kit Market Market Revenue (US$ Mn) (2016-2032)
- Figure 142: Latin America Bubble Tea Kit Market Market Revenue (US$ Mn) Comparison by Country (2016-2032)
- Figure 143: Latin America Bubble Tea Kit Market Market Revenue (US$ Mn) Comparison by By Type (2016-2032)
- Figure 144: Latin America Bubble Tea Kit Market Market Revenue (US$ Mn) Comparison by By Flavor (2016-2032)
- Figure 145: Latin America Bubble Tea Kit Market Market Revenue (US$ Mn) Comparison by By End-use (2016-2032)
- Figure 146: Latin America Bubble Tea Kit Market Market Revenue (US$ Mn) Comparison by By Distribution Channel (2016-2032)
- Figure 147: Latin America Bubble Tea Kit Market Market Y-o-Y Growth Rate Comparison by Country (2016-2032)
- Figure 148: Latin America Bubble Tea Kit Market Market Y-o-Y Growth Rate Comparison by By Type (2016-2032)
- Figure 149: Latin America Bubble Tea Kit Market Market Y-o-Y Growth Rate Comparison by By Flavor (2016-2032)
- Figure 150: Latin America Bubble Tea Kit Market Market Y-o-Y Growth Rate Comparison by By End-use (2016-2032)
- Figure 151: Latin America Bubble Tea Kit Market Market Y-o-Y Growth Rate Comparison by By Distribution Channel (2016-2032)
- Figure 152: Latin America Bubble Tea Kit Market Market Share Comparison by Country (2016-2032)
- Figure 153: Latin America Bubble Tea Kit Market Market Share Comparison by By Type (2016-2032)
- Figure 154: Latin America Bubble Tea Kit Market Market Share Comparison by By Flavor (2016-2032)
- Figure 155: Latin America Bubble Tea Kit Market Market Share Comparison by By End-use (2016-2032)
- Figure 156: Latin America Bubble Tea Kit Market Market Share Comparison by By Distribution Channel (2016-2032)
- Figure 157: Middle East & Africa Bubble Tea Kit Market Revenue (US$ Mn) Market Share by By Typein 2022
- Figure 158: Middle East & Africa Bubble Tea Kit Market Market Attractiveness Analysis by By Type, 2016-2032
- Figure 159: Middle East & Africa Bubble Tea Kit Market Revenue (US$ Mn) Market Share by By Flavorin 2022
- Figure 160: Middle East & Africa Bubble Tea Kit Market Market Attractiveness Analysis by By Flavor, 2016-2032
- Figure 161: Middle East & Africa Bubble Tea Kit Market Revenue (US$ Mn) Market Share by By End-usein 2022
- Figure 162: Middle East & Africa Bubble Tea Kit Market Market Attractiveness Analysis by By End-use, 2016-2032
- Figure 163: Middle East & Africa Bubble Tea Kit Market Revenue (US$ Mn) Market Share by By Distribution Channelin 2022
- Figure 164: Middle East & Africa Bubble Tea Kit Market Market Attractiveness Analysis by By Distribution Channel, 2016-2032
- Figure 165: Middle East & Africa Bubble Tea Kit Market Revenue (US$ Mn) Market Share by Country in 2022
- Figure 166: Middle East & Africa Bubble Tea Kit Market Market Attractiveness Analysis by Country, 2016-2032
- Figure 167: Middle East & Africa Bubble Tea Kit Market Market Revenue (US$ Mn) (2016-2032)
- Figure 168: Middle East & Africa Bubble Tea Kit Market Market Revenue (US$ Mn) Comparison by Country (2016-2032)
- Figure 169: Middle East & Africa Bubble Tea Kit Market Market Revenue (US$ Mn) Comparison by By Type (2016-2032)
- Figure 170: Middle East & Africa Bubble Tea Kit Market Market Revenue (US$ Mn) Comparison by By Flavor (2016-2032)
- Figure 171: Middle East & Africa Bubble Tea Kit Market Market Revenue (US$ Mn) Comparison by By End-use (2016-2032)
- Figure 172: Middle East & Africa Bubble Tea Kit Market Market Revenue (US$ Mn) Comparison by By Distribution Channel (2016-2032)
- Figure 173: Middle East & Africa Bubble Tea Kit Market Market Y-o-Y Growth Rate Comparison by Country (2016-2032)
- Figure 174: Middle East & Africa Bubble Tea Kit Market Market Y-o-Y Growth Rate Comparison by By Type (2016-2032)
- Figure 175: Middle East & Africa Bubble Tea Kit Market Market Y-o-Y Growth Rate Comparison by By Flavor (2016-2032)
- Figure 176: Middle East & Africa Bubble Tea Kit Market Market Y-o-Y Growth Rate Comparison by By End-use (2016-2032)
- Figure 177: Middle East & Africa Bubble Tea Kit Market Market Y-o-Y Growth Rate Comparison by By Distribution Channel (2016-2032)
- Figure 178: Middle East & Africa Bubble Tea Kit Market Market Share Comparison by Country (2016-2032)
- Figure 179: Middle East & Africa Bubble Tea Kit Market Market Share Comparison by By Type (2016-2032)
- Figure 180: Middle East & Africa Bubble Tea Kit Market Market Share Comparison by By Flavor (2016-2032)
- Figure 181: Middle East & Africa Bubble Tea Kit Market Market Share Comparison by By End-use (2016-2032)
- Figure 182: Middle East & Africa Bubble Tea Kit Market Market Share Comparison by By Distribution Channel (2016-2032)
"
- List of Tables
- "
- Table 1: Global Bubble Tea Kit Market Market Comparison by By Type (2016-2032)
- Table 2: Global Bubble Tea Kit Market Market Comparison by By Flavor (2016-2032)
- Table 3: Global Bubble Tea Kit Market Market Comparison by By End-use (2016-2032)
- Table 4: Global Bubble Tea Kit Market Market Comparison by By Distribution Channel (2016-2032)
- Table 5: Global Bubble Tea Kit Market Revenue (US$ Mn) Comparison by Region (2016-2032)
- Table 6: Global Bubble Tea Kit Market Market Revenue (US$ Mn) (2016-2032)
- Table 7: Global Bubble Tea Kit Market Market Revenue (US$ Mn) Comparison by Region (2016-2032)
- Table 8: Global Bubble Tea Kit Market Market Revenue (US$ Mn) Comparison by By Type (2016-2032)
- Table 9: Global Bubble Tea Kit Market Market Revenue (US$ Mn) Comparison by By Flavor (2016-2032)
- Table 10: Global Bubble Tea Kit Market Market Revenue (US$ Mn) Comparison by By End-use (2016-2032)
- Table 11: Global Bubble Tea Kit Market Market Revenue (US$ Mn) Comparison by By Distribution Channel (2016-2032)
- Table 12: Global Bubble Tea Kit Market Market Y-o-Y Growth Rate Comparison by Region (2016-2032)
- Table 13: Global Bubble Tea Kit Market Market Y-o-Y Growth Rate Comparison by By Type (2016-2032)
- Table 14: Global Bubble Tea Kit Market Market Y-o-Y Growth Rate Comparison by By Flavor (2016-2032)
- Table 15: Global Bubble Tea Kit Market Market Y-o-Y Growth Rate Comparison by By End-use (2016-2032)
- Table 16: Global Bubble Tea Kit Market Market Y-o-Y Growth Rate Comparison by By Distribution Channel (2016-2032)
- Table 17: Global Bubble Tea Kit Market Market Share Comparison by Region (2016-2032)
- Table 18: Global Bubble Tea Kit Market Market Share Comparison by By Type (2016-2032)
- Table 19: Global Bubble Tea Kit Market Market Share Comparison by By Flavor (2016-2032)
- Table 20: Global Bubble Tea Kit Market Market Share Comparison by By End-use (2016-2032)
- Table 21: Global Bubble Tea Kit Market Market Share Comparison by By Distribution Channel (2016-2032)
- Table 22: North America Bubble Tea Kit Market Market Comparison by By Flavor (2016-2032)
- Table 23: North America Bubble Tea Kit Market Market Comparison by By End-use (2016-2032)
- Table 24: North America Bubble Tea Kit Market Market Comparison by By Distribution Channel (2016-2032)
- Table 25: North America Bubble Tea Kit Market Revenue (US$ Mn) Comparison by Country (2016-2032)
- Table 26: North America Bubble Tea Kit Market Market Revenue (US$ Mn) (2016-2032)
- Table 27: North America Bubble Tea Kit Market Market Revenue (US$ Mn) Comparison by Country (2016-2032)
- Table 28: North America Bubble Tea Kit Market Market Revenue (US$ Mn) Comparison by By Type (2016-2032)
- Table 29: North America Bubble Tea Kit Market Market Revenue (US$ Mn) Comparison by By Flavor (2016-2032)
- Table 30: North America Bubble Tea Kit Market Market Revenue (US$ Mn) Comparison by By End-use (2016-2032)
- Table 31: North America Bubble Tea Kit Market Market Revenue (US$ Mn) Comparison by By Distribution Channel (2016-2032)
- Table 32: North America Bubble Tea Kit Market Market Y-o-Y Growth Rate Comparison by Country (2016-2032)
- Table 33: North America Bubble Tea Kit Market Market Y-o-Y Growth Rate Comparison by By Type (2016-2032)
- Table 34: North America Bubble Tea Kit Market Market Y-o-Y Growth Rate Comparison by By Flavor (2016-2032)
- Table 35: North America Bubble Tea Kit Market Market Y-o-Y Growth Rate Comparison by By End-use (2016-2032)
- Table 36: North America Bubble Tea Kit Market Market Y-o-Y Growth Rate Comparison by By Distribution Channel (2016-2032)
- Table 37: North America Bubble Tea Kit Market Market Share Comparison by Country (2016-2032)
- Table 38: North America Bubble Tea Kit Market Market Share Comparison by By Type (2016-2032)
- Table 39: North America Bubble Tea Kit Market Market Share Comparison by By Flavor (2016-2032)
- Table 40: North America Bubble Tea Kit Market Market Share Comparison by By End-use (2016-2032)
- Table 41: North America Bubble Tea Kit Market Market Share Comparison by By Distribution Channel (2016-2032)
- Table 42: Western Europe Bubble Tea Kit Market Market Comparison by By Type (2016-2032)
- Table 43: Western Europe Bubble Tea Kit Market Market Comparison by By Flavor (2016-2032)
- Table 44: Western Europe Bubble Tea Kit Market Market Comparison by By End-use (2016-2032)
- Table 45: Western Europe Bubble Tea Kit Market Market Comparison by By Distribution Channel (2016-2032)
- Table 46: Western Europe Bubble Tea Kit Market Revenue (US$ Mn) Comparison by Country (2016-2032)
- Table 47: Western Europe Bubble Tea Kit Market Market Revenue (US$ Mn) (2016-2032)
- Table 48: Western Europe Bubble Tea Kit Market Market Revenue (US$ Mn) Comparison by Country (2016-2032)
- Table 49: Western Europe Bubble Tea Kit Market Market Revenue (US$ Mn) Comparison by By Type (2016-2032)
- Table 50: Western Europe Bubble Tea Kit Market Market Revenue (US$ Mn) Comparison by By Flavor (2016-2032)
- Table 51: Western Europe Bubble Tea Kit Market Market Revenue (US$ Mn) Comparison by By End-use (2016-2032)
- Table 52: Western Europe Bubble Tea Kit Market Market Revenue (US$ Mn) Comparison by By Distribution Channel (2016-2032)
- Table 53: Western Europe Bubble Tea Kit Market Market Y-o-Y Growth Rate Comparison by Country (2016-2032)
- Table 54: Western Europe Bubble Tea Kit Market Market Y-o-Y Growth Rate Comparison by By Type (2016-2032)
- Table 55: Western Europe Bubble Tea Kit Market Market Y-o-Y Growth Rate Comparison by By Flavor (2016-2032)
- Table 56: Western Europe Bubble Tea Kit Market Market Y-o-Y Growth Rate Comparison by By End-use (2016-2032)
- Table 57: Western Europe Bubble Tea Kit Market Market Y-o-Y Growth Rate Comparison by By Distribution Channel (2016-2032)
- Table 58: Western Europe Bubble Tea Kit Market Market Share Comparison by Country (2016-2032)
- Table 59: Western Europe Bubble Tea Kit Market Market Share Comparison by By Type (2016-2032)
- Table 60: Western Europe Bubble Tea Kit Market Market Share Comparison by By Flavor (2016-2032)
- Table 61: Western Europe Bubble Tea Kit Market Market Share Comparison by By End-use (2016-2032)
- Table 62: Western Europe Bubble Tea Kit Market Market Share Comparison by By Distribution Channel (2016-2032)
- Table 63: Eastern Europe Bubble Tea Kit Market Market Comparison by By Type (2016-2032)
- Table 64: Eastern Europe Bubble Tea Kit Market Market Comparison by By Flavor (2016-2032)
- Table 65: Eastern Europe Bubble Tea Kit Market Market Comparison by By End-use (2016-2032)
- Table 66: Eastern Europe Bubble Tea Kit Market Market Comparison by By Distribution Channel (2016-2032)
- Table 67: Eastern Europe Bubble Tea Kit Market Revenue (US$ Mn) Comparison by Country (2016-2032)
- Table 68: Eastern Europe Bubble Tea Kit Market Market Revenue (US$ Mn) (2016-2032)
- Table 69: Eastern Europe Bubble Tea Kit Market Market Revenue (US$ Mn) Comparison by Country (2016-2032)
- Table 70: Eastern Europe Bubble Tea Kit Market Market Revenue (US$ Mn) Comparison by By Type (2016-2032)
- Table 71: Eastern Europe Bubble Tea Kit Market Market Revenue (US$ Mn) Comparison by By Flavor (2016-2032)
- Table 72: Eastern Europe Bubble Tea Kit Market Market Revenue (US$ Mn) Comparison by By End-use (2016-2032)
- Table 73: Eastern Europe Bubble Tea Kit Market Market Revenue (US$ Mn) Comparison by By Distribution Channel (2016-2032)
- Table 74: Eastern Europe Bubble Tea Kit Market Market Y-o-Y Growth Rate Comparison by Country (2016-2032)
- Table 75: Eastern Europe Bubble Tea Kit Market Market Y-o-Y Growth Rate Comparison by By Type (2016-2032)
- Table 76: Eastern Europe Bubble Tea Kit Market Market Y-o-Y Growth Rate Comparison by By Flavor (2016-2032)
- Table 77: Eastern Europe Bubble Tea Kit Market Market Y-o-Y Growth Rate Comparison by By End-use (2016-2032)
- Table 78: Eastern Europe Bubble Tea Kit Market Market Y-o-Y Growth Rate Comparison by By Distribution Channel (2016-2032)
- Table 79: Eastern Europe Bubble Tea Kit Market Market Share Comparison by Country (2016-2032)
- Table 80: Eastern Europe Bubble Tea Kit Market Market Share Comparison by By Type (2016-2032)
- Table 81: Eastern Europe Bubble Tea Kit Market Market Share Comparison by By Flavor (2016-2032)
- Table 82: Eastern Europe Bubble Tea Kit Market Market Share Comparison by By End-use (2016-2032)
- Table 83: Eastern Europe Bubble Tea Kit Market Market Share Comparison by By Distribution Channel (2016-2032)
- Table 84: APAC Bubble Tea Kit Market Market Comparison by By Type (2016-2032)
- Table 85: APAC Bubble Tea Kit Market Market Comparison by By Flavor (2016-2032)
- Table 86: APAC Bubble Tea Kit Market Market Comparison by By End-use (2016-2032)
- Table 87: APAC Bubble Tea Kit Market Market Comparison by By Distribution Channel (2016-2032)
- Table 88: APAC Bubble Tea Kit Market Revenue (US$ Mn) Comparison by Country (2016-2032)
- Table 89: APAC Bubble Tea Kit Market Market Revenue (US$ Mn) (2016-2032)
- Table 90: APAC Bubble Tea Kit Market Market Revenue (US$ Mn) Comparison by Country (2016-2032)
- Table 91: APAC Bubble Tea Kit Market Market Revenue (US$ Mn) Comparison by By Type (2016-2032)
- Table 92: APAC Bubble Tea Kit Market Market Revenue (US$ Mn) Comparison by By Flavor (2016-2032)
- Table 93: APAC Bubble Tea Kit Market Market Revenue (US$ Mn) Comparison by By End-use (2016-2032)
- Table 94: APAC Bubble Tea Kit Market Market Revenue (US$ Mn) Comparison by By Distribution Channel (2016-2032)
- Table 95: APAC Bubble Tea Kit Market Market Y-o-Y Growth Rate Comparison by Country (2016-2032)
- Table 96: APAC Bubble Tea Kit Market Market Y-o-Y Growth Rate Comparison by By Type (2016-2032)
- Table 97: APAC Bubble Tea Kit Market Market Y-o-Y Growth Rate Comparison by By Flavor (2016-2032)
- Table 98: APAC Bubble Tea Kit Market Market Y-o-Y Growth Rate Comparison by By End-use (2016-2032)
- Table 99: APAC Bubble Tea Kit Market Market Y-o-Y Growth Rate Comparison by By Distribution Channel (2016-2032)
- Table 100: APAC Bubble Tea Kit Market Market Share Comparison by Country (2016-2032)
- Table 101: APAC Bubble Tea Kit Market Market Share Comparison by By Type (2016-2032)
- Table 102: APAC Bubble Tea Kit Market Market Share Comparison by By Flavor (2016-2032)
- Table 103: APAC Bubble Tea Kit Market Market Share Comparison by By End-use (2016-2032)
- Table 104: APAC Bubble Tea Kit Market Market Share Comparison by By Distribution Channel (2016-2032)
- Table 105: Latin America Bubble Tea Kit Market Market Comparison by By Type (2016-2032)
- Table 106: Latin America Bubble Tea Kit Market Market Comparison by By Flavor (2016-2032)
- Table 107: Latin America Bubble Tea Kit Market Market Comparison by By End-use (2016-2032)
- Table 108: Latin America Bubble Tea Kit Market Market Comparison by By Distribution Channel (2016-2032)
- Table 109: Latin America Bubble Tea Kit Market Revenue (US$ Mn) Comparison by Country (2016-2032)
- Table 110: Latin America Bubble Tea Kit Market Market Revenue (US$ Mn) (2016-2032)
- Table 111: Latin America Bubble Tea Kit Market Market Revenue (US$ Mn) Comparison by Country (2016-2032)
- Table 112: Latin America Bubble Tea Kit Market Market Revenue (US$ Mn) Comparison by By Type (2016-2032)
- Table 113: Latin America Bubble Tea Kit Market Market Revenue (US$ Mn) Comparison by By Flavor (2016-2032)
- Table 114: Latin America Bubble Tea Kit Market Market Revenue (US$ Mn) Comparison by By End-use (2016-2032)
- Table 115: Latin America Bubble Tea Kit Market Market Revenue (US$ Mn) Comparison by By Distribution Channel (2016-2032)
- Table 116: Latin America Bubble Tea Kit Market Market Y-o-Y Growth Rate Comparison by Country (2016-2032)
- Table 117: Latin America Bubble Tea Kit Market Market Y-o-Y Growth Rate Comparison by By Type (2016-2032)
- Table 118: Latin America Bubble Tea Kit Market Market Y-o-Y Growth Rate Comparison by By Flavor (2016-2032)
- Table 119: Latin America Bubble Tea Kit Market Market Y-o-Y Growth Rate Comparison by By End-use (2016-2032)
- Table 120: Latin America Bubble Tea Kit Market Market Y-o-Y Growth Rate Comparison by By Distribution Channel (2016-2032)
- Table 121: Latin America Bubble Tea Kit Market Market Share Comparison by Country (2016-2032)
- Table 122: Latin America Bubble Tea Kit Market Market Share Comparison by By Type (2016-2032)
- Table 123: Latin America Bubble Tea Kit Market Market Share Comparison by By Flavor (2016-2032)
- Table 124: Latin America Bubble Tea Kit Market Market Share Comparison by By End-use (2016-2032)
- Table 125: Latin America Bubble Tea Kit Market Market Share Comparison by By Distribution Channel (2016-2032)
- Table 126: Middle East & Africa Bubble Tea Kit Market Market Comparison by By Type (2016-2032)
- Table 127: Middle East & Africa Bubble Tea Kit Market Market Comparison by By Flavor (2016-2032)
- Table 128: Middle East & Africa Bubble Tea Kit Market Market Comparison by By End-use (2016-2032)
- Table 129: Middle East & Africa Bubble Tea Kit Market Market Comparison by By Distribution Channel (2016-2032)
- Table 130: Middle East & Africa Bubble Tea Kit Market Revenue (US$ Mn) Comparison by Country (2016-2032)
- Table 131: Middle East & Africa Bubble Tea Kit Market Market Revenue (US$ Mn) (2016-2032)
- Table 132: Middle East & Africa Bubble Tea Kit Market Market Revenue (US$ Mn) Comparison by Country (2016-2032)
- Table 133: Middle East & Africa Bubble Tea Kit Market Market Revenue (US$ Mn) Comparison by By Type (2016-2032)
- Table 134: Middle East & Africa Bubble Tea Kit Market Market Revenue (US$ Mn) Comparison by By Flavor (2016-2032)
- Table 135: Middle East & Africa Bubble Tea Kit Market Market Revenue (US$ Mn) Comparison by By End-use (2016-2032)
- Table 136: Middle East & Africa Bubble Tea Kit Market Market Revenue (US$ Mn) Comparison by By Distribution Channel (2016-2032)
- Table 137: Middle East & Africa Bubble Tea Kit Market Market Y-o-Y Growth Rate Comparison by Country (2016-2032)
- Table 138: Middle East & Africa Bubble Tea Kit Market Market Y-o-Y Growth Rate Comparison by By Type (2016-2032)
- Table 139: Middle East & Africa Bubble Tea Kit Market Market Y-o-Y Growth Rate Comparison by By Flavor (2016-2032)
- Table 140: Middle East & Africa Bubble Tea Kit Market Market Y-o-Y Growth Rate Comparison by By End-use (2016-2032)
- Table 141: Middle East & Africa Bubble Tea Kit Market Market Y-o-Y Growth Rate Comparison by By Distribution Channel (2016-2032)
- Table 142: Middle East & Africa Bubble Tea Kit Market Market Share Comparison by Country (2016-2032)
- Table 143: Middle East & Africa Bubble Tea Kit Market Market Share Comparison by By Type (2016-2032)
- Table 144: Middle East & Africa Bubble Tea Kit Market Market Share Comparison by By Flavor (2016-2032)
- Table 145: Middle East & Africa Bubble Tea Kit Market Market Share Comparison by By End-use (2016-2032)
- Table 146: Middle East & Africa Bubble Tea Kit Market Market Share Comparison by By Distribution Channel (2016-2032)
- 1. Executive Summary
-
- Biju Bubble Tea Bar
- Boba Guys
- Bober Tea
- Chatime Group
- Chun Shui Tang
- Coco Fresh Tea & Juice
- Comebuy
- Ding Tea
- Gong Cha
- Happy Lemon
- Heytea
- Holdings Corporation
- K.O.I. The Co, LTD.
- Koi Thé
- Lollicup USA, Inc.
- OneZo Tapioca
- Presotea
- Quickly
- Sharetea
- Ten Ren Tea
- The Alley
- Tiger Sugar
- TP Tea
- Vivi Bubble Tea
- Xing Fu Tang
- Yummy Town
Our Clients


View Our Licence Options
