Global Botanical Supplements Market By Source(Herbs, Leaves, Spices, Flowers, Others), By Form(Powder, Liquid, Tablets, Capsules, Gummies, Others), By Application(Energy & Weight Management, General Health, Bone & Joint Health, Gastrointestinal Health, Immunity, Cardiac Health, Diabetes, Anti-cancer, Others), By Distribution Channel(Offline, Online), By Region And Companies - Industry Segment Outlook, Market Assessment, Competition Scenario, Trends, And Forecast 2024-2033
-
47010
-
June 2024
-
300
-


-
This report was compiled by Research Team Research team of over 50 passionate professionals leverages advanced research methodologies and analytical expertise to deliver insightful, data-driven market intelligence that empowers businesses across diverse industries to make strategic, well-informed Correspondence Research Team Linkedin | Detailed Market research Methodology Our methodology involves a mix of primary research, including interviews with leading mental health experts, and secondary research from reputable medical journals and databases. View Detailed Methodology Page
-
Quick Navigation
Report Overview
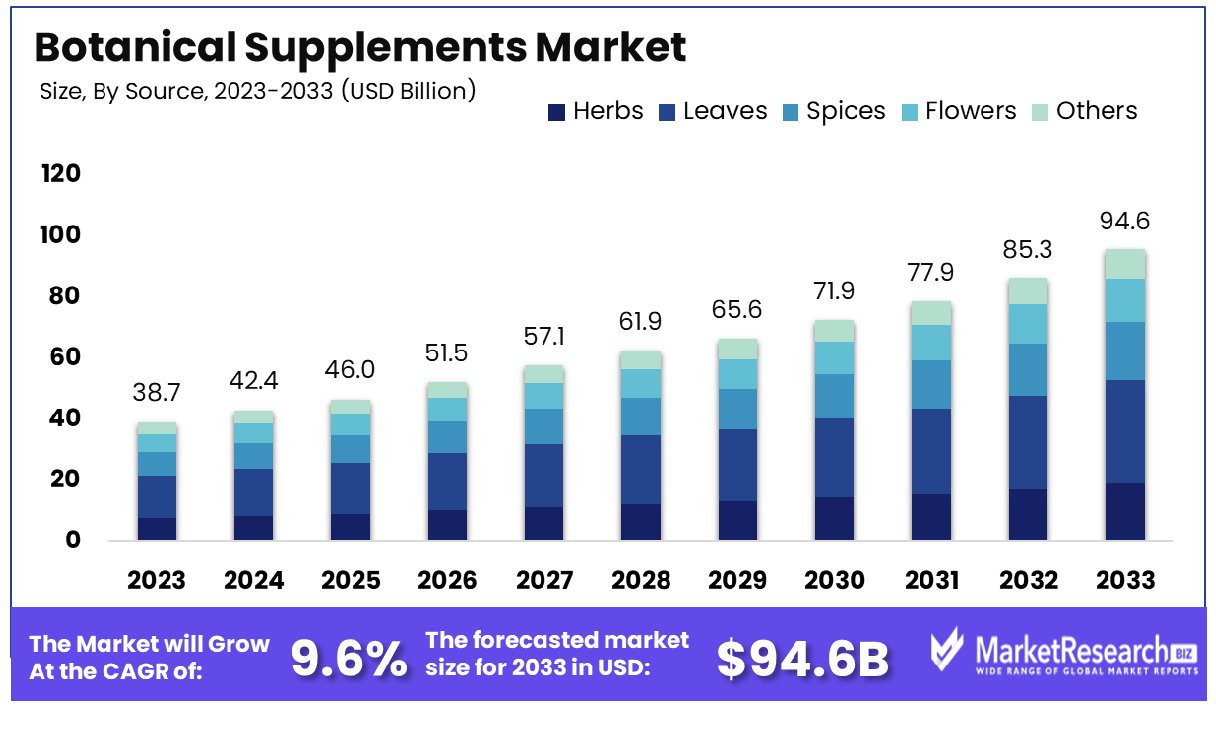
The Global Botanical Supplements Market was valued at USD 38.7 billion in 2023. It is expected to reach USD 94.6 billion by 2033, with a CAGR of 9.6% during the forecast period from 2024 to 2033.
The Botanical Supplements Market encompasses the rapidly evolving sector within the nutraceutical industry that focuses on natural plant-based formulations designed to promote health and wellness. These supplements harness the power of botanical ingredients like herbs, roots, fruits, and seeds, renowned for their therapeutic properties and traditional medicinal uses.
With consumers increasingly seeking natural alternatives to synthetic supplements, this market presents vast opportunities for growth and innovation. As demand surges for holistic health solutions, businesses in this space must leverage scientific research, sustainable sourcing practices, and strategic marketing initiatives to capitalize on this burgeoning market segment.
 The Botanical Supplements Market continues to exhibit robust growth, driven by increasing consumer awareness regarding health and wellness, alongside a growing inclination towards natural and organic products. As consumers prioritize preventive healthcare measures, the demand for botanical supplements, renowned for their purported health benefits and minimal side effects, has surged.
Market research reveals a steady rise in the consumption of dietary supplements over the past three years, with 78.1% of respondents in 2021, 71.6% in 2022, and 72.7% in 2023 incorporating these products into their routines. Among the most prevalent types of dietary supplements consumed are complex vitamins and minerals, omega-3 fatty acids, and fish oil, with consistent patterns observed across the 2022 and 2023 samples.
Despite the promising growth trajectory, there are notable gaps in existing research, particularly regarding the geriatric population. The absence of specific data on adults over 65 years old underscores the need for further investigation into the preferences and consumption patterns of this demographic segment. While current studies primarily focus on the working-age population aged 18-64 years, a deeper understanding of botanical supplement usage among older adults is essential for market players to tailor their products and marketing strategies effectively.
Key Takeaways
- Market Growth: The Global Botanical Supplements Market was valued at USD 38.7 billion in 2023. It is expected to reach USD 94.6 billion by 2033, with a CAGR of 9.6% during the forecast period from 2024 to 2033.
- By Source: Leaves dominated the market with 25.3% share.
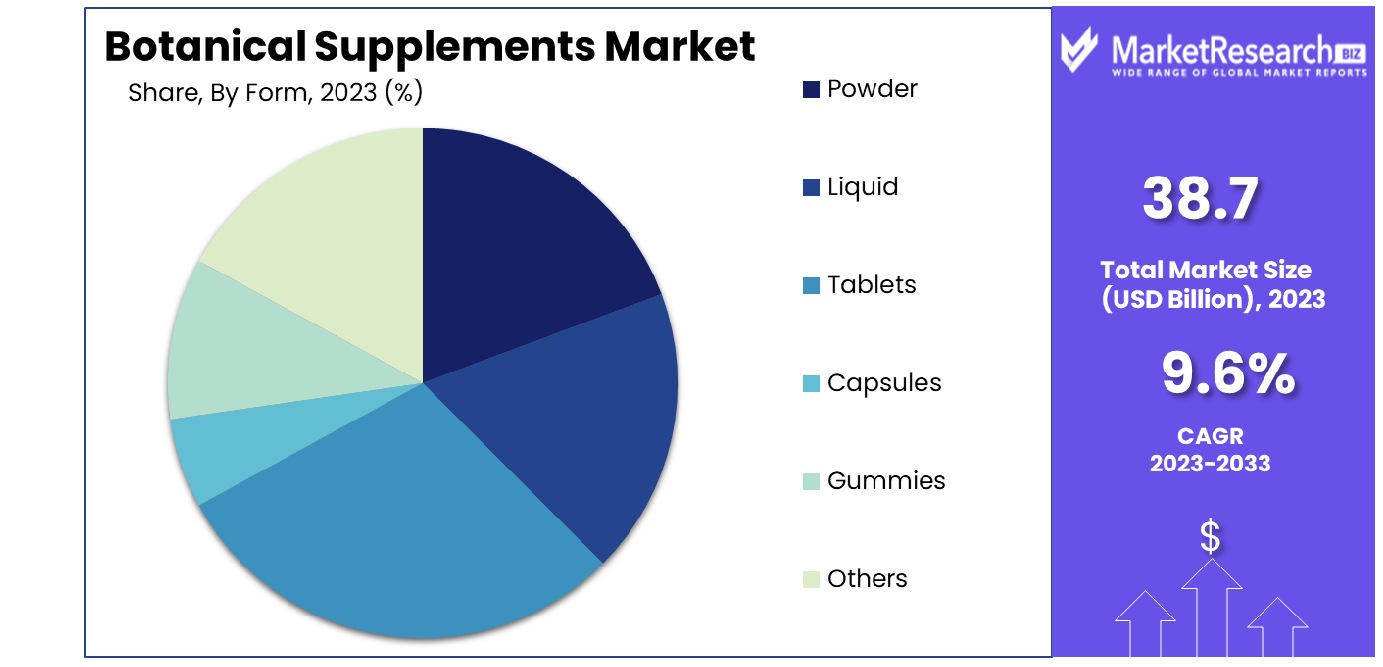
- By Form: Tablets led the market, accounting for 32.2%.
- By Application: Energy & Weight Management held 20.4% of the market share.
- By Distribution Channel: Offline dominated with a substantial 75.2% market share.
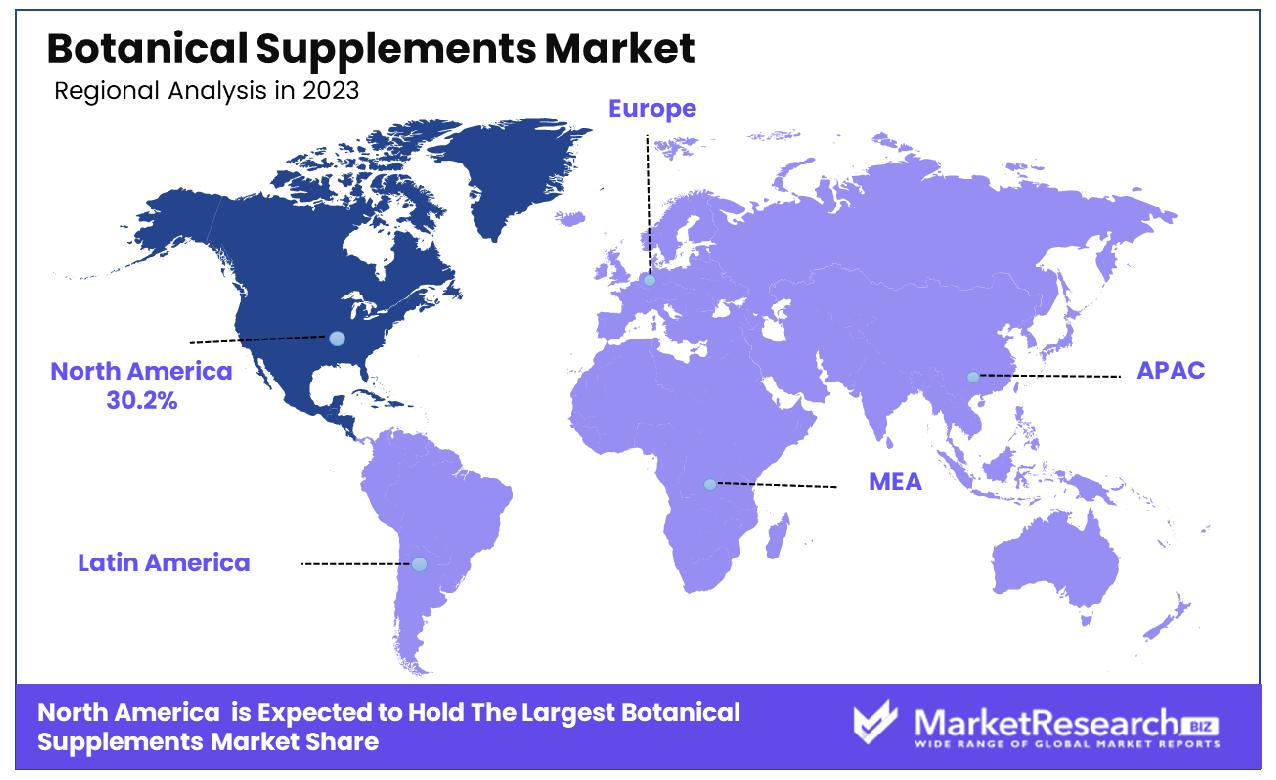
- Regional Dominance: North America holds 30.2% of the botanical supplements market.
- Growth Opportunity: In 2023, the global botanical supplements market will be driven by personalization in formulations and sustainable sourcing. Advances in technology enable customized supplements, while ethical practices in supply chains align with consumer values, boosting market growth and brand reputation.
Driving factors
Increasing Prevalence of Chronic Disorders
As chronic disorders like diabetes, cardiovascular diseases, and obesity continue to rise globally, consumers are increasingly turning to botanical supplements for their perceived health benefits. Botanical supplements often contain compounds with potential therapeutic properties, such as antioxidants and anti-inflammatory agents, which may help manage symptoms or prevent the onset of certain chronic conditions.
According to recent statistics, the global prevalence of chronic diseases is expected to escalate, with conditions like diabetes projected to affect over 700 million people worldwide by 2045. This surge in chronic disorders creates a significant market opportunity for botanical supplements, as consumers seek natural alternatives to traditional pharmaceutical interventions.
Growing Consumer Awareness About Health and Wellness
As consumers become more health-conscious, there is a growing awareness of the importance of preventive healthcare measures and the role of diet and lifestyle in maintaining well-being. This heightened consciousness has led to increased scrutiny of product labels and ingredients, with many individuals opting for plant-based and natural alternatives perceived as safer and more sustainable.
The botanical supplements market benefits from this trend, as consumers seek out products derived from botanical sources known for their purported health benefits. With the wellness industry witnessing rapid growth, botanical supplements are positioned to capitalize on the demand for natural, holistic approaches to health.
Rising Demand for Plant-Based and Natural Products
The shift towards plant-based diets and natural products is driving the demand for botanical supplements. Consumers are gravitating toward products that align with their values of sustainability, environmental stewardship, and personal health. Plant-based supplements offer an attractive alternative to synthetic or animal-derived ingredients, appealing to individuals seeking clean-label options.
Additionally, concerns about the safety and potential side effects of synthetic supplements have prompted many consumers to explore natural alternatives. With the market for plant-based products expected to reach billions of dollars in the coming years, botanical supplements are poised to experience continued growth as part of this larger trend toward natural living and wellness.
Restraining Factors
Difficulty in Interpreting Existing Data
The botanical supplements market faces significant challenges due to the difficulty in interpreting existing data. The complex nature of botanical products, which often contain multiple active compounds, makes it challenging to standardize and validate their effects. This complexity is exacerbated by the variability in raw material quality, differences in extraction methods, and inconsistencies in product formulations.
The lack of standardized clinical trials and comprehensive research further complicates data interpretation. As a result, consumers and healthcare professionals may find it difficult to make informed decisions about the efficacy and safety of botanical supplements. This uncertainty can hinder market growth, as potential users may be hesitant to adopt these products without clear and reliable information.
Low Level of Confidence in Published Data
The low level of confidence in published data is another critical restraining factor for the botanical supplements market. The industry is plagued by issues such as inadequate regulatory oversight, lack of rigorous testing, and the prevalence of biased or poorly conducted studies. These issues undermine the credibility of published data, leading to skepticism among consumers and healthcare providers.
According to a study published in JAMA Network Open, nearly 45% of supplement users expressed concerns about the accuracy of product claims and the reliability of scientific data supporting these claims. This mistrust can significantly impede market growth, as it reduces consumer confidence and demand for botanical supplements. Additionally, regulatory bodies may impose stricter guidelines and scrutiny, further challenging market expansion.
By Source Analysis
Leaves dominated 25.3% of the market by source, indicating a preference for natural ingredients.
In 2023, leaves held a dominant market position in the "By Source" segment of the Botanical Supplements Market, capturing more than a 25.3% share. The breakdown of market share by source includes Herbs, Leaves, Spices, Flowers, and Others.
Leaves, representing a significant portion of the market, showcased their versatility and high consumer acceptance due to their potent health benefits and widespread use in traditional and modern medicine. The popularity of leaf-based supplements can be attributed to their rich content of antioxidants, vitamins, and minerals, which contribute to overall health and wellness. Products such as green tea extract, ginkgo biloba, and moringa are among the most sought-after leaf-based supplements.
Herbs followed closely, with their market share reflecting the increasing consumer inclination toward natural and holistic health solutions. Herbal supplements, known for their therapeutic properties, are gaining traction as consumers seek alternatives to synthetic pharmaceuticals. Popular herbal supplements include echinacea, ashwagandha, and turmeric, which are renowned for their immune-boosting and anti-inflammatory properties.
Spices, although accounting for a smaller segment, have shown steady growth due to their unique health benefits and use in dietary supplements. Turmeric, ginger, and cinnamon are prominent examples, valued for their anti-inflammatory, digestive, and metabolic benefits.
Flowers, comprising a niche segment, are appreciated for their medicinal properties and are often used in supplements aimed at promoting relaxation and improving mental health. Chamomile and lavender are notable examples, frequently incorporated into products targeting stress relief and sleep improvement.
The "Others" category includes a variety of plant-based sources that do not fall into the aforementioned categories but contribute to the diversity of botanical supplements available in the market. This segment's growth is driven by continuous research and innovation in botanical ingredients, expanding the range of options available to health-conscious consumers.
By Form Analysis
Tablets dominated 32.2% of the market by form, showing their popularity among consumers.
In 2023, tablets held a dominant market position in the "By Form" segment of the Botanical Supplements Market, capturing more than a 32.2% share. The breakdown of market share by form includes Powder, Liquid, Tablets, Capsules, Gummies, and Others.
Tablets emerged as the leading form due to their convenience, precise dosage, and longer shelf life. These factors make tablets a preferred choice among consumers seeking botanical supplements for various health benefits. The popularity of tablet-form supplements can be attributed to their ease of use and the ability to incorporate multiple ingredients, providing a comprehensive health solution. Common tablet supplements include those made from ashwagandha, ginkgo biloba, and spirulina, which are known for their stress-relieving, cognitive-enhancing, and detoxifying properties, respectively.
Capsules followed closely, offering similar advantages to tablets, such as ease of consumption and accurate dosing. Capsules are particularly favored for their ability to mask the taste of strong botanical ingredients, making them more palatable. Popular botanical supplements in capsule form include turmeric, garlic, and milk thistle, which are renowned for their anti-inflammatory, cardiovascular, and liver-protective benefits.
Powdered supplements, although accounting for a smaller segment, have shown significant growth due to their versatility in consumption. Powders can be easily mixed with beverages or food, catering to consumers who prefer a more flexible intake method. Botanical powders like matcha, maca, and chlorella are popular for their energy-boosting, hormone-balancing, and nutrient-dense properties.
Liquid supplements, while occupying a niche, are appreciated for their rapid absorption and ease of use. Liquid botanical supplements such as echinacea, elderberry, and aloe vera are often used for immune support, digestive health, and skin care.
Gummies, representing an innovative segment, have gained popularity, particularly among younger consumers and those who prefer a more enjoyable way to take supplements. Gummies made from botanical sources like elderberry, turmeric, and melatonin are popular for their immune-boosting, anti-inflammatory, and sleep-enhancing properties.
The "Others" category encompasses a variety of botanical supplement forms that do not fit into the main categories but contribute to the market's diversity. This segment's growth is driven by ongoing innovation and consumer demand for new and convenient supplement formats.
Overall, the Botanical Supplements Market is experiencing robust growth across all form segments, driven by consumer preferences for natural health solutions and the continuous development of new supplement formats.
By Application Analysis
Energy and weight management applications dominated 20.4% of the market, highlighting growing health concerns.
In 2023, Energy & Weight Management held a dominant market position in the "By Application" segment of the Botanical Supplements Market, capturing more than a 20.4% share. The breakdown of market share by application includes Energy & Weight Management, General Health, Bone & Joint Health, Gastrointestinal Health, Immunity, Cardiac Health, Diabetes, Anti-cancer, and Others.
Energy & Weight Management emerged as the leading application segment, driven by the increasing consumer focus on fitness and weight loss. Botanical supplements such as green tea extract, garcinia cambogia, and ginseng are popular in this category due to their metabolism-boosting and appetite-suppressing properties. The rising awareness of obesity-related health issues and the growing trend towards maintaining an active lifestyle have significantly contributed to the demand in this segment.
General Health follows closely, reflecting the broad application of botanical supplements in maintaining overall well-being. Products such as multivitamins, adaptogens, and superfood blends are widely used to enhance general health. These supplements are favored for their ability to provide essential nutrients, support mental clarity, and improve energy levels.
Bone & Joint Health is another significant segment, driven by the aging population and increasing prevalence of joint-related conditions such as arthritis. Botanical supplements like turmeric, boswellia, and glucosamine are popular for their anti-inflammatory and joint-supportive properties, helping to alleviate pain and improve mobility.
Gastrointestinal Health has shown substantial growth, with a rising number of consumers seeking natural solutions for digestive issues. Probiotic-rich botanicals like ginger, peppermint, and aloe vera are commonly used to support gut health, reduce bloating, and improve digestion.
Immunity remains a critical application segment, especially in the wake of the COVID-19 pandemic. Supplements such as echinacea, elderberry, and vitamin C-rich botanicals are highly sought after for their immune-boosting properties, helping to protect against infections and enhance overall immune function.
Cardiac Health is gaining traction as more consumers turn to natural supplements to support heart health. Botanical ingredients like hawthorn, omega-3 fatty acids from flaxseed, and coenzyme Q10 are valued for their cardiovascular benefits, including blood pressure regulation and cholesterol management.
Diabetes management is another growing segment, with an increasing number of consumers looking for natural ways to manage blood sugar levels. Botanicals like bitter melon, fenugreek, and cinnamon are commonly used for their blood glucose-lowering effects.
The Anti-cancer segment, although smaller, is crucial due to ongoing research and consumer interest in natural cancer-preventive solutions. Botanicals like turmeric, green tea, and garlic are studied for their potential anti-cancer properties.
The "Others" category includes various applications that do not fall into the main categories but contribute to the market's diversity. This segment's growth is driven by ongoing innovation and consumer demand for new health solutions.
By Distribution Channel Analysis
Offline distribution channels dominated 75.2% of the market, reflecting consumer preference for physical purchases.
In 2023, Offline held a dominant market position in the "By Distribution Channel" segment of the Botanical Supplements Market, capturing more than a 75.2% share. The breakdown of market share by distribution channel includes Offline and Online.
The offline distribution channel, encompassing retail stores, pharmacies, specialty health stores, and supermarkets, maintained its dominance due to several key factors. Consumers often prefer purchasing botanical supplements offline as it allows them to physically inspect products, seek advice from knowledgeable staff, and make immediate purchases. The trust and reliability associated with established retail outlets contribute significantly to this preference. Additionally, many consumers feel more comfortable buying health-related products in person, where they can verify authenticity and receive personalized recommendations.
Retail stores and pharmacies play a crucial role in the offline channel, providing easy accessibility to a wide range of botanical supplements. These outlets often feature dedicated sections for health and wellness products, making it convenient for consumers to find the supplements they need. Supermarkets also contribute to the offline market's strength, offering a broad selection of botanical supplements alongside regular grocery shopping, thus enhancing the convenience factor.
The online distribution channel, although accounting for a smaller share, is rapidly growing and reshaping the market dynamics. The convenience of online shopping, coupled with a wide range of product options, competitive pricing, and doorstep delivery, is attracting a growing number of consumers. E-commerce platforms and online health stores provide detailed product information, user reviews, and often run promotional offers, making them an appealing choice for tech-savvy and busy consumers.
Despite the growing popularity of online channels, the offline segment continues to lead due to the ingrained consumer behavior of purchasing health supplements in physical stores. However, the increasing penetration of the internet and rising consumer trust in online transactions indicate a significant potential for growth in the online segment.
Overall, the Botanical Supplements Market is characterized by robust growth across both distribution channels, driven by consumer demand for natural health solutions and the evolving retail landscape. The offline segment's dominance underscores the importance of physical retail in providing trusted and accessible health products, while the online segment's growth highlights the shift towards digital convenience and expanded product access.
Key Market Segments
By Source
- Herbs
- Leaves
- Spices
- Flowers
- Others
By Form
- Powder
- Liquid
- Tablets
- Capsules
- Gummies
- Others
By Application
- Energy & Weight Management
- General Health
- Bone & Joint Health
- Gastrointestinal Health
- Immunity
- Cardiac Health
- Diabetes
- Anti-cancer
- Others
By Distribution Channel
- Offline
- Online
Growth Opportunity
Personalization and Customization in Botanical Supplement Formulations
The global botanical supplements market in 2023 is poised for significant growth driven by increasing consumer demand for personalized and customized formulations. As health and wellness trends evolve, consumers are seeking supplements tailored to their unique health needs and preferences. This shift towards personalization is propelled by advancements in technology, particularly in data analytics and biotechnology, enabling precise formulation of supplements based on individual health data.
Companies are leveraging these technologies to create bespoke botanical products that cater to specific health conditions, dietary restrictions, and lifestyle choices. This trend is not only enhancing customer satisfaction but also fostering brand loyalty and differentiation in a competitive market. Furthermore, the integration of personalized nutrition platforms and digital health tools is making it easier for consumers to access and adhere to customized supplement regimens, thereby driving market growth.
Sustainable Sourcing and Ethical Practices in Botanical Supply Chains
In 2023, the global botanical supplements market is witnessing a growing emphasis on sustainable sourcing and ethical practices within supply chains. Consumers are becoming increasingly conscious of the environmental and social impact of their purchases, prompting companies to adopt more transparent and responsible sourcing strategies. Ethical practices in the botanical supply chain encompass fair trade, organic farming, and the conservation of biodiversity, ensuring that the sourcing of botanical ingredients does not harm the environment or exploit local communities.
Companies that prioritize sustainability are gaining a competitive edge as they align with consumer values and regulatory standards. Additionally, sustainable sourcing practices are contributing to the long-term viability of botanical resources, ensuring a steady supply of high-quality ingredients. This focus on sustainability is expected to enhance brand reputation, attract eco-conscious consumers, and drive growth in the botanical supplements market.
Latest Trends
Expansion of E-commerce Platforms for Botanical Supplements
The global botanical supplements market in 2023 is significantly influenced by the expansion of e-commerce platforms. The increasing shift towards online shopping, accelerated by the COVID-19 pandemic, has made e-commerce a crucial channel for the distribution of botanical supplements. Consumers are attracted to the convenience, variety, and accessibility that online platforms offer, allowing them to easily compare products, read reviews, and make informed purchasing decisions.
Companies are capitalizing on this trend by enhancing their online presence, optimizing digital marketing strategies, and offering personalized shopping experiences through AI-driven recommendations and virtual consultations. Additionally, subscription services and direct-to-consumer models are gaining traction, providing consistent sales and fostering customer loyalty. The integration of secure payment systems and efficient logistics is further supporting the growth of botanical supplements in the e-commerce sector, making it a key driver for market expansion.
Advancements in Extraction Technologies for Botanical Ingredients
Advancements in extraction technologies are another pivotal trend shaping the global botanical supplements market in 2023. Innovative extraction methods, such as supercritical fluid extraction, ultrasound-assisted extraction, and microwave-assisted extraction, are enhancing the efficiency, purity, and bioavailability of botanical ingredients. These technologies allow for the precise extraction of active compounds without degrading their efficacy, ensuring high-quality supplements. The improved extraction processes are also more environmentally friendly, reducing solvent usage and energy consumption, which aligns with the growing consumer demand for sustainable products.
Furthermore, advancements in extraction technologies are enabling the development of new and potent botanical formulations, expanding the range of supplements available in the market. Companies investing in cutting-edge extraction techniques are positioning themselves at the forefront of innovation, gaining a competitive advantage by offering superior products. This trend is expected to drive product innovation, improve market quality standards, and contribute to the overall growth of the botanical supplements market in 2023.
Regional Analysis
North America holds a significant share of the botanical supplements market at 30.2% in 2023.
The global botanical supplements market exhibits significant regional variation, with North America, Europe, Asia Pacific, Middle East & Africa, and Latin America being the primary regions of analysis. North America dominates the market, holding a substantial 30.2% share. This dominance is attributed to the high consumer awareness regarding health and wellness, coupled with the strong presence of key market players and advanced healthcare infrastructure. The U.S. and Canada are the primary contributors, driven by high disposable incomes and a growing preference for natural and organic products.
Europe follows closely, with countries like Germany, France, and the United Kingdom leading the market. The region benefits from stringent regulatory standards and a well-established market for dietary supplements, contributing to steady growth. The European botanical supplements market is characterized by a strong emphasis on sustainability and ethical sourcing, aligning with the region’s environmental policies and consumer preferences.
The Asia Pacific region is experiencing rapid growth, driven by increasing health consciousness and disposable incomes in countries such as China, Japan, and India. The expanding middle class and the rising popularity of traditional medicine systems, such as Ayurveda and Traditional Chinese Medicine (TCM), are key factors propelling the market. The region is also witnessing a surge in e-commerce, facilitating greater access to botanical supplements.
In the Middle East & Africa, market growth is moderate but steadily increasing. The demand is primarily driven by the rising awareness of the benefits of natural supplements and the increasing prevalence of lifestyle-related diseases. South Africa and the UAE are notable markets within this region.
Latin America, although smaller in market share, is gradually growing, with Brazil and Mexico being significant contributors. The growth is fueled by increasing urbanization, improving economic conditions, and a growing trend toward preventive healthcare.
Key Regions and Countries
North America
- The US
- Canada
- Rest of North America
Europe
- Germany
- France
- The UK
- Spain
- Netherlands
- Russia
- Italy
- Rest of Europe
Asia-Pacific
- China
- Japan
- Singapore
- Thailand
- South Korea
- Vietnam
- India
- New Zealand
- Rest of Asia Pacific
Latin America
- Mexico
- Brazil
- Rest of Latin America
Middle East & Africa
- Saudi Arabia
- South Africa
- UAE
- Rest of Middle East & Africa
Key Players Analysis
The global botanical supplements market in 2023 is characterized by the strategic activities and innovations of several key players. Dabur India continues to be a dominant force, leveraging its strong heritage in Ayurvedic formulations to cater to the rising demand for natural health solutions. The company’s extensive product portfolio and robust distribution network in emerging markets bolster its competitive position.
NBTY Inc., a leading global manufacturer of vitamins and nutritional supplements, stands out for its expansive product range and strong market presence. The company's focus on innovation and high-quality standards enhances its reputation and market share.
Ricola AG, renowned for its herbal products, is capitalizing on the growing consumer preference for plant-based remedies. Its commitment to sustainable sourcing and innovative product development ensures its continued market relevance.
Mondelez International, traditionally known for its food and beverage products, is making significant inroads into the botanical supplements market through strategic acquisitions and product diversification, tapping into the health and wellness trend.
Procter and Gamble, a global consumer goods giant, is leveraging its extensive market reach and brand recognition to expand its botanical supplements segment. The company’s focus on research and development (R&D) and strategic marketing campaigns is expected to drive growth.
Nutraceutical International Company, with its emphasis on high-quality, science-based products, continues to expand its global footprint through strategic acquisitions and partnerships.
BASF SE, a key player in the chemical industry, is making notable advancements in botanical ingredient extraction and formulation, enhancing the bioavailability and efficacy of its products.
The Himalaya Drug Company, with its strong focus on herbal healthcare, is expanding its product portfolio and global presence, driven by increasing consumer interest in traditional medicine.
Glanbia Nutritionals is leveraging its expertise in nutritional solutions to offer high-quality botanical supplements, supported by its strong R&D capabilities and global distribution network.
Botanicalife International of America, Inc. focuses on innovative, high-quality botanical products, catering to niche markets and emphasizing sustainable practices.
Blackmores Limited, a leader in natural health products, is strengthening its market position through continuous product innovation, strategic acquisitions, and a strong focus on sustainability.
Market Key Players
- Dabur India
- NBTY Inc.
- Ricola AG.
- Mondelez International
- Procter and Gamble
- Nutraceutical International Company
- BASF SE
- The Himalaya Drug Company
- Glanbia Nutritionals
- Botanicalife International of America, Inc.
- Blackmores Limited
Recent Development
- In September 2023, Biotropics Malaysia Berhad introduced BioKesum leaf extract, sourced from Malaysia's tropical fauna, proven to enhance brain health with flavonoids. Clinical trials show improved memory and cognitive function. Presenting at Vitafoods Asia 2023, showcasing botanical innovations.
- In September 2014, the American Herbal Products Association (AHPA) aids the herbal and botanical industry with compliance, education, and advocacy. 2014 Botanical Congress and online resources empower members.
Report Scope
Report Features Description Market Value (2023) USD 38.7 Billion Forecast Revenue (2033) USD 94.6 Billion CAGR (2024-2032) 9.6% Base Year for Estimation 2023 Historic Period 2016-2023 Forecast Period 2024-2033 Report Coverage Revenue Forecast, Market Dynamics, COVID-19 Impact, Competitive Landscape, Recent Developments Segments Covered By Source(Herbs, Leaves, Spices, Flowers, Others), By Form(Powder, Liquid, Tablets, Capsules, Gummies, Others), By Application(Energy & Weight Management, General Health, Bone & Joint Health, Gastrointestinal Health, Immunity, Cardiac Health, Diabetes, Anti-cancer, Others), By Distribution Channel(Offline, Online) Regional Analysis North America - The US, Canada, Rest of North America, Europe - Germany, France, The UK, Spain, Italy, Russia, Netherlands, Rest of Europe, Asia-Pacific - China, Japan, South Korea, India, New Zealand, Singapore, Thailand, Vietnam, Rest of Asia Pacific, Latin America - Brazil, Mexico, Rest of Latin America, Middle East & Africa - South Africa, Saudi Arabia, UAE, Rest of Middle East & Africa Competitive Landscape Dabur India, NBTY Inc., Ricola AG., Mondelez International, Procter and Gamble, Nutraceutical International Company, BASF SE, The Himalaya Drug Company, Glanbia Nutritionals, Botanicalife International of America, Inc., Blackmores Limited Customization Scope Customization for segments, region/country-level will be provided. Moreover, additional customization can be done based on the requirements. Purchase Options We have three licenses to opt for Single User License, Multi-User License (Up to 5 Users), Corporate Use License (Unlimited User and Printable PDF) -
- 1. Executive Summary
- 1.1. Definition
- 1.2. Taxonomy
- 1.3. Research Scope
- 1.4. Key Analysis
- 1.5. Key Findings by Major Segments
- 1.6. Top strategies by Major Players
- 2. Global Botanical Supplements Market Overview
- 2.1. Botanical Supplements Market Dynamics
- 2.1.1. Drivers
- 2.1.2. Opportunities
- 2.1.3. Restraints
- 2.1.4. Challenges
- 2.2. Macro-economic Factors
- 2.3. Regulatory Framework
- 2.4. Market Investment Feasibility Index
- 2.5. PEST Analysis
- 2.6. PORTER’S Five Force Analysis
- 2.7. Drivers & Restraints Impact Analysis
- 2.8. Industry Chain Analysis
- 2.9. Cost Structure Analysis
- 2.10. Marketing Strategy
- 2.11. Russia-Ukraine War Impact Analysis
- 2.12. Opportunity Map Analysis
- 2.13. Market Competition Scenario Analysis
- 2.14. Product Life Cycle Analysis
- 2.15. Opportunity Orbits
- 2.16. Manufacturer Intensity Map
- 2.17. Major Companies sales by Value & Volume
- 2.1. Botanical Supplements Market Dynamics
- 3. Global Botanical Supplements Market Analysis, Opportunity and Forecast, 2016-2032
- 3.1. Global Botanical Supplements Market Analysis, 2016-2021
- 3.2. Global Botanical Supplements Market Opportunity and Forecast, 2023-2032
- 3.3. Global Botanical Supplements Market Analysis, Opportunity and Forecast, By By Source, 2016-2032
- 3.3.1. Global Botanical Supplements Market Analysis by By Source: Introduction
- 3.3.2. Market Size Absolute $ Opportunity Analysis and Forecast, By By Source, 2016-2032
- 3.3.3. Herbs
- 3.3.4. Leaves
- 3.3.5. Spices
- 3.3.6. Flowers
- 3.3.7. Others
- 3.4. Global Botanical Supplements Market Analysis, Opportunity and Forecast, By By Form , 2016-2032
- 3.4.1. Global Botanical Supplements Market Analysis by By Form : Introduction
- 3.4.2. Market Size Absolute $ Opportunity Analysis and Forecast, By By Form , 2016-2032
- 3.4.3. Powder
- 3.4.4. Liquid
- 3.4.5. Tablets
- 3.4.6. Capsules
- 3.4.7. Gummies
- 3.4.8. Others
- 3.5. Global Botanical Supplements Market Analysis, Opportunity and Forecast, By By Application, 2016-2032
- 3.5.1. Global Botanical Supplements Market Analysis by By Application: Introduction
- 3.5.2. Market Size Absolute $ Opportunity Analysis and Forecast, By By Application, 2016-2032
- 3.5.3. Energy & Weight Management
- 3.5.4. General Health
- 3.5.5. Bone & Joint Health
- 3.5.6. Gastrointestinal Health
- 3.5.7. Immunity
- 3.5.8. Cardiac Health
- 3.5.9. Diabetes
- 3.5.10. Anti-cancer
- 3.5.11. Others
- 3.6. Global Botanical Supplements Market Analysis, Opportunity and Forecast, By By Distribution Channel , 2016-2032
- 3.6.1. Global Botanical Supplements Market Analysis by By Distribution Channel : Introduction
- 3.6.2. Market Size Absolute $ Opportunity Analysis and Forecast, By By Distribution Channel , 2016-2032
- 3.6.3. Offline
- 3.6.4. Online
- 4. North America Botanical Supplements Market Analysis, Opportunity and Forecast, 2016-2032
- 4.1. North America Botanical Supplements Market Analysis, 2016-2021
- 4.2. North America Botanical Supplements Market Opportunity and Forecast, 2023-2032
- 4.3. North America Botanical Supplements Market Analysis, Opportunity and Forecast, By By Source, 2016-2032
- 4.3.1. North America Botanical Supplements Market Analysis by By Source: Introduction
- 4.3.2. Market Size Absolute $ Opportunity Analysis and Forecast, By By Source, 2016-2032
- 4.3.3. Herbs
- 4.3.4. Leaves
- 4.3.5. Spices
- 4.3.6. Flowers
- 4.3.7. Others
- 4.4. North America Botanical Supplements Market Analysis, Opportunity and Forecast, By By Form , 2016-2032
- 4.4.1. North America Botanical Supplements Market Analysis by By Form : Introduction
- 4.4.2. Market Size Absolute $ Opportunity Analysis and Forecast, By By Form , 2016-2032
- 4.4.3. Powder
- 4.4.4. Liquid
- 4.4.5. Tablets
- 4.4.6. Capsules
- 4.4.7. Gummies
- 4.4.8. Others
- 4.5. North America Botanical Supplements Market Analysis, Opportunity and Forecast, By By Application, 2016-2032
- 4.5.1. North America Botanical Supplements Market Analysis by By Application: Introduction
- 4.5.2. Market Size Absolute $ Opportunity Analysis and Forecast, By By Application, 2016-2032
- 4.5.3. Energy & Weight Management
- 4.5.4. General Health
- 4.5.5. Bone & Joint Health
- 4.5.6. Gastrointestinal Health
- 4.5.7. Immunity
- 4.5.8. Cardiac Health
- 4.5.9. Diabetes
- 4.5.10. Anti-cancer
- 4.5.11. Others
- 4.6. North America Botanical Supplements Market Analysis, Opportunity and Forecast, By By Distribution Channel , 2016-2032
- 4.6.1. North America Botanical Supplements Market Analysis by By Distribution Channel : Introduction
- 4.6.2. Market Size Absolute $ Opportunity Analysis and Forecast, By By Distribution Channel , 2016-2032
- 4.6.3. Offline
- 4.6.4. Online
- 4.7. North America Botanical Supplements Market Analysis, Opportunity and Forecast, By Country , 2016-2032
- 4.7.1. North America Botanical Supplements Market Analysis by Country : Introduction
- 4.7.2. Market Size Absolute $ Opportunity Analysis and Forecast, Country , 2016-2032
- 4.7.2.1. The US
- 4.7.2.2. Canada
- 4.7.2.3. Mexico
- 5. Western Europe Botanical Supplements Market Analysis, Opportunity and Forecast, 2016-2032
- 5.1. Western Europe Botanical Supplements Market Analysis, 2016-2021
- 5.2. Western Europe Botanical Supplements Market Opportunity and Forecast, 2023-2032
- 5.3. Western Europe Botanical Supplements Market Analysis, Opportunity and Forecast, By By Source, 2016-2032
- 5.3.1. Western Europe Botanical Supplements Market Analysis by By Source: Introduction
- 5.3.2. Market Size Absolute $ Opportunity Analysis and Forecast, By By Source, 2016-2032
- 5.3.3. Herbs
- 5.3.4. Leaves
- 5.3.5. Spices
- 5.3.6. Flowers
- 5.3.7. Others
- 5.4. Western Europe Botanical Supplements Market Analysis, Opportunity and Forecast, By By Form , 2016-2032
- 5.4.1. Western Europe Botanical Supplements Market Analysis by By Form : Introduction
- 5.4.2. Market Size Absolute $ Opportunity Analysis and Forecast, By By Form , 2016-2032
- 5.4.3. Powder
- 5.4.4. Liquid
- 5.4.5. Tablets
- 5.4.6. Capsules
- 5.4.7. Gummies
- 5.4.8. Others
- 5.5. Western Europe Botanical Supplements Market Analysis, Opportunity and Forecast, By By Application, 2016-2032
- 5.5.1. Western Europe Botanical Supplements Market Analysis by By Application: Introduction
- 5.5.2. Market Size Absolute $ Opportunity Analysis and Forecast, By By Application, 2016-2032
- 5.5.3. Energy & Weight Management
- 5.5.4. General Health
- 5.5.5. Bone & Joint Health
- 5.5.6. Gastrointestinal Health
- 5.5.7. Immunity
- 5.5.8. Cardiac Health
- 5.5.9. Diabetes
- 5.5.10. Anti-cancer
- 5.5.11. Others
- 5.6. Western Europe Botanical Supplements Market Analysis, Opportunity and Forecast, By By Distribution Channel , 2016-2032
- 5.6.1. Western Europe Botanical Supplements Market Analysis by By Distribution Channel : Introduction
- 5.6.2. Market Size Absolute $ Opportunity Analysis and Forecast, By By Distribution Channel , 2016-2032
- 5.6.3. Offline
- 5.6.4. Online
- 5.7. Western Europe Botanical Supplements Market Analysis, Opportunity and Forecast, By Country , 2016-2032
- 5.7.1. Western Europe Botanical Supplements Market Analysis by Country : Introduction
- 5.7.2. Market Size Absolute $ Opportunity Analysis and Forecast, Country , 2016-2032
- 5.7.2.1. Germany
- 5.7.2.2. France
- 5.7.2.3. The UK
- 5.7.2.4. Spain
- 5.7.2.5. Italy
- 5.7.2.6. Portugal
- 5.7.2.7. Ireland
- 5.7.2.8. Austria
- 5.7.2.9. Switzerland
- 5.7.2.10. Benelux
- 5.7.2.11. Nordic
- 5.7.2.12. Rest of Western Europe
- 6. Eastern Europe Botanical Supplements Market Analysis, Opportunity and Forecast, 2016-2032
- 6.1. Eastern Europe Botanical Supplements Market Analysis, 2016-2021
- 6.2. Eastern Europe Botanical Supplements Market Opportunity and Forecast, 2023-2032
- 6.3. Eastern Europe Botanical Supplements Market Analysis, Opportunity and Forecast, By By Source, 2016-2032
- 6.3.1. Eastern Europe Botanical Supplements Market Analysis by By Source: Introduction
- 6.3.2. Market Size Absolute $ Opportunity Analysis and Forecast, By By Source, 2016-2032
- 6.3.3. Herbs
- 6.3.4. Leaves
- 6.3.5. Spices
- 6.3.6. Flowers
- 6.3.7. Others
- 6.4. Eastern Europe Botanical Supplements Market Analysis, Opportunity and Forecast, By By Form , 2016-2032
- 6.4.1. Eastern Europe Botanical Supplements Market Analysis by By Form : Introduction
- 6.4.2. Market Size Absolute $ Opportunity Analysis and Forecast, By By Form , 2016-2032
- 6.4.3. Powder
- 6.4.4. Liquid
- 6.4.5. Tablets
- 6.4.6. Capsules
- 6.4.7. Gummies
- 6.4.8. Others
- 6.5. Eastern Europe Botanical Supplements Market Analysis, Opportunity and Forecast, By By Application, 2016-2032
- 6.5.1. Eastern Europe Botanical Supplements Market Analysis by By Application: Introduction
- 6.5.2. Market Size Absolute $ Opportunity Analysis and Forecast, By By Application, 2016-2032
- 6.5.3. Energy & Weight Management
- 6.5.4. General Health
- 6.5.5. Bone & Joint Health
- 6.5.6. Gastrointestinal Health
- 6.5.7. Immunity
- 6.5.8. Cardiac Health
- 6.5.9. Diabetes
- 6.5.10. Anti-cancer
- 6.5.11. Others
- 6.6. Eastern Europe Botanical Supplements Market Analysis, Opportunity and Forecast, By By Distribution Channel , 2016-2032
- 6.6.1. Eastern Europe Botanical Supplements Market Analysis by By Distribution Channel : Introduction
- 6.6.2. Market Size Absolute $ Opportunity Analysis and Forecast, By By Distribution Channel , 2016-2032
- 6.6.3. Offline
- 6.6.4. Online
- 6.7. Eastern Europe Botanical Supplements Market Analysis, Opportunity and Forecast, By Country , 2016-2032
- 6.7.1. Eastern Europe Botanical Supplements Market Analysis by Country : Introduction
- 6.7.2. Market Size Absolute $ Opportunity Analysis and Forecast, Country , 2016-2032
- 6.7.2.1. Russia
- 6.7.2.2. Poland
- 6.7.2.3. The Czech Republic
- 6.7.2.4. Greece
- 6.7.2.5. Rest of Eastern Europe
- 7. APAC Botanical Supplements Market Analysis, Opportunity and Forecast, 2016-2032
- 7.1. APAC Botanical Supplements Market Analysis, 2016-2021
- 7.2. APAC Botanical Supplements Market Opportunity and Forecast, 2023-2032
- 7.3. APAC Botanical Supplements Market Analysis, Opportunity and Forecast, By By Source, 2016-2032
- 7.3.1. APAC Botanical Supplements Market Analysis by By Source: Introduction
- 7.3.2. Market Size Absolute $ Opportunity Analysis and Forecast, By By Source, 2016-2032
- 7.3.3. Herbs
- 7.3.4. Leaves
- 7.3.5. Spices
- 7.3.6. Flowers
- 7.3.7. Others
- 7.4. APAC Botanical Supplements Market Analysis, Opportunity and Forecast, By By Form , 2016-2032
- 7.4.1. APAC Botanical Supplements Market Analysis by By Form : Introduction
- 7.4.2. Market Size Absolute $ Opportunity Analysis and Forecast, By By Form , 2016-2032
- 7.4.3. Powder
- 7.4.4. Liquid
- 7.4.5. Tablets
- 7.4.6. Capsules
- 7.4.7. Gummies
- 7.4.8. Others
- 7.5. APAC Botanical Supplements Market Analysis, Opportunity and Forecast, By By Application, 2016-2032
- 7.5.1. APAC Botanical Supplements Market Analysis by By Application: Introduction
- 7.5.2. Market Size Absolute $ Opportunity Analysis and Forecast, By By Application, 2016-2032
- 7.5.3. Energy & Weight Management
- 7.5.4. General Health
- 7.5.5. Bone & Joint Health
- 7.5.6. Gastrointestinal Health
- 7.5.7. Immunity
- 7.5.8. Cardiac Health
- 7.5.9. Diabetes
- 7.5.10. Anti-cancer
- 7.5.11. Others
- 7.6. APAC Botanical Supplements Market Analysis, Opportunity and Forecast, By By Distribution Channel , 2016-2032
- 7.6.1. APAC Botanical Supplements Market Analysis by By Distribution Channel : Introduction
- 7.6.2. Market Size Absolute $ Opportunity Analysis and Forecast, By By Distribution Channel , 2016-2032
- 7.6.3. Offline
- 7.6.4. Online
- 7.7. APAC Botanical Supplements Market Analysis, Opportunity and Forecast, By Country , 2016-2032
- 7.7.1. APAC Botanical Supplements Market Analysis by Country : Introduction
- 7.7.2. Market Size Absolute $ Opportunity Analysis and Forecast, Country , 2016-2032
- 7.7.2.1. China
- 7.7.2.2. Japan
- 7.7.2.3. South Korea
- 7.7.2.4. India
- 7.7.2.5. Australia & New Zeland
- 7.7.2.6. Indonesia
- 7.7.2.7. Malaysia
- 7.7.2.8. Philippines
- 7.7.2.9. Singapore
- 7.7.2.10. Thailand
- 7.7.2.11. Vietnam
- 7.7.2.12. Rest of APAC
- 8. Latin America Botanical Supplements Market Analysis, Opportunity and Forecast, 2016-2032
- 8.1. Latin America Botanical Supplements Market Analysis, 2016-2021
- 8.2. Latin America Botanical Supplements Market Opportunity and Forecast, 2023-2032
- 8.3. Latin America Botanical Supplements Market Analysis, Opportunity and Forecast, By By Source, 2016-2032
- 8.3.1. Latin America Botanical Supplements Market Analysis by By Source: Introduction
- 8.3.2. Market Size Absolute $ Opportunity Analysis and Forecast, By By Source, 2016-2032
- 8.3.3. Herbs
- 8.3.4. Leaves
- 8.3.5. Spices
- 8.3.6. Flowers
- 8.3.7. Others
- 8.4. Latin America Botanical Supplements Market Analysis, Opportunity and Forecast, By By Form , 2016-2032
- 8.4.1. Latin America Botanical Supplements Market Analysis by By Form : Introduction
- 8.4.2. Market Size Absolute $ Opportunity Analysis and Forecast, By By Form , 2016-2032
- 8.4.3. Powder
- 8.4.4. Liquid
- 8.4.5. Tablets
- 8.4.6. Capsules
- 8.4.7. Gummies
- 8.4.8. Others
- 8.5. Latin America Botanical Supplements Market Analysis, Opportunity and Forecast, By By Application, 2016-2032
- 8.5.1. Latin America Botanical Supplements Market Analysis by By Application: Introduction
- 8.5.2. Market Size Absolute $ Opportunity Analysis and Forecast, By By Application, 2016-2032
- 8.5.3. Energy & Weight Management
- 8.5.4. General Health
- 8.5.5. Bone & Joint Health
- 8.5.6. Gastrointestinal Health
- 8.5.7. Immunity
- 8.5.8. Cardiac Health
- 8.5.9. Diabetes
- 8.5.10. Anti-cancer
- 8.5.11. Others
- 8.6. Latin America Botanical Supplements Market Analysis, Opportunity and Forecast, By By Distribution Channel , 2016-2032
- 8.6.1. Latin America Botanical Supplements Market Analysis by By Distribution Channel : Introduction
- 8.6.2. Market Size Absolute $ Opportunity Analysis and Forecast, By By Distribution Channel , 2016-2032
- 8.6.3. Offline
- 8.6.4. Online
- 8.7. Latin America Botanical Supplements Market Analysis, Opportunity and Forecast, By Country , 2016-2032
- 8.7.1. Latin America Botanical Supplements Market Analysis by Country : Introduction
- 8.7.2. Market Size Absolute $ Opportunity Analysis and Forecast, Country , 2016-2032
- 8.7.2.1. Brazil
- 8.7.2.2. Colombia
- 8.7.2.3. Chile
- 8.7.2.4. Argentina
- 8.7.2.5. Costa Rica
- 8.7.2.6. Rest of Latin America
- 9. Middle East & Africa Botanical Supplements Market Analysis, Opportunity and Forecast, 2016-2032
- 9.1. Middle East & Africa Botanical Supplements Market Analysis, 2016-2021
- 9.2. Middle East & Africa Botanical Supplements Market Opportunity and Forecast, 2023-2032
- 9.3. Middle East & Africa Botanical Supplements Market Analysis, Opportunity and Forecast, By By Source, 2016-2032
- 9.3.1. Middle East & Africa Botanical Supplements Market Analysis by By Source: Introduction
- 9.3.2. Market Size Absolute $ Opportunity Analysis and Forecast, By By Source, 2016-2032
- 9.3.3. Herbs
- 9.3.4. Leaves
- 9.3.5. Spices
- 9.3.6. Flowers
- 9.3.7. Others
- 9.4. Middle East & Africa Botanical Supplements Market Analysis, Opportunity and Forecast, By By Form , 2016-2032
- 9.4.1. Middle East & Africa Botanical Supplements Market Analysis by By Form : Introduction
- 9.4.2. Market Size Absolute $ Opportunity Analysis and Forecast, By By Form , 2016-2032
- 9.4.3. Powder
- 9.4.4. Liquid
- 9.4.5. Tablets
- 9.4.6. Capsules
- 9.4.7. Gummies
- 9.4.8. Others
- 9.5. Middle East & Africa Botanical Supplements Market Analysis, Opportunity and Forecast, By By Application, 2016-2032
- 9.5.1. Middle East & Africa Botanical Supplements Market Analysis by By Application: Introduction
- 9.5.2. Market Size Absolute $ Opportunity Analysis and Forecast, By By Application, 2016-2032
- 9.5.3. Energy & Weight Management
- 9.5.4. General Health
- 9.5.5. Bone & Joint Health
- 9.5.6. Gastrointestinal Health
- 9.5.7. Immunity
- 9.5.8. Cardiac Health
- 9.5.9. Diabetes
- 9.5.10. Anti-cancer
- 9.5.11. Others
- 9.6. Middle East & Africa Botanical Supplements Market Analysis, Opportunity and Forecast, By By Distribution Channel , 2016-2032
- 9.6.1. Middle East & Africa Botanical Supplements Market Analysis by By Distribution Channel : Introduction
- 9.6.2. Market Size Absolute $ Opportunity Analysis and Forecast, By By Distribution Channel , 2016-2032
- 9.6.3. Offline
- 9.6.4. Online
- 9.7. Middle East & Africa Botanical Supplements Market Analysis, Opportunity and Forecast, By Country , 2016-2032
- 9.7.1. Middle East & Africa Botanical Supplements Market Analysis by Country : Introduction
- 9.7.2. Market Size Absolute $ Opportunity Analysis and Forecast, Country , 2016-2032
- 9.7.2.1. Algeria
- 9.7.2.2. Egypt
- 9.7.2.3. Israel
- 9.7.2.4. Kuwait
- 9.7.2.5. Nigeria
- 9.7.2.6. Saudi Arabia
- 9.7.2.7. South Africa
- 9.7.2.8. Turkey
- 9.7.2.9. The UAE
- 9.7.2.10. Rest of MEA
- 10. Global Botanical Supplements Market Analysis, Opportunity and Forecast, By Region , 2016-2032
- 10.1. Global Botanical Supplements Market Analysis by Region : Introduction
- 10.2. Market Size Absolute $ Opportunity Analysis and Forecast, By Region , 2016-2032
- 10.2.1. North America
- 10.2.2. Western Europe
- 10.2.3. Eastern Europe
- 10.2.4. APAC
- 10.2.5. Latin America
- 10.2.6. Middle East & Africa
- 11. Global Botanical Supplements Market Competitive Landscape, Market Share Analysis, and Company Profiles
- 11.1. Market Share Analysis
- 11.2. Company Profiles
- 11.3. Dabur India
- 11.3.1. Company Overview
- 11.3.2. Financial Highlights
- 11.3.3. Product Portfolio
- 11.3.4. SWOT Analysis
- 11.3.5. Key Strategies and Developments
- 11.4. NBTY Inc.
- 11.4.1. Company Overview
- 11.4.2. Financial Highlights
- 11.4.3. Product Portfolio
- 11.4.4. SWOT Analysis
- 11.4.5. Key Strategies and Developments
- 11.5. Ricola AG.
- 11.5.1. Company Overview
- 11.5.2. Financial Highlights
- 11.5.3. Product Portfolio
- 11.5.4. SWOT Analysis
- 11.5.5. Key Strategies and Developments
- 11.6. Mondelez International
- 11.6.1. Company Overview
- 11.6.2. Financial Highlights
- 11.6.3. Product Portfolio
- 11.6.4. SWOT Analysis
- 11.6.5. Key Strategies and Developments
- 11.7. Procter and Gamble
- 11.7.1. Company Overview
- 11.7.2. Financial Highlights
- 11.7.3. Product Portfolio
- 11.7.4. SWOT Analysis
- 11.7.5. Key Strategies and Developments
- 11.8. Nutraceutical International Company
- 11.8.1. Company Overview
- 11.8.2. Financial Highlights
- 11.8.3. Product Portfolio
- 11.8.4. SWOT Analysis
- 11.8.5. Key Strategies and Developments
- 11.9. BASF SE
- 11.9.1. Company Overview
- 11.9.2. Financial Highlights
- 11.9.3. Product Portfolio
- 11.9.4. SWOT Analysis
- 11.9.5. Key Strategies and Developments
- 11.10. The Himalaya Drug Company
- 11.10.1. Company Overview
- 11.10.2. Financial Highlights
- 11.10.3. Product Portfolio
- 11.10.4. SWOT Analysis
- 11.10.5. Key Strategies and Developments
- 11.11. Glanbia Nutritionals
- 11.11.1. Company Overview
- 11.11.2. Financial Highlights
- 11.11.3. Product Portfolio
- 11.11.4. SWOT Analysis
- 11.11.5. Key Strategies and Developments
- 11.12. Botanicalife International of America, Inc.
- 11.12.1. Company Overview
- 11.12.2. Financial Highlights
- 11.12.3. Product Portfolio
- 11.12.4. SWOT Analysis
- 11.12.5. Key Strategies and Developments
- 11.13.1. Company Overview
- 11.13.2. Financial Highlights
- 11.13.3. Product Portfolio
- 11.13.4. SWOT Analysis
- 11.13.5. Key Strategies and Developments
- 11.14. Blackmores Limited
- 11.14.1. Company Overview
- 11.14.2. Financial Highlights
- 11.14.3. Product Portfolio
- 11.14.4. SWOT Analysis
- 11.14.5. Key Strategies and Developments
- 12. Assumptions and Acronyms
- 13. Research Methodology
- 14. Contact
"
- List of Figures
- "
- Figure 1: Global Botanical Supplements Market Revenue (US$ Mn) Market Share by By Source in 2022
- Figure 2: Global Botanical Supplements Market Market Attractiveness Analysis by By Source, 2016-2032
- Figure 3: Global Botanical Supplements Market Revenue (US$ Mn) Market Share by By Form in 2022
- Figure 4: Global Botanical Supplements Market Market Attractiveness Analysis by By Form , 2016-2032
- Figure 5: Global Botanical Supplements Market Revenue (US$ Mn) Market Share by By Applicationin 2022
- Figure 6: Global Botanical Supplements Market Market Attractiveness Analysis by By Application, 2016-2032
- Figure 7: Global Botanical Supplements Market Revenue (US$ Mn) Market Share by By Distribution Channel in 2022
- Figure 8: Global Botanical Supplements Market Market Attractiveness Analysis by By Distribution Channel , 2016-2032
- Figure 9: Global Botanical Supplements Market Revenue (US$ Mn) Market Share by Region in 2022
- Figure 10: Global Botanical Supplements Market Market Attractiveness Analysis by Region, 2016-2032
- Figure 11: Global Botanical Supplements Market Market Revenue (US$ Mn) (2016-2032)
- Figure 12: Global Botanical Supplements Market Market Revenue (US$ Mn) Comparison by Region (2016-2032)
- Figure 13: Global Botanical Supplements Market Market Revenue (US$ Mn) Comparison by By Source (2016-2032)
- Figure 14: Global Botanical Supplements Market Market Revenue (US$ Mn) Comparison by By Form (2016-2032)
- Figure 15: Global Botanical Supplements Market Market Revenue (US$ Mn) Comparison by By Application (2016-2032)
- Figure 16: Global Botanical Supplements Market Market Revenue (US$ Mn) Comparison by By Distribution Channel (2016-2032)
- Figure 17: Global Botanical Supplements Market Market Y-o-Y Growth Rate Comparison by Region (2016-2032)
- Figure 18: Global Botanical Supplements Market Market Y-o-Y Growth Rate Comparison by By Source (2016-2032)
- Figure 19: Global Botanical Supplements Market Market Y-o-Y Growth Rate Comparison by By Form (2016-2032)
- Figure 20: Global Botanical Supplements Market Market Y-o-Y Growth Rate Comparison by By Application (2016-2032)
- Figure 21: Global Botanical Supplements Market Market Y-o-Y Growth Rate Comparison by By Distribution Channel (2016-2032)
- Figure 22: Global Botanical Supplements Market Market Share Comparison by Region (2016-2032)
- Figure 23: Global Botanical Supplements Market Market Share Comparison by By Source (2016-2032)
- Figure 24: Global Botanical Supplements Market Market Share Comparison by By Form (2016-2032)
- Figure 25: Global Botanical Supplements Market Market Share Comparison by By Application (2016-2032)
- Figure 26: Global Botanical Supplements Market Market Share Comparison by By Distribution Channel (2016-2032)
- Figure 27: North America Botanical Supplements Market Revenue (US$ Mn) Market Share by By Sourcein 2022
- Figure 28: North America Botanical Supplements Market Market Attractiveness Analysis by By Source, 2016-2032
- Figure 29: North America Botanical Supplements Market Revenue (US$ Mn) Market Share by By Form in 2022
- Figure 30: North America Botanical Supplements Market Market Attractiveness Analysis by By Form , 2016-2032
- Figure 31: North America Botanical Supplements Market Revenue (US$ Mn) Market Share by By Applicationin 2022
- Figure 32: North America Botanical Supplements Market Market Attractiveness Analysis by By Application, 2016-2032
- Figure 33: North America Botanical Supplements Market Revenue (US$ Mn) Market Share by By Distribution Channel in 2022
- Figure 34: North America Botanical Supplements Market Market Attractiveness Analysis by By Distribution Channel , 2016-2032
- Figure 35: North America Botanical Supplements Market Revenue (US$ Mn) Market Share by Country in 2022
- Figure 36: North America Botanical Supplements Market Market Attractiveness Analysis by Country, 2016-2032
- Figure 37: North America Botanical Supplements Market Market Revenue (US$ Mn) (2016-2032)
- Figure 38: North America Botanical Supplements Market Market Revenue (US$ Mn) Comparison by Country (2016-2032)
- Figure 39: North America Botanical Supplements Market Market Revenue (US$ Mn) Comparison by By Source (2016-2032)
- Figure 40: North America Botanical Supplements Market Market Revenue (US$ Mn) Comparison by By Form (2016-2032)
- Figure 41: North America Botanical Supplements Market Market Revenue (US$ Mn) Comparison by By Application (2016-2032)
- Figure 42: North America Botanical Supplements Market Market Revenue (US$ Mn) Comparison by By Distribution Channel (2016-2032)
- Figure 43: North America Botanical Supplements Market Market Y-o-Y Growth Rate Comparison by Country (2016-2032)
- Figure 44: North America Botanical Supplements Market Market Y-o-Y Growth Rate Comparison by By Source (2016-2032)
- Figure 45: North America Botanical Supplements Market Market Y-o-Y Growth Rate Comparison by By Form (2016-2032)
- Figure 46: North America Botanical Supplements Market Market Y-o-Y Growth Rate Comparison by By Application (2016-2032)
- Figure 47: North America Botanical Supplements Market Market Y-o-Y Growth Rate Comparison by By Distribution Channel (2016-2032)
- Figure 48: North America Botanical Supplements Market Market Share Comparison by Country (2016-2032)
- Figure 49: North America Botanical Supplements Market Market Share Comparison by By Source (2016-2032)
- Figure 50: North America Botanical Supplements Market Market Share Comparison by By Form (2016-2032)
- Figure 51: North America Botanical Supplements Market Market Share Comparison by By Application (2016-2032)
- Figure 52: North America Botanical Supplements Market Market Share Comparison by By Distribution Channel (2016-2032)
- Figure 53: Western Europe Botanical Supplements Market Revenue (US$ Mn) Market Share by By Sourcein 2022
- Figure 54: Western Europe Botanical Supplements Market Market Attractiveness Analysis by By Source, 2016-2032
- Figure 55: Western Europe Botanical Supplements Market Revenue (US$ Mn) Market Share by By Form in 2022
- Figure 56: Western Europe Botanical Supplements Market Market Attractiveness Analysis by By Form , 2016-2032
- Figure 57: Western Europe Botanical Supplements Market Revenue (US$ Mn) Market Share by By Applicationin 2022
- Figure 58: Western Europe Botanical Supplements Market Market Attractiveness Analysis by By Application, 2016-2032
- Figure 59: Western Europe Botanical Supplements Market Revenue (US$ Mn) Market Share by By Distribution Channel in 2022
- Figure 60: Western Europe Botanical Supplements Market Market Attractiveness Analysis by By Distribution Channel , 2016-2032
- Figure 61: Western Europe Botanical Supplements Market Revenue (US$ Mn) Market Share by Country in 2022
- Figure 62: Western Europe Botanical Supplements Market Market Attractiveness Analysis by Country, 2016-2032
- Figure 63: Western Europe Botanical Supplements Market Market Revenue (US$ Mn) (2016-2032)
- Figure 64: Western Europe Botanical Supplements Market Market Revenue (US$ Mn) Comparison by Country (2016-2032)
- Figure 65: Western Europe Botanical Supplements Market Market Revenue (US$ Mn) Comparison by By Source (2016-2032)
- Figure 66: Western Europe Botanical Supplements Market Market Revenue (US$ Mn) Comparison by By Form (2016-2032)
- Figure 67: Western Europe Botanical Supplements Market Market Revenue (US$ Mn) Comparison by By Application (2016-2032)
- Figure 68: Western Europe Botanical Supplements Market Market Revenue (US$ Mn) Comparison by By Distribution Channel (2016-2032)
- Figure 69: Western Europe Botanical Supplements Market Market Y-o-Y Growth Rate Comparison by Country (2016-2032)
- Figure 70: Western Europe Botanical Supplements Market Market Y-o-Y Growth Rate Comparison by By Source (2016-2032)
- Figure 71: Western Europe Botanical Supplements Market Market Y-o-Y Growth Rate Comparison by By Form (2016-2032)
- Figure 72: Western Europe Botanical Supplements Market Market Y-o-Y Growth Rate Comparison by By Application (2016-2032)
- Figure 73: Western Europe Botanical Supplements Market Market Y-o-Y Growth Rate Comparison by By Distribution Channel (2016-2032)
- Figure 74: Western Europe Botanical Supplements Market Market Share Comparison by Country (2016-2032)
- Figure 75: Western Europe Botanical Supplements Market Market Share Comparison by By Source (2016-2032)
- Figure 76: Western Europe Botanical Supplements Market Market Share Comparison by By Form (2016-2032)
- Figure 77: Western Europe Botanical Supplements Market Market Share Comparison by By Application (2016-2032)
- Figure 78: Western Europe Botanical Supplements Market Market Share Comparison by By Distribution Channel (2016-2032)
- Figure 79: Eastern Europe Botanical Supplements Market Revenue (US$ Mn) Market Share by By Sourcein 2022
- Figure 80: Eastern Europe Botanical Supplements Market Market Attractiveness Analysis by By Source, 2016-2032
- Figure 81: Eastern Europe Botanical Supplements Market Revenue (US$ Mn) Market Share by By Form in 2022
- Figure 82: Eastern Europe Botanical Supplements Market Market Attractiveness Analysis by By Form , 2016-2032
- Figure 83: Eastern Europe Botanical Supplements Market Revenue (US$ Mn) Market Share by By Applicationin 2022
- Figure 84: Eastern Europe Botanical Supplements Market Market Attractiveness Analysis by By Application, 2016-2032
- Figure 85: Eastern Europe Botanical Supplements Market Revenue (US$ Mn) Market Share by By Distribution Channel in 2022
- Figure 86: Eastern Europe Botanical Supplements Market Market Attractiveness Analysis by By Distribution Channel , 2016-2032
- Figure 87: Eastern Europe Botanical Supplements Market Revenue (US$ Mn) Market Share by Country in 2022
- Figure 88: Eastern Europe Botanical Supplements Market Market Attractiveness Analysis by Country, 2016-2032
- Figure 89: Eastern Europe Botanical Supplements Market Market Revenue (US$ Mn) (2016-2032)
- Figure 90: Eastern Europe Botanical Supplements Market Market Revenue (US$ Mn) Comparison by Country (2016-2032)
- Figure 91: Eastern Europe Botanical Supplements Market Market Revenue (US$ Mn) Comparison by By Source (2016-2032)
- Figure 92: Eastern Europe Botanical Supplements Market Market Revenue (US$ Mn) Comparison by By Form (2016-2032)
- Figure 93: Eastern Europe Botanical Supplements Market Market Revenue (US$ Mn) Comparison by By Application (2016-2032)
- Figure 94: Eastern Europe Botanical Supplements Market Market Revenue (US$ Mn) Comparison by By Distribution Channel (2016-2032)
- Figure 95: Eastern Europe Botanical Supplements Market Market Y-o-Y Growth Rate Comparison by Country (2016-2032)
- Figure 96: Eastern Europe Botanical Supplements Market Market Y-o-Y Growth Rate Comparison by By Source (2016-2032)
- Figure 97: Eastern Europe Botanical Supplements Market Market Y-o-Y Growth Rate Comparison by By Form (2016-2032)
- Figure 98: Eastern Europe Botanical Supplements Market Market Y-o-Y Growth Rate Comparison by By Application (2016-2032)
- Figure 99: Eastern Europe Botanical Supplements Market Market Y-o-Y Growth Rate Comparison by By Distribution Channel (2016-2032)
- Figure 100: Eastern Europe Botanical Supplements Market Market Share Comparison by Country (2016-2032)
- Figure 101: Eastern Europe Botanical Supplements Market Market Share Comparison by By Source (2016-2032)
- Figure 102: Eastern Europe Botanical Supplements Market Market Share Comparison by By Form (2016-2032)
- Figure 103: Eastern Europe Botanical Supplements Market Market Share Comparison by By Application (2016-2032)
- Figure 104: Eastern Europe Botanical Supplements Market Market Share Comparison by By Distribution Channel (2016-2032)
- Figure 105: APAC Botanical Supplements Market Revenue (US$ Mn) Market Share by By Sourcein 2022
- Figure 106: APAC Botanical Supplements Market Market Attractiveness Analysis by By Source, 2016-2032
- Figure 107: APAC Botanical Supplements Market Revenue (US$ Mn) Market Share by By Form in 2022
- Figure 108: APAC Botanical Supplements Market Market Attractiveness Analysis by By Form , 2016-2032
- Figure 109: APAC Botanical Supplements Market Revenue (US$ Mn) Market Share by By Applicationin 2022
- Figure 110: APAC Botanical Supplements Market Market Attractiveness Analysis by By Application, 2016-2032
- Figure 111: APAC Botanical Supplements Market Revenue (US$ Mn) Market Share by By Distribution Channel in 2022
- Figure 112: APAC Botanical Supplements Market Market Attractiveness Analysis by By Distribution Channel , 2016-2032
- Figure 113: APAC Botanical Supplements Market Revenue (US$ Mn) Market Share by Country in 2022
- Figure 114: APAC Botanical Supplements Market Market Attractiveness Analysis by Country, 2016-2032
- Figure 115: APAC Botanical Supplements Market Market Revenue (US$ Mn) (2016-2032)
- Figure 116: APAC Botanical Supplements Market Market Revenue (US$ Mn) Comparison by Country (2016-2032)
- Figure 117: APAC Botanical Supplements Market Market Revenue (US$ Mn) Comparison by By Source (2016-2032)
- Figure 118: APAC Botanical Supplements Market Market Revenue (US$ Mn) Comparison by By Form (2016-2032)
- Figure 119: APAC Botanical Supplements Market Market Revenue (US$ Mn) Comparison by By Application (2016-2032)
- Figure 120: APAC Botanical Supplements Market Market Revenue (US$ Mn) Comparison by By Distribution Channel (2016-2032)
- Figure 121: APAC Botanical Supplements Market Market Y-o-Y Growth Rate Comparison by Country (2016-2032)
- Figure 122: APAC Botanical Supplements Market Market Y-o-Y Growth Rate Comparison by By Source (2016-2032)
- Figure 123: APAC Botanical Supplements Market Market Y-o-Y Growth Rate Comparison by By Form (2016-2032)
- Figure 124: APAC Botanical Supplements Market Market Y-o-Y Growth Rate Comparison by By Application (2016-2032)
- Figure 125: APAC Botanical Supplements Market Market Y-o-Y Growth Rate Comparison by By Distribution Channel (2016-2032)
- Figure 126: APAC Botanical Supplements Market Market Share Comparison by Country (2016-2032)
- Figure 127: APAC Botanical Supplements Market Market Share Comparison by By Source (2016-2032)
- Figure 128: APAC Botanical Supplements Market Market Share Comparison by By Form (2016-2032)
- Figure 129: APAC Botanical Supplements Market Market Share Comparison by By Application (2016-2032)
- Figure 130: APAC Botanical Supplements Market Market Share Comparison by By Distribution Channel (2016-2032)
- Figure 131: Latin America Botanical Supplements Market Revenue (US$ Mn) Market Share by By Sourcein 2022
- Figure 132: Latin America Botanical Supplements Market Market Attractiveness Analysis by By Source, 2016-2032
- Figure 133: Latin America Botanical Supplements Market Revenue (US$ Mn) Market Share by By Form in 2022
- Figure 134: Latin America Botanical Supplements Market Market Attractiveness Analysis by By Form , 2016-2032
- Figure 135: Latin America Botanical Supplements Market Revenue (US$ Mn) Market Share by By Applicationin 2022
- Figure 136: Latin America Botanical Supplements Market Market Attractiveness Analysis by By Application, 2016-2032
- Figure 137: Latin America Botanical Supplements Market Revenue (US$ Mn) Market Share by By Distribution Channel in 2022
- Figure 138: Latin America Botanical Supplements Market Market Attractiveness Analysis by By Distribution Channel , 2016-2032
- Figure 139: Latin America Botanical Supplements Market Revenue (US$ Mn) Market Share by Country in 2022
- Figure 140: Latin America Botanical Supplements Market Market Attractiveness Analysis by Country, 2016-2032
- Figure 141: Latin America Botanical Supplements Market Market Revenue (US$ Mn) (2016-2032)
- Figure 142: Latin America Botanical Supplements Market Market Revenue (US$ Mn) Comparison by Country (2016-2032)
- Figure 143: Latin America Botanical Supplements Market Market Revenue (US$ Mn) Comparison by By Source (2016-2032)
- Figure 144: Latin America Botanical Supplements Market Market Revenue (US$ Mn) Comparison by By Form (2016-2032)
- Figure 145: Latin America Botanical Supplements Market Market Revenue (US$ Mn) Comparison by By Application (2016-2032)
- Figure 146: Latin America Botanical Supplements Market Market Revenue (US$ Mn) Comparison by By Distribution Channel (2016-2032)
- Figure 147: Latin America Botanical Supplements Market Market Y-o-Y Growth Rate Comparison by Country (2016-2032)
- Figure 148: Latin America Botanical Supplements Market Market Y-o-Y Growth Rate Comparison by By Source (2016-2032)
- Figure 149: Latin America Botanical Supplements Market Market Y-o-Y Growth Rate Comparison by By Form (2016-2032)
- Figure 150: Latin America Botanical Supplements Market Market Y-o-Y Growth Rate Comparison by By Application (2016-2032)
- Figure 151: Latin America Botanical Supplements Market Market Y-o-Y Growth Rate Comparison by By Distribution Channel (2016-2032)
- Figure 152: Latin America Botanical Supplements Market Market Share Comparison by Country (2016-2032)
- Figure 153: Latin America Botanical Supplements Market Market Share Comparison by By Source (2016-2032)
- Figure 154: Latin America Botanical Supplements Market Market Share Comparison by By Form (2016-2032)
- Figure 155: Latin America Botanical Supplements Market Market Share Comparison by By Application (2016-2032)
- Figure 156: Latin America Botanical Supplements Market Market Share Comparison by By Distribution Channel (2016-2032)
- Figure 157: Middle East & Africa Botanical Supplements Market Revenue (US$ Mn) Market Share by By Sourcein 2022
- Figure 158: Middle East & Africa Botanical Supplements Market Market Attractiveness Analysis by By Source, 2016-2032
- Figure 159: Middle East & Africa Botanical Supplements Market Revenue (US$ Mn) Market Share by By Form in 2022
- Figure 160: Middle East & Africa Botanical Supplements Market Market Attractiveness Analysis by By Form , 2016-2032
- Figure 161: Middle East & Africa Botanical Supplements Market Revenue (US$ Mn) Market Share by By Applicationin 2022
- Figure 162: Middle East & Africa Botanical Supplements Market Market Attractiveness Analysis by By Application, 2016-2032
- Figure 163: Middle East & Africa Botanical Supplements Market Revenue (US$ Mn) Market Share by By Distribution Channel in 2022
- Figure 164: Middle East & Africa Botanical Supplements Market Market Attractiveness Analysis by By Distribution Channel , 2016-2032
- Figure 165: Middle East & Africa Botanical Supplements Market Revenue (US$ Mn) Market Share by Country in 2022
- Figure 166: Middle East & Africa Botanical Supplements Market Market Attractiveness Analysis by Country, 2016-2032
- Figure 167: Middle East & Africa Botanical Supplements Market Market Revenue (US$ Mn) (2016-2032)
- Figure 168: Middle East & Africa Botanical Supplements Market Market Revenue (US$ Mn) Comparison by Country (2016-2032)
- Figure 169: Middle East & Africa Botanical Supplements Market Market Revenue (US$ Mn) Comparison by By Source (2016-2032)
- Figure 170: Middle East & Africa Botanical Supplements Market Market Revenue (US$ Mn) Comparison by By Form (2016-2032)
- Figure 171: Middle East & Africa Botanical Supplements Market Market Revenue (US$ Mn) Comparison by By Application (2016-2032)
- Figure 172: Middle East & Africa Botanical Supplements Market Market Revenue (US$ Mn) Comparison by By Distribution Channel (2016-2032)
- Figure 173: Middle East & Africa Botanical Supplements Market Market Y-o-Y Growth Rate Comparison by Country (2016-2032)
- Figure 174: Middle East & Africa Botanical Supplements Market Market Y-o-Y Growth Rate Comparison by By Source (2016-2032)
- Figure 175: Middle East & Africa Botanical Supplements Market Market Y-o-Y Growth Rate Comparison by By Form (2016-2032)
- Figure 176: Middle East & Africa Botanical Supplements Market Market Y-o-Y Growth Rate Comparison by By Application (2016-2032)
- Figure 177: Middle East & Africa Botanical Supplements Market Market Y-o-Y Growth Rate Comparison by By Distribution Channel (2016-2032)
- Figure 178: Middle East & Africa Botanical Supplements Market Market Share Comparison by Country (2016-2032)
- Figure 179: Middle East & Africa Botanical Supplements Market Market Share Comparison by By Source (2016-2032)
- Figure 180: Middle East & Africa Botanical Supplements Market Market Share Comparison by By Form (2016-2032)
- Figure 181: Middle East & Africa Botanical Supplements Market Market Share Comparison by By Application (2016-2032)
- Figure 182: Middle East & Africa Botanical Supplements Market Market Share Comparison by By Distribution Channel (2016-2032)
"
- List of Tables
- "
- Table 1: Global Botanical Supplements Market Market Comparison by By Source (2016-2032)
- Table 2: Global Botanical Supplements Market Market Comparison by By Form (2016-2032)
- Table 3: Global Botanical Supplements Market Market Comparison by By Application (2016-2032)
- Table 4: Global Botanical Supplements Market Market Comparison by By Distribution Channel (2016-2032)
- Table 5: Global Botanical Supplements Market Revenue (US$ Mn) Comparison by Region (2016-2032)
- Table 6: Global Botanical Supplements Market Market Revenue (US$ Mn) (2016-2032)
- Table 7: Global Botanical Supplements Market Market Revenue (US$ Mn) Comparison by Region (2016-2032)
- Table 8: Global Botanical Supplements Market Market Revenue (US$ Mn) Comparison by By Source (2016-2032)
- Table 9: Global Botanical Supplements Market Market Revenue (US$ Mn) Comparison by By Form (2016-2032)
- Table 10: Global Botanical Supplements Market Market Revenue (US$ Mn) Comparison by By Application (2016-2032)
- Table 11: Global Botanical Supplements Market Market Revenue (US$ Mn) Comparison by By Distribution Channel (2016-2032)
- Table 12: Global Botanical Supplements Market Market Y-o-Y Growth Rate Comparison by Region (2016-2032)
- Table 13: Global Botanical Supplements Market Market Y-o-Y Growth Rate Comparison by By Source (2016-2032)
- Table 14: Global Botanical Supplements Market Market Y-o-Y Growth Rate Comparison by By Form (2016-2032)
- Table 15: Global Botanical Supplements Market Market Y-o-Y Growth Rate Comparison by By Application (2016-2032)
- Table 16: Global Botanical Supplements Market Market Y-o-Y Growth Rate Comparison by By Distribution Channel (2016-2032)
- Table 17: Global Botanical Supplements Market Market Share Comparison by Region (2016-2032)
- Table 18: Global Botanical Supplements Market Market Share Comparison by By Source (2016-2032)
- Table 19: Global Botanical Supplements Market Market Share Comparison by By Form (2016-2032)
- Table 20: Global Botanical Supplements Market Market Share Comparison by By Application (2016-2032)
- Table 21: Global Botanical Supplements Market Market Share Comparison by By Distribution Channel (2016-2032)
- Table 22: North America Botanical Supplements Market Market Comparison by By Form (2016-2032)
- Table 23: North America Botanical Supplements Market Market Comparison by By Application (2016-2032)
- Table 24: North America Botanical Supplements Market Market Comparison by By Distribution Channel (2016-2032)
- Table 25: North America Botanical Supplements Market Revenue (US$ Mn) Comparison by Country (2016-2032)
- Table 26: North America Botanical Supplements Market Market Revenue (US$ Mn) (2016-2032)
- Table 27: North America Botanical Supplements Market Market Revenue (US$ Mn) Comparison by Country (2016-2032)
- Table 28: North America Botanical Supplements Market Market Revenue (US$ Mn) Comparison by By Source (2016-2032)
- Table 29: North America Botanical Supplements Market Market Revenue (US$ Mn) Comparison by By Form (2016-2032)
- Table 30: North America Botanical Supplements Market Market Revenue (US$ Mn) Comparison by By Application (2016-2032)
- Table 31: North America Botanical Supplements Market Market Revenue (US$ Mn) Comparison by By Distribution Channel (2016-2032)
- Table 32: North America Botanical Supplements Market Market Y-o-Y Growth Rate Comparison by Country (2016-2032)
- Table 33: North America Botanical Supplements Market Market Y-o-Y Growth Rate Comparison by By Source (2016-2032)
- Table 34: North America Botanical Supplements Market Market Y-o-Y Growth Rate Comparison by By Form (2016-2032)
- Table 35: North America Botanical Supplements Market Market Y-o-Y Growth Rate Comparison by By Application (2016-2032)
- Table 36: North America Botanical Supplements Market Market Y-o-Y Growth Rate Comparison by By Distribution Channel (2016-2032)
- Table 37: North America Botanical Supplements Market Market Share Comparison by Country (2016-2032)
- Table 38: North America Botanical Supplements Market Market Share Comparison by By Source (2016-2032)
- Table 39: North America Botanical Supplements Market Market Share Comparison by By Form (2016-2032)
- Table 40: North America Botanical Supplements Market Market Share Comparison by By Application (2016-2032)
- Table 41: North America Botanical Supplements Market Market Share Comparison by By Distribution Channel (2016-2032)
- Table 42: Western Europe Botanical Supplements Market Market Comparison by By Source (2016-2032)
- Table 43: Western Europe Botanical Supplements Market Market Comparison by By Form (2016-2032)
- Table 44: Western Europe Botanical Supplements Market Market Comparison by By Application (2016-2032)
- Table 45: Western Europe Botanical Supplements Market Market Comparison by By Distribution Channel (2016-2032)
- Table 46: Western Europe Botanical Supplements Market Revenue (US$ Mn) Comparison by Country (2016-2032)
- Table 47: Western Europe Botanical Supplements Market Market Revenue (US$ Mn) (2016-2032)
- Table 48: Western Europe Botanical Supplements Market Market Revenue (US$ Mn) Comparison by Country (2016-2032)
- Table 49: Western Europe Botanical Supplements Market Market Revenue (US$ Mn) Comparison by By Source (2016-2032)
- Table 50: Western Europe Botanical Supplements Market Market Revenue (US$ Mn) Comparison by By Form (2016-2032)
- Table 51: Western Europe Botanical Supplements Market Market Revenue (US$ Mn) Comparison by By Application (2016-2032)
- Table 52: Western Europe Botanical Supplements Market Market Revenue (US$ Mn) Comparison by By Distribution Channel (2016-2032)
- Table 53: Western Europe Botanical Supplements Market Market Y-o-Y Growth Rate Comparison by Country (2016-2032)
- Table 54: Western Europe Botanical Supplements Market Market Y-o-Y Growth Rate Comparison by By Source (2016-2032)
- Table 55: Western Europe Botanical Supplements Market Market Y-o-Y Growth Rate Comparison by By Form (2016-2032)
- Table 56: Western Europe Botanical Supplements Market Market Y-o-Y Growth Rate Comparison by By Application (2016-2032)
- Table 57: Western Europe Botanical Supplements Market Market Y-o-Y Growth Rate Comparison by By Distribution Channel (2016-2032)
- Table 58: Western Europe Botanical Supplements Market Market Share Comparison by Country (2016-2032)
- Table 59: Western Europe Botanical Supplements Market Market Share Comparison by By Source (2016-2032)
- Table 60: Western Europe Botanical Supplements Market Market Share Comparison by By Form (2016-2032)
- Table 61: Western Europe Botanical Supplements Market Market Share Comparison by By Application (2016-2032)
- Table 62: Western Europe Botanical Supplements Market Market Share Comparison by By Distribution Channel (2016-2032)
- Table 63: Eastern Europe Botanical Supplements Market Market Comparison by By Source (2016-2032)
- Table 64: Eastern Europe Botanical Supplements Market Market Comparison by By Form (2016-2032)
- Table 65: Eastern Europe Botanical Supplements Market Market Comparison by By Application (2016-2032)
- Table 66: Eastern Europe Botanical Supplements Market Market Comparison by By Distribution Channel (2016-2032)
- Table 67: Eastern Europe Botanical Supplements Market Revenue (US$ Mn) Comparison by Country (2016-2032)
- Table 68: Eastern Europe Botanical Supplements Market Market Revenue (US$ Mn) (2016-2032)
- Table 69: Eastern Europe Botanical Supplements Market Market Revenue (US$ Mn) Comparison by Country (2016-2032)
- Table 70: Eastern Europe Botanical Supplements Market Market Revenue (US$ Mn) Comparison by By Source (2016-2032)
- Table 71: Eastern Europe Botanical Supplements Market Market Revenue (US$ Mn) Comparison by By Form (2016-2032)
- Table 72: Eastern Europe Botanical Supplements Market Market Revenue (US$ Mn) Comparison by By Application (2016-2032)
- Table 73: Eastern Europe Botanical Supplements Market Market Revenue (US$ Mn) Comparison by By Distribution Channel (2016-2032)
- Table 74: Eastern Europe Botanical Supplements Market Market Y-o-Y Growth Rate Comparison by Country (2016-2032)
- Table 75: Eastern Europe Botanical Supplements Market Market Y-o-Y Growth Rate Comparison by By Source (2016-2032)
- Table 76: Eastern Europe Botanical Supplements Market Market Y-o-Y Growth Rate Comparison by By Form (2016-2032)
- Table 77: Eastern Europe Botanical Supplements Market Market Y-o-Y Growth Rate Comparison by By Application (2016-2032)
- Table 78: Eastern Europe Botanical Supplements Market Market Y-o-Y Growth Rate Comparison by By Distribution Channel (2016-2032)
- Table 79: Eastern Europe Botanical Supplements Market Market Share Comparison by Country (2016-2032)
- Table 80: Eastern Europe Botanical Supplements Market Market Share Comparison by By Source (2016-2032)
- Table 81: Eastern Europe Botanical Supplements Market Market Share Comparison by By Form (2016-2032)
- Table 82: Eastern Europe Botanical Supplements Market Market Share Comparison by By Application (2016-2032)
- Table 83: Eastern Europe Botanical Supplements Market Market Share Comparison by By Distribution Channel (2016-2032)
- Table 84: APAC Botanical Supplements Market Market Comparison by By Source (2016-2032)
- Table 85: APAC Botanical Supplements Market Market Comparison by By Form (2016-2032)
- Table 86: APAC Botanical Supplements Market Market Comparison by By Application (2016-2032)
- Table 87: APAC Botanical Supplements Market Market Comparison by By Distribution Channel (2016-2032)
- Table 88: APAC Botanical Supplements Market Revenue (US$ Mn) Comparison by Country (2016-2032)
- Table 89: APAC Botanical Supplements Market Market Revenue (US$ Mn) (2016-2032)
- Table 90: APAC Botanical Supplements Market Market Revenue (US$ Mn) Comparison by Country (2016-2032)
- Table 91: APAC Botanical Supplements Market Market Revenue (US$ Mn) Comparison by By Source (2016-2032)
- Table 92: APAC Botanical Supplements Market Market Revenue (US$ Mn) Comparison by By Form (2016-2032)
- Table 93: APAC Botanical Supplements Market Market Revenue (US$ Mn) Comparison by By Application (2016-2032)
- Table 94: APAC Botanical Supplements Market Market Revenue (US$ Mn) Comparison by By Distribution Channel (2016-2032)
- Table 95: APAC Botanical Supplements Market Market Y-o-Y Growth Rate Comparison by Country (2016-2032)
- Table 96: APAC Botanical Supplements Market Market Y-o-Y Growth Rate Comparison by By Source (2016-2032)
- Table 97: APAC Botanical Supplements Market Market Y-o-Y Growth Rate Comparison by By Form (2016-2032)
- Table 98: APAC Botanical Supplements Market Market Y-o-Y Growth Rate Comparison by By Application (2016-2032)
- Table 99: APAC Botanical Supplements Market Market Y-o-Y Growth Rate Comparison by By Distribution Channel (2016-2032)
- Table 100: APAC Botanical Supplements Market Market Share Comparison by Country (2016-2032)
- Table 101: APAC Botanical Supplements Market Market Share Comparison by By Source (2016-2032)
- Table 102: APAC Botanical Supplements Market Market Share Comparison by By Form (2016-2032)
- Table 103: APAC Botanical Supplements Market Market Share Comparison by By Application (2016-2032)
- Table 104: APAC Botanical Supplements Market Market Share Comparison by By Distribution Channel (2016-2032)
- Table 105: Latin America Botanical Supplements Market Market Comparison by By Source (2016-2032)
- Table 106: Latin America Botanical Supplements Market Market Comparison by By Form (2016-2032)
- Table 107: Latin America Botanical Supplements Market Market Comparison by By Application (2016-2032)
- Table 108: Latin America Botanical Supplements Market Market Comparison by By Distribution Channel (2016-2032)
- Table 109: Latin America Botanical Supplements Market Revenue (US$ Mn) Comparison by Country (2016-2032)
- Table 110: Latin America Botanical Supplements Market Market Revenue (US$ Mn) (2016-2032)
- Table 111: Latin America Botanical Supplements Market Market Revenue (US$ Mn) Comparison by Country (2016-2032)
- Table 112: Latin America Botanical Supplements Market Market Revenue (US$ Mn) Comparison by By Source (2016-2032)
- Table 113: Latin America Botanical Supplements Market Market Revenue (US$ Mn) Comparison by By Form (2016-2032)
- Table 114: Latin America Botanical Supplements Market Market Revenue (US$ Mn) Comparison by By Application (2016-2032)
- Table 115: Latin America Botanical Supplements Market Market Revenue (US$ Mn) Comparison by By Distribution Channel (2016-2032)
- Table 116: Latin America Botanical Supplements Market Market Y-o-Y Growth Rate Comparison by Country (2016-2032)
- Table 117: Latin America Botanical Supplements Market Market Y-o-Y Growth Rate Comparison by By Source (2016-2032)
- Table 118: Latin America Botanical Supplements Market Market Y-o-Y Growth Rate Comparison by By Form (2016-2032)
- Table 119: Latin America Botanical Supplements Market Market Y-o-Y Growth Rate Comparison by By Application (2016-2032)
- Table 120: Latin America Botanical Supplements Market Market Y-o-Y Growth Rate Comparison by By Distribution Channel (2016-2032)
- Table 121: Latin America Botanical Supplements Market Market Share Comparison by Country (2016-2032)
- Table 122: Latin America Botanical Supplements Market Market Share Comparison by By Source (2016-2032)
- Table 123: Latin America Botanical Supplements Market Market Share Comparison by By Form (2016-2032)
- Table 124: Latin America Botanical Supplements Market Market Share Comparison by By Application (2016-2032)
- Table 125: Latin America Botanical Supplements Market Market Share Comparison by By Distribution Channel (2016-2032)
- Table 126: Middle East & Africa Botanical Supplements Market Market Comparison by By Source (2016-2032)
- Table 127: Middle East & Africa Botanical Supplements Market Market Comparison by By Form (2016-2032)
- Table 128: Middle East & Africa Botanical Supplements Market Market Comparison by By Application (2016-2032)
- Table 129: Middle East & Africa Botanical Supplements Market Market Comparison by By Distribution Channel (2016-2032)
- Table 130: Middle East & Africa Botanical Supplements Market Revenue (US$ Mn) Comparison by Country (2016-2032)
- Table 131: Middle East & Africa Botanical Supplements Market Market Revenue (US$ Mn) (2016-2032)
- Table 132: Middle East & Africa Botanical Supplements Market Market Revenue (US$ Mn) Comparison by Country (2016-2032)
- Table 133: Middle East & Africa Botanical Supplements Market Market Revenue (US$ Mn) Comparison by By Source (2016-2032)
- Table 134: Middle East & Africa Botanical Supplements Market Market Revenue (US$ Mn) Comparison by By Form (2016-2032)
- Table 135: Middle East & Africa Botanical Supplements Market Market Revenue (US$ Mn) Comparison by By Application (2016-2032)
- Table 136: Middle East & Africa Botanical Supplements Market Market Revenue (US$ Mn) Comparison by By Distribution Channel (2016-2032)
- Table 137: Middle East & Africa Botanical Supplements Market Market Y-o-Y Growth Rate Comparison by Country (2016-2032)
- Table 138: Middle East & Africa Botanical Supplements Market Market Y-o-Y Growth Rate Comparison by By Source (2016-2032)
- Table 139: Middle East & Africa Botanical Supplements Market Market Y-o-Y Growth Rate Comparison by By Form (2016-2032)
- Table 140: Middle East & Africa Botanical Supplements Market Market Y-o-Y Growth Rate Comparison by By Application (2016-2032)
- Table 141: Middle East & Africa Botanical Supplements Market Market Y-o-Y Growth Rate Comparison by By Distribution Channel (2016-2032)
- Table 142: Middle East & Africa Botanical Supplements Market Market Share Comparison by Country (2016-2032)
- Table 143: Middle East & Africa Botanical Supplements Market Market Share Comparison by By Source (2016-2032)
- Table 144: Middle East & Africa Botanical Supplements Market Market Share Comparison by By Form (2016-2032)
- Table 145: Middle East & Africa Botanical Supplements Market Market Share Comparison by By Application (2016-2032)
- Table 146: Middle East & Africa Botanical Supplements Market Market Share Comparison by By Distribution Channel (2016-2032)
- 1. Executive Summary
-
- Dabur India
- NBTY Inc.
- Ricola AG.
- Mondelez International
- Procter and Gamble
- Nutraceutical International Company
- BASF SE
- The Himalaya Drug Company
- Glanbia Nutritionals
- Botanicalife International of America, Inc.
- Blackmores Limited
Our Clients


View Our Licence Options
