Block Margarine Market Report By Type (Soft, Hard), By Nature (Organic, Conventional), By Distributional Channel (Online, Offline), By Application (Bakery, Confectionaries, Spreads, Households, Other applications), By Region and Companies - Industry Segment Outlook, Market Assessment, Competition Scenario, Trends and Forecast 2024-2033
-
46199
-
May 2024
-
321
-


-
This report was compiled by Shreyas Rokade Shreyas Rokade is a seasoned Research Analyst with CMFE, bringing extensive expertise in market research and consulting, with a strong background in Chemical Engineering. Correspondence Team Lead-CMFE Linkedin | Detailed Market research Methodology Our methodology involves a mix of primary research, including interviews with leading mental health experts, and secondary research from reputable medical journals and databases. View Detailed Methodology Page
-
Quick Navigation
Report Overview
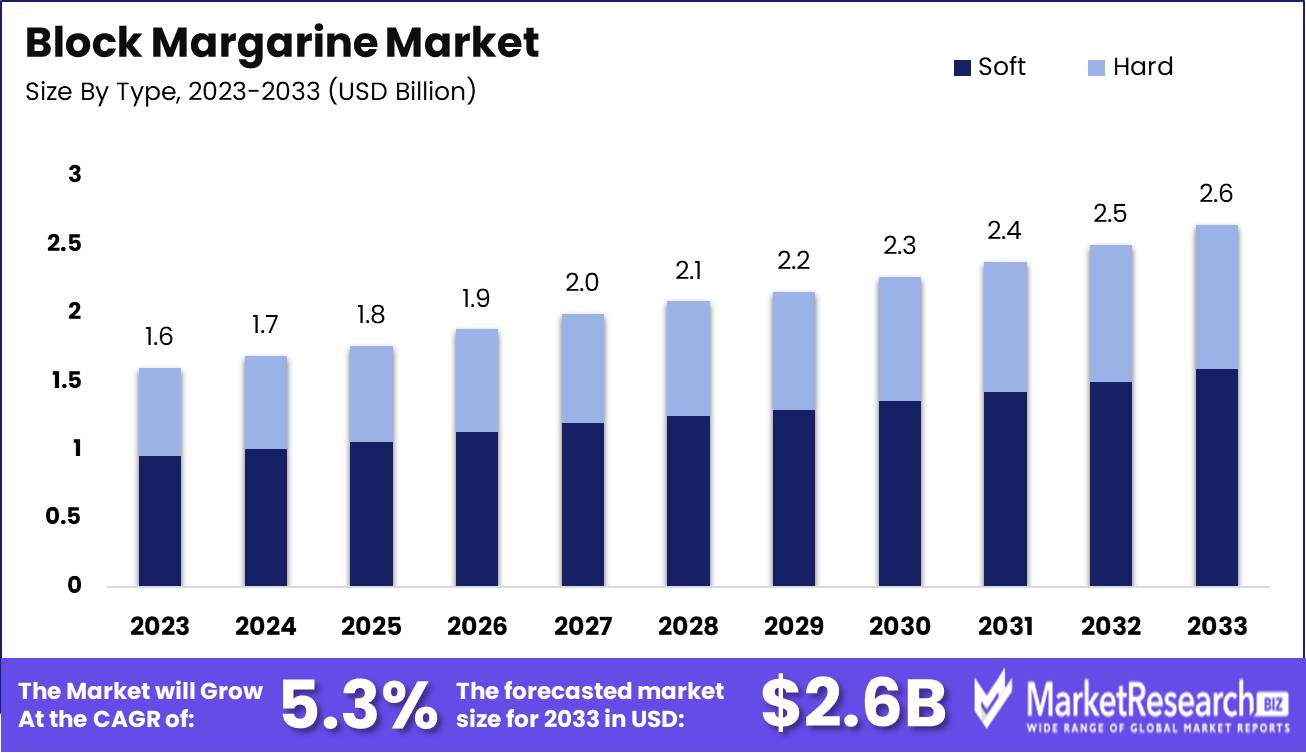
The Global Block Margarine Market size is expected to be worth around USD 2.6 billion by 2033, from USD 1.6 billion in 2023, growing at a CAGR of 5.3% during the forecast period from 2024 to 2033.
The Block Margarine Market encompasses the sector of the food industry specializing in the production and distribution of solid, block-shaped margarine products. These margarines are versatile substitutes for butter, favored for their convenience, spreadability, and lower cost.
The market is driven by shifting consumer preferences towards healthier alternatives, convenience foods, and plant-based options. Key players in this market focus on product innovation, quality assurance, and sustainable sourcing practices to meet evolving consumer demands and regulatory standards. Strategic partnerships, mergers, and acquisitions are common strategies employed to strengthen market position and expand distribution networks.
The Block Margarine Market is poised for steady growth in the coming years, driven by a combination of factors including shifting consumer preferences, dietary trends, and technological advancements in manufacturing processes. With global production of margarine estimated at approximately 9.5 million metric tons in 2021, the market showcases resilience and adaptability in meeting evolving consumer demands. The United States, Germany, Mexico, and Russia emerge as key players in margarine production, reflecting the market's global footprint and diverse supplier landscape.
High per capita consumption rates in countries such as Germany, Poland, and select African nations like Morocco underscore the widespread acceptance and usage of margarine as a versatile culinary ingredient and butter substitute.
Amidst changing dietary preferences and health-conscious consumer behaviors, manufacturers in the Block Margarine Market are innovating to offer healthier, plant-based alternatives, fortified with essential nutrients and free from trans fats. Additionally, advancements in production technologies are enhancing product quality, shelf life, and sensory attributes, further fueling market growth.
As the market continues to evolve, stakeholders must remain attuned to consumer preferences, regulatory developments, and competitive dynamics. Strategic investments in research and development, product diversification, and marketing initiatives will be crucial for companies seeking to capitalize on emerging growth opportunities and maintain a competitive edge in this dynamic landscape. Overall, the Block Margarine Market presents promising prospects for growth and innovation, underpinned by shifting consumer lifestyles and evolving market dynamics.
Key Takeaways
- Market Value: USD 1.6 billion in 2023; growing at a CAGR of 5.3%; expected to reach USD 2.6 billion by 2033.
- Type Analysis: Soft margarine dominates with 54.3%; widely used in baking due to its ease of use and versatility.
- Nature Analysis: Conventional margarine dominates; preferred for its availability and cost-effectiveness.
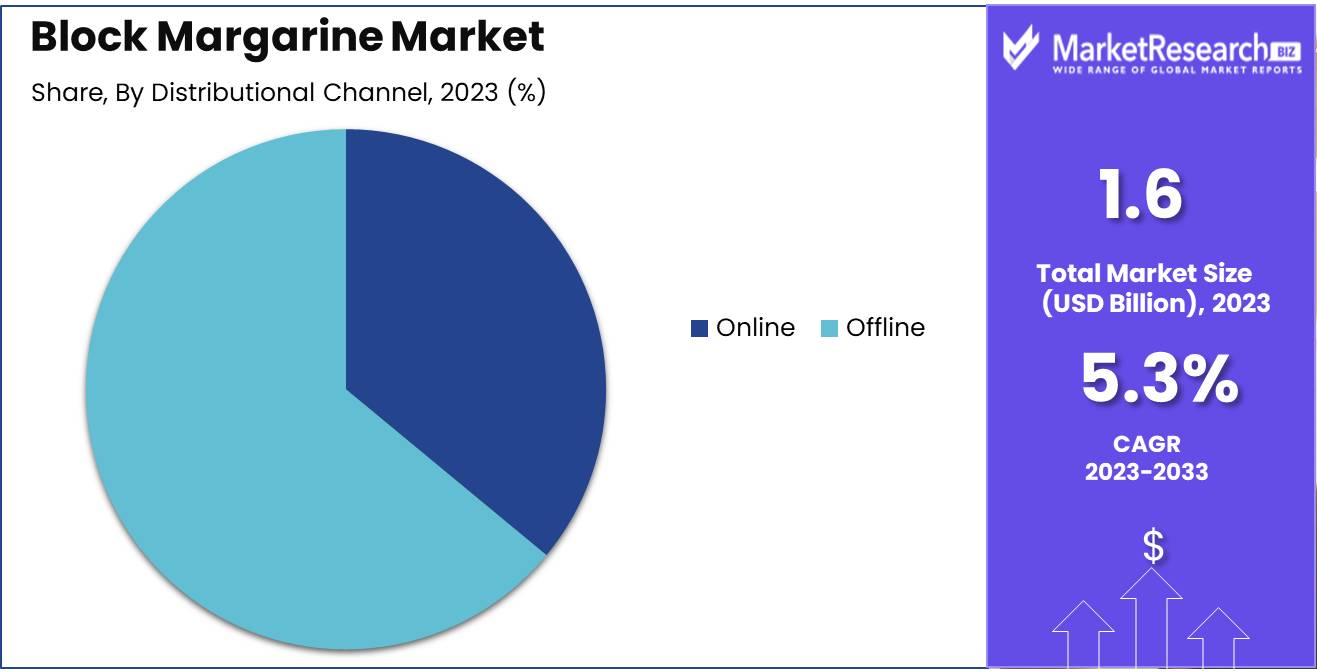
- Distribution Channel Analysis: Offline channels dominate with 64%; preferred for in-person purchases and promotional opportunities.
- Application Analysis: The bakery segment dominates with 34.3%; high demand for baked goods drives this segment.
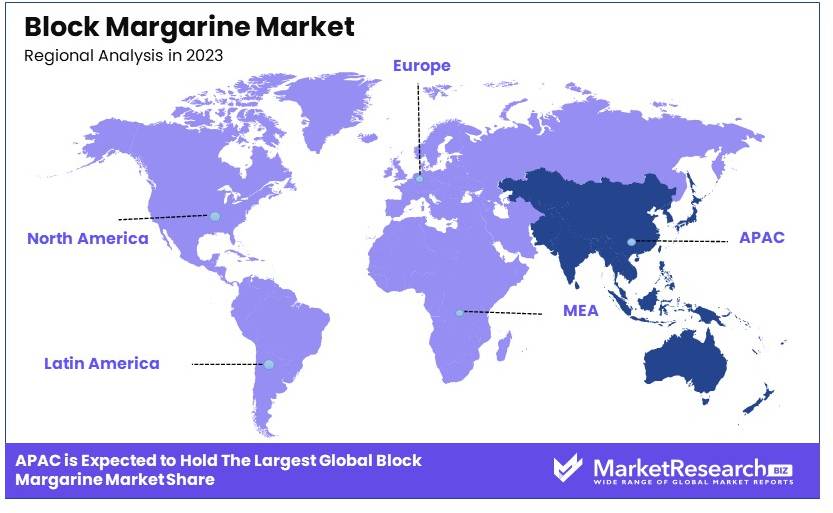
- Dominant Region: APAC dominates with 38.6%; significant market share due to large consumer base and growing food industry.
- High Growth: North America; significant market presence with steady growth due to high consumption of margarine in baking and cooking.
- Analyst Viewpoint: The market is expected to grow steadily with moderate competition. Future predictions highlight growth in organic margarine and online distribution channels.
- Growth Opportunities: Key players can leverage opportunities in organic products, expand online presence, and innovate with new formulations to meet consumer preferences.
Driving Factors
Increasing Demand for Convenient and Cost-Effective Bakery Products Drives Market Growth
The Block Margarine Market is experiencing growth due to the increasing demand for convenient and cost-effective bakery products. Block margarine is a key ingredient in the production of various baked goods, including cakes, pastries, and bread. Consumers are increasingly seeking affordable and readily available baked items, which boosts the demand for block margarine. This trend is particularly evident in the rise of industrial bakeries and quick-service restaurants, which rely heavily on block margarine for their products.
For instance, the global bakery market is projected to reach USD 600 billion by 2025, growing at a CAGR of 3.9% from 2023 to 2032. This expansion fuels the demand for block margarine, as it is a cost-effective and versatile ingredient. Additionally, the shift towards home baking during the COVID-19 pandemic has also contributed to the increased demand for baking ingredients, including block margarine. As consumers continue to value convenience and cost-effectiveness, the block margarine market is expected to grow.
Versatility in Applications Drives Market Growth
The versatility of block margarine extends its applications beyond the bakery industry, significantly driving market growth. Block margarine is used in confectioneries, sauces, and spreads, making it a valuable functional ingredient across various food sectors. The food manufacturing industry's need for cost-effective and functional fats has increased the demand for block margarine.
For example, many snack food manufacturers use block margarine as a cost-effective alternative to butter or other premium fats. The global snack food market, valued at USD 450 billion in 2023, is expected to grow at a CAGR of 4.2% from 2024 to 2032. This growth in the snack food sector further boosts the demand for block margarine. Moreover, the dairy alternatives market, which includes margarine, is projected to reach USD 35 billion by 2027, growing at a CAGR of 10.5% from 2020 to 2027. The broad range of applications for block margarine ensures its continued demand and market expansion.
Advancements in Formulations and Health Considerations Drive Market Growth
Advancements in block margarine formulations and increasing health considerations are significant drivers of market growth. Manufacturers are continually improving block margarine to meet evolving consumer preferences and health concerns. The development of trans-fat-free and low-fat variants has opened up new market opportunities. Health-conscious consumers are increasingly seeking healthier alternatives, driving the demand for improved block margarine products.
For instance, the introduction of plant-based block margarines made from sustainable and healthy oils has gained traction. The global plant-based food market, which includes plant-based margarine, is projected to reach USD 74.2 billion by 2027, growing at a CAGR of 11.9% from 2020 to 2027. This shift towards healthier and more sustainable products significantly impacts the block margarine market. Additionally, regulatory changes and guidelines promoting healthier food options support the market's growth. The combination of improved formulations and health considerations ensures a positive outlook for the block margarine market.
Restraining Factors
Health Concerns and Negative Perceptions Restrain Market Growth
Health concerns and negative perceptions about block margarine limit its market growth. Despite improvements in formulations, some consumers remain wary of potential health risks. Margarine has been associated with trans fats and artificial ingredients, which are perceived as unhealthy. This perception drives consumers towards more natural alternatives like butter or plant-based oils.
Awareness of the potential health risks of trans fats has led many to reduce their intake of margarine-based products. For example, a study found that a 2% increase in trans fat consumption is associated with a 23% increase in cardiovascular disease risk. As a result, consumers are increasingly choosing healthier options, restraining the growth of the block margarine market.
Competition from Alternatives and Substitutes Restrains Market Growth
The block margarine market faces significant competition from alternatives like butter, plant-based oils, and other specialty fats. As consumer preferences shift towards healthier and more natural options, the demand for these alternatives has increased. The rise of plant-based diets and the popularity of vegan and vegetarian lifestyles further contribute to the demand for substitute products.
Additionally, the increasing use of olive oil and avocado oil in baking and cooking has impacted the demand for block margarine in certain consumer segments. This competition limits the growth potential of the block margarine market.
Type Analysis
Soft margarine dominates with 54.3% due to its wide application and ease of use in baking.
The block margarine market is segmented by type into soft and hard margarine. Soft margarine dominates the market with a significant share of 54.3%. This dominance is due to its wide application in both industrial and household baking. Soft margarine is preferred for its ease of use, spreadability, and ability to blend well with other ingredients, making it ideal for cakes, pastries, and bread. The market for soft margarine is driven by the growing demand for convenient and cost-effective baking solutions. Industrial bakeries and quick-service restaurants favor soft margarine for its consistency and functional properties, which enhance the texture and flavor of baked goods.
Hard margarine, while less dominant, plays a crucial role in the market. It is primarily used in professional baking and confectionery applications where a firmer texture is required. Hard margarine is valued for its stability at higher temperatures and its ability to create flakier pastries and pie crusts. Although it holds a smaller market share, hard margarine's demand is supported by its specialized applications in the food industry.
Nature Analysis
Conventional margarine dominates due to its widespread availability and cost-effectiveness.
The block margarine market is segmented by nature into organic and conventional margarine. Conventional margarine currently holds the majority share in the market. This segment's dominance is attributed to its widespread availability, cost-effectiveness, and longer shelf life. Conventional margarine is preferred by many consumers and food manufacturers due to its affordability and versatility. It is used extensively in commercial baking, food manufacturing, and household cooking, contributing to its large market share.
Organic margarine, while representing a smaller segment, is gaining traction as consumers become more health-conscious and environmentally aware. The demand for organic margarine is driven by the growing preference for natural and sustainably sourced ingredients. Organic margarine is free from synthetic additives and preservatives, appealing to consumers seeking healthier and more natural food options. The global organic food market, projected to reach USD 272.18 billion by 2027, supports the increasing demand for organic margarine. As consumer awareness and preference for organic products rise, this segment is expected to grow, although it currently lags behind conventional margarine.
Distribution Channel Analysis
Offline channels dominate with 64% due to consumer preference for in-person purchases and promotions.
The distribution channel analysis of the block margarine market reveals that the offline segment dominates with a 64% market share. Offline channels, including supermarkets, hypermarkets, and specialty stores, are the primary points of sale for block margarine. These retail outlets offer consumers the advantage of immediate purchase and the ability to compare products directly. The prominence of offline channels is driven by consumer preference for buying groceries and food products in person, where they can ensure product quality and freshness. Furthermore, offline stores often run promotions and discounts, attracting a larger customer base.
The online distribution channel, while currently smaller, is rapidly gaining importance. The convenience of online shopping, coupled with the increasing penetration of e-commerce platforms, is driving growth in this segment. Consumers appreciate the ease of ordering from home, extensive product variety, and doorstep delivery services. The COVID-19 pandemic has accelerated the shift towards online shopping, with many consumers opting for contactless purchasing options. The global e-commerce food and beverage market, expected to reach USD 71.62 billion by 2028, underscores the potential growth of the online segment in the block margarine market.
Application Analysis
The bakery segment dominates with 34.3% due to high demand for baked goods.
The block margarine market is segmented by application into bakery, confectioneries, spreads, households, and other applications. The bakery segment is the dominant sub-segment, holding a 34.3% market share. Block margarine's extensive use in baking drives this dominance. It is a crucial ingredient in cakes, pastries, bread, and other baked goods, offering the desired texture, flavor, and consistency. The demand for bakery products is high in both commercial and household settings, supporting the growth of this segment. The global bakery market, projected to reach USD 600 billion by 2025, reflects the strong demand for block margarine in this application.
Confectioneries, spreads, and household uses represent other significant segments. In confectioneries, block margarine is used for making various sweets and treats, contributing to the segment's growth. The spreads segment benefits from the versatility of margarine as a convenient and affordable alternative to butter. Households use block margarine for everyday cooking and baking, adding to its market presence. Other applications, though smaller in share, include its use in sauces and prepared foods, further diversifying the market's scope.
Key Market Segments
By Type
- Soft
- Hard
By Nature
- Organic
- Conventional
By Distributional Channel
- Online
- Offline
By Application
- Bakery
- Confectionaries
- Spreads
- Households
- Other applications
Growth Opportunities
Product Innovation and Formulation Improvements Offer Growth Opportunity
Product innovation and formulation improvements present significant growth opportunities in the block margarine market. Manufacturers can address evolving consumer preferences and health concerns by developing products with enhanced nutritional profiles. For example, block margarines with healthier oils, reduced trans fats, or fortified with essential vitamins and minerals can attract health-conscious consumers.
The introduction of block margarines enriched with plant-based omega-3 fatty acids or vitamins can appeal to those seeking functional food products. This focus on health benefits aligns with the increasing demand for healthier food options. The global functional food market is projected to reach USD 275.77 billion by 2025, growing at a CAGR of 7.9% from 2020 to 2025. By leveraging innovation, manufacturers can tap into this expanding market, driving growth and capturing new consumer segments.
Sustainable and Ethical Sourcing Offers Growth Opportunity
Sustainable and ethical sourcing offers a significant growth opportunity in the block margarine market. Consumers are increasingly aware of the environmental and social impacts of their purchases. Manufacturers can differentiate their products by emphasizing sustainable and ethical sourcing practices. This includes using responsibly sourced and sustainably produced ingredients, eco-friendly manufacturing processes, and promoting fair trade and ethical labor practices.
Brands that use sustainably sourced palm oil or other plant-based oils can resonate with environmentally conscious consumers. By addressing these concerns, manufacturers can appeal to a broader consumer base and gain a competitive advantage in the market.
Trending Factors
Clean Label and Transparency Trends Are Trending Factors
Clean label and transparency trends are driving growth in the block margarine market. Consumers are increasingly demanding simple, transparent ingredient lists and fewer artificial additives. Manufacturers respond by offering block margarines with clean labels, featuring recognizable and natural ingredients.
Transparent labeling that details product ingredients and nutritional content appeals to health-conscious consumers. For instance, brands that highlight the use of simple, recognizable ingredients and provide clear labeling resonate with consumers seeking clean and transparent food products. This trend emphasizes the importance of transparency and simplicity in driving consumer preference and market growth.
Plant-Based and Vegan Alternatives Are Trending Factors
The increasing popularity of plant-based diets and veganism is a significant trend in the block margarine market. There is growing demand for plant-based and vegan-friendly alternatives to traditional dairy-based products. Manufacturers have the opportunity to develop block margarines made from plant-based oils and free from animal-derived ingredients.
Offering vegan-certified block margarines caters to this expanding consumer segment. For example, block margarines made from coconut oil or other plant-based sources appeal to consumers following a vegan or plant-based lifestyle. This trend highlights the shift towards plant-based products and the potential for market expansion.
Regional Analysis
APAC Dominates with 38.6% Market Share
The Asia-Pacific (APAC) region leads the block margarine market with a 38.6% market share. This dominance is driven by several key factors.
High population density and growing urbanization in countries like China and India boost the demand for convenient and affordable food products, including block margarine. The rise in disposable incomes and changing dietary habits further support market growth. Additionally, the expanding food processing industry and increasing number of bakeries and quick-service restaurants in the region contribute significantly to the demand for block margarine.
APAC's diverse culinary traditions and the increasing adoption of Western-style baking influence the block margarine market positively. The region's large base of cost-sensitive consumers favors block margarine over more expensive alternatives. Furthermore, government initiatives promoting the food processing sector and favorable trade policies enhance the market environment. For instance, the food processing industry in India is expected to grow at a CAGR of 11.0% from 2020 to 2025, driving the demand for block margarine.
North America Market Share and Growth Rate
North America holds a significant share of the block margarine market, driven by high consumer awareness and preference for healthier food options. The market in this region is projected to grow at a CAGR of 3.5% from 2020 to 2025. The emphasis on clean label products and the increasing demand for plant-based alternatives contribute to this growth.
Europe Market Share and Growth Rate
Europe accounts for a substantial market share, supported by the region's well-established food processing industry and strong demand for bakery products. The European market is expected to grow at a CAGR of 4.2% from 2020 to 2025. The trend towards sustainable and organic food products further drives the demand for block margarine in Europe.
Middle East & Africa Market Share and Growth Rate
The Middle East & Africa region holds a smaller share of the block margarine market but shows potential for growth. The market is expected to grow at a CAGR of 4.5% from 2020 to 2025, driven by the rising demand for bakery products and the increasing influence of Western dietary habits.
Latin America Market Share and Growth Rate
Latin America has a growing market share in the block margarine industry, supported by the expanding food and beverage sector. The market in this region is projected to grow at a CAGR of 3.8% from 2020 to 2025. The increasing popularity of convenience foods and the rise of quick-service restaurants contribute to the market's growth in Latin America.
Key Regions and Countries
- North America
- The US
- Canada
- Mexico
- Western Europe
- Germany
- France
- The UK
- Spain
- Italy
- Portugal
- Ireland
- Austria
- Switzerland
- Benelux
- Nordic
- Rest of Western Europe
- Eastern Europe
- Russia
- Poland
- The Czech Republic
- Greece
- Rest of Eastern Europe
- APAC
- China
- Japan
- South Korea
- India
- Australia & New Zealand
- Indonesia
- Malaysia
- Philippines
- Singapore
- Thailand
- Vietnam
- Rest of APAC
- Latin America
- Brazil
- Colombia
- Chile
- Argentina
- Costa Rica
- Rest of Latin America
- Middle East & Africa
- Algeria
- Egypt
- Israel
- Kuwait
- Nigeria
- Saudi Arabia
- South Africa
- Turkey
- United Arab Emirates
- Rest of MEA
Key Players Analysis
In the Block Margarine Market, Unilever and Bunge Limited stand out as leading players, leveraging their extensive distribution networks and brand strength to dominate the market. Together with Upfield and Conagra Brands, Inc., these companies influence market trends through their commitment to innovation and consumer-focused products.
Unilever, in particular, benefits from strong brand recognition and a diverse product portfolio that meets various consumer needs, from baking to general cooking uses. Bunge's strategic focus on expanding its footprint in emerging markets significantly impacts its market position and growth potential.
Arla Foods and Associated British Foods plc emphasize their product quality and the integration of sustainable practices, appealing to health-conscious consumers and those valuing environmental stewardship.
Wilmar International Ltd. and Fuji Oil Holdings Inc. focus on the Asian markets, bringing regional preferences into their product development, which enhances their competitiveness in these areas.
Smaller players like Royal Smilde Foods and Vandemoortele are crucial for their specialized offerings and regional market penetration, especially in Europe, where traditional tastes favor block margarine varieties.
The competitive landscape in the Block Margarine Market is defined by a mix of global giants and regional specialists, each contributing to the industry’s dynamics through strategic innovation, market expansion, and responsiveness to consumer preferences.
Market Key Players
- Unilever
- Bunge Limited
- Arla Foods
- Wilmar International Ltd.
- Conagra Brands, Inc.
- Royal Smilde Foods
- Upfield
- Fuji Oil Holdings Inc.
- Associated British Foods plc
- NMGK Group
- EPM Group
- Ventura Foods, LLC
- Puratos Group
- Vandemoortele
- Mewah International Inc.
Recent Developments
- On April 2024, UK-based spread company Flora announced the removal of dairy from its entire range of spreads, making them all vegan-friendly. This change aligns with Flora's commitment to a plant-based future and follows the parent company Upfield's goal to make all its brands vegan by 2025.
- Inflation has significantly impacted the prices of butter and margarine, with prices soaring by 31% and 44% respectively in December compared to the previous year. Factors contributing to this surge include supply disruptions due to the Russian invasion of Ukraine affecting margarine production and a decrease in milk supply for butter production.
- On October 2023, CSM Ingredients inaugurated a new margarine production line at its facility in Crema, Italy, coinciding with the plant's 100th anniversary celebration. This new production line enhances the facility's capacity to over 70,000 tons per year and underscores CSM's commitment to sustainable and innovative food production.
Report Scope
Report Features Description Market Value (2023) USD 1.6 Billion Forecast Revenue (2033) USD 2.6 Billion CAGR (2024-2033) 5.3% Base Year for Estimation 2023 Historic Period 2018-2023 Forecast Period 2024-2033 Report Coverage Revenue Forecast, Market Dynamics, Competitive Landscape, Recent Developments Segments Covered By Type (Soft, Hard), By Nature (Organic, Conventional), By Distributional Channel (Online, Offline), By Application (Bakery, Confectionaries, Spreads, Households, Other applications) Regional Analysis North America - The US, Canada, & Mexico; Western Europe - Germany, France, The UK, Spain, Italy, Portugal, Ireland, Austria, Switzerland, Benelux, Nordic, & Rest of Western Europe; Eastern Europe - Russia, Poland, The Czech Republic, Greece, & Rest of Eastern Europe; APAC - China, Japan, South Korea, India, Australia & New Zealand, Indonesia, Malaysia, Philippines, Singapore, Thailand, Vietnam, & Rest of APAC; Latin America - Brazil, Colombia, Chile, Argentina, Costa Rica, & Rest of Latin America; Middle East & Africa - Algeria, Egypt, Israel, Kuwait, Nigeria, Saudi Arabia, South Africa, Turkey, United Arab Emirates, & Rest of MEA Competitive Landscape Unilever, Bunge Limited, Arla Foods, Wilmar International Ltd., Conagra Brands, Inc., Royal Smilde Foods, Upfield, Fuji Oil Holdings Inc., Associated British Foods plc, NMGK Group, EPM Group, Ventura Foods, LLC, Puratos Group, Vandemoortele, Mewah International Inc. Customization Scope Customization for segments, region/country-level will be provided. Moreover, additional customization can be done based on the requirements. Purchase Options We have three licenses to opt for: Single User License, Multi-User License (Up to 5 Users), Corporate Use License (Unlimited User and Printable PDF) -
- 1. Executive Summary
- 1.1. Definition
- 1.2. Taxonomy
- 1.3. Research Scope
- 1.4. Key Analysis
- 1.5. Key Findings by Major Segments
- 1.6. Top strategies by Major Players
- 2. Global Block Margarine Market Overview
- 2.1. Block Margarine Market Dynamics
- 2.1.1. Drivers
- 2.1.2. Opportunities
- 2.1.3. Restraints
- 2.1.4. Challenges
- 2.2. Macro-economic Factors
- 2.3. Regulatory Framework
- 2.4. Market Investment Feasibility Index
- 2.5. PEST Analysis
- 2.6. PORTER’S Five Force Analysis
- 2.7. Drivers & Restraints Impact Analysis
- 2.8. Industry Chain Analysis
- 2.9. Cost Structure Analysis
- 2.10. Marketing Strategy
- 2.11. Russia-Ukraine War Impact Analysis
- 2.12. Opportunity Map Analysis
- 2.13. Market Competition Scenario Analysis
- 2.14. Product Life Cycle Analysis
- 2.15. Opportunity Orbits
- 2.16. Manufacturer Intensity Map
- 2.17. Major Companies sales by Value & Volume
- 2.1. Block Margarine Market Dynamics
- 3. Global Block Margarine Market Analysis, Opportunity and Forecast, 2016-2032
- 3.1. Global Block Margarine Market Analysis, 2016-2021
- 3.2. Global Block Margarine Market Opportunity and Forecast, 2023-2032
- 3.3. Global Block Margarine Market Analysis, Opportunity and Forecast, By By Type, 2016-2032
- 3.3.1. Global Block Margarine Market Analysis by By Type: Introduction
- 3.3.2. Market Size Absolute $ Opportunity Analysis and Forecast, By By Type, 2016-2032
- 3.3.3. Soft
- 3.3.4. Hard
- 3.4. Global Block Margarine Market Analysis, Opportunity and Forecast, By By Nature, 2016-2032
- 3.4.1. Global Block Margarine Market Analysis by By Nature: Introduction
- 3.4.2. Market Size Absolute $ Opportunity Analysis and Forecast, By By Nature, 2016-2032
- 3.4.3. Organic
- 3.4.4. Conventional
- 3.5. Global Block Margarine Market Analysis, Opportunity and Forecast, By By Distributional Channel, 2016-2032
- 3.5.1. Global Block Margarine Market Analysis by By Distributional Channel: Introduction
- 3.5.2. Market Size Absolute $ Opportunity Analysis and Forecast, By By Distributional Channel, 2016-2032
- 3.5.3. Online
- 3.5.4. Offline
- 3.6. Global Block Margarine Market Analysis, Opportunity and Forecast, By By Application, 2016-2032
- 3.6.1. Global Block Margarine Market Analysis by By Application: Introduction
- 3.6.2. Market Size Absolute $ Opportunity Analysis and Forecast, By By Application, 2016-2032
- 3.6.3. Bakery
- 3.6.4. Confectionaries
- 3.6.5. Spreads
- 3.6.6. Households
- 3.6.7. Other applications
- 4. North America Block Margarine Market Analysis, Opportunity and Forecast, 2016-2032
- 4.1. North America Block Margarine Market Analysis, 2016-2021
- 4.2. North America Block Margarine Market Opportunity and Forecast, 2023-2032
- 4.3. North America Block Margarine Market Analysis, Opportunity and Forecast, By By Type, 2016-2032
- 4.3.1. North America Block Margarine Market Analysis by By Type: Introduction
- 4.3.2. Market Size Absolute $ Opportunity Analysis and Forecast, By By Type, 2016-2032
- 4.3.3. Soft
- 4.3.4. Hard
- 4.4. North America Block Margarine Market Analysis, Opportunity and Forecast, By By Nature, 2016-2032
- 4.4.1. North America Block Margarine Market Analysis by By Nature: Introduction
- 4.4.2. Market Size Absolute $ Opportunity Analysis and Forecast, By By Nature, 2016-2032
- 4.4.3. Organic
- 4.4.4. Conventional
- 4.5. North America Block Margarine Market Analysis, Opportunity and Forecast, By By Distributional Channel, 2016-2032
- 4.5.1. North America Block Margarine Market Analysis by By Distributional Channel: Introduction
- 4.5.2. Market Size Absolute $ Opportunity Analysis and Forecast, By By Distributional Channel, 2016-2032
- 4.5.3. Online
- 4.5.4. Offline
- 4.6. North America Block Margarine Market Analysis, Opportunity and Forecast, By By Application, 2016-2032
- 4.6.1. North America Block Margarine Market Analysis by By Application: Introduction
- 4.6.2. Market Size Absolute $ Opportunity Analysis and Forecast, By By Application, 2016-2032
- 4.6.3. Bakery
- 4.6.4. Confectionaries
- 4.6.5. Spreads
- 4.6.6. Households
- 4.6.7. Other applications
- 4.7. North America Block Margarine Market Analysis, Opportunity and Forecast, By Country , 2016-2032
- 4.7.1. North America Block Margarine Market Analysis by Country : Introduction
- 4.7.2. Market Size Absolute $ Opportunity Analysis and Forecast, Country , 2016-2032
- 4.7.2.1. The US
- 4.7.2.2. Canada
- 4.7.2.3. Mexico
- 5. Western Europe Block Margarine Market Analysis, Opportunity and Forecast, 2016-2032
- 5.1. Western Europe Block Margarine Market Analysis, 2016-2021
- 5.2. Western Europe Block Margarine Market Opportunity and Forecast, 2023-2032
- 5.3. Western Europe Block Margarine Market Analysis, Opportunity and Forecast, By By Type, 2016-2032
- 5.3.1. Western Europe Block Margarine Market Analysis by By Type: Introduction
- 5.3.2. Market Size Absolute $ Opportunity Analysis and Forecast, By By Type, 2016-2032
- 5.3.3. Soft
- 5.3.4. Hard
- 5.4. Western Europe Block Margarine Market Analysis, Opportunity and Forecast, By By Nature, 2016-2032
- 5.4.1. Western Europe Block Margarine Market Analysis by By Nature: Introduction
- 5.4.2. Market Size Absolute $ Opportunity Analysis and Forecast, By By Nature, 2016-2032
- 5.4.3. Organic
- 5.4.4. Conventional
- 5.5. Western Europe Block Margarine Market Analysis, Opportunity and Forecast, By By Distributional Channel, 2016-2032
- 5.5.1. Western Europe Block Margarine Market Analysis by By Distributional Channel: Introduction
- 5.5.2. Market Size Absolute $ Opportunity Analysis and Forecast, By By Distributional Channel, 2016-2032
- 5.5.3. Online
- 5.5.4. Offline
- 5.6. Western Europe Block Margarine Market Analysis, Opportunity and Forecast, By By Application, 2016-2032
- 5.6.1. Western Europe Block Margarine Market Analysis by By Application: Introduction
- 5.6.2. Market Size Absolute $ Opportunity Analysis and Forecast, By By Application, 2016-2032
- 5.6.3. Bakery
- 5.6.4. Confectionaries
- 5.6.5. Spreads
- 5.6.6. Households
- 5.6.7. Other applications
- 5.7. Western Europe Block Margarine Market Analysis, Opportunity and Forecast, By Country , 2016-2032
- 5.7.1. Western Europe Block Margarine Market Analysis by Country : Introduction
- 5.7.2. Market Size Absolute $ Opportunity Analysis and Forecast, Country , 2016-2032
- 5.7.2.1. Germany
- 5.7.2.2. France
- 5.7.2.3. The UK
- 5.7.2.4. Spain
- 5.7.2.5. Italy
- 5.7.2.6. Portugal
- 5.7.2.7. Ireland
- 5.7.2.8. Austria
- 5.7.2.9. Switzerland
- 5.7.2.10. Benelux
- 5.7.2.11. Nordic
- 5.7.2.12. Rest of Western Europe
- 6. Eastern Europe Block Margarine Market Analysis, Opportunity and Forecast, 2016-2032
- 6.1. Eastern Europe Block Margarine Market Analysis, 2016-2021
- 6.2. Eastern Europe Block Margarine Market Opportunity and Forecast, 2023-2032
- 6.3. Eastern Europe Block Margarine Market Analysis, Opportunity and Forecast, By By Type, 2016-2032
- 6.3.1. Eastern Europe Block Margarine Market Analysis by By Type: Introduction
- 6.3.2. Market Size Absolute $ Opportunity Analysis and Forecast, By By Type, 2016-2032
- 6.3.3. Soft
- 6.3.4. Hard
- 6.4. Eastern Europe Block Margarine Market Analysis, Opportunity and Forecast, By By Nature, 2016-2032
- 6.4.1. Eastern Europe Block Margarine Market Analysis by By Nature: Introduction
- 6.4.2. Market Size Absolute $ Opportunity Analysis and Forecast, By By Nature, 2016-2032
- 6.4.3. Organic
- 6.4.4. Conventional
- 6.5. Eastern Europe Block Margarine Market Analysis, Opportunity and Forecast, By By Distributional Channel, 2016-2032
- 6.5.1. Eastern Europe Block Margarine Market Analysis by By Distributional Channel: Introduction
- 6.5.2. Market Size Absolute $ Opportunity Analysis and Forecast, By By Distributional Channel, 2016-2032
- 6.5.3. Online
- 6.5.4. Offline
- 6.6. Eastern Europe Block Margarine Market Analysis, Opportunity and Forecast, By By Application, 2016-2032
- 6.6.1. Eastern Europe Block Margarine Market Analysis by By Application: Introduction
- 6.6.2. Market Size Absolute $ Opportunity Analysis and Forecast, By By Application, 2016-2032
- 6.6.3. Bakery
- 6.6.4. Confectionaries
- 6.6.5. Spreads
- 6.6.6. Households
- 6.6.7. Other applications
- 6.7. Eastern Europe Block Margarine Market Analysis, Opportunity and Forecast, By Country , 2016-2032
- 6.7.1. Eastern Europe Block Margarine Market Analysis by Country : Introduction
- 6.7.2. Market Size Absolute $ Opportunity Analysis and Forecast, Country , 2016-2032
- 6.7.2.1. Russia
- 6.7.2.2. Poland
- 6.7.2.3. The Czech Republic
- 6.7.2.4. Greece
- 6.7.2.5. Rest of Eastern Europe
- 7. APAC Block Margarine Market Analysis, Opportunity and Forecast, 2016-2032
- 7.1. APAC Block Margarine Market Analysis, 2016-2021
- 7.2. APAC Block Margarine Market Opportunity and Forecast, 2023-2032
- 7.3. APAC Block Margarine Market Analysis, Opportunity and Forecast, By By Type, 2016-2032
- 7.3.1. APAC Block Margarine Market Analysis by By Type: Introduction
- 7.3.2. Market Size Absolute $ Opportunity Analysis and Forecast, By By Type, 2016-2032
- 7.3.3. Soft
- 7.3.4. Hard
- 7.4. APAC Block Margarine Market Analysis, Opportunity and Forecast, By By Nature, 2016-2032
- 7.4.1. APAC Block Margarine Market Analysis by By Nature: Introduction
- 7.4.2. Market Size Absolute $ Opportunity Analysis and Forecast, By By Nature, 2016-2032
- 7.4.3. Organic
- 7.4.4. Conventional
- 7.5. APAC Block Margarine Market Analysis, Opportunity and Forecast, By By Distributional Channel, 2016-2032
- 7.5.1. APAC Block Margarine Market Analysis by By Distributional Channel: Introduction
- 7.5.2. Market Size Absolute $ Opportunity Analysis and Forecast, By By Distributional Channel, 2016-2032
- 7.5.3. Online
- 7.5.4. Offline
- 7.6. APAC Block Margarine Market Analysis, Opportunity and Forecast, By By Application, 2016-2032
- 7.6.1. APAC Block Margarine Market Analysis by By Application: Introduction
- 7.6.2. Market Size Absolute $ Opportunity Analysis and Forecast, By By Application, 2016-2032
- 7.6.3. Bakery
- 7.6.4. Confectionaries
- 7.6.5. Spreads
- 7.6.6. Households
- 7.6.7. Other applications
- 7.7. APAC Block Margarine Market Analysis, Opportunity and Forecast, By Country , 2016-2032
- 7.7.1. APAC Block Margarine Market Analysis by Country : Introduction
- 7.7.2. Market Size Absolute $ Opportunity Analysis and Forecast, Country , 2016-2032
- 7.7.2.1. China
- 7.7.2.2. Japan
- 7.7.2.3. South Korea
- 7.7.2.4. India
- 7.7.2.5. Australia & New Zeland
- 7.7.2.6. Indonesia
- 7.7.2.7. Malaysia
- 7.7.2.8. Philippines
- 7.7.2.9. Singapore
- 7.7.2.10. Thailand
- 7.7.2.11. Vietnam
- 7.7.2.12. Rest of APAC
- 8. Latin America Block Margarine Market Analysis, Opportunity and Forecast, 2016-2032
- 8.1. Latin America Block Margarine Market Analysis, 2016-2021
- 8.2. Latin America Block Margarine Market Opportunity and Forecast, 2023-2032
- 8.3. Latin America Block Margarine Market Analysis, Opportunity and Forecast, By By Type, 2016-2032
- 8.3.1. Latin America Block Margarine Market Analysis by By Type: Introduction
- 8.3.2. Market Size Absolute $ Opportunity Analysis and Forecast, By By Type, 2016-2032
- 8.3.3. Soft
- 8.3.4. Hard
- 8.4. Latin America Block Margarine Market Analysis, Opportunity and Forecast, By By Nature, 2016-2032
- 8.4.1. Latin America Block Margarine Market Analysis by By Nature: Introduction
- 8.4.2. Market Size Absolute $ Opportunity Analysis and Forecast, By By Nature, 2016-2032
- 8.4.3. Organic
- 8.4.4. Conventional
- 8.5. Latin America Block Margarine Market Analysis, Opportunity and Forecast, By By Distributional Channel, 2016-2032
- 8.5.1. Latin America Block Margarine Market Analysis by By Distributional Channel: Introduction
- 8.5.2. Market Size Absolute $ Opportunity Analysis and Forecast, By By Distributional Channel, 2016-2032
- 8.5.3. Online
- 8.5.4. Offline
- 8.6. Latin America Block Margarine Market Analysis, Opportunity and Forecast, By By Application, 2016-2032
- 8.6.1. Latin America Block Margarine Market Analysis by By Application: Introduction
- 8.6.2. Market Size Absolute $ Opportunity Analysis and Forecast, By By Application, 2016-2032
- 8.6.3. Bakery
- 8.6.4. Confectionaries
- 8.6.5. Spreads
- 8.6.6. Households
- 8.6.7. Other applications
- 8.7. Latin America Block Margarine Market Analysis, Opportunity and Forecast, By Country , 2016-2032
- 8.7.1. Latin America Block Margarine Market Analysis by Country : Introduction
- 8.7.2. Market Size Absolute $ Opportunity Analysis and Forecast, Country , 2016-2032
- 8.7.2.1. Brazil
- 8.7.2.2. Colombia
- 8.7.2.3. Chile
- 8.7.2.4. Argentina
- 8.7.2.5. Costa Rica
- 8.7.2.6. Rest of Latin America
- 9. Middle East & Africa Block Margarine Market Analysis, Opportunity and Forecast, 2016-2032
- 9.1. Middle East & Africa Block Margarine Market Analysis, 2016-2021
- 9.2. Middle East & Africa Block Margarine Market Opportunity and Forecast, 2023-2032
- 9.3. Middle East & Africa Block Margarine Market Analysis, Opportunity and Forecast, By By Type, 2016-2032
- 9.3.1. Middle East & Africa Block Margarine Market Analysis by By Type: Introduction
- 9.3.2. Market Size Absolute $ Opportunity Analysis and Forecast, By By Type, 2016-2032
- 9.3.3. Soft
- 9.3.4. Hard
- 9.4. Middle East & Africa Block Margarine Market Analysis, Opportunity and Forecast, By By Nature, 2016-2032
- 9.4.1. Middle East & Africa Block Margarine Market Analysis by By Nature: Introduction
- 9.4.2. Market Size Absolute $ Opportunity Analysis and Forecast, By By Nature, 2016-2032
- 9.4.3. Organic
- 9.4.4. Conventional
- 9.5. Middle East & Africa Block Margarine Market Analysis, Opportunity and Forecast, By By Distributional Channel, 2016-2032
- 9.5.1. Middle East & Africa Block Margarine Market Analysis by By Distributional Channel: Introduction
- 9.5.2. Market Size Absolute $ Opportunity Analysis and Forecast, By By Distributional Channel, 2016-2032
- 9.5.3. Online
- 9.5.4. Offline
- 9.6. Middle East & Africa Block Margarine Market Analysis, Opportunity and Forecast, By By Application, 2016-2032
- 9.6.1. Middle East & Africa Block Margarine Market Analysis by By Application: Introduction
- 9.6.2. Market Size Absolute $ Opportunity Analysis and Forecast, By By Application, 2016-2032
- 9.6.3. Bakery
- 9.6.4. Confectionaries
- 9.6.5. Spreads
- 9.6.6. Households
- 9.6.7. Other applications
- 9.7. Middle East & Africa Block Margarine Market Analysis, Opportunity and Forecast, By Country , 2016-2032
- 9.7.1. Middle East & Africa Block Margarine Market Analysis by Country : Introduction
- 9.7.2. Market Size Absolute $ Opportunity Analysis and Forecast, Country , 2016-2032
- 9.7.2.1. Algeria
- 9.7.2.2. Egypt
- 9.7.2.3. Israel
- 9.7.2.4. Kuwait
- 9.7.2.5. Nigeria
- 9.7.2.6. Saudi Arabia
- 9.7.2.7. South Africa
- 9.7.2.8. Turkey
- 9.7.2.9. The UAE
- 9.7.2.10. Rest of MEA
- 10. Global Block Margarine Market Analysis, Opportunity and Forecast, By Region , 2016-2032
- 10.1. Global Block Margarine Market Analysis by Region : Introduction
- 10.2. Market Size Absolute $ Opportunity Analysis and Forecast, By Region , 2016-2032
- 10.2.1. North America
- 10.2.2. Western Europe
- 10.2.3. Eastern Europe
- 10.2.4. APAC
- 10.2.5. Latin America
- 10.2.6. Middle East & Africa
- 11. Global Block Margarine Market Competitive Landscape, Market Share Analysis, and Company Profiles
- 11.1. Market Share Analysis
- 11.2. Company Profiles
- 11.3. Unilever
- 11.3.1. Company Overview
- 11.3.2. Financial Highlights
- 11.3.3. Product Portfolio
- 11.3.4. SWOT Analysis
- 11.3.5. Key Strategies and Developments
- 11.4. Bunge Limited
- 11.4.1. Company Overview
- 11.4.2. Financial Highlights
- 11.4.3. Product Portfolio
- 11.4.4. SWOT Analysis
- 11.4.5. Key Strategies and Developments
- 11.5. Arla Foods
- 11.5.1. Company Overview
- 11.5.2. Financial Highlights
- 11.5.3. Product Portfolio
- 11.5.4. SWOT Analysis
- 11.5.5. Key Strategies and Developments
- 11.6. Wilmar International Ltd.
- 11.6.1. Company Overview
- 11.6.2. Financial Highlights
- 11.6.3. Product Portfolio
- 11.6.4. SWOT Analysis
- 11.6.5. Key Strategies and Developments
- 11.7. Conagra Brands, Inc.
- 11.7.1. Company Overview
- 11.7.2. Financial Highlights
- 11.7.3. Product Portfolio
- 11.7.4. SWOT Analysis
- 11.7.5. Key Strategies and Developments
- 11.8. Royal Smilde Foods
- 11.8.1. Company Overview
- 11.8.2. Financial Highlights
- 11.8.3. Product Portfolio
- 11.8.4. SWOT Analysis
- 11.8.5. Key Strategies and Developments
- 11.9. Upfield
- 11.9.1. Company Overview
- 11.9.2. Financial Highlights
- 11.9.3. Product Portfolio
- 11.9.4. SWOT Analysis
- 11.9.5. Key Strategies and Developments
- 11.10. Fuji Oil Holdings Inc.
- 11.10.1. Company Overview
- 11.10.2. Financial Highlights
- 11.10.3. Product Portfolio
- 11.10.4. SWOT Analysis
- 11.10.5. Key Strategies and Developments
- 11.11. Associated British Foods plc
- 11.11.1. Company Overview
- 11.11.2. Financial Highlights
- 11.11.3. Product Portfolio
- 11.11.4. SWOT Analysis
- 11.11.5. Key Strategies and Developments
- 11.12. NMGK Group
- 11.12.1. Company Overview
- 11.12.2. Financial Highlights
- 11.12.3. Product Portfolio
- 11.12.4. SWOT Analysis
- 11.12.5. Key Strategies and Developments
- 11.13.1. Company Overview
- 11.13.2. Financial Highlights
- 11.13.3. Product Portfolio
- 11.13.4. SWOT Analysis
- 11.13.5. Key Strategies and Developments
- 11.14. EPM Group
- 11.14.1. Company Overview
- 11.14.2. Financial Highlights
- 11.14.3. Product Portfolio
- 11.14.4. SWOT Analysis
- 11.14.5. Key Strategies and Developments
- 11.15. Puratos Group
- 11.15.1. Company Overview
- 11.15.2. Financial Highlights
- 11.15.3. Product Portfolio
- 11.15.4. SWOT Analysis
- 11.15.5. Key Strategies and Developments
- 11.16. Vandemoortele
- 11.16.1. Company Overview
- 11.16.2. Financial Highlights
- 11.16.3. Product Portfolio
- 11.16.4. SWOT Analysis
- 11.16.5. Key Strategies and Developments
- 11.17. Mewah International Inc.
- 11.17.1. Company Overview
- 11.17.2. Financial Highlights
- 11.17.3. Product Portfolio
- 11.17.4. SWOT Analysis
- 11.17.5. Key Strategies and Developments
- 12. Assumptions and Acronyms
- 13. Research Methodology
- 14. Contact
- List of Figures
- Figure 1: Global Block Margarine Market Revenue (US$ Mn) Market Share by By Type in 2022
- Figure 2: Global Block Margarine Market Attractiveness Analysis by By Type, 2016-2032
- Figure 3: Global Block Margarine Market Revenue (US$ Mn) Market Share by By Naturein 2022
- Figure 4: Global Block Margarine Market Attractiveness Analysis by By Nature, 2016-2032
- Figure 5: Global Block Margarine Market Revenue (US$ Mn) Market Share by By Distributional Channelin 2022
- Figure 6: Global Block Margarine Market Attractiveness Analysis by By Distributional Channel, 2016-2032
- Figure 7: Global Block Margarine Market Revenue (US$ Mn) Market Share by By Applicationin 2022
- Figure 8: Global Block Margarine Market Attractiveness Analysis by By Application, 2016-2032
- Figure 9: Global Block Margarine Market Revenue (US$ Mn) Market Share by Region in 2022
- Figure 10: Global Block Margarine Market Attractiveness Analysis by Region, 2016-2032
- Figure 11: Global Block Margarine Market Revenue (US$ Mn) (2016-2032)
- Figure 12: Global Block Margarine Market Revenue (US$ Mn) Comparison by Region (2016-2032)
- Figure 13: Global Block Margarine Market Revenue (US$ Mn) Comparison by By Type (2016-2032)
- Figure 14: Global Block Margarine Market Revenue (US$ Mn) Comparison by By Nature (2016-2032)
- Figure 15: Global Block Margarine Market Revenue (US$ Mn) Comparison by By Distributional Channel (2016-2032)
- Figure 16: Global Block Margarine Market Revenue (US$ Mn) Comparison by By Application (2016-2032)
- Figure 17: Global Block Margarine Market Y-o-Y Growth Rate Comparison by Region (2016-2032)
- Figure 18: Global Block Margarine Market Y-o-Y Growth Rate Comparison by By Type (2016-2032)
- Figure 19: Global Block Margarine Market Y-o-Y Growth Rate Comparison by By Nature (2016-2032)
- Figure 20: Global Block Margarine Market Y-o-Y Growth Rate Comparison by By Distributional Channel (2016-2032)
- Figure 21: Global Block Margarine Market Y-o-Y Growth Rate Comparison by By Application (2016-2032)
- Figure 22: Global Block Margarine Market Share Comparison by Region (2016-2032)
- Figure 23: Global Block Margarine Market Share Comparison by By Type (2016-2032)
- Figure 24: Global Block Margarine Market Share Comparison by By Nature (2016-2032)
- Figure 25: Global Block Margarine Market Share Comparison by By Distributional Channel (2016-2032)
- Figure 26: Global Block Margarine Market Share Comparison by By Application (2016-2032)
- Figure 27: North America Block Margarine Market Revenue (US$ Mn) Market Share by By Typein 2022
- Figure 28: North America Block Margarine Market Attractiveness Analysis by By Type, 2016-2032
- Figure 29: North America Block Margarine Market Revenue (US$ Mn) Market Share by By Naturein 2022
- Figure 30: North America Block Margarine Market Attractiveness Analysis by By Nature, 2016-2032
- Figure 31: North America Block Margarine Market Revenue (US$ Mn) Market Share by By Distributional Channelin 2022
- Figure 32: North America Block Margarine Market Attractiveness Analysis by By Distributional Channel, 2016-2032
- Figure 33: North America Block Margarine Market Revenue (US$ Mn) Market Share by By Applicationin 2022
- Figure 34: North America Block Margarine Market Attractiveness Analysis by By Application, 2016-2032
- Figure 35: North America Block Margarine Market Revenue (US$ Mn) Market Share by Country in 2022
- Figure 36: North America Block Margarine Market Attractiveness Analysis by Country, 2016-2032
- Figure 37: North America Block Margarine Market Revenue (US$ Mn) (2016-2032)
- Figure 38: North America Block Margarine Market Revenue (US$ Mn) Comparison by Country (2016-2032)
- Figure 39: North America Block Margarine Market Revenue (US$ Mn) Comparison by By Type (2016-2032)
- Figure 40: North America Block Margarine Market Revenue (US$ Mn) Comparison by By Nature (2016-2032)
- Figure 41: North America Block Margarine Market Revenue (US$ Mn) Comparison by By Distributional Channel (2016-2032)
- Figure 42: North America Block Margarine Market Revenue (US$ Mn) Comparison by By Application (2016-2032)
- Figure 43: North America Block Margarine Market Y-o-Y Growth Rate Comparison by Country (2016-2032)
- Figure 44: North America Block Margarine Market Y-o-Y Growth Rate Comparison by By Type (2016-2032)
- Figure 45: North America Block Margarine Market Y-o-Y Growth Rate Comparison by By Nature (2016-2032)
- Figure 46: North America Block Margarine Market Y-o-Y Growth Rate Comparison by By Distributional Channel (2016-2032)
- Figure 47: North America Block Margarine Market Y-o-Y Growth Rate Comparison by By Application (2016-2032)
- Figure 48: North America Block Margarine Market Share Comparison by Country (2016-2032)
- Figure 49: North America Block Margarine Market Share Comparison by By Type (2016-2032)
- Figure 50: North America Block Margarine Market Share Comparison by By Nature (2016-2032)
- Figure 51: North America Block Margarine Market Share Comparison by By Distributional Channel (2016-2032)
- Figure 52: North America Block Margarine Market Share Comparison by By Application (2016-2032)
- Figure 53: Western Europe Block Margarine Market Revenue (US$ Mn) Market Share by By Typein 2022
- Figure 54: Western Europe Block Margarine Market Attractiveness Analysis by By Type, 2016-2032
- Figure 55: Western Europe Block Margarine Market Revenue (US$ Mn) Market Share by By Naturein 2022
- Figure 56: Western Europe Block Margarine Market Attractiveness Analysis by By Nature, 2016-2032
- Figure 57: Western Europe Block Margarine Market Revenue (US$ Mn) Market Share by By Distributional Channelin 2022
- Figure 58: Western Europe Block Margarine Market Attractiveness Analysis by By Distributional Channel, 2016-2032
- Figure 59: Western Europe Block Margarine Market Revenue (US$ Mn) Market Share by By Applicationin 2022
- Figure 60: Western Europe Block Margarine Market Attractiveness Analysis by By Application, 2016-2032
- Figure 61: Western Europe Block Margarine Market Revenue (US$ Mn) Market Share by Country in 2022
- Figure 62: Western Europe Block Margarine Market Attractiveness Analysis by Country, 2016-2032
- Figure 63: Western Europe Block Margarine Market Revenue (US$ Mn) (2016-2032)
- Figure 64: Western Europe Block Margarine Market Revenue (US$ Mn) Comparison by Country (2016-2032)
- Figure 65: Western Europe Block Margarine Market Revenue (US$ Mn) Comparison by By Type (2016-2032)
- Figure 66: Western Europe Block Margarine Market Revenue (US$ Mn) Comparison by By Nature (2016-2032)
- Figure 67: Western Europe Block Margarine Market Revenue (US$ Mn) Comparison by By Distributional Channel (2016-2032)
- Figure 68: Western Europe Block Margarine Market Revenue (US$ Mn) Comparison by By Application (2016-2032)
- Figure 69: Western Europe Block Margarine Market Y-o-Y Growth Rate Comparison by Country (2016-2032)
- Figure 70: Western Europe Block Margarine Market Y-o-Y Growth Rate Comparison by By Type (2016-2032)
- Figure 71: Western Europe Block Margarine Market Y-o-Y Growth Rate Comparison by By Nature (2016-2032)
- Figure 72: Western Europe Block Margarine Market Y-o-Y Growth Rate Comparison by By Distributional Channel (2016-2032)
- Figure 73: Western Europe Block Margarine Market Y-o-Y Growth Rate Comparison by By Application (2016-2032)
- Figure 74: Western Europe Block Margarine Market Share Comparison by Country (2016-2032)
- Figure 75: Western Europe Block Margarine Market Share Comparison by By Type (2016-2032)
- Figure 76: Western Europe Block Margarine Market Share Comparison by By Nature (2016-2032)
- Figure 77: Western Europe Block Margarine Market Share Comparison by By Distributional Channel (2016-2032)
- Figure 78: Western Europe Block Margarine Market Share Comparison by By Application (2016-2032)
- Figure 79: Eastern Europe Block Margarine Market Revenue (US$ Mn) Market Share by By Typein 2022
- Figure 80: Eastern Europe Block Margarine Market Attractiveness Analysis by By Type, 2016-2032
- Figure 81: Eastern Europe Block Margarine Market Revenue (US$ Mn) Market Share by By Naturein 2022
- Figure 82: Eastern Europe Block Margarine Market Attractiveness Analysis by By Nature, 2016-2032
- Figure 83: Eastern Europe Block Margarine Market Revenue (US$ Mn) Market Share by By Distributional Channelin 2022
- Figure 84: Eastern Europe Block Margarine Market Attractiveness Analysis by By Distributional Channel, 2016-2032
- Figure 85: Eastern Europe Block Margarine Market Revenue (US$ Mn) Market Share by By Applicationin 2022
- Figure 86: Eastern Europe Block Margarine Market Attractiveness Analysis by By Application, 2016-2032
- Figure 87: Eastern Europe Block Margarine Market Revenue (US$ Mn) Market Share by Country in 2022
- Figure 88: Eastern Europe Block Margarine Market Attractiveness Analysis by Country, 2016-2032
- Figure 89: Eastern Europe Block Margarine Market Revenue (US$ Mn) (2016-2032)
- Figure 90: Eastern Europe Block Margarine Market Revenue (US$ Mn) Comparison by Country (2016-2032)
- Figure 91: Eastern Europe Block Margarine Market Revenue (US$ Mn) Comparison by By Type (2016-2032)
- Figure 92: Eastern Europe Block Margarine Market Revenue (US$ Mn) Comparison by By Nature (2016-2032)
- Figure 93: Eastern Europe Block Margarine Market Revenue (US$ Mn) Comparison by By Distributional Channel (2016-2032)
- Figure 94: Eastern Europe Block Margarine Market Revenue (US$ Mn) Comparison by By Application (2016-2032)
- Figure 95: Eastern Europe Block Margarine Market Y-o-Y Growth Rate Comparison by Country (2016-2032)
- Figure 96: Eastern Europe Block Margarine Market Y-o-Y Growth Rate Comparison by By Type (2016-2032)
- Figure 97: Eastern Europe Block Margarine Market Y-o-Y Growth Rate Comparison by By Nature (2016-2032)
- Figure 98: Eastern Europe Block Margarine Market Y-o-Y Growth Rate Comparison by By Distributional Channel (2016-2032)
- Figure 99: Eastern Europe Block Margarine Market Y-o-Y Growth Rate Comparison by By Application (2016-2032)
- Figure 100: Eastern Europe Block Margarine Market Share Comparison by Country (2016-2032)
- Figure 101: Eastern Europe Block Margarine Market Share Comparison by By Type (2016-2032)
- Figure 102: Eastern Europe Block Margarine Market Share Comparison by By Nature (2016-2032)
- Figure 103: Eastern Europe Block Margarine Market Share Comparison by By Distributional Channel (2016-2032)
- Figure 104: Eastern Europe Block Margarine Market Share Comparison by By Application (2016-2032)
- Figure 105: APAC Block Margarine Market Revenue (US$ Mn) Market Share by By Typein 2022
- Figure 106: APAC Block Margarine Market Attractiveness Analysis by By Type, 2016-2032
- Figure 107: APAC Block Margarine Market Revenue (US$ Mn) Market Share by By Naturein 2022
- Figure 108: APAC Block Margarine Market Attractiveness Analysis by By Nature, 2016-2032
- Figure 109: APAC Block Margarine Market Revenue (US$ Mn) Market Share by By Distributional Channelin 2022
- Figure 110: APAC Block Margarine Market Attractiveness Analysis by By Distributional Channel, 2016-2032
- Figure 111: APAC Block Margarine Market Revenue (US$ Mn) Market Share by By Applicationin 2022
- Figure 112: APAC Block Margarine Market Attractiveness Analysis by By Application, 2016-2032
- Figure 113: APAC Block Margarine Market Revenue (US$ Mn) Market Share by Country in 2022
- Figure 114: APAC Block Margarine Market Attractiveness Analysis by Country, 2016-2032
- Figure 115: APAC Block Margarine Market Revenue (US$ Mn) (2016-2032)
- Figure 116: APAC Block Margarine Market Revenue (US$ Mn) Comparison by Country (2016-2032)
- Figure 117: APAC Block Margarine Market Revenue (US$ Mn) Comparison by By Type (2016-2032)
- Figure 118: APAC Block Margarine Market Revenue (US$ Mn) Comparison by By Nature (2016-2032)
- Figure 119: APAC Block Margarine Market Revenue (US$ Mn) Comparison by By Distributional Channel (2016-2032)
- Figure 120: APAC Block Margarine Market Revenue (US$ Mn) Comparison by By Application (2016-2032)
- Figure 121: APAC Block Margarine Market Y-o-Y Growth Rate Comparison by Country (2016-2032)
- Figure 122: APAC Block Margarine Market Y-o-Y Growth Rate Comparison by By Type (2016-2032)
- Figure 123: APAC Block Margarine Market Y-o-Y Growth Rate Comparison by By Nature (2016-2032)
- Figure 124: APAC Block Margarine Market Y-o-Y Growth Rate Comparison by By Distributional Channel (2016-2032)
- Figure 125: APAC Block Margarine Market Y-o-Y Growth Rate Comparison by By Application (2016-2032)
- Figure 126: APAC Block Margarine Market Share Comparison by Country (2016-2032)
- Figure 127: APAC Block Margarine Market Share Comparison by By Type (2016-2032)
- Figure 128: APAC Block Margarine Market Share Comparison by By Nature (2016-2032)
- Figure 129: APAC Block Margarine Market Share Comparison by By Distributional Channel (2016-2032)
- Figure 130: APAC Block Margarine Market Share Comparison by By Application (2016-2032)
- Figure 131: Latin America Block Margarine Market Revenue (US$ Mn) Market Share by By Typein 2022
- Figure 132: Latin America Block Margarine Market Attractiveness Analysis by By Type, 2016-2032
- Figure 133: Latin America Block Margarine Market Revenue (US$ Mn) Market Share by By Naturein 2022
- Figure 134: Latin America Block Margarine Market Attractiveness Analysis by By Nature, 2016-2032
- Figure 135: Latin America Block Margarine Market Revenue (US$ Mn) Market Share by By Distributional Channelin 2022
- Figure 136: Latin America Block Margarine Market Attractiveness Analysis by By Distributional Channel, 2016-2032
- Figure 137: Latin America Block Margarine Market Revenue (US$ Mn) Market Share by By Applicationin 2022
- Figure 138: Latin America Block Margarine Market Attractiveness Analysis by By Application, 2016-2032
- Figure 139: Latin America Block Margarine Market Revenue (US$ Mn) Market Share by Country in 2022
- Figure 140: Latin America Block Margarine Market Attractiveness Analysis by Country, 2016-2032
- Figure 141: Latin America Block Margarine Market Revenue (US$ Mn) (2016-2032)
- Figure 142: Latin America Block Margarine Market Revenue (US$ Mn) Comparison by Country (2016-2032)
- Figure 143: Latin America Block Margarine Market Revenue (US$ Mn) Comparison by By Type (2016-2032)
- Figure 144: Latin America Block Margarine Market Revenue (US$ Mn) Comparison by By Nature (2016-2032)
- Figure 145: Latin America Block Margarine Market Revenue (US$ Mn) Comparison by By Distributional Channel (2016-2032)
- Figure 146: Latin America Block Margarine Market Revenue (US$ Mn) Comparison by By Application (2016-2032)
- Figure 147: Latin America Block Margarine Market Y-o-Y Growth Rate Comparison by Country (2016-2032)
- Figure 148: Latin America Block Margarine Market Y-o-Y Growth Rate Comparison by By Type (2016-2032)
- Figure 149: Latin America Block Margarine Market Y-o-Y Growth Rate Comparison by By Nature (2016-2032)
- Figure 150: Latin America Block Margarine Market Y-o-Y Growth Rate Comparison by By Distributional Channel (2016-2032)
- Figure 151: Latin America Block Margarine Market Y-o-Y Growth Rate Comparison by By Application (2016-2032)
- Figure 152: Latin America Block Margarine Market Share Comparison by Country (2016-2032)
- Figure 153: Latin America Block Margarine Market Share Comparison by By Type (2016-2032)
- Figure 154: Latin America Block Margarine Market Share Comparison by By Nature (2016-2032)
- Figure 155: Latin America Block Margarine Market Share Comparison by By Distributional Channel (2016-2032)
- Figure 156: Latin America Block Margarine Market Share Comparison by By Application (2016-2032)
- Figure 157: Middle East & Africa Block Margarine Market Revenue (US$ Mn) Market Share by By Typein 2022
- Figure 158: Middle East & Africa Block Margarine Market Attractiveness Analysis by By Type, 2016-2032
- Figure 159: Middle East & Africa Block Margarine Market Revenue (US$ Mn) Market Share by By Naturein 2022
- Figure 160: Middle East & Africa Block Margarine Market Attractiveness Analysis by By Nature, 2016-2032
- Figure 161: Middle East & Africa Block Margarine Market Revenue (US$ Mn) Market Share by By Distributional Channelin 2022
- Figure 162: Middle East & Africa Block Margarine Market Attractiveness Analysis by By Distributional Channel, 2016-2032
- Figure 163: Middle East & Africa Block Margarine Market Revenue (US$ Mn) Market Share by By Applicationin 2022
- Figure 164: Middle East & Africa Block Margarine Market Attractiveness Analysis by By Application, 2016-2032
- Figure 165: Middle East & Africa Block Margarine Market Revenue (US$ Mn) Market Share by Country in 2022
- Figure 166: Middle East & Africa Block Margarine Market Attractiveness Analysis by Country, 2016-2032
- Figure 167: Middle East & Africa Block Margarine Market Revenue (US$ Mn) (2016-2032)
- Figure 168: Middle East & Africa Block Margarine Market Revenue (US$ Mn) Comparison by Country (2016-2032)
- Figure 169: Middle East & Africa Block Margarine Market Revenue (US$ Mn) Comparison by By Type (2016-2032)
- Figure 170: Middle East & Africa Block Margarine Market Revenue (US$ Mn) Comparison by By Nature (2016-2032)
- Figure 171: Middle East & Africa Block Margarine Market Revenue (US$ Mn) Comparison by By Distributional Channel (2016-2032)
- Figure 172: Middle East & Africa Block Margarine Market Revenue (US$ Mn) Comparison by By Application (2016-2032)
- Figure 173: Middle East & Africa Block Margarine Market Y-o-Y Growth Rate Comparison by Country (2016-2032)
- Figure 174: Middle East & Africa Block Margarine Market Y-o-Y Growth Rate Comparison by By Type (2016-2032)
- Figure 175: Middle East & Africa Block Margarine Market Y-o-Y Growth Rate Comparison by By Nature (2016-2032)
- Figure 176: Middle East & Africa Block Margarine Market Y-o-Y Growth Rate Comparison by By Distributional Channel (2016-2032)
- Figure 177: Middle East & Africa Block Margarine Market Y-o-Y Growth Rate Comparison by By Application (2016-2032)
- Figure 178: Middle East & Africa Block Margarine Market Share Comparison by Country (2016-2032)
- Figure 179: Middle East & Africa Block Margarine Market Share Comparison by By Type (2016-2032)
- Figure 180: Middle East & Africa Block Margarine Market Share Comparison by By Nature (2016-2032)
- Figure 181: Middle East & Africa Block Margarine Market Share Comparison by By Distributional Channel (2016-2032)
- Figure 182: Middle East & Africa Block Margarine Market Share Comparison by By Application (2016-2032)
- List of Tables
- Table 1: Global Block Margarine Market Comparison by By Type (2016-2032)
- Table 2: Global Block Margarine Market Comparison by By Nature (2016-2032)
- Table 3: Global Block Margarine Market Comparison by By Distributional Channel (2016-2032)
- Table 4: Global Block Margarine Market Comparison by By Application (2016-2032)
- Table 5: Global Block Margarine Market Revenue (US$ Mn) Comparison by Region (2016-2032)
- Table 6: Global Block Margarine Market Revenue (US$ Mn) (2016-2032)
- Table 7: Global Block Margarine Market Revenue (US$ Mn) Comparison by Region (2016-2032)
- Table 8: Global Block Margarine Market Revenue (US$ Mn) Comparison by By Type (2016-2032)
- Table 9: Global Block Margarine Market Revenue (US$ Mn) Comparison by By Nature (2016-2032)
- Table 10: Global Block Margarine Market Revenue (US$ Mn) Comparison by By Distributional Channel (2016-2032)
- Table 11: Global Block Margarine Market Revenue (US$ Mn) Comparison by By Application (2016-2032)
- Table 12: Global Block Margarine Market Y-o-Y Growth Rate Comparison by Region (2016-2032)
- Table 13: Global Block Margarine Market Y-o-Y Growth Rate Comparison by By Type (2016-2032)
- Table 14: Global Block Margarine Market Y-o-Y Growth Rate Comparison by By Nature (2016-2032)
- Table 15: Global Block Margarine Market Y-o-Y Growth Rate Comparison by By Distributional Channel (2016-2032)
- Table 16: Global Block Margarine Market Y-o-Y Growth Rate Comparison by By Application (2016-2032)
- Table 17: Global Block Margarine Market Share Comparison by Region (2016-2032)
- Table 18: Global Block Margarine Market Share Comparison by By Type (2016-2032)
- Table 19: Global Block Margarine Market Share Comparison by By Nature (2016-2032)
- Table 20: Global Block Margarine Market Share Comparison by By Distributional Channel (2016-2032)
- Table 21: Global Block Margarine Market Share Comparison by By Application (2016-2032)
- Table 22: North America Block Margarine Market Comparison by By Nature (2016-2032)
- Table 23: North America Block Margarine Market Comparison by By Distributional Channel (2016-2032)
- Table 24: North America Block Margarine Market Comparison by By Application (2016-2032)
- Table 25: North America Block Margarine Market Revenue (US$ Mn) Comparison by Country (2016-2032)
- Table 26: North America Block Margarine Market Revenue (US$ Mn) (2016-2032)
- Table 27: North America Block Margarine Market Revenue (US$ Mn) Comparison by Country (2016-2032)
- Table 28: North America Block Margarine Market Revenue (US$ Mn) Comparison by By Type (2016-2032)
- Table 29: North America Block Margarine Market Revenue (US$ Mn) Comparison by By Nature (2016-2032)
- Table 30: North America Block Margarine Market Revenue (US$ Mn) Comparison by By Distributional Channel (2016-2032)
- Table 31: North America Block Margarine Market Revenue (US$ Mn) Comparison by By Application (2016-2032)
- Table 32: North America Block Margarine Market Y-o-Y Growth Rate Comparison by Country (2016-2032)
- Table 33: North America Block Margarine Market Y-o-Y Growth Rate Comparison by By Type (2016-2032)
- Table 34: North America Block Margarine Market Y-o-Y Growth Rate Comparison by By Nature (2016-2032)
- Table 35: North America Block Margarine Market Y-o-Y Growth Rate Comparison by By Distributional Channel (2016-2032)
- Table 36: North America Block Margarine Market Y-o-Y Growth Rate Comparison by By Application (2016-2032)
- Table 37: North America Block Margarine Market Share Comparison by Country (2016-2032)
- Table 38: North America Block Margarine Market Share Comparison by By Type (2016-2032)
- Table 39: North America Block Margarine Market Share Comparison by By Nature (2016-2032)
- Table 40: North America Block Margarine Market Share Comparison by By Distributional Channel (2016-2032)
- Table 41: North America Block Margarine Market Share Comparison by By Application (2016-2032)
- Table 42: Western Europe Block Margarine Market Comparison by By Type (2016-2032)
- Table 43: Western Europe Block Margarine Market Comparison by By Nature (2016-2032)
- Table 44: Western Europe Block Margarine Market Comparison by By Distributional Channel (2016-2032)
- Table 45: Western Europe Block Margarine Market Comparison by By Application (2016-2032)
- Table 46: Western Europe Block Margarine Market Revenue (US$ Mn) Comparison by Country (2016-2032)
- Table 47: Western Europe Block Margarine Market Revenue (US$ Mn) (2016-2032)
- Table 48: Western Europe Block Margarine Market Revenue (US$ Mn) Comparison by Country (2016-2032)
- Table 49: Western Europe Block Margarine Market Revenue (US$ Mn) Comparison by By Type (2016-2032)
- Table 50: Western Europe Block Margarine Market Revenue (US$ Mn) Comparison by By Nature (2016-2032)
- Table 51: Western Europe Block Margarine Market Revenue (US$ Mn) Comparison by By Distributional Channel (2016-2032)
- Table 52: Western Europe Block Margarine Market Revenue (US$ Mn) Comparison by By Application (2016-2032)
- Table 53: Western Europe Block Margarine Market Y-o-Y Growth Rate Comparison by Country (2016-2032)
- Table 54: Western Europe Block Margarine Market Y-o-Y Growth Rate Comparison by By Type (2016-2032)
- Table 55: Western Europe Block Margarine Market Y-o-Y Growth Rate Comparison by By Nature (2016-2032)
- Table 56: Western Europe Block Margarine Market Y-o-Y Growth Rate Comparison by By Distributional Channel (2016-2032)
- Table 57: Western Europe Block Margarine Market Y-o-Y Growth Rate Comparison by By Application (2016-2032)
- Table 58: Western Europe Block Margarine Market Share Comparison by Country (2016-2032)
- Table 59: Western Europe Block Margarine Market Share Comparison by By Type (2016-2032)
- Table 60: Western Europe Block Margarine Market Share Comparison by By Nature (2016-2032)
- Table 61: Western Europe Block Margarine Market Share Comparison by By Distributional Channel (2016-2032)
- Table 62: Western Europe Block Margarine Market Share Comparison by By Application (2016-2032)
- Table 63: Eastern Europe Block Margarine Market Comparison by By Type (2016-2032)
- Table 64: Eastern Europe Block Margarine Market Comparison by By Nature (2016-2032)
- Table 65: Eastern Europe Block Margarine Market Comparison by By Distributional Channel (2016-2032)
- Table 66: Eastern Europe Block Margarine Market Comparison by By Application (2016-2032)
- Table 67: Eastern Europe Block Margarine Market Revenue (US$ Mn) Comparison by Country (2016-2032)
- Table 68: Eastern Europe Block Margarine Market Revenue (US$ Mn) (2016-2032)
- Table 69: Eastern Europe Block Margarine Market Revenue (US$ Mn) Comparison by Country (2016-2032)
- Table 70: Eastern Europe Block Margarine Market Revenue (US$ Mn) Comparison by By Type (2016-2032)
- Table 71: Eastern Europe Block Margarine Market Revenue (US$ Mn) Comparison by By Nature (2016-2032)
- Table 72: Eastern Europe Block Margarine Market Revenue (US$ Mn) Comparison by By Distributional Channel (2016-2032)
- Table 73: Eastern Europe Block Margarine Market Revenue (US$ Mn) Comparison by By Application (2016-2032)
- Table 74: Eastern Europe Block Margarine Market Y-o-Y Growth Rate Comparison by Country (2016-2032)
- Table 75: Eastern Europe Block Margarine Market Y-o-Y Growth Rate Comparison by By Type (2016-2032)
- Table 76: Eastern Europe Block Margarine Market Y-o-Y Growth Rate Comparison by By Nature (2016-2032)
- Table 77: Eastern Europe Block Margarine Market Y-o-Y Growth Rate Comparison by By Distributional Channel (2016-2032)
- Table 78: Eastern Europe Block Margarine Market Y-o-Y Growth Rate Comparison by By Application (2016-2032)
- Table 79: Eastern Europe Block Margarine Market Share Comparison by Country (2016-2032)
- Table 80: Eastern Europe Block Margarine Market Share Comparison by By Type (2016-2032)
- Table 81: Eastern Europe Block Margarine Market Share Comparison by By Nature (2016-2032)
- Table 82: Eastern Europe Block Margarine Market Share Comparison by By Distributional Channel (2016-2032)
- Table 83: Eastern Europe Block Margarine Market Share Comparison by By Application (2016-2032)
- Table 84: APAC Block Margarine Market Comparison by By Type (2016-2032)
- Table 85: APAC Block Margarine Market Comparison by By Nature (2016-2032)
- Table 86: APAC Block Margarine Market Comparison by By Distributional Channel (2016-2032)
- Table 87: APAC Block Margarine Market Comparison by By Application (2016-2032)
- Table 88: APAC Block Margarine Market Revenue (US$ Mn) Comparison by Country (2016-2032)
- Table 89: APAC Block Margarine Market Revenue (US$ Mn) (2016-2032)
- Table 90: APAC Block Margarine Market Revenue (US$ Mn) Comparison by Country (2016-2032)
- Table 91: APAC Block Margarine Market Revenue (US$ Mn) Comparison by By Type (2016-2032)
- Table 92: APAC Block Margarine Market Revenue (US$ Mn) Comparison by By Nature (2016-2032)
- Table 93: APAC Block Margarine Market Revenue (US$ Mn) Comparison by By Distributional Channel (2016-2032)
- Table 94: APAC Block Margarine Market Revenue (US$ Mn) Comparison by By Application (2016-2032)
- Table 95: APAC Block Margarine Market Y-o-Y Growth Rate Comparison by Country (2016-2032)
- Table 96: APAC Block Margarine Market Y-o-Y Growth Rate Comparison by By Type (2016-2032)
- Table 97: APAC Block Margarine Market Y-o-Y Growth Rate Comparison by By Nature (2016-2032)
- Table 98: APAC Block Margarine Market Y-o-Y Growth Rate Comparison by By Distributional Channel (2016-2032)
- Table 99: APAC Block Margarine Market Y-o-Y Growth Rate Comparison by By Application (2016-2032)
- Table 100: APAC Block Margarine Market Share Comparison by Country (2016-2032)
- Table 101: APAC Block Margarine Market Share Comparison by By Type (2016-2032)
- Table 102: APAC Block Margarine Market Share Comparison by By Nature (2016-2032)
- Table 103: APAC Block Margarine Market Share Comparison by By Distributional Channel (2016-2032)
- Table 104: APAC Block Margarine Market Share Comparison by By Application (2016-2032)
- Table 105: Latin America Block Margarine Market Comparison by By Type (2016-2032)
- Table 106: Latin America Block Margarine Market Comparison by By Nature (2016-2032)
- Table 107: Latin America Block Margarine Market Comparison by By Distributional Channel (2016-2032)
- Table 108: Latin America Block Margarine Market Comparison by By Application (2016-2032)
- Table 109: Latin America Block Margarine Market Revenue (US$ Mn) Comparison by Country (2016-2032)
- Table 110: Latin America Block Margarine Market Revenue (US$ Mn) (2016-2032)
- Table 111: Latin America Block Margarine Market Revenue (US$ Mn) Comparison by Country (2016-2032)
- Table 112: Latin America Block Margarine Market Revenue (US$ Mn) Comparison by By Type (2016-2032)
- Table 113: Latin America Block Margarine Market Revenue (US$ Mn) Comparison by By Nature (2016-2032)
- Table 114: Latin America Block Margarine Market Revenue (US$ Mn) Comparison by By Distributional Channel (2016-2032)
- Table 115: Latin America Block Margarine Market Revenue (US$ Mn) Comparison by By Application (2016-2032)
- Table 116: Latin America Block Margarine Market Y-o-Y Growth Rate Comparison by Country (2016-2032)
- Table 117: Latin America Block Margarine Market Y-o-Y Growth Rate Comparison by By Type (2016-2032)
- Table 118: Latin America Block Margarine Market Y-o-Y Growth Rate Comparison by By Nature (2016-2032)
- Table 119: Latin America Block Margarine Market Y-o-Y Growth Rate Comparison by By Distributional Channel (2016-2032)
- Table 120: Latin America Block Margarine Market Y-o-Y Growth Rate Comparison by By Application (2016-2032)
- Table 121: Latin America Block Margarine Market Share Comparison by Country (2016-2032)
- Table 122: Latin America Block Margarine Market Share Comparison by By Type (2016-2032)
- Table 123: Latin America Block Margarine Market Share Comparison by By Nature (2016-2032)
- Table 124: Latin America Block Margarine Market Share Comparison by By Distributional Channel (2016-2032)
- Table 125: Latin America Block Margarine Market Share Comparison by By Application (2016-2032)
- Table 126: Middle East & Africa Block Margarine Market Comparison by By Type (2016-2032)
- Table 127: Middle East & Africa Block Margarine Market Comparison by By Nature (2016-2032)
- Table 128: Middle East & Africa Block Margarine Market Comparison by By Distributional Channel (2016-2032)
- Table 129: Middle East & Africa Block Margarine Market Comparison by By Application (2016-2032)
- Table 130: Middle East & Africa Block Margarine Market Revenue (US$ Mn) Comparison by Country (2016-2032)
- Table 131: Middle East & Africa Block Margarine Market Revenue (US$ Mn) (2016-2032)
- Table 132: Middle East & Africa Block Margarine Market Revenue (US$ Mn) Comparison by Country (2016-2032)
- Table 133: Middle East & Africa Block Margarine Market Revenue (US$ Mn) Comparison by By Type (2016-2032)
- Table 134: Middle East & Africa Block Margarine Market Revenue (US$ Mn) Comparison by By Nature (2016-2032)
- Table 135: Middle East & Africa Block Margarine Market Revenue (US$ Mn) Comparison by By Distributional Channel (2016-2032)
- Table 136: Middle East & Africa Block Margarine Market Revenue (US$ Mn) Comparison by By Application (2016-2032)
- Table 137: Middle East & Africa Block Margarine Market Y-o-Y Growth Rate Comparison by Country (2016-2032)
- Table 138: Middle East & Africa Block Margarine Market Y-o-Y Growth Rate Comparison by By Type (2016-2032)
- Table 139: Middle East & Africa Block Margarine Market Y-o-Y Growth Rate Comparison by By Nature (2016-2032)
- Table 140: Middle East & Africa Block Margarine Market Y-o-Y Growth Rate Comparison by By Distributional Channel (2016-2032)
- Table 141: Middle East & Africa Block Margarine Market Y-o-Y Growth Rate Comparison by By Application (2016-2032)
- Table 142: Middle East & Africa Block Margarine Market Share Comparison by Country (2016-2032)
- Table 143: Middle East & Africa Block Margarine Market Share Comparison by By Type (2016-2032)
- Table 144: Middle East & Africa Block Margarine Market Share Comparison by By Nature (2016-2032)
- Table 145: Middle East & Africa Block Margarine Market Share Comparison by By Distributional Channel (2016-2032)
- Table 146: Middle East & Africa Block Margarine Market Share Comparison by By Application (2016-2032)
- 1. Executive Summary
-
- Unilever
- Bunge Limited
- Arla Foods
- Wilmar International Ltd.
- Conagra Brands, Inc.
- Royal Smilde Foods
- Upfield
- Fuji Oil Holdings Inc.
- Associated British Foods plc
- NMGK Group
- EPM Group
- Ventura Foods, LLC
- Puratos Group
- Vandemoortele
- Mewah International Inc.
Our Clients


View Our Licence Options
