
Blinds And Shades Market Report By Type (Blinds [Venetian Blinds, Vertical Blinds, Roller Blinds, Other Blinds], Shades [Cellular Shades, Roman Shades, Pleated Shades, Roller Shades, Other Shades]), By Application (Residential, Commercial, Industrial, Others), By Installation (New Construction, Retrofit), By Technology (Automatic, Manual), By Distribution Channel, By Region and Companies - Industry Segment Outlook, Market Assessment, Competition Scenario, Trends and Forecast 2024-2033
-
48671
-
July 2024
-
325
-


-
This report was compiled by Research Team Research team of over 50 passionate professionals leverages advanced research methodologies and analytical expertise to deliver insightful, data-driven market intelligence that empowers businesses across diverse industries to make strategic, well-informed Correspondence Research Team Linkedin | Detailed Market research Methodology Our methodology involves a mix of primary research, including interviews with leading mental health experts, and secondary research from reputable medical journals and databases. View Detailed Methodology Page
-
Quick Navigation
Report Overview
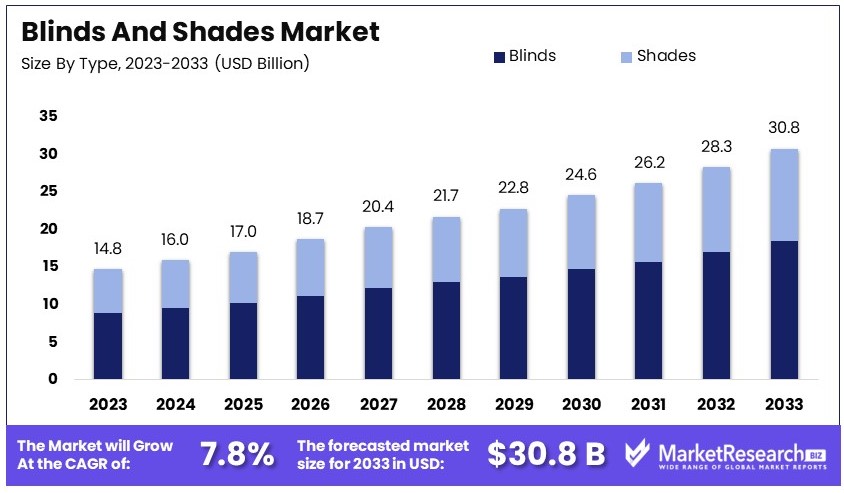
The Global Blinds And Shades Market size is expected to be worth around USD 30.8 Billion by 2033, from USD 14.8 Billion in 2023, growing at a CAGR of 7.8% during the forecast period from 2024 to 2033.
The Blinds and Shades Market involves the production and distribution of window coverings, which provide light control, privacy, and aesthetic appeal for residential and commercial settings. Products range from manual blinds to automated shades, featuring materials like fabric, wood, and synthetic polymers.
This market responds to trends in interior design and consumer preferences for smart home technologies. Growth factors include rising urbanization and the increasing importance of energy-efficient and smart living solutions, catering to a diverse clientele seeking both functionality and style in window treatments.
The blinds and shades market is experiencing notable growth, driven by increasing consumer preference for energy-efficient and sustainable home improvement solutions. North America, in particular, stands out due to its dynamic market conditions. Key players like Hunter Douglas N.V. are spearheading advancements with a strong focus on sustainability. Their strategic initiatives include developing products that enhance energy efficiency, aligning with the growing consumer demand for eco-friendly options.
Government incentives play a crucial role in stimulating market growth. These incentives are designed to encourage homeowners to invest in energy-efficient home improvements. A significant development in this regard is the federal tax credit introduced in January 2023. Hunter Douglas announced this credit for their Duette Honeycomb Shades, underscoring the emphasis on energy-saving products.
The market's trajectory is further supported by technological innovations. Companies are integrating smart home technologies with traditional blinds and shades, enhancing convenience and functionality. This trend is particularly prevalent in urban areas where smart home adoption is higher.
Additionally, the increasing awareness of the environmental impact of household products is prompting consumers to opt for sustainable materials. This shift is encouraging manufacturers to invest in recyclable and biodegradable materials, further propelling market growth.
Overall, the blinds and shades market is poised for substantial growth. The combination of technological advancements, government incentives, and consumer demand for sustainable products creates a robust framework for future expansion. This environment not only supports current market players but also presents lucrative opportunities for new entrants.
Key Takeaways
- Market Value: The Blinds and Shades Market was valued at USD 14.8 billion in 2023 and is expected to reach USD 30.8 billion by 2033, with a CAGR of 7.8%.
- Type Analysis: Roller Blinds dominate with 35%, favored for their versatility and ease of use.
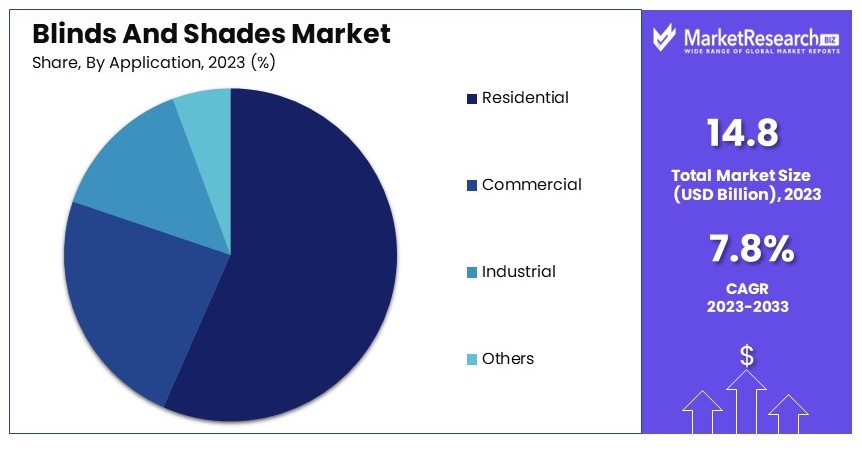
- Application Analysis: Residential applications lead with 60%, driven by increasing home renovations.
- Installation Analysis: Retrofit installations dominate with 70%, indicating high demand for home improvement.
- Technology Analysis: Manual technology leads with 80%, preferred for cost-effectiveness.
- Dominant Region: North America leads with 36%, driven by high consumer spending on home décor.
- Analyst Viewpoint: The market shows steady growth with moderate competition, expected to rise with smart home integration.
- Growth Opportunities: Key players can capitalize on smart blinds and shades technology and expand their product range to boost market share.
Driving Factors
Rising Demand for Energy-Efficient Window Coverings Drives Market Growth
The increasing focus on energy conservation is a significant driver for the blinds and shades market. As energy costs escalate, both homeowners and businesses are turning to energy-efficient window coverings to curb their heating and cooling expenses. Blinds and shades, particularly those designed with insulating features like cellular shades, effectively manage heat gain and loss through windows.
These products, known for their honeycomb-shaped cells, trap air and provide superior insulation, which can significantly reduce energy consumption. The growing awareness of energy efficiency not only boosts the demand for such specialized window coverings but also positions blinds and shades as essential elements in modern energy-saving home and office strategies.
Urbanization and Increasing Construction Activities Fuel Market Expansion
Urbanization and the resulting increase in construction activities are pivotal in driving the demand for blinds and shades. As cities expand and new residential and commercial buildings rise, the need for effective window coverings also grows. Blinds and shades are critical for privacy, controlling natural light, and enhancing the aesthetic appeal of the spaces.
The construction boom, especially in metropolitan areas with a proliferation of high-rise buildings, has escalated the demand for customized blinds and shades that can accommodate a variety of window sizes and styles. This trend not only supports market growth but also diversifies the product offerings in the blinds and shades industry.
Growing Emphasis on Interior Design and Home Décor Stimulates Market Demand
An increasing interest in interior design and home décor among consumers with rising disposable incomes is significantly influencing the blinds and shades market. Today, consumers are not just looking for practicality in window coverings but also style and innovation that complement their living spaces.
The popularity of home automation technologies has further spurred the integration of motorized and automated blinds and shades, enhancing convenience and functionality. These trends underline the blinds and shades as not just functional tools for privacy and light control but as integral components of home aesthetics and modern lifestyle, driving further growth in the market.
Restraining Factors
Competition from Alternatives Restrains Blinds and Shades Market Growth
Competition from alternative window coverings limits the growth of the blinds and shades market. Automatic curtains, drapes, and shutters often compete directly with blinds and shades. These alternatives can be seen as more affordable or easier to install.
For example, in some cultures, curtains and drapes are preferred for their aesthetic appeal and perceived value. This preference can reduce the demand for blinds and shades. Additionally, shutters may be favored for their durability and classic look. The availability and popularity of these alternatives create significant competition, slowing market growth for blinds and shades.
Environmental Concerns Restrain Blinds and Shades Market Growth
Environmental concerns impact the growth of the blinds and shades market. While the industry is developing eco-friendly products, materials like polyvinyl chloride (PVC) raise environmental issues. Consumers and businesses focusing on sustainability may choose other window coverings perceived as more eco-friendly.
For example, natural materials like bamboo or organic cotton for curtains are often seen as better for the environment. This shift in consumer preference towards sustainable products limits the market expansion for traditional blinds and shades made from less eco-friendly materials.
Type Analysis
Roller Blinds dominate with 35% due to their simplicity, versatility, and affordability.
In the blinds and shades market, the Type segment is crucial, with roller blinds leading due to their simplicity, versatility, and affordability. Roller blinds are favored for both residential and commercial applications because they offer an uncluttered look and are available in a wide range of materials and designs, which makes them suitable for various decor styles and functional needs.
Venetian blinds are also significant, particularly appreciated for their adjustable slats that offer precise control over light and privacy. Vertical blinds hold a key place in commercial settings, especially in office environments or large windows, due to their ease of operation and effective light management.
Other types of blinds include Roman and pleated styles, which provide aesthetic appeal but are often more expensive and require more maintenance. These styles are preferred in settings where decor takes precedence over functionality.
The shades market is similarly segmented with options like cellular shades, which are known for energy efficiency due to their layered design that traps air and provides insulation. Roman shades offer a traditional look with soft fabric folds, while pleated shades are lightweight and easy to install, making them practical for casual settings.
The "other shades" category includes innovative and niche products like smart shades, which can be integrated with home automation systems. This segment is growing rapidly as consumers increasingly value convenience and connectivity in their home environments.
Application Analysis
Residential dominates with 60% due to the growing demand for customized home decor solutions.
Application areas for blinds and shades include residential, commercial, and industrial, with the residential sector taking the lead. This dominance is fueled by the increasing interest in home improvement and personalized interior design, driven by trends in home decor and the desire for more comfortable and aesthetically pleasing living spaces.
Commercial applications are also significant, particularly in office buildings, hotels, and other public spaces where functionality and durability are priorities. Blinds and shades in commercial settings are often selected for their ability to control light and enhance energy efficiency, contributing to reduced operational costs.
Industrial applications, though less common, are important in spaces that require specialized solutions, such as factories or workshops where light control and safety are paramount.
The "others" category includes niche markets like healthcare facilities and educational institutions, where blinds and shades are used for both functionality and aesthetics. These segments are expected to grow as more institutions recognize the benefits of having controllable natural light environments.
Installation Analysis
Retrofit dominates with 70% due to the ease of integration into existing structures without the need for major renovations.
Installation types in the blinds and shades market are categorized into new construction and retrofit. Retrofit installations lead the market because they allow homeowners and businesses to upgrade their window treatments without the need for extensive renovations. This option is particularly attractive in older buildings where replacing window treatments can offer an immediate improvement in both aesthetics and energy efficiency.
New construction installations are also significant, especially in rapidly developing regions where new residential and commercial buildings are being constructed. These installations allow for the integration of blinds and shades into the building design from the start, often using more modern and energy-efficient models.
The growth in new construction installations is tied closely to real estate development trends and the economic climate, which influences construction activity levels.
Technology Analysis
Manual blinds and shades dominate with 80% due to their cost-effectiveness and lower need for maintenance.
Technology types in the blinds and shades market include automatic and manual. Manual blinds and shades continue to dominate due to their affordability and simplicity. They are easy to install and maintain, making them the go-to choice for both residential and commercial properties.
Automatic or motorized blinds and shades are gaining popularity, particularly in the high-end residential and commercial sectors, due to their convenience and the increasing integration of smart home technologies. These products offer enhanced functionality, such as remote operation and integration with home automation systems, appealing to tech-savvy consumers and modern workplaces.
The growth of automatic blinds and shades is driven by advancements in technology and a decrease in prices over time, making these products more accessible to a broader audience.
Distribution Channel Analysis
Offline channels dominate with 65% due to the preference for physical product inspection and immediate purchase.
Distribution channels for blinds and shades include online and offline outlets such as supermarkets/hypermarkets, specialty stores, and multi-brand stores. Offline sales channels dominate the market because many consumers prefer to inspect the quality and operation of blinds and shades in person before making a purchase. These channels also offer the advantage of immediate takeaway and often provide installation services, adding value for the customer.
Online channels are growing rapidly, however, as consumers become more comfortable with purchasing home decor products online, driven by the convenience and often lower prices available through online retailers. Online stores are expanding their market share by offering a wider range of products and improved customer support services, including augmented reality tools that help consumers visualize products in their homes before purchase.
Supermarkets and hypermarkets provide accessibility and convenience, particularly for consumers looking for more budget-friendly or standard options. Specialty stores are important for those seeking customized solutions or high-end products, often offering a higher level of customer service and expertise. Multi-brand stores appeal to consumers who appreciate the ability to compare multiple brands and products in one location, making them a popular choice for those looking to make informed purchasing decisions.
Key Market Segments
Type
- Blinds
- Venetian Blinds
- Vertical Blinds
- Roller Blinds
- Other Blinds
- Shades
- Cellular Shades
- Roman Shades
- Pleated Shades
- Roller Shades
- Other Shades
Application
- Residential
- Commercial
- Industrial
- Others
Installation
- New Construction
- Retrofit
Technology
- Automatic
- Manual
Distribution Channel
- Online
- Offline
- Supermarkets/Hypermarkets
- Specialty Stores
- Multi-Brand Stores
Growth Opportunities
Increased Focus on Smart Home Integration Offers Growth Opportunity
The integration of blinds and shades with smart home systems presents a significant growth opportunity. Smart blinds can be controlled remotely, scheduled to open or close at specific times, and integrated with other smart home devices.
This trend is driven by the growing popularity of smart home technologies and the desire for seamless home automation. Consumers appreciate the convenience and energy efficiency offered by smart blinds. As the smart home market expands, the demand for smart blinds and shades will increase, driving market growth.
Customization and Personalization Offers Growth Opportunity
The demand for personalized and customized blinds and shades is rising as consumers seek unique designs that fit their preferences and interior styles. This trend presents an opportunity for manufacturers to offer a wide range of customization options, including various materials, colors, patterns, and designs.
By catering to individual tastes, companies can differentiate their products and capture a larger market share. Providing customization enhances customer satisfaction and loyalty, driving growth in the blinds and shades market.
Trending Factors
Smart and Voice-Controlled Blinds Are Trending Factors
The integration of voice control technology with blinds and shades is a significant trend in the market. Consumers are increasingly embracing the convenience of voice-controlled devices. The ability to operate blinds and shades through voice commands adds an extra layer of ease and appeal.
This trend is driven by the widespread adoption of virtual assistants like Alexa, Siri, and Google Assistant. As more households adopt these technologies, the demand for voice-controlled blinds and shades is expected to grow, driving market expansion.
Motorized and Automated Blinds Are Trending Factors
Motorized and automated blinds are gaining popularity among consumers for their convenience and ease of operation. These blinds can be programmed to open or close at specific times or controlled remotely via smartphone apps or remote controls.
This trend is fueled by the increasing adoption of smart home technologies and the desire for seamless home automation. Motorized blinds offer enhanced comfort and energy efficiency, making them an attractive option for modern homes. As this trend continues, the market for motorized and automated blinds is poised for growth.
Regional Analysis
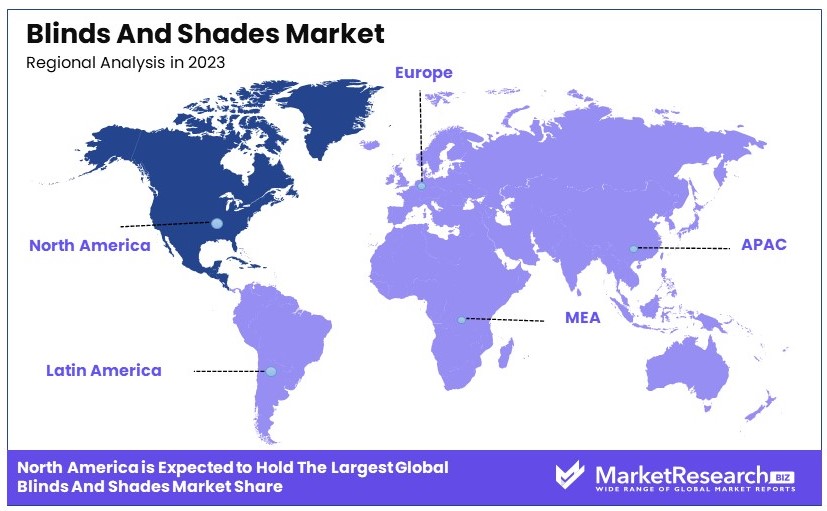
North America Dominates with 36% Market Share in the Blinds and Shades MarketNorth America's strong 36% market share in the blinds and shades industry can be attributed to several key factors. The region benefits from a robust housing market with high demand for home decor and renovation products. There is also a growing trend towards energy-efficient and smart home products, which include technologically advanced blinds and shades. The presence of major manufacturers and a wide distribution network further supports the market dominance.
The blinds and shades market in North America is influenced by consumer preference for aesthetic and functional home furnishings. The increase in residential construction and a rising interest in custom and premium home decor products drive the market. Additionally, the region's focus on sustainability supports the demand for eco-friendly materials in blinds and shades, aligning with global environmental trends.
The future influence of North America in the blinds and shades market is expected to remain strong. Continued growth in the housing market and consumer spending on home improvement are likely to drive further market expansion. Innovations in product design and integration of smart technology into blinds and shades are anticipated to attract more consumers, sustaining the region's market leadership.
Regional Market Shares and Dynamics:
Europe: Europe holds approximately 28% of the market. The region's market is driven by high demand for luxury and design-oriented home products. European consumers' strong focus on interior design aesthetics and energy efficiency also contributes to market growth.
Asia Pacific: Asia Pacific accounts for about 25% of the market. Rapid urbanization, increasing disposable incomes, and expansion of residential sectors in countries like China and India fuel the demand for blinds and shades. The region's growing middle class is particularly influential in driving market trends.
Middle East & Africa: The market share in the Middle East and Africa is around 6%. Although smaller, the market is growing due to increased construction activity and a rising emphasis on luxury residential and commercial properties.
Latin America: Latin America holds around 5% of the global market. Growth in this region is stimulated by improvements in economic conditions and increasing interest in home decor and renovation activities.
Key Regions and Countries
- North America
- The US
- Canada
- Mexico
- Western Europe
- Germany
- France
- The UK
- Spain
- Italy
- Portugal
- Ireland
- Austria
- Switzerland
- Benelux
- Nordic
- Rest of Western Europe
- Eastern Europe
- Russia
- Poland
- The Czech Republic
- Greece
- Rest of Eastern Europe
- APAC
- China
- Japan
- South Korea
- India
- Australia & New Zealand
- Indonesia
- Malaysia
- Philippines
- Singapore
- Thailand
- Vietnam
- Rest of APAC
- Latin America
- Brazil
- Colombia
- Chile
- Argentina
- Costa Rica
- Rest of Latin America
- Middle East & Africa
- Algeria
- Egypt
- Israel
- Kuwait
- Nigeria
- Saudi Arabia
- South Africa
- Turkey
- United Arab Emirates
- Rest of MEA
Key Players Analysis
The Blinds and Shades Market is influenced by several leading companies. Hunter Douglas N.V. and Springs Window Fashions, LLC are market leaders due to their extensive product ranges and strong global presence. They focus on innovation and high-quality materials.
Norman Window Fashions and The Shade Store are known for their custom solutions and excellent customer service. Their strategic focus on personalized products enhances their market positions.
Hillarys Blinds Limited and Lafayette Interior Fashions excel in the UK and European markets. They leverage strong regional distribution networks and innovative designs.
Comfortex Window Fashions and 3 Day Blinds LLC are recognized for their quick delivery and wide variety of products. Their strategies include expanding online sales and customer-centric approaches.
Budget Blinds, LLC and Levolor, Inc. are notable for their affordable and stylish window treatments. They focus on broadening their product lines and enhancing brand visibility.
Graber Blinds and Aluvert Blinds stand out for their durable and high-quality blinds. Their strong emphasis on customer satisfaction and reliability boosts their market influence.
Luxaflex Australia Pty Ltd. and Thomas Sanderson Ltd. are significant players in the Australian and UK markets, respectively. They prioritize innovation and sustainable materials.
MechoShade Systems, Inc. is known for its advanced shading solutions and focus on energy efficiency. Its strategic positioning in commercial markets enhances its market influence.
Overall, the market features a mix of global leaders and specialized firms, each contributing through innovation, quality, and strategic expansion.
Market Key Players
- Hunter Douglas N.V.
- Springs Window Fashions, LLC
- Norman Window Fashions
- The Shade Store
- Hillarys Blinds Limited
- Lafayette Interior Fashions
- Comfortex Window Fashions
- 3 Day Blinds LLC
- Budget Blinds, LLC
- Levolor, Inc.
- Graber Blinds
- Aluvert Blinds
- Luxaflex Australia Pty Ltd.
- Thomas Sanderson Ltd.
- MechoShade Systems, Inc.
Recent Developments
- January 2023 / Hunter Douglas: Hunter Douglas announced a promotion offering savings of up to $1,200 on qualified Duette Honeycomb Shades. This promotion is part of a federal tax credit initiative encouraging the purchase of energy-efficient products. This move aligns with the company's commitment to sustainability and energy efficiency.
- June 2024 / New Cord Safety Laws for Blinds and Shades: Starting in June 2024, new cord safety laws for blinds and shades will be implemented to prevent child strangulation. These regulations mandate the removal of free-hanging cords, tilt cords, inner cords, and multiple cord connectors. Homeowners and businesses are advised to switch to cordless or motorized blinds for enhanced safety, as over 200 incidents involving children have been reported.
Report Scope
Report Features Description Market Value (2023) USD 14.8 Billion Forecast Revenue (2033) USD 30.8 Billion CAGR (2024-2033) 7.8% Base Year for Estimation 2023 Historic Period 2018-2023 Forecast Period 2024-2033 Report Coverage Revenue Forecast, Market Dynamics, Competitive Landscape, Recent Developments Segments Covered By Type (Blinds [Venetian Blinds, Vertical Blinds, Roller Blinds, Other Blinds], Shades [Cellular Shades, Roman Shades, Pleated Shades, Roller Shades, Other Shades]), By Application (Residential, Commercial, Industrial, Others), By Installation (New Construction, Retrofit), By Technology (Automatic, Manual), By Distribution Channel (Online, Offline, Supermarkets/Hypermarkets, Specialty Stores, Multi-Brand Stores) Regional Analysis North America - The US, Canada, & Mexico; Western Europe - Germany, France, The UK, Spain, Italy, Portugal, Ireland, Austria, Switzerland, Benelux, Nordic, & Rest of Western Europe; Eastern Europe - Russia, Poland, The Czech Republic, Greece, & Rest of Eastern Europe; APAC - China, Japan, South Korea, India, Australia & New Zealand, Indonesia, Malaysia, Philippines, Singapore, Thailand, Vietnam, & Rest of APAC; Latin America - Brazil, Colombia, Chile, Argentina, Costa Rica, & Rest of Latin America; Middle East & Africa - Algeria, Egypt, Israel, Kuwait, Nigeria, Saudi Arabia, South Africa, Turkey, United Arab Emirates, & Rest of MEA Competitive Landscape Hunter Douglas N.V., Springs Window Fashions, LLC, Norman Window Fashions, The Shade Store, Hillarys Blinds Limited, Lafayette Interior Fashions, Comfortex Window Fashions, 3 Day Blinds LLC, Budget Blinds, LLC, Levolor, Inc., Graber Blinds, Aluvert Blinds, Luxaflex Australia Pty Ltd., Thomas Sanderson Ltd., MechoShade Systems, Inc. Customization Scope Customization for segments, region/country-level will be provided. Moreover, additional customization can be done based on the requirements. Purchase Options We have three licenses to opt for: Single User License, Multi-User License (Up to 5 Users), Corporate Use License (Unlimited User and Printable PDF) -
- 1. Executive Summary
- 1.1. Definition
- 1.2. Taxonomy
- 1.3. Research Scope
- 1.4. Key Analysis
- 1.5. Key Findings by Major Segments
- 1.6. Top strategies by Major Players
- 2. Global Blinds And Shades Market Overview
- 2.1. Blinds And Shades Market Dynamics
- 2.1.1. Drivers
- 2.1.2. Opportunities
- 2.1.3. Restraints
- 2.1.4. Challenges
- 2.2. Macro-economic Factors
- 2.3. Regulatory Framework
- 2.4. Market Investment Feasibility Index
- 2.5. PEST Analysis
- 2.6. PORTER’S Five Force Analysis
- 2.7. Drivers & Restraints Impact Analysis
- 2.8. Industry Chain Analysis
- 2.9. Cost Structure Analysis
- 2.10. Marketing Strategy
- 2.11. Russia-Ukraine War Impact Analysis
- 2.12. Opportunity Map Analysis
- 2.13. Market Competition Scenario Analysis
- 2.14. Product Life Cycle Analysis
- 2.15. Opportunity Orbits
- 2.16. Manufacturer Intensity Map
- 2.17. Major Companies sales by Value & Volume
- 2.1. Blinds And Shades Market Dynamics
- 3. Global Blinds And Shades Market Analysis, Opportunity and Forecast, 2016-2032
- 3.1. Global Blinds And Shades Market Analysis, 2016-2021
- 3.2. Global Blinds And Shades Market Opportunity and Forecast, 2023-2032
- 3.3. Global Blinds And Shades Market Analysis, Opportunity and Forecast, By Type, 2016-2032
- 3.3.1. Global Blinds And Shades Market Analysis by Type: Introduction
- 3.3.2. Market Size Absolute $ Opportunity Analysis and Forecast, By Type, 2016-2032
- 3.3.3. Blinds
- 3.3.4. Shades
- 3.4. Global Blinds And Shades Market Analysis, Opportunity and Forecast, By Application, 2016-2032
- 3.4.1. Global Blinds And Shades Market Analysis by Application: Introduction
- 3.4.2. Market Size Absolute $ Opportunity Analysis and Forecast, By Application, 2016-2032
- 3.4.3. Residential
- 3.4.4. Commercial
- 3.4.5. Industrial
- 3.4.6. Others
- 3.5. Global Blinds And Shades Market Analysis, Opportunity and Forecast, By Installation, 2016-2032
- 3.5.1. Global Blinds And Shades Market Analysis by Installation: Introduction
- 3.5.2. Market Size Absolute $ Opportunity Analysis and Forecast, By Installation, 2016-2032
- 3.5.3. New Construction
- 3.5.4. Retrofit
- 3.6. Global Blinds And Shades Market Analysis, Opportunity and Forecast, By Technology, 2016-2032
- 3.6.1. Global Blinds And Shades Market Analysis by Technology: Introduction
- 3.6.2. Market Size Absolute $ Opportunity Analysis and Forecast, By Technology, 2016-2032
- 3.6.3. Automatic
- 3.6.4. Manual
- 3.7. Global Blinds And Shades Market Analysis, Opportunity and Forecast, By Distribution Channel, 2016-2032
- 3.7.1. Global Blinds And Shades Market Analysis by Distribution Channel: Introduction
- 3.7.2. Market Size Absolute $ Opportunity Analysis and Forecast, By Distribution Channel, 2016-2032
- 3.7.3. Online
- 3.7.4. Offline
- 3.7.5. Supermarkets/Hypermarkets
- 3.7.6. Specialty Stores
- 3.7.7. Multi-Brand Stores
- 4. North America Blinds And Shades Market Analysis, Opportunity and Forecast, 2016-2032
- 4.1. North America Blinds And Shades Market Analysis, 2016-2021
- 4.2. North America Blinds And Shades Market Opportunity and Forecast, 2023-2032
- 4.3. North America Blinds And Shades Market Analysis, Opportunity and Forecast, By Type, 2016-2032
- 4.3.1. North America Blinds And Shades Market Analysis by Type: Introduction
- 4.3.2. Market Size Absolute $ Opportunity Analysis and Forecast, By Type, 2016-2032
- 4.3.3. Blinds
- 4.3.4. Shades
- 4.4. North America Blinds And Shades Market Analysis, Opportunity and Forecast, By Application, 2016-2032
- 4.4.1. North America Blinds And Shades Market Analysis by Application: Introduction
- 4.4.2. Market Size Absolute $ Opportunity Analysis and Forecast, By Application, 2016-2032
- 4.4.3. Residential
- 4.4.4. Commercial
- 4.4.5. Industrial
- 4.4.6. Others
- 4.5. North America Blinds And Shades Market Analysis, Opportunity and Forecast, By Installation, 2016-2032
- 4.5.1. North America Blinds And Shades Market Analysis by Installation: Introduction
- 4.5.2. Market Size Absolute $ Opportunity Analysis and Forecast, By Installation, 2016-2032
- 4.5.3. New Construction
- 4.5.4. Retrofit
- 4.6. North America Blinds And Shades Market Analysis, Opportunity and Forecast, By Technology, 2016-2032
- 4.6.1. North America Blinds And Shades Market Analysis by Technology: Introduction
- 4.6.2. Market Size Absolute $ Opportunity Analysis and Forecast, By Technology, 2016-2032
- 4.6.3. Automatic
- 4.6.4. Manual
- 4.7. North America Blinds And Shades Market Analysis, Opportunity and Forecast, By Distribution Channel, 2016-2032
- 4.7.1. North America Blinds And Shades Market Analysis by Distribution Channel: Introduction
- 4.7.2. Market Size Absolute $ Opportunity Analysis and Forecast, By Distribution Channel, 2016-2032
- 4.7.3. Online
- 4.7.4. Offline
- 4.7.5. Supermarkets/Hypermarkets
- 4.7.6. Specialty Stores
- 4.7.7. Multi-Brand Stores
- 4.8. North America Blinds And Shades Market Analysis, Opportunity and Forecast, By Country , 2016-2032
- 4.8.1. North America Blinds And Shades Market Analysis by Country : Introduction
- 4.8.2. Market Size Absolute $ Opportunity Analysis and Forecast, Country , 2016-2032
- 4.8.2.1. The US
- 4.8.2.2. Canada
- 4.8.2.3. Mexico
- 5. Western Europe Blinds And Shades Market Analysis, Opportunity and Forecast, 2016-2032
- 5.1. Western Europe Blinds And Shades Market Analysis, 2016-2021
- 5.2. Western Europe Blinds And Shades Market Opportunity and Forecast, 2023-2032
- 5.3. Western Europe Blinds And Shades Market Analysis, Opportunity and Forecast, By Type, 2016-2032
- 5.3.1. Western Europe Blinds And Shades Market Analysis by Type: Introduction
- 5.3.2. Market Size Absolute $ Opportunity Analysis and Forecast, By Type, 2016-2032
- 5.3.3. Blinds
- 5.3.4. Shades
- 5.4. Western Europe Blinds And Shades Market Analysis, Opportunity and Forecast, By Application, 2016-2032
- 5.4.1. Western Europe Blinds And Shades Market Analysis by Application: Introduction
- 5.4.2. Market Size Absolute $ Opportunity Analysis and Forecast, By Application, 2016-2032
- 5.4.3. Residential
- 5.4.4. Commercial
- 5.4.5. Industrial
- 5.4.6. Others
- 5.5. Western Europe Blinds And Shades Market Analysis, Opportunity and Forecast, By Installation, 2016-2032
- 5.5.1. Western Europe Blinds And Shades Market Analysis by Installation: Introduction
- 5.5.2. Market Size Absolute $ Opportunity Analysis and Forecast, By Installation, 2016-2032
- 5.5.3. New Construction
- 5.5.4. Retrofit
- 5.6. Western Europe Blinds And Shades Market Analysis, Opportunity and Forecast, By Technology, 2016-2032
- 5.6.1. Western Europe Blinds And Shades Market Analysis by Technology: Introduction
- 5.6.2. Market Size Absolute $ Opportunity Analysis and Forecast, By Technology, 2016-2032
- 5.6.3. Automatic
- 5.6.4. Manual
- 5.7. Western Europe Blinds And Shades Market Analysis, Opportunity and Forecast, By Distribution Channel, 2016-2032
- 5.7.1. Western Europe Blinds And Shades Market Analysis by Distribution Channel: Introduction
- 5.7.2. Market Size Absolute $ Opportunity Analysis and Forecast, By Distribution Channel, 2016-2032
- 5.7.3. Online
- 5.7.4. Offline
- 5.7.5. Supermarkets/Hypermarkets
- 5.7.6. Specialty Stores
- 5.7.7. Multi-Brand Stores
- 5.8. Western Europe Blinds And Shades Market Analysis, Opportunity and Forecast, By Country , 2016-2032
- 5.8.1. Western Europe Blinds And Shades Market Analysis by Country : Introduction
- 5.8.2. Market Size Absolute $ Opportunity Analysis and Forecast, Country , 2016-2032
- 5.8.2.1. Germany
- 5.8.2.2. France
- 5.8.2.3. The UK
- 5.8.2.4. Spain
- 5.8.2.5. Italy
- 5.8.2.6. Portugal
- 5.8.2.7. Ireland
- 5.8.2.8. Austria
- 5.8.2.9. Switzerland
- 5.8.2.10. Benelux
- 5.8.2.11. Nordic
- 5.8.2.12. Rest of Western Europe
- 6. Eastern Europe Blinds And Shades Market Analysis, Opportunity and Forecast, 2016-2032
- 6.1. Eastern Europe Blinds And Shades Market Analysis, 2016-2021
- 6.2. Eastern Europe Blinds And Shades Market Opportunity and Forecast, 2023-2032
- 6.3. Eastern Europe Blinds And Shades Market Analysis, Opportunity and Forecast, By Type, 2016-2032
- 6.3.1. Eastern Europe Blinds And Shades Market Analysis by Type: Introduction
- 6.3.2. Market Size Absolute $ Opportunity Analysis and Forecast, By Type, 2016-2032
- 6.3.3. Blinds
- 6.3.4. Shades
- 6.4. Eastern Europe Blinds And Shades Market Analysis, Opportunity and Forecast, By Application, 2016-2032
- 6.4.1. Eastern Europe Blinds And Shades Market Analysis by Application: Introduction
- 6.4.2. Market Size Absolute $ Opportunity Analysis and Forecast, By Application, 2016-2032
- 6.4.3. Residential
- 6.4.4. Commercial
- 6.4.5. Industrial
- 6.4.6. Others
- 6.5. Eastern Europe Blinds And Shades Market Analysis, Opportunity and Forecast, By Installation, 2016-2032
- 6.5.1. Eastern Europe Blinds And Shades Market Analysis by Installation: Introduction
- 6.5.2. Market Size Absolute $ Opportunity Analysis and Forecast, By Installation, 2016-2032
- 6.5.3. New Construction
- 6.5.4. Retrofit
- 6.6. Eastern Europe Blinds And Shades Market Analysis, Opportunity and Forecast, By Technology, 2016-2032
- 6.6.1. Eastern Europe Blinds And Shades Market Analysis by Technology: Introduction
- 6.6.2. Market Size Absolute $ Opportunity Analysis and Forecast, By Technology, 2016-2032
- 6.6.3. Automatic
- 6.6.4. Manual
- 6.7. Eastern Europe Blinds And Shades Market Analysis, Opportunity and Forecast, By Distribution Channel, 2016-2032
- 6.7.1. Eastern Europe Blinds And Shades Market Analysis by Distribution Channel: Introduction
- 6.7.2. Market Size Absolute $ Opportunity Analysis and Forecast, By Distribution Channel, 2016-2032
- 6.7.3. Online
- 6.7.4. Offline
- 6.7.5. Supermarkets/Hypermarkets
- 6.7.6. Specialty Stores
- 6.7.7. Multi-Brand Stores
- 6.8. Eastern Europe Blinds And Shades Market Analysis, Opportunity and Forecast, By Country , 2016-2032
- 6.8.1. Eastern Europe Blinds And Shades Market Analysis by Country : Introduction
- 6.8.2. Market Size Absolute $ Opportunity Analysis and Forecast, Country , 2016-2032
- 6.8.2.1. Russia
- 6.8.2.2. Poland
- 6.8.2.3. The Czech Republic
- 6.8.2.4. Greece
- 6.8.2.5. Rest of Eastern Europe
- 7. APAC Blinds And Shades Market Analysis, Opportunity and Forecast, 2016-2032
- 7.1. APAC Blinds And Shades Market Analysis, 2016-2021
- 7.2. APAC Blinds And Shades Market Opportunity and Forecast, 2023-2032
- 7.3. APAC Blinds And Shades Market Analysis, Opportunity and Forecast, By Type, 2016-2032
- 7.3.1. APAC Blinds And Shades Market Analysis by Type: Introduction
- 7.3.2. Market Size Absolute $ Opportunity Analysis and Forecast, By Type, 2016-2032
- 7.3.3. Blinds
- 7.3.4. Shades
- 7.4. APAC Blinds And Shades Market Analysis, Opportunity and Forecast, By Application, 2016-2032
- 7.4.1. APAC Blinds And Shades Market Analysis by Application: Introduction
- 7.4.2. Market Size Absolute $ Opportunity Analysis and Forecast, By Application, 2016-2032
- 7.4.3. Residential
- 7.4.4. Commercial
- 7.4.5. Industrial
- 7.4.6. Others
- 7.5. APAC Blinds And Shades Market Analysis, Opportunity and Forecast, By Installation, 2016-2032
- 7.5.1. APAC Blinds And Shades Market Analysis by Installation: Introduction
- 7.5.2. Market Size Absolute $ Opportunity Analysis and Forecast, By Installation, 2016-2032
- 7.5.3. New Construction
- 7.5.4. Retrofit
- 7.6. APAC Blinds And Shades Market Analysis, Opportunity and Forecast, By Technology, 2016-2032
- 7.6.1. APAC Blinds And Shades Market Analysis by Technology: Introduction
- 7.6.2. Market Size Absolute $ Opportunity Analysis and Forecast, By Technology, 2016-2032
- 7.6.3. Automatic
- 7.6.4. Manual
- 7.7. APAC Blinds And Shades Market Analysis, Opportunity and Forecast, By Distribution Channel, 2016-2032
- 7.7.1. APAC Blinds And Shades Market Analysis by Distribution Channel: Introduction
- 7.7.2. Market Size Absolute $ Opportunity Analysis and Forecast, By Distribution Channel, 2016-2032
- 7.7.3. Online
- 7.7.4. Offline
- 7.7.5. Supermarkets/Hypermarkets
- 7.7.6. Specialty Stores
- 7.7.7. Multi-Brand Stores
- 7.8. APAC Blinds And Shades Market Analysis, Opportunity and Forecast, By Country , 2016-2032
- 7.8.1. APAC Blinds And Shades Market Analysis by Country : Introduction
- 7.8.2. Market Size Absolute $ Opportunity Analysis and Forecast, Country , 2016-2032
- 7.8.2.1. China
- 7.8.2.2. Japan
- 7.8.2.3. South Korea
- 7.8.2.4. India
- 7.8.2.5. Australia & New Zeland
- 7.8.2.6. Indonesia
- 7.8.2.7. Malaysia
- 7.8.2.8. Philippines
- 7.8.2.9. Singapore
- 7.8.2.10. Thailand
- 7.8.2.11. Vietnam
- 7.8.2.12. Rest of APAC
- 8. Latin America Blinds And Shades Market Analysis, Opportunity and Forecast, 2016-2032
- 8.1. Latin America Blinds And Shades Market Analysis, 2016-2021
- 8.2. Latin America Blinds And Shades Market Opportunity and Forecast, 2023-2032
- 8.3. Latin America Blinds And Shades Market Analysis, Opportunity and Forecast, By Type, 2016-2032
- 8.3.1. Latin America Blinds And Shades Market Analysis by Type: Introduction
- 8.3.2. Market Size Absolute $ Opportunity Analysis and Forecast, By Type, 2016-2032
- 8.3.3. Blinds
- 8.3.4. Shades
- 8.4. Latin America Blinds And Shades Market Analysis, Opportunity and Forecast, By Application, 2016-2032
- 8.4.1. Latin America Blinds And Shades Market Analysis by Application: Introduction
- 8.4.2. Market Size Absolute $ Opportunity Analysis and Forecast, By Application, 2016-2032
- 8.4.3. Residential
- 8.4.4. Commercial
- 8.4.5. Industrial
- 8.4.6. Others
- 8.5. Latin America Blinds And Shades Market Analysis, Opportunity and Forecast, By Installation, 2016-2032
- 8.5.1. Latin America Blinds And Shades Market Analysis by Installation: Introduction
- 8.5.2. Market Size Absolute $ Opportunity Analysis and Forecast, By Installation, 2016-2032
- 8.5.3. New Construction
- 8.5.4. Retrofit
- 8.6. Latin America Blinds And Shades Market Analysis, Opportunity and Forecast, By Technology, 2016-2032
- 8.6.1. Latin America Blinds And Shades Market Analysis by Technology: Introduction
- 8.6.2. Market Size Absolute $ Opportunity Analysis and Forecast, By Technology, 2016-2032
- 8.6.3. Automatic
- 8.6.4. Manual
- 8.7. Latin America Blinds And Shades Market Analysis, Opportunity and Forecast, By Distribution Channel, 2016-2032
- 8.7.1. Latin America Blinds And Shades Market Analysis by Distribution Channel: Introduction
- 8.7.2. Market Size Absolute $ Opportunity Analysis and Forecast, By Distribution Channel, 2016-2032
- 8.7.3. Online
- 8.7.4. Offline
- 8.7.5. Supermarkets/Hypermarkets
- 8.7.6. Specialty Stores
- 8.7.7. Multi-Brand Stores
- 8.8. Latin America Blinds And Shades Market Analysis, Opportunity and Forecast, By Country , 2016-2032
- 8.8.1. Latin America Blinds And Shades Market Analysis by Country : Introduction
- 8.8.2. Market Size Absolute $ Opportunity Analysis and Forecast, Country , 2016-2032
- 8.8.2.1. Brazil
- 8.8.2.2. Colombia
- 8.8.2.3. Chile
- 8.8.2.4. Argentina
- 8.8.2.5. Costa Rica
- 8.8.2.6. Rest of Latin America
- 9. Middle East & Africa Blinds And Shades Market Analysis, Opportunity and Forecast, 2016-2032
- 9.1. Middle East & Africa Blinds And Shades Market Analysis, 2016-2021
- 9.2. Middle East & Africa Blinds And Shades Market Opportunity and Forecast, 2023-2032
- 9.3. Middle East & Africa Blinds And Shades Market Analysis, Opportunity and Forecast, By Type, 2016-2032
- 9.3.1. Middle East & Africa Blinds And Shades Market Analysis by Type: Introduction
- 9.3.2. Market Size Absolute $ Opportunity Analysis and Forecast, By Type, 2016-2032
- 9.3.3. Blinds
- 9.3.4. Shades
- 9.4. Middle East & Africa Blinds And Shades Market Analysis, Opportunity and Forecast, By Application, 2016-2032
- 9.4.1. Middle East & Africa Blinds And Shades Market Analysis by Application: Introduction
- 9.4.2. Market Size Absolute $ Opportunity Analysis and Forecast, By Application, 2016-2032
- 9.4.3. Residential
- 9.4.4. Commercial
- 9.4.5. Industrial
- 9.4.6. Others
- 9.5. Middle East & Africa Blinds And Shades Market Analysis, Opportunity and Forecast, By Installation, 2016-2032
- 9.5.1. Middle East & Africa Blinds And Shades Market Analysis by Installation: Introduction
- 9.5.2. Market Size Absolute $ Opportunity Analysis and Forecast, By Installation, 2016-2032
- 9.5.3. New Construction
- 9.5.4. Retrofit
- 9.6. Middle East & Africa Blinds And Shades Market Analysis, Opportunity and Forecast, By Technology, 2016-2032
- 9.6.1. Middle East & Africa Blinds And Shades Market Analysis by Technology: Introduction
- 9.6.2. Market Size Absolute $ Opportunity Analysis and Forecast, By Technology, 2016-2032
- 9.6.3. Automatic
- 9.6.4. Manual
- 9.7. Middle East & Africa Blinds And Shades Market Analysis, Opportunity and Forecast, By Distribution Channel, 2016-2032
- 9.7.1. Middle East & Africa Blinds And Shades Market Analysis by Distribution Channel: Introduction
- 9.7.2. Market Size Absolute $ Opportunity Analysis and Forecast, By Distribution Channel, 2016-2032
- 9.7.3. Online
- 9.7.4. Offline
- 9.7.5. Supermarkets/Hypermarkets
- 9.7.6. Specialty Stores
- 9.7.7. Multi-Brand Stores
- 9.8. Middle East & Africa Blinds And Shades Market Analysis, Opportunity and Forecast, By Country , 2016-2032
- 9.8.1. Middle East & Africa Blinds And Shades Market Analysis by Country : Introduction
- 9.8.2. Market Size Absolute $ Opportunity Analysis and Forecast, Country , 2016-2032
- 9.8.2.1. Algeria
- 9.8.2.2. Egypt
- 9.8.2.3. Israel
- 9.8.2.4. Kuwait
- 9.8.2.5. Nigeria
- 9.8.2.6. Saudi Arabia
- 9.8.2.7. South Africa
- 9.8.2.8. Turkey
- 9.8.2.9. The UAE
- 9.8.2.10. Rest of MEA
- 10. Global Blinds And Shades Market Analysis, Opportunity and Forecast, By Region , 2016-2032
- 10.1. Global Blinds And Shades Market Analysis by Region : Introduction
- 10.2. Market Size Absolute $ Opportunity Analysis and Forecast, By Region , 2016-2032
- 10.2.1. North America
- 10.2.2. Western Europe
- 10.2.3. Eastern Europe
- 10.2.4. APAC
- 10.2.5. Latin America
- 10.2.6. Middle East & Africa
- 11. Global Blinds And Shades Market Competitive Landscape, Market Share Analysis, and Company Profiles
- 11.1. Market Share Analysis
- 11.2. Company Profiles
- 11.3. Hunter Douglas N.V.
- 11.3.1. Company Overview
- 11.3.2. Financial Highlights
- 11.3.3. Product Portfolio
- 11.3.4. SWOT Analysis
- 11.3.5. Key Strategies and Developments
- 11.4. Springs Window Fashions, LLC
- 11.4.1. Company Overview
- 11.4.2. Financial Highlights
- 11.4.3. Product Portfolio
- 11.4.4. SWOT Analysis
- 11.4.5. Key Strategies and Developments
- 11.5. Norman Window Fashions
- 11.5.1. Company Overview
- 11.5.2. Financial Highlights
- 11.5.3. Product Portfolio
- 11.5.4. SWOT Analysis
- 11.5.5. Key Strategies and Developments
- 11.6. The Shade Store
- 11.6.1. Company Overview
- 11.6.2. Financial Highlights
- 11.6.3. Product Portfolio
- 11.6.4. SWOT Analysis
- 11.6.5. Key Strategies and Developments
- 11.7. Hillarys Blinds Limited
- 11.7.1. Company Overview
- 11.7.2. Financial Highlights
- 11.7.3. Product Portfolio
- 11.7.4. SWOT Analysis
- 11.7.5. Key Strategies and Developments
- 11.8. Lafayette Interior Fashions
- 11.8.1. Company Overview
- 11.8.2. Financial Highlights
- 11.8.3. Product Portfolio
- 11.8.4. SWOT Analysis
- 11.8.5. Key Strategies and Developments
- 11.9. Comfortex Window Fashions
- 11.9.1. Company Overview
- 11.9.2. Financial Highlights
- 11.9.3. Product Portfolio
- 11.9.4. SWOT Analysis
- 11.9.5. Key Strategies and Developments
- 11.10. 3 Day Blinds LLC
- 11.10.1. Company Overview
- 11.10.2. Financial Highlights
- 11.10.3. Product Portfolio
- 11.10.4. SWOT Analysis
- 11.10.5. Key Strategies and Developments
- 11.11. Budget Blinds, LLC
- 11.11.1. Company Overview
- 11.11.2. Financial Highlights
- 11.11.3. Product Portfolio
- 11.11.4. SWOT Analysis
- 11.11.5. Key Strategies and Developments
- 11.12. Levolor, Inc.
- 11.12.1. Company Overview
- 11.12.2. Financial Highlights
- 11.12.3. Product Portfolio
- 11.12.4. SWOT Analysis
- 11.12.5. Key Strategies and Developments
- 11.13.1. Company Overview
- 11.13.2. Financial Highlights
- 11.13.3. Product Portfolio
- 11.13.4. SWOT Analysis
- 11.13.5. Key Strategies and Developments
- 11.14. Graber Blinds
- 11.14.1. Company Overview
- 11.14.2. Financial Highlights
- 11.14.3. Product Portfolio
- 11.14.4. SWOT Analysis
- 11.14.5. Key Strategies and Developments
- 11.15. Luxaflex Australia Pty Ltd.
- 11.15.1. Company Overview
- 11.15.2. Financial Highlights
- 11.15.3. Product Portfolio
- 11.15.4. SWOT Analysis
- 11.15.5. Key Strategies and Developments
- 11.16. Thomas Sanderson Ltd.
- 11.16.1. Company Overview
- 11.16.2. Financial Highlights
- 11.16.3. Product Portfolio
- 11.16.4. SWOT Analysis
- 11.16.5. Key Strategies and Developments
- 11.17. MechoShade Systems, Inc.
- 11.17.1. Company Overview
- 11.17.2. Financial Highlights
- 11.17.3. Product Portfolio
- 11.17.4. SWOT Analysis
- 11.17.5. Key Strategies and Developments
- 12. Assumptions and Acronyms
- 13. Research Methodology
- 14. Contact
"
- List of Figures
- "
- Figure 1: Global Blinds And Shades Market Revenue (US$ Mn) Market Share by Type in 2022
- Figure 2: Global Blinds And Shades Market Attractiveness Analysis by Type, 2016-2032
- Figure 3: Global Blinds And Shades Market Revenue (US$ Mn) Market Share by Applicationin 2022
- Figure 4: Global Blinds And Shades Market Attractiveness Analysis by Application, 2016-2032
- Figure 5: Global Blinds And Shades Market Revenue (US$ Mn) Market Share by Installationin 2022
- Figure 6: Global Blinds And Shades Market Attractiveness Analysis by Installation, 2016-2032
- Figure 7: Global Blinds And Shades Market Revenue (US$ Mn) Market Share by Technologyin 2022
- Figure 8: Global Blinds And Shades Market Attractiveness Analysis by Technology, 2016-2032
- Figure 9: Global Blinds And Shades Market Revenue (US$ Mn) Market Share by Distribution Channelin 2022
- Figure 10: Global Blinds And Shades Market Attractiveness Analysis by Distribution Channel, 2016-2032
- Figure 11: Global Blinds And Shades Market Revenue (US$ Mn) Market Share by Region in 2022
- Figure 12: Global Blinds And Shades Market Attractiveness Analysis by Region, 2016-2032
- Figure 13: Global Blinds And Shades Market Revenue (US$ Mn) (2016-2032)
- Figure 14: Global Blinds And Shades Market Revenue (US$ Mn) Comparison by Region (2016-2032)
- Figure 15: Global Blinds And Shades Market Revenue (US$ Mn) Comparison by Type (2016-2032)
- Figure 16: Global Blinds And Shades Market Revenue (US$ Mn) Comparison by Application (2016-2032)
- Figure 17: Global Blinds And Shades Market Revenue (US$ Mn) Comparison by Installation (2016-2032)
- Figure 18: Global Blinds And Shades Market Revenue (US$ Mn) Comparison by Technology (2016-2032)
- Figure 19: Global Blinds And Shades Market Revenue (US$ Mn) Comparison by Distribution Channel (2016-2032)
- Figure 20: Global Blinds And Shades Market Y-o-Y Growth Rate Comparison by Region (2016-2032)
- Figure 21: Global Blinds And Shades Market Y-o-Y Growth Rate Comparison by Type (2016-2032)
- Figure 22: Global Blinds And Shades Market Y-o-Y Growth Rate Comparison by Application (2016-2032)
- Figure 23: Global Blinds And Shades Market Y-o-Y Growth Rate Comparison by Installation (2016-2032)
- Figure 24: Global Blinds And Shades Market Y-o-Y Growth Rate Comparison by Technology (2016-2032)
- Figure 25: Global Blinds And Shades Market Y-o-Y Growth Rate Comparison by Distribution Channel (2016-2032)
- Figure 26: Global Blinds And Shades Market Share Comparison by Region (2016-2032)
- Figure 27: Global Blinds And Shades Market Share Comparison by Type (2016-2032)
- Figure 28: Global Blinds And Shades Market Share Comparison by Application (2016-2032)
- Figure 29: Global Blinds And Shades Market Share Comparison by Installation (2016-2032)
- Figure 30: Global Blinds And Shades Market Share Comparison by Technology (2016-2032)
- Figure 31: Global Blinds And Shades Market Share Comparison by Distribution Channel (2016-2032)
- Figure 32: North America Blinds And Shades Market Revenue (US$ Mn) Market Share by Typein 2022
- Figure 33: North America Blinds And Shades Market Attractiveness Analysis by Type, 2016-2032
- Figure 34: North America Blinds And Shades Market Revenue (US$ Mn) Market Share by Applicationin 2022
- Figure 35: North America Blinds And Shades Market Attractiveness Analysis by Application, 2016-2032
- Figure 36: North America Blinds And Shades Market Revenue (US$ Mn) Market Share by Installationin 2022
- Figure 37: North America Blinds And Shades Market Attractiveness Analysis by Installation, 2016-2032
- Figure 38: North America Blinds And Shades Market Revenue (US$ Mn) Market Share by Technologyin 2022
- Figure 39: North America Blinds And Shades Market Attractiveness Analysis by Technology, 2016-2032
- Figure 40: North America Blinds And Shades Market Revenue (US$ Mn) Market Share by Distribution Channelin 2022
- Figure 41: North America Blinds And Shades Market Attractiveness Analysis by Distribution Channel, 2016-2032
- Figure 42: North America Blinds And Shades Market Revenue (US$ Mn) Market Share by Country in 2022
- Figure 43: North America Blinds And Shades Market Attractiveness Analysis by Country, 2016-2032
- Figure 44: North America Blinds And Shades Market Revenue (US$ Mn) (2016-2032)
- Figure 45: North America Blinds And Shades Market Revenue (US$ Mn) Comparison by Country (2016-2032)
- Figure 46: North America Blinds And Shades Market Revenue (US$ Mn) Comparison by Type (2016-2032)
- Figure 47: North America Blinds And Shades Market Revenue (US$ Mn) Comparison by Application (2016-2032)
- Figure 48: North America Blinds And Shades Market Revenue (US$ Mn) Comparison by Installation (2016-2032)
- Figure 49: North America Blinds And Shades Market Revenue (US$ Mn) Comparison by Technology (2016-2032)
- Figure 50: North America Blinds And Shades Market Revenue (US$ Mn) Comparison by Distribution Channel (2016-2032)
- Figure 51: North America Blinds And Shades Market Y-o-Y Growth Rate Comparison by Country (2016-2032)
- Figure 52: North America Blinds And Shades Market Y-o-Y Growth Rate Comparison by Type (2016-2032)
- Figure 53: North America Blinds And Shades Market Y-o-Y Growth Rate Comparison by Application (2016-2032)
- Figure 54: North America Blinds And Shades Market Y-o-Y Growth Rate Comparison by Installation (2016-2032)
- Figure 55: North America Blinds And Shades Market Y-o-Y Growth Rate Comparison by Technology (2016-2032)
- Figure 56: North America Blinds And Shades Market Y-o-Y Growth Rate Comparison by Distribution Channel (2016-2032)
- Figure 57: North America Blinds And Shades Market Share Comparison by Country (2016-2032)
- Figure 58: North America Blinds And Shades Market Share Comparison by Type (2016-2032)
- Figure 59: North America Blinds And Shades Market Share Comparison by Application (2016-2032)
- Figure 60: North America Blinds And Shades Market Share Comparison by Installation (2016-2032)
- Figure 61: North America Blinds And Shades Market Share Comparison by Technology (2016-2032)
- Figure 62: North America Blinds And Shades Market Share Comparison by Distribution Channel (2016-2032)
- Figure 63: Western Europe Blinds And Shades Market Revenue (US$ Mn) Market Share by Typein 2022
- Figure 64: Western Europe Blinds And Shades Market Attractiveness Analysis by Type, 2016-2032
- Figure 65: Western Europe Blinds And Shades Market Revenue (US$ Mn) Market Share by Applicationin 2022
- Figure 66: Western Europe Blinds And Shades Market Attractiveness Analysis by Application, 2016-2032
- Figure 67: Western Europe Blinds And Shades Market Revenue (US$ Mn) Market Share by Installationin 2022
- Figure 68: Western Europe Blinds And Shades Market Attractiveness Analysis by Installation, 2016-2032
- Figure 69: Western Europe Blinds And Shades Market Revenue (US$ Mn) Market Share by Technologyin 2022
- Figure 70: Western Europe Blinds And Shades Market Attractiveness Analysis by Technology, 2016-2032
- Figure 71: Western Europe Blinds And Shades Market Revenue (US$ Mn) Market Share by Distribution Channelin 2022
- Figure 72: Western Europe Blinds And Shades Market Attractiveness Analysis by Distribution Channel, 2016-2032
- Figure 73: Western Europe Blinds And Shades Market Revenue (US$ Mn) Market Share by Country in 2022
- Figure 74: Western Europe Blinds And Shades Market Attractiveness Analysis by Country, 2016-2032
- Figure 75: Western Europe Blinds And Shades Market Revenue (US$ Mn) (2016-2032)
- Figure 76: Western Europe Blinds And Shades Market Revenue (US$ Mn) Comparison by Country (2016-2032)
- Figure 77: Western Europe Blinds And Shades Market Revenue (US$ Mn) Comparison by Type (2016-2032)
- Figure 78: Western Europe Blinds And Shades Market Revenue (US$ Mn) Comparison by Application (2016-2032)
- Figure 79: Western Europe Blinds And Shades Market Revenue (US$ Mn) Comparison by Installation (2016-2032)
- Figure 80: Western Europe Blinds And Shades Market Revenue (US$ Mn) Comparison by Technology (2016-2032)
- Figure 81: Western Europe Blinds And Shades Market Revenue (US$ Mn) Comparison by Distribution Channel (2016-2032)
- Figure 82: Western Europe Blinds And Shades Market Y-o-Y Growth Rate Comparison by Country (2016-2032)
- Figure 83: Western Europe Blinds And Shades Market Y-o-Y Growth Rate Comparison by Type (2016-2032)
- Figure 84: Western Europe Blinds And Shades Market Y-o-Y Growth Rate Comparison by Application (2016-2032)
- Figure 85: Western Europe Blinds And Shades Market Y-o-Y Growth Rate Comparison by Installation (2016-2032)
- Figure 86: Western Europe Blinds And Shades Market Y-o-Y Growth Rate Comparison by Technology (2016-2032)
- Figure 87: Western Europe Blinds And Shades Market Y-o-Y Growth Rate Comparison by Distribution Channel (2016-2032)
- Figure 88: Western Europe Blinds And Shades Market Share Comparison by Country (2016-2032)
- Figure 89: Western Europe Blinds And Shades Market Share Comparison by Type (2016-2032)
- Figure 90: Western Europe Blinds And Shades Market Share Comparison by Application (2016-2032)
- Figure 91: Western Europe Blinds And Shades Market Share Comparison by Installation (2016-2032)
- Figure 92: Western Europe Blinds And Shades Market Share Comparison by Technology (2016-2032)
- Figure 93: Western Europe Blinds And Shades Market Share Comparison by Distribution Channel (2016-2032)
- Figure 94: Eastern Europe Blinds And Shades Market Revenue (US$ Mn) Market Share by Typein 2022
- Figure 95: Eastern Europe Blinds And Shades Market Attractiveness Analysis by Type, 2016-2032
- Figure 96: Eastern Europe Blinds And Shades Market Revenue (US$ Mn) Market Share by Applicationin 2022
- Figure 97: Eastern Europe Blinds And Shades Market Attractiveness Analysis by Application, 2016-2032
- Figure 98: Eastern Europe Blinds And Shades Market Revenue (US$ Mn) Market Share by Installationin 2022
- Figure 99: Eastern Europe Blinds And Shades Market Attractiveness Analysis by Installation, 2016-2032
- Figure 100: Eastern Europe Blinds And Shades Market Revenue (US$ Mn) Market Share by Technologyin 2022
- Figure 101: Eastern Europe Blinds And Shades Market Attractiveness Analysis by Technology, 2016-2032
- Figure 102: Eastern Europe Blinds And Shades Market Revenue (US$ Mn) Market Share by Distribution Channelin 2022
- Figure 103: Eastern Europe Blinds And Shades Market Attractiveness Analysis by Distribution Channel, 2016-2032
- Figure 104: Eastern Europe Blinds And Shades Market Revenue (US$ Mn) Market Share by Country in 2022
- Figure 105: Eastern Europe Blinds And Shades Market Attractiveness Analysis by Country, 2016-2032
- Figure 106: Eastern Europe Blinds And Shades Market Revenue (US$ Mn) (2016-2032)
- Figure 107: Eastern Europe Blinds And Shades Market Revenue (US$ Mn) Comparison by Country (2016-2032)
- Figure 108: Eastern Europe Blinds And Shades Market Revenue (US$ Mn) Comparison by Type (2016-2032)
- Figure 109: Eastern Europe Blinds And Shades Market Revenue (US$ Mn) Comparison by Application (2016-2032)
- Figure 110: Eastern Europe Blinds And Shades Market Revenue (US$ Mn) Comparison by Installation (2016-2032)
- Figure 111: Eastern Europe Blinds And Shades Market Revenue (US$ Mn) Comparison by Technology (2016-2032)
- Figure 112: Eastern Europe Blinds And Shades Market Revenue (US$ Mn) Comparison by Distribution Channel (2016-2032)
- Figure 113: Eastern Europe Blinds And Shades Market Y-o-Y Growth Rate Comparison by Country (2016-2032)
- Figure 114: Eastern Europe Blinds And Shades Market Y-o-Y Growth Rate Comparison by Type (2016-2032)
- Figure 115: Eastern Europe Blinds And Shades Market Y-o-Y Growth Rate Comparison by Application (2016-2032)
- Figure 116: Eastern Europe Blinds And Shades Market Y-o-Y Growth Rate Comparison by Installation (2016-2032)
- Figure 117: Eastern Europe Blinds And Shades Market Y-o-Y Growth Rate Comparison by Technology (2016-2032)
- Figure 118: Eastern Europe Blinds And Shades Market Y-o-Y Growth Rate Comparison by Distribution Channel (2016-2032)
- Figure 119: Eastern Europe Blinds And Shades Market Share Comparison by Country (2016-2032)
- Figure 120: Eastern Europe Blinds And Shades Market Share Comparison by Type (2016-2032)
- Figure 121: Eastern Europe Blinds And Shades Market Share Comparison by Application (2016-2032)
- Figure 122: Eastern Europe Blinds And Shades Market Share Comparison by Installation (2016-2032)
- Figure 123: Eastern Europe Blinds And Shades Market Share Comparison by Technology (2016-2032)
- Figure 124: Eastern Europe Blinds And Shades Market Share Comparison by Distribution Channel (2016-2032)
- Figure 125: APAC Blinds And Shades Market Revenue (US$ Mn) Market Share by Typein 2022
- Figure 126: APAC Blinds And Shades Market Attractiveness Analysis by Type, 2016-2032
- Figure 127: APAC Blinds And Shades Market Revenue (US$ Mn) Market Share by Applicationin 2022
- Figure 128: APAC Blinds And Shades Market Attractiveness Analysis by Application, 2016-2032
- Figure 129: APAC Blinds And Shades Market Revenue (US$ Mn) Market Share by Installationin 2022
- Figure 130: APAC Blinds And Shades Market Attractiveness Analysis by Installation, 2016-2032
- Figure 131: APAC Blinds And Shades Market Revenue (US$ Mn) Market Share by Technologyin 2022
- Figure 132: APAC Blinds And Shades Market Attractiveness Analysis by Technology, 2016-2032
- Figure 133: APAC Blinds And Shades Market Revenue (US$ Mn) Market Share by Distribution Channelin 2022
- Figure 134: APAC Blinds And Shades Market Attractiveness Analysis by Distribution Channel, 2016-2032
- Figure 135: APAC Blinds And Shades Market Revenue (US$ Mn) Market Share by Country in 2022
- Figure 136: APAC Blinds And Shades Market Attractiveness Analysis by Country, 2016-2032
- Figure 137: APAC Blinds And Shades Market Revenue (US$ Mn) (2016-2032)
- Figure 138: APAC Blinds And Shades Market Revenue (US$ Mn) Comparison by Country (2016-2032)
- Figure 139: APAC Blinds And Shades Market Revenue (US$ Mn) Comparison by Type (2016-2032)
- Figure 140: APAC Blinds And Shades Market Revenue (US$ Mn) Comparison by Application (2016-2032)
- Figure 141: APAC Blinds And Shades Market Revenue (US$ Mn) Comparison by Installation (2016-2032)
- Figure 142: APAC Blinds And Shades Market Revenue (US$ Mn) Comparison by Technology (2016-2032)
- Figure 143: APAC Blinds And Shades Market Revenue (US$ Mn) Comparison by Distribution Channel (2016-2032)
- Figure 144: APAC Blinds And Shades Market Y-o-Y Growth Rate Comparison by Country (2016-2032)
- Figure 145: APAC Blinds And Shades Market Y-o-Y Growth Rate Comparison by Type (2016-2032)
- Figure 146: APAC Blinds And Shades Market Y-o-Y Growth Rate Comparison by Application (2016-2032)
- Figure 147: APAC Blinds And Shades Market Y-o-Y Growth Rate Comparison by Installation (2016-2032)
- Figure 148: APAC Blinds And Shades Market Y-o-Y Growth Rate Comparison by Technology (2016-2032)
- Figure 149: APAC Blinds And Shades Market Y-o-Y Growth Rate Comparison by Distribution Channel (2016-2032)
- Figure 150: APAC Blinds And Shades Market Share Comparison by Country (2016-2032)
- Figure 151: APAC Blinds And Shades Market Share Comparison by Type (2016-2032)
- Figure 152: APAC Blinds And Shades Market Share Comparison by Application (2016-2032)
- Figure 153: APAC Blinds And Shades Market Share Comparison by Installation (2016-2032)
- Figure 154: APAC Blinds And Shades Market Share Comparison by Technology (2016-2032)
- Figure 155: APAC Blinds And Shades Market Share Comparison by Distribution Channel (2016-2032)
- Figure 156: Latin America Blinds And Shades Market Revenue (US$ Mn) Market Share by Typein 2022
- Figure 157: Latin America Blinds And Shades Market Attractiveness Analysis by Type, 2016-2032
- Figure 158: Latin America Blinds And Shades Market Revenue (US$ Mn) Market Share by Applicationin 2022
- Figure 159: Latin America Blinds And Shades Market Attractiveness Analysis by Application, 2016-2032
- Figure 160: Latin America Blinds And Shades Market Revenue (US$ Mn) Market Share by Installationin 2022
- Figure 161: Latin America Blinds And Shades Market Attractiveness Analysis by Installation, 2016-2032
- Figure 162: Latin America Blinds And Shades Market Revenue (US$ Mn) Market Share by Technologyin 2022
- Figure 163: Latin America Blinds And Shades Market Attractiveness Analysis by Technology, 2016-2032
- Figure 164: Latin America Blinds And Shades Market Revenue (US$ Mn) Market Share by Distribution Channelin 2022
- Figure 165: Latin America Blinds And Shades Market Attractiveness Analysis by Distribution Channel, 2016-2032
- Figure 166: Latin America Blinds And Shades Market Revenue (US$ Mn) Market Share by Country in 2022
- Figure 167: Latin America Blinds And Shades Market Attractiveness Analysis by Country, 2016-2032
- Figure 168: Latin America Blinds And Shades Market Revenue (US$ Mn) (2016-2032)
- Figure 169: Latin America Blinds And Shades Market Revenue (US$ Mn) Comparison by Country (2016-2032)
- Figure 170: Latin America Blinds And Shades Market Revenue (US$ Mn) Comparison by Type (2016-2032)
- Figure 171: Latin America Blinds And Shades Market Revenue (US$ Mn) Comparison by Application (2016-2032)
- Figure 172: Latin America Blinds And Shades Market Revenue (US$ Mn) Comparison by Installation (2016-2032)
- Figure 173: Latin America Blinds And Shades Market Revenue (US$ Mn) Comparison by Technology (2016-2032)
- Figure 174: Latin America Blinds And Shades Market Revenue (US$ Mn) Comparison by Distribution Channel (2016-2032)
- Figure 175: Latin America Blinds And Shades Market Y-o-Y Growth Rate Comparison by Country (2016-2032)
- Figure 176: Latin America Blinds And Shades Market Y-o-Y Growth Rate Comparison by Type (2016-2032)
- Figure 177: Latin America Blinds And Shades Market Y-o-Y Growth Rate Comparison by Application (2016-2032)
- Figure 178: Latin America Blinds And Shades Market Y-o-Y Growth Rate Comparison by Installation (2016-2032)
- Figure 179: Latin America Blinds And Shades Market Y-o-Y Growth Rate Comparison by Technology (2016-2032)
- Figure 180: Latin America Blinds And Shades Market Y-o-Y Growth Rate Comparison by Distribution Channel (2016-2032)
- Figure 181: Latin America Blinds And Shades Market Share Comparison by Country (2016-2032)
- Figure 182: Latin America Blinds And Shades Market Share Comparison by Type (2016-2032)
- Figure 183: Latin America Blinds And Shades Market Share Comparison by Application (2016-2032)
- Figure 184: Latin America Blinds And Shades Market Share Comparison by Installation (2016-2032)
- Figure 185: Latin America Blinds And Shades Market Share Comparison by Technology (2016-2032)
- Figure 186: Latin America Blinds And Shades Market Share Comparison by Distribution Channel (2016-2032)
- Figure 187: Middle East & Africa Blinds And Shades Market Revenue (US$ Mn) Market Share by Typein 2022
- Figure 188: Middle East & Africa Blinds And Shades Market Attractiveness Analysis by Type, 2016-2032
- Figure 189: Middle East & Africa Blinds And Shades Market Revenue (US$ Mn) Market Share by Applicationin 2022
- Figure 190: Middle East & Africa Blinds And Shades Market Attractiveness Analysis by Application, 2016-2032
- Figure 191: Middle East & Africa Blinds And Shades Market Revenue (US$ Mn) Market Share by Installationin 2022
- Figure 192: Middle East & Africa Blinds And Shades Market Attractiveness Analysis by Installation, 2016-2032
- Figure 193: Middle East & Africa Blinds And Shades Market Revenue (US$ Mn) Market Share by Technologyin 2022
- Figure 194: Middle East & Africa Blinds And Shades Market Attractiveness Analysis by Technology, 2016-2032
- Figure 195: Middle East & Africa Blinds And Shades Market Revenue (US$ Mn) Market Share by Distribution Channelin 2022
- Figure 196: Middle East & Africa Blinds And Shades Market Attractiveness Analysis by Distribution Channel, 2016-2032
- Figure 197: Middle East & Africa Blinds And Shades Market Revenue (US$ Mn) Market Share by Country in 2022
- Figure 198: Middle East & Africa Blinds And Shades Market Attractiveness Analysis by Country, 2016-2032
- Figure 199: Middle East & Africa Blinds And Shades Market Revenue (US$ Mn) (2016-2032)
- Figure 200: Middle East & Africa Blinds And Shades Market Revenue (US$ Mn) Comparison by Country (2016-2032)
- Figure 201: Middle East & Africa Blinds And Shades Market Revenue (US$ Mn) Comparison by Type (2016-2032)
- Figure 202: Middle East & Africa Blinds And Shades Market Revenue (US$ Mn) Comparison by Application (2016-2032)
- Figure 203: Middle East & Africa Blinds And Shades Market Revenue (US$ Mn) Comparison by Installation (2016-2032)
- Figure 204: Middle East & Africa Blinds And Shades Market Revenue (US$ Mn) Comparison by Technology (2016-2032)
- Figure 205: Middle East & Africa Blinds And Shades Market Revenue (US$ Mn) Comparison by Distribution Channel (2016-2032)
- Figure 206: Middle East & Africa Blinds And Shades Market Y-o-Y Growth Rate Comparison by Country (2016-2032)
- Figure 207: Middle East & Africa Blinds And Shades Market Y-o-Y Growth Rate Comparison by Type (2016-2032)
- Figure 208: Middle East & Africa Blinds And Shades Market Y-o-Y Growth Rate Comparison by Application (2016-2032)
- Figure 209: Middle East & Africa Blinds And Shades Market Y-o-Y Growth Rate Comparison by Installation (2016-2032)
- Figure 210: Middle East & Africa Blinds And Shades Market Y-o-Y Growth Rate Comparison by Technology (2016-2032)
- Figure 211: Middle East & Africa Blinds And Shades Market Y-o-Y Growth Rate Comparison by Distribution Channel (2016-2032)
- Figure 212: Middle East & Africa Blinds And Shades Market Share Comparison by Country (2016-2032)
- Figure 213: Middle East & Africa Blinds And Shades Market Share Comparison by Type (2016-2032)
- Figure 214: Middle East & Africa Blinds And Shades Market Share Comparison by Application (2016-2032)
- Figure 215: Middle East & Africa Blinds And Shades Market Share Comparison by Installation (2016-2032)
- Figure 216: Middle East & Africa Blinds And Shades Market Share Comparison by Technology (2016-2032)
- Figure 217: Middle East & Africa Blinds And Shades Market Share Comparison by Distribution Channel (2016-2032)
"
- List of Tables
- "
- Table 1: Global Blinds And Shades Market Comparison by Type (2016-2032)
- Table 2: Global Blinds And Shades Market Comparison by Application (2016-2032)
- Table 3: Global Blinds And Shades Market Comparison by Installation (2016-2032)
- Table 4: Global Blinds And Shades Market Comparison by Technology (2016-2032)
- Table 5: Global Blinds And Shades Market Comparison by Distribution Channel (2016-2032)
- Table 6: Global Blinds And Shades Market Revenue (US$ Mn) Comparison by Region (2016-2032)
- Table 7: Global Blinds And Shades Market Revenue (US$ Mn) (2016-2032)
- Table 8: Global Blinds And Shades Market Revenue (US$ Mn) Comparison by Region (2016-2032)
- Table 9: Global Blinds And Shades Market Revenue (US$ Mn) Comparison by Type (2016-2032)
- Table 10: Global Blinds And Shades Market Revenue (US$ Mn) Comparison by Application (2016-2032)
- Table 11: Global Blinds And Shades Market Revenue (US$ Mn) Comparison by Installation (2016-2032)
- Table 12: Global Blinds And Shades Market Revenue (US$ Mn) Comparison by Technology (2016-2032)
- Table 13: Global Blinds And Shades Market Revenue (US$ Mn) Comparison by Distribution Channel (2016-2032)
- Table 14: Global Blinds And Shades Market Y-o-Y Growth Rate Comparison by Region (2016-2032)
- Table 15: Global Blinds And Shades Market Y-o-Y Growth Rate Comparison by Type (2016-2032)
- Table 16: Global Blinds And Shades Market Y-o-Y Growth Rate Comparison by Application (2016-2032)
- Table 17: Global Blinds And Shades Market Y-o-Y Growth Rate Comparison by Installation (2016-2032)
- Table 18: Global Blinds And Shades Market Y-o-Y Growth Rate Comparison by Technology (2016-2032)
- Table 19: Global Blinds And Shades Market Y-o-Y Growth Rate Comparison by Distribution Channel (2016-2032)
- Table 20: Global Blinds And Shades Market Share Comparison by Region (2016-2032)
- Table 21: Global Blinds And Shades Market Share Comparison by Type (2016-2032)
- Table 22: Global Blinds And Shades Market Share Comparison by Application (2016-2032)
- Table 23: Global Blinds And Shades Market Share Comparison by Installation (2016-2032)
- Table 24: Global Blinds And Shades Market Share Comparison by Technology (2016-2032)
- Table 25: Global Blinds And Shades Market Share Comparison by Distribution Channel (2016-2032)
- Table 26: North America Blinds And Shades Market Comparison by Application (2016-2032)
- Table 27: North America Blinds And Shades Market Comparison by Installation (2016-2032)
- Table 28: North America Blinds And Shades Market Comparison by Technology (2016-2032)
- Table 29: North America Blinds And Shades Market Comparison by Distribution Channel (2016-2032)
- Table 30: North America Blinds And Shades Market Revenue (US$ Mn) Comparison by Country (2016-2032)
- Table 31: North America Blinds And Shades Market Revenue (US$ Mn) (2016-2032)
- Table 32: North America Blinds And Shades Market Revenue (US$ Mn) Comparison by Country (2016-2032)
- Table 33: North America Blinds And Shades Market Revenue (US$ Mn) Comparison by Type (2016-2032)
- Table 34: North America Blinds And Shades Market Revenue (US$ Mn) Comparison by Application (2016-2032)
- Table 35: North America Blinds And Shades Market Revenue (US$ Mn) Comparison by Installation (2016-2032)
- Table 36: North America Blinds And Shades Market Revenue (US$ Mn) Comparison by Technology (2016-2032)
- Table 37: North America Blinds And Shades Market Revenue (US$ Mn) Comparison by Distribution Channel (2016-2032)
- Table 38: North America Blinds And Shades Market Y-o-Y Growth Rate Comparison by Country (2016-2032)
- Table 39: North America Blinds And Shades Market Y-o-Y Growth Rate Comparison by Type (2016-2032)
- Table 40: North America Blinds And Shades Market Y-o-Y Growth Rate Comparison by Application (2016-2032)
- Table 41: North America Blinds And Shades Market Y-o-Y Growth Rate Comparison by Installation (2016-2032)
- Table 42: North America Blinds And Shades Market Y-o-Y Growth Rate Comparison by Technology (2016-2032)
- Table 43: North America Blinds And Shades Market Y-o-Y Growth Rate Comparison by Distribution Channel (2016-2032)
- Table 44: North America Blinds And Shades Market Share Comparison by Country (2016-2032)
- Table 45: North America Blinds And Shades Market Share Comparison by Type (2016-2032)
- Table 46: North America Blinds And Shades Market Share Comparison by Application (2016-2032)
- Table 47: North America Blinds And Shades Market Share Comparison by Installation (2016-2032)
- Table 48: North America Blinds And Shades Market Share Comparison by Technology (2016-2032)
- Table 49: North America Blinds And Shades Market Share Comparison by Distribution Channel (2016-2032)
- Table 50: Western Europe Blinds And Shades Market Comparison by Type (2016-2032)
- Table 51: Western Europe Blinds And Shades Market Comparison by Application (2016-2032)
- Table 52: Western Europe Blinds And Shades Market Comparison by Installation (2016-2032)
- Table 53: Western Europe Blinds And Shades Market Comparison by Technology (2016-2032)
- Table 54: Western Europe Blinds And Shades Market Comparison by Distribution Channel (2016-2032)
- Table 55: Western Europe Blinds And Shades Market Revenue (US$ Mn) Comparison by Country (2016-2032)
- Table 56: Western Europe Blinds And Shades Market Revenue (US$ Mn) (2016-2032)
- Table 57: Western Europe Blinds And Shades Market Revenue (US$ Mn) Comparison by Country (2016-2032)
- Table 58: Western Europe Blinds And Shades Market Revenue (US$ Mn) Comparison by Type (2016-2032)
- Table 59: Western Europe Blinds And Shades Market Revenue (US$ Mn) Comparison by Application (2016-2032)
- Table 60: Western Europe Blinds And Shades Market Revenue (US$ Mn) Comparison by Installation (2016-2032)
- Table 61: Western Europe Blinds And Shades Market Revenue (US$ Mn) Comparison by Technology (2016-2032)
- Table 62: Western Europe Blinds And Shades Market Revenue (US$ Mn) Comparison by Distribution Channel (2016-2032)
- Table 63: Western Europe Blinds And Shades Market Y-o-Y Growth Rate Comparison by Country (2016-2032)
- Table 64: Western Europe Blinds And Shades Market Y-o-Y Growth Rate Comparison by Type (2016-2032)
- Table 65: Western Europe Blinds And Shades Market Y-o-Y Growth Rate Comparison by Application (2016-2032)
- Table 66: Western Europe Blinds And Shades Market Y-o-Y Growth Rate Comparison by Installation (2016-2032)
- Table 67: Western Europe Blinds And Shades Market Y-o-Y Growth Rate Comparison by Technology (2016-2032)
- Table 68: Western Europe Blinds And Shades Market Y-o-Y Growth Rate Comparison by Distribution Channel (2016-2032)
- Table 69: Western Europe Blinds And Shades Market Share Comparison by Country (2016-2032)
- Table 70: Western Europe Blinds And Shades Market Share Comparison by Type (2016-2032)
- Table 71: Western Europe Blinds And Shades Market Share Comparison by Application (2016-2032)
- Table 72: Western Europe Blinds And Shades Market Share Comparison by Installation (2016-2032)
- Table 73: Western Europe Blinds And Shades Market Share Comparison by Technology (2016-2032)
- Table 74: Western Europe Blinds And Shades Market Share Comparison by Distribution Channel (2016-2032)
- Table 75: Eastern Europe Blinds And Shades Market Comparison by Type (2016-2032)
- Table 76: Eastern Europe Blinds And Shades Market Comparison by Application (2016-2032)
- Table 77: Eastern Europe Blinds And Shades Market Comparison by Installation (2016-2032)
- Table 78: Eastern Europe Blinds And Shades Market Comparison by Technology (2016-2032)
- Table 79: Eastern Europe Blinds And Shades Market Comparison by Distribution Channel (2016-2032)
- Table 80: Eastern Europe Blinds And Shades Market Revenue (US$ Mn) Comparison by Country (2016-2032)
- Table 81: Eastern Europe Blinds And Shades Market Revenue (US$ Mn) (2016-2032)
- Table 82: Eastern Europe Blinds And Shades Market Revenue (US$ Mn) Comparison by Country (2016-2032)
- Table 83: Eastern Europe Blinds And Shades Market Revenue (US$ Mn) Comparison by Type (2016-2032)
- Table 84: Eastern Europe Blinds And Shades Market Revenue (US$ Mn) Comparison by Application (2016-2032)
- Table 85: Eastern Europe Blinds And Shades Market Revenue (US$ Mn) Comparison by Installation (2016-2032)
- Table 86: Eastern Europe Blinds And Shades Market Revenue (US$ Mn) Comparison by Technology (2016-2032)
- Table 87: Eastern Europe Blinds And Shades Market Revenue (US$ Mn) Comparison by Distribution Channel (2016-2032)
- Table 88: Eastern Europe Blinds And Shades Market Y-o-Y Growth Rate Comparison by Country (2016-2032)
- Table 89: Eastern Europe Blinds And Shades Market Y-o-Y Growth Rate Comparison by Type (2016-2032)
- Table 90: Eastern Europe Blinds And Shades Market Y-o-Y Growth Rate Comparison by Application (2016-2032)
- Table 91: Eastern Europe Blinds And Shades Market Y-o-Y Growth Rate Comparison by Installation (2016-2032)
- Table 92: Eastern Europe Blinds And Shades Market Y-o-Y Growth Rate Comparison by Technology (2016-2032)
- Table 93: Eastern Europe Blinds And Shades Market Y-o-Y Growth Rate Comparison by Distribution Channel (2016-2032)
- Table 94: Eastern Europe Blinds And Shades Market Share Comparison by Country (2016-2032)
- Table 95: Eastern Europe Blinds And Shades Market Share Comparison by Type (2016-2032)
- Table 96: Eastern Europe Blinds And Shades Market Share Comparison by Application (2016-2032)
- Table 97: Eastern Europe Blinds And Shades Market Share Comparison by Installation (2016-2032)
- Table 98: Eastern Europe Blinds And Shades Market Share Comparison by Technology (2016-2032)
- Table 99: Eastern Europe Blinds And Shades Market Share Comparison by Distribution Channel (2016-2032)
- Table 100: APAC Blinds And Shades Market Comparison by Type (2016-2032)
- Table 101: APAC Blinds And Shades Market Comparison by Application (2016-2032)
- Table 102: APAC Blinds And Shades Market Comparison by Installation (2016-2032)
- Table 103: APAC Blinds And Shades Market Comparison by Technology (2016-2032)
- Table 104: APAC Blinds And Shades Market Comparison by Distribution Channel (2016-2032)
- Table 105: APAC Blinds And Shades Market Revenue (US$ Mn) Comparison by Country (2016-2032)
- Table 106: APAC Blinds And Shades Market Revenue (US$ Mn) (2016-2032)
- Table 107: APAC Blinds And Shades Market Revenue (US$ Mn) Comparison by Country (2016-2032)
- Table 108: APAC Blinds And Shades Market Revenue (US$ Mn) Comparison by Type (2016-2032)
- Table 109: APAC Blinds And Shades Market Revenue (US$ Mn) Comparison by Application (2016-2032)
- Table 110: APAC Blinds And Shades Market Revenue (US$ Mn) Comparison by Installation (2016-2032)
- Table 111: APAC Blinds And Shades Market Revenue (US$ Mn) Comparison by Technology (2016-2032)
- Table 112: APAC Blinds And Shades Market Revenue (US$ Mn) Comparison by Distribution Channel (2016-2032)
- Table 113: APAC Blinds And Shades Market Y-o-Y Growth Rate Comparison by Country (2016-2032)
- Table 114: APAC Blinds And Shades Market Y-o-Y Growth Rate Comparison by Type (2016-2032)
- Table 115: APAC Blinds And Shades Market Y-o-Y Growth Rate Comparison by Application (2016-2032)
- Table 116: APAC Blinds And Shades Market Y-o-Y Growth Rate Comparison by Installation (2016-2032)
- Table 117: APAC Blinds And Shades Market Y-o-Y Growth Rate Comparison by Technology (2016-2032)
- Table 118: APAC Blinds And Shades Market Y-o-Y Growth Rate Comparison by Distribution Channel (2016-2032)
- Table 119: APAC Blinds And Shades Market Share Comparison by Country (2016-2032)
- Table 120: APAC Blinds And Shades Market Share Comparison by Type (2016-2032)
- Table 121: APAC Blinds And Shades Market Share Comparison by Application (2016-2032)
- Table 122: APAC Blinds And Shades Market Share Comparison by Installation (2016-2032)
- Table 123: APAC Blinds And Shades Market Share Comparison by Technology (2016-2032)
- Table 124: APAC Blinds And Shades Market Share Comparison by Distribution Channel (2016-2032)
- Table 125: Latin America Blinds And Shades Market Comparison by Type (2016-2032)
- Table 126: Latin America Blinds And Shades Market Comparison by Application (2016-2032)
- Table 127: Latin America Blinds And Shades Market Comparison by Installation (2016-2032)
- Table 128: Latin America Blinds And Shades Market Comparison by Technology (2016-2032)
- Table 129: Latin America Blinds And Shades Market Comparison by Distribution Channel (2016-2032)
- Table 130: Latin America Blinds And Shades Market Revenue (US$ Mn) Comparison by Country (2016-2032)
- Table 131: Latin America Blinds And Shades Market Revenue (US$ Mn) (2016-2032)
- Table 132: Latin America Blinds And Shades Market Revenue (US$ Mn) Comparison by Country (2016-2032)
- Table 133: Latin America Blinds And Shades Market Revenue (US$ Mn) Comparison by Type (2016-2032)
- Table 134: Latin America Blinds And Shades Market Revenue (US$ Mn) Comparison by Application (2016-2032)
- Table 135: Latin America Blinds And Shades Market Revenue (US$ Mn) Comparison by Installation (2016-2032)
- Table 136: Latin America Blinds And Shades Market Revenue (US$ Mn) Comparison by Technology (2016-2032)
- Table 137: Latin America Blinds And Shades Market Revenue (US$ Mn) Comparison by Distribution Channel (2016-2032)
- Table 138: Latin America Blinds And Shades Market Y-o-Y Growth Rate Comparison by Country (2016-2032)
- Table 139: Latin America Blinds And Shades Market Y-o-Y Growth Rate Comparison by Type (2016-2032)
- Table 140: Latin America Blinds And Shades Market Y-o-Y Growth Rate Comparison by Application (2016-2032)
- Table 141: Latin America Blinds And Shades Market Y-o-Y Growth Rate Comparison by Installation (2016-2032)
- Table 142: Latin America Blinds And Shades Market Y-o-Y Growth Rate Comparison by Technology (2016-2032)
- Table 143: Latin America Blinds And Shades Market Y-o-Y Growth Rate Comparison by Distribution Channel (2016-2032)
- Table 144: Latin America Blinds And Shades Market Share Comparison by Country (2016-2032)
- Table 145: Latin America Blinds And Shades Market Share Comparison by Type (2016-2032)
- Table 146: Latin America Blinds And Shades Market Share Comparison by Application (2016-2032)
- Table 147: Latin America Blinds And Shades Market Share Comparison by Installation (2016-2032)
- Table 148: Latin America Blinds And Shades Market Share Comparison by Technology (2016-2032)
- Table 149: Latin America Blinds And Shades Market Share Comparison by Distribution Channel (2016-2032)
- Table 150: Middle East & Africa Blinds And Shades Market Comparison by Type (2016-2032)
- Table 151: Middle East & Africa Blinds And Shades Market Comparison by Application (2016-2032)
- Table 152: Middle East & Africa Blinds And Shades Market Comparison by Installation (2016-2032)
- Table 153: Middle East & Africa Blinds And Shades Market Comparison by Technology (2016-2032)
- Table 154: Middle East & Africa Blinds And Shades Market Comparison by Distribution Channel (2016-2032)
- Table 155: Middle East & Africa Blinds And Shades Market Revenue (US$ Mn) Comparison by Country (2016-2032)
- Table 156: Middle East & Africa Blinds And Shades Market Revenue (US$ Mn) (2016-2032)
- Table 157: Middle East & Africa Blinds And Shades Market Revenue (US$ Mn) Comparison by Country (2016-2032)
- Table 158: Middle East & Africa Blinds And Shades Market Revenue (US$ Mn) Comparison by Type (2016-2032)
- Table 159: Middle East & Africa Blinds And Shades Market Revenue (US$ Mn) Comparison by Application (2016-2032)
- Table 160: Middle East & Africa Blinds And Shades Market Revenue (US$ Mn) Comparison by Installation (2016-2032)
- Table 161: Middle East & Africa Blinds And Shades Market Revenue (US$ Mn) Comparison by Technology (2016-2032)
- Table 162: Middle East & Africa Blinds And Shades Market Revenue (US$ Mn) Comparison by Distribution Channel (2016-2032)
- Table 163: Middle East & Africa Blinds And Shades Market Y-o-Y Growth Rate Comparison by Country (2016-2032)
- Table 164: Middle East & Africa Blinds And Shades Market Y-o-Y Growth Rate Comparison by Type (2016-2032)
- Table 165: Middle East & Africa Blinds And Shades Market Y-o-Y Growth Rate Comparison by Application (2016-2032)
- Table 166: Middle East & Africa Blinds And Shades Market Y-o-Y Growth Rate Comparison by Installation (2016-2032)
- Table 167: Middle East & Africa Blinds And Shades Market Y-o-Y Growth Rate Comparison by Technology (2016-2032)
- Table 168: Middle East & Africa Blinds And Shades Market Y-o-Y Growth Rate Comparison by Distribution Channel (2016-2032)
- Table 169: Middle East & Africa Blinds And Shades Market Share Comparison by Country (2016-2032)
- Table 170: Middle East & Africa Blinds And Shades Market Share Comparison by Type (2016-2032)
- Table 171: Middle East & Africa Blinds And Shades Market Share Comparison by Application (2016-2032)
- Table 172: Middle East & Africa Blinds And Shades Market Share Comparison by Installation (2016-2032)
- Table 173: Middle East & Africa Blinds And Shades Market Share Comparison by Technology (2016-2032)
- Table 174: Middle East & Africa Blinds And Shades Market Share Comparison by Distribution Channel (2016-2032)
- 1. Executive Summary
-
- Hunter Douglas N.V.
- Springs Window Fashions, LLC
- Norman Window Fashions
- The Shade Store
- Hillarys Blinds Limited
- Lafayette Interior Fashions
- Comfortex Window Fashions
- 3 Day Blinds LLC
- Budget Blinds, LLC
- Levolor, Inc.
- Graber Blinds
- Aluvert Blinds
- Luxaflex Australia Pty Ltd.
- Thomas Sanderson Ltd.
- MechoShade Systems, Inc
Our Clients


View Our Licence Options
