Biological Buffers Market Report By Type (Phosphate Buffers, Acetate Buffers, TRIS Buffers, Carbonate Buffers, Good’s Buffers, Others), By Form (Liquid, Powder), By Application (Research Laboratories, Clinical Laboratories, Pharmaceutical Industry, Biotechnology Industry, Academic Institutes), By End-User (Pharmaceutical Companies, Biotechnology Companies, Academic & Research Institutes, Clinical Laboratories), By Region and Companies - Industry Segment Outlook, Market Assessment, Competition Scenario, Trends and Forecast 2024-2033
-
38028
-
June 2023
-
324
-


-
This report was compiled by Trishita Deb Trishita Deb is an experienced market research and consulting professional with over 7 years of expertise across healthcare, consumer goods, and materials, contributing to over 400 healthcare-related reports. Correspondence Team Lead- Healthcare Linkedin | Detailed Market research Methodology Our methodology involves a mix of primary research, including interviews with leading mental health experts, and secondary research from reputable medical journals and databases. View Detailed Methodology Page
-
Quick Navigation
Report Overview
The Global Biological Buffers Market size is expected to be worth around USD 1,577.0 Billion by 2033, from USD 786.2 Billion in 2023, growing at a CAGR of 7.4% during the forecast period from 2024 to 2033.
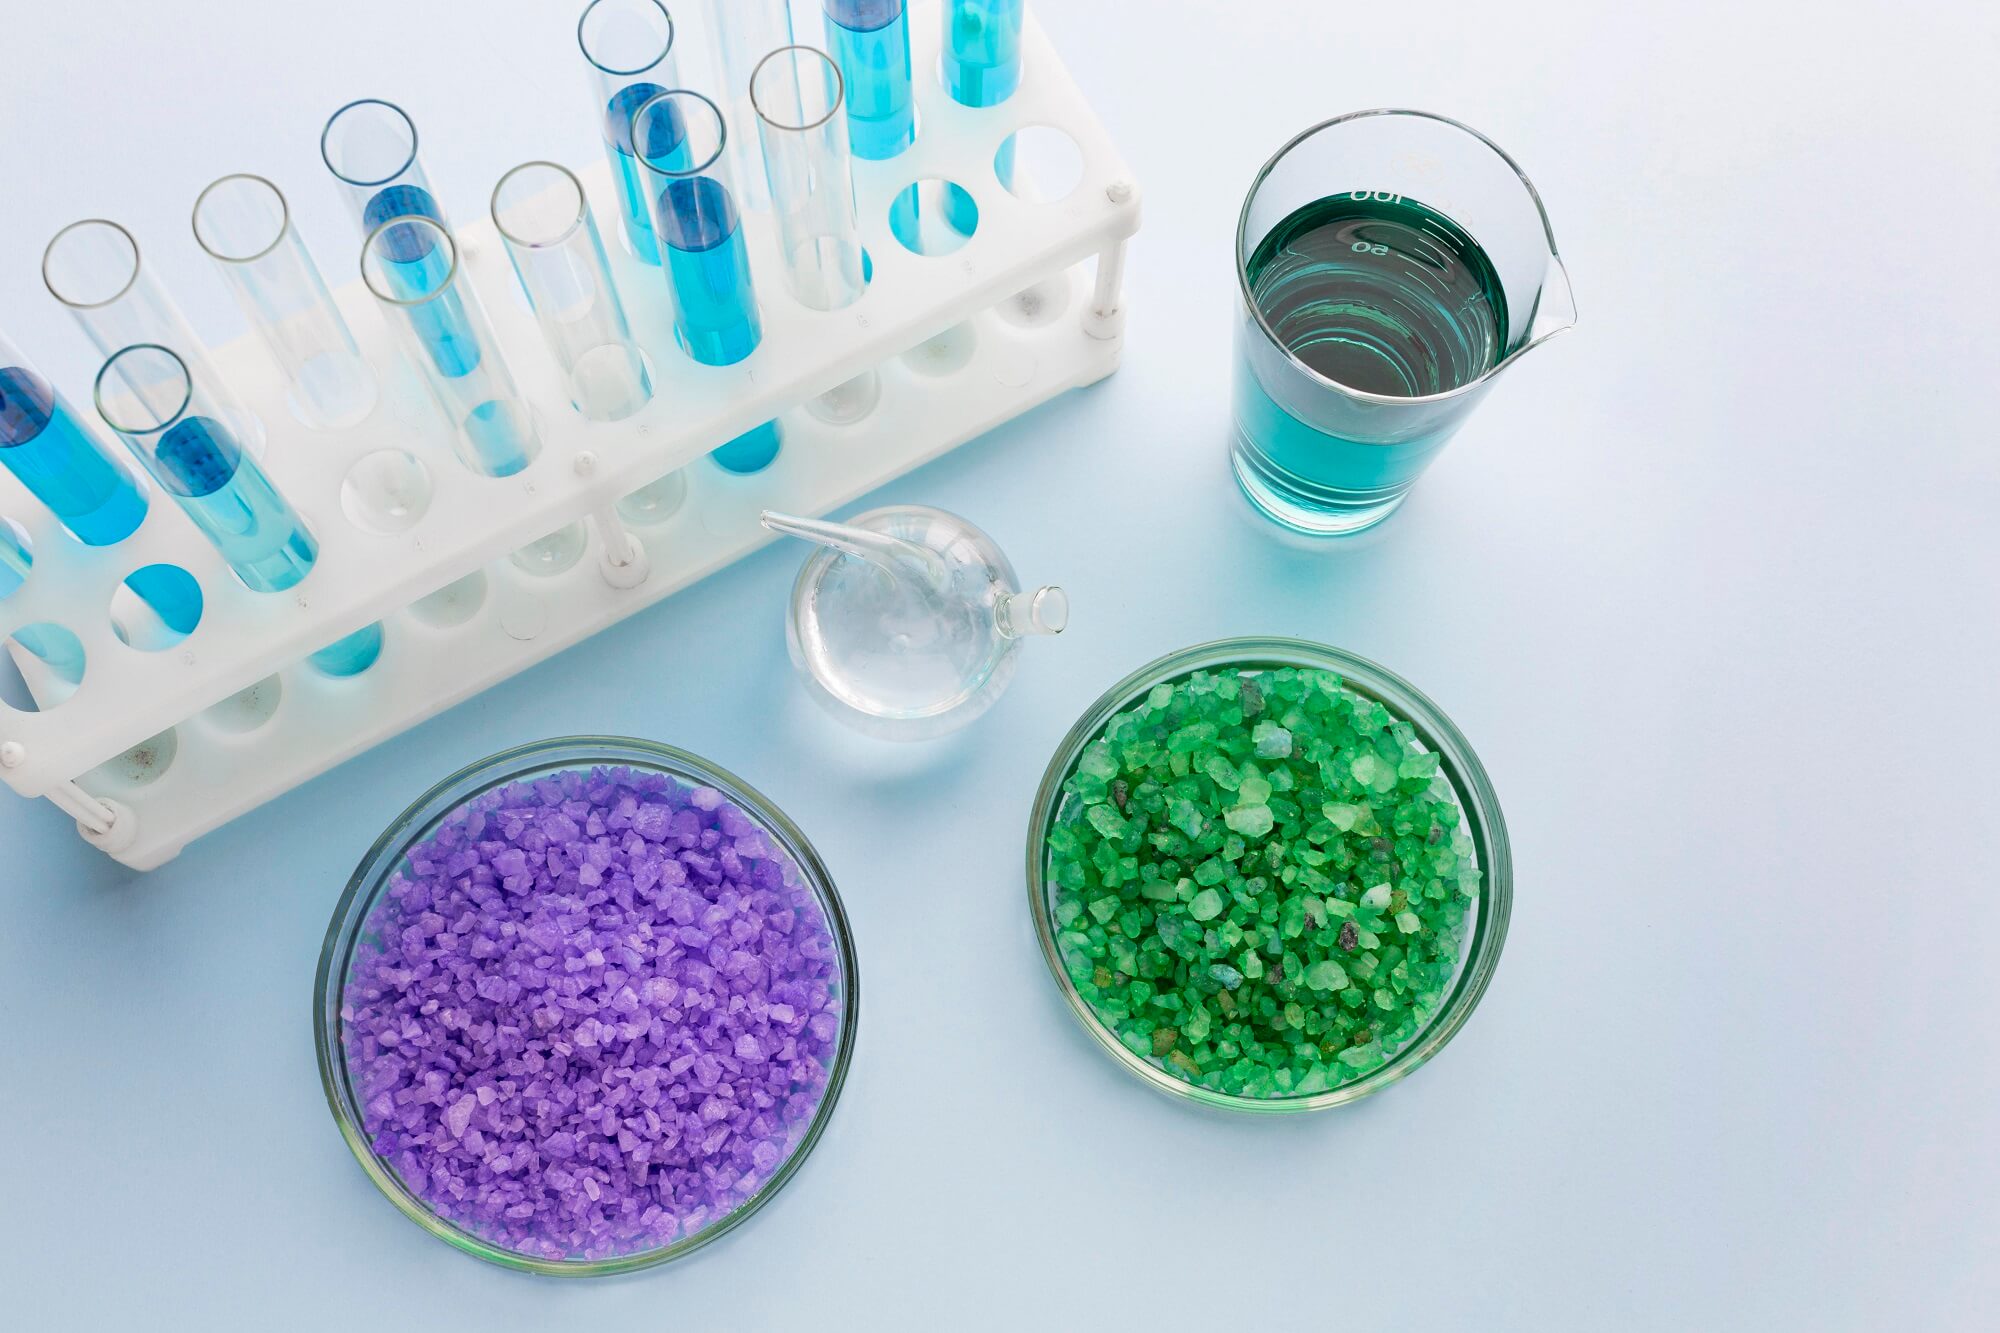
The Biological Buffers Market deals with compounds that maintain pH stability in biological systems. These buffers are essential in research, pharmaceuticals, and diagnostics. They ensure accurate experimental results and drug formulation stability. Key products include Tris, HEPES, and phosphate buffers.
The market is driven by advancements in biotechnology and life sciences. Increasing R&D activities and biopharmaceutical production boost demand. Major consumers are academic institutions, biotech firms, and hospitals. The market faces challenges like raw material costs and regulatory compliance. Growth is anticipated due to expanding biotechnological applications and the development of new buffer solutions.

The biological buffers market is experiencing notable growth, driven by the rising demand for biopharmaceuticals and diagnostics. Biological buffers are essential in maintaining the pH and stability of biological systems, crucial for various applications in research, development, and production. The global demand for these buffers is closely tied to the expansion of the biopharmaceutical sector, which is increasingly relying on advanced biotechnologies.
In 2022, the export of biopharmaceutical products from the United States reached approximately USD 50 billion, with Europe and Asia being significant markets. This robust export performance underscores the critical role of biological buffers in the production and formulation of biopharmaceuticals. The increasing adoption of these buffers in diagnostics further highlights their importance in the healthcare industry.
The import-export landscape for biological buffers is also shaped by the need for high-quality and reliable products. Companies are investing in research and development to innovate and improve buffer systems, ensuring they meet the stringent requirements of biopharmaceutical applications. This focus on quality and innovation is driving market growth and enhancing the competitiveness of key players.
Moreover, the biopharmaceutical industry's reliance on biological buffers is expected to grow as new therapies and diagnostic tools are developed. The expanding pipeline of biologics and the increasing complexity of diagnostic tests will continue to drive demand for advanced buffer systems. Companies operating in this market must prioritize product quality, regulatory compliance, and technological advancements to capitalize on growth opportunities.
The biological buffers market is poised for significant growth, supported by the booming biopharmaceutical and diagnostics sectors. Strategic investments in research, innovation, and quality assurance will be crucial for companies to maintain their competitive edge and meet the evolving demands of the global market.
Key Takeaways
- Market Value: The Biological Buffers Market was valued at USD 786.2 billion in 2023 and is projected to reach USD 1,577.0 billion by 2033, growing at a CAGR of 7.4%.
- Type Analysis: TRIS Buffers lead with 32.7%; essential for biological research.
- Form Analysis: Liquid Buffers dominate at 67.3%; preferred for their ease of use.
- Application Analysis: Research Laboratories have the largest share at 38.4%; central to scientific studies.
- End User Analysis: Pharmaceutical Companies hold 51.2%; major users in drug development.
- Dominant Region: Europe leads with 37.4%; strong research and pharmaceutical sectors.
- Analyst Viewpoint: High innovation and investment in R&D are driving growth in the Biological Buffers Market, with Europe maintaining a significant position due to its advanced healthcare framework.
Driving Factors
Expansion of the Biopharmaceutical Industry Drives Market Growth
The rapid growth of the biopharmaceutical sector is a major driver for the Biological Buffers Market. Biopharmaceutical companies are developing more biologic drugs, increasing the demand for high-quality buffers essential for maintaining optimal pH levels during drug production, purification, and formulation processes. Companies like Merck KGaA have reported increased sales of their buffer products due to the growing demand from manufacturers developing novel therapies such as monoclonal antibodies and gene therapies.
This expansion is crucial as these buffers ensure the stability and effectiveness of biologic drugs. As the biopharmaceutical industry continues to innovate and produce more complex therapies, the need for reliable buffers grows. This trend also interacts with advancements in drug manufacturing technologies, further driving the market. The increasing number of clinical trials and the push for faster drug approval processes are also contributing to the rising demand for biological buffers.
Advancements in Life Sciences Research Drives Market Growth
Continuous progress in life sciences research is fueling the demand for biological buffers. These buffers are essential for maintaining stable conditions in various experimental procedures, including PCR, electrophoresis, and cell culture. The rise of technologies such as CRISPR-Cas9 gene editing has led to an increased need for specialized buffers to optimize these processes and ensure reproducibility in experiments.
As life sciences research delves deeper into areas like genomics, proteomics, and cell culture, the requirement for precise and reliable buffers grows. Researchers depend on these buffers to maintain the integrity of their experiments, ensuring accurate and consistent results. This demand is further amplified by the increasing number of research projects and the global push towards scientific advancements in health and medicine.
Growing Focus on Personalized Medicine Drives Market Growth
The shift towards personalized medicine is significantly driving the need for sophisticated biological buffers. Personalized medicine involves developing targeted therapies based on individual genetic profiles, which require buffers that can maintain the stability and efficacy of these highly specific biologics. Companies like Thermo Fisher Scientific are developing custom buffer formulations to cater to the unique requirements of personalized medicine applications.
This trend is crucial as it ensures that biologic drugs are tailored to individual patient needs, improving treatment outcomes. The growing focus on personalized medicine is also pushing for advancements in buffer technologies to support the development and formulation of these targeted therapies. This interaction between personalized medicine and buffer development is creating a dynamic market landscape, fostering innovation and growth.
Restraining Factors
Stringent Regulatory Requirements Restrain Market Growth
The biological buffers market faces substantial challenges due to stringent regulatory requirements. Biopharmaceutical production and research must comply with rigorous quality control standards and documentation set by regulatory bodies such as the FDA and EMA. This compliance increases production costs and time-to-market.
Companies like Sigma-Aldrich (part of Merck KGaA) invest heavily in quality assurance processes to meet these standards. The additional financial and operational burden can slow down the introduction of new products and limit market expansion, particularly for smaller manufacturers with fewer resources to navigate these complex regulations.
Price Sensitivity and Cost Pressures Restrain Market Growth
Price sensitivity and cost pressures significantly hinder the growth of the biological buffers market. Customers, especially academic research institutions and small biotech firms with limited budgets, prioritize cost-effective solutions. This price sensitivity forces manufacturers to balance between maintaining high product quality and offering competitive pricing.
Some research labs resort to in-house buffer preparation to cut costs, reducing demand for commercial buffer products. Companies like Bio-Rad Laboratories have responded by introducing more affordable buffer options without compromising quality. However, the overall market growth remains constrained by the need to cater to budget-conscious consumers.
Type Analysis
TRIS Buffers dominate with 32.7% due to their essential role in molecular and biochemical research.
TRIS Buffers lead the Biological Buffers Market with a share of 32.7%, primarily because of their wide utility in various scientific processes. These buffers are favored in molecular biology and biochemistry for their strong pH buffering capacity and minimal interaction with chemical reactions within a cell. This makes them indispensable for experiments involving DNA, RNA, and protein isolation where pH stability is crucial.
Phosphate Buffers, holding about 21.4% of the market, are essential in cellular biology for their buffering action in living tissues. They are particularly used in DNA synthesis and polymerase chain reactions, although their use can be limited by their precipitation with divalent cations, affecting their versatility.
Acetate Buffers, which have a market share of approximately 14.2%, are often used in bacterial culture media and enzymatic processes due to their effective buffering in slightly acidic to neutral pH. Carbonate Buffers, capturing around 10.6% of the market, are commonly employed in mammalian cell cultures as they effectively control the pH in higher ranges.
Good’s Buffers are valued for their low membrane permeability and minimal effect on biochemical processes, making up about 14.1% of the market. They are commonly used in cell culture media and enzyme assays. The remaining 'Others' segment, which includes specialized buffers like HEPES and MES, provides tailored solutions for specific research needs, further diversifying the market’s scope.
TRIS Buffers' leading position is supported by their critical applications across a range of research fields, while the other types contribute by fulfilling specialized needs, adding depth and breadth to the market.
Form Analysis
Liquid Buffers dominate with 67.3% due to their convenience and ready-to-use nature.
Liquid buffers hold a dominant position in the Biological Buffers Market with 67.3% of the segment due to their ease of use and immediate application, which reduces preparation errors and saves time in fast-paced research environments. These characteristics make them highly preferred in high-throughput settings, such as automated bioassays and large-scale pharmaceutical manufacturing.
Powder forms, though less prevalent, accounting for 32.7% of the market, are crucial for long-term storage and stability, making them suitable for transport and use in areas with limited infrastructure. They are also cost-effective for bulk use in industrial applications, where they can be prepared in specific concentrations as required.
The dominance of liquid buffers is reinforced by the ongoing advancements in liquid handling technologies, which increase efficiency and precision in their use. However, the role of powder buffers remains significant in global markets, especially in regions prioritizing cost and storage over immediate convenience.
Application Analysis
Research Laboratories dominate with 38.4% due to the intensive research and development activities.
Research Laboratories are the largest application segment within the Biological Buffers Market, holding 38.4% due to the essential role buffers play in various experimental and analytical procedures. The precision required in scientific experiments makes the quality and consistency of biological buffers critical.
Clinical Laboratories, with a 19.7% share, also rely heavily on buffers, especially in diagnostic assays and pathological testing, where the accuracy of results is paramount. Pharmaceutical Industry and Biotechnology Industry, each with significant shares of around 20.9% and 14.2% respectively, use buffers in drug formulation, production processes, and biotechnological research, highlighting the buffers' role in product safety and efficacy.
Academic Institutes, though smaller in percentage, are vital for teaching and preliminary research, often leading to innovations that push market growth forward. Each application area not only utilizes buffers extensively but also drives innovation in buffer chemistry, reflecting ongoing changes in research and development demands.
End-User Analysis
Pharmaceutical Companies dominate with 51.2% due to their extensive use in drug development and quality control processes.
Pharmaceutical Companies represent the largest end-user group in the Biological Buffers Market, accounting for 51.2%. This dominance is attributed to the critical role buffers play in maintaining pH stability in drug formulation and manufacturing, which is essential for ensuring the safety and efficacy of pharmaceutical products.
Biotechnology Companies, holding 24.8% of the market, heavily utilize buffers in various applications, including genetic engineering and protein synthesis, where buffer solutions stabilize the necessary enzymatic and biological reactions. Academic & Research Institutes and Clinical Laboratories, with shares of 12.6% and 11.4% respectively, also contribute significantly, using buffers in a range of scientific studies and medical diagnostics.
The extensive use of biological buffers by Pharmaceutical Companies underscores their pivotal role in health-related industries, while Biotechnology Companies and other end-users highlight the broad applicational reach and impact of these chemical essentials in both research and practical healthcare solutions.

Key Market Segments
By Type
- Phosphate Buffers
- Acetate Buffers
- TRIS Buffers
- Carbonate Buffers
- Good’s Buffers
- Others
By Form
- Liquid
- Powder
By Application
- Research Laboratories
- Clinical Laboratories
- Pharmaceutical Industry
- Biotechnology Industry
- Academic Institutes
By End-User
- Pharmaceutical Companies
- Biotechnology Companies
- Academic & Research Institutes
- Clinical Laboratories
Growth Opportunities
Expansion into Emerging Markets Offers Growth Opportunity
Expansion into emerging markets presents a significant growth opportunity for the biological buffers market. Countries such as India, China, and Brazil are seeing increased investments in life sciences research and biopharmaceutical manufacturing. This growth is driven by the rapid expansion of contract research organizations (CROs) and contract manufacturing organizations (CMOs) in these regions.
Buffer manufacturers can capitalize on this trend by establishing new partnerships and increasing their market share. The burgeoning biopharmaceutical industry in these countries offers a fertile ground for buffer manufacturers to introduce their products and solutions, supporting the development and production of biopharmaceuticals and enhancing the overall market potential.
Development of Application-Specific Buffers Offers Growth Opportunity
The development of application-specific buffers offers substantial growth potential in the biological buffers market. As biological research and biopharmaceutical production become more complex, there is an increasing need for specialized buffer formulations tailored to specific applications.
Companies can capitalize on this trend by developing buffers optimized for emerging technologies such as next-generation sequencing, cell and gene therapies, or 3D bioprinting. For example, creating a buffer line specifically designed to enhance the performance of CRISPR-Cas9 gene editing experiments can attract a niche market segment and drive sales, positioning the company as a leader in innovation and application-specific solutions.
Trending Factors
Shift Towards Continuous Bioprocessing Are Trending Factors
The shift towards continuous bioprocessing is a trending factor driving the biological buffers market. The biopharmaceutical industry's move towards continuous manufacturing processes has increased the demand for buffer products that support this approach. Continuous buffer preparation and delivery systems improve efficiency and reduce costs in large-scale biomanufacturing.
Companies like Sartorius have already introduced continuous buffer preparation systems to address this trend. By adopting these systems, manufacturers can streamline operations, enhance productivity, and meet the growing demand for biopharmaceutical products, making continuous bioprocessing a pivotal trend in the market.
Increasing Focus on Buffer Optimization Are Trending Factors
The increasing focus on buffer optimization is a key trend in the biological buffers market. There is a growing emphasis on enhancing the stability, efficacy, and shelf-life of biopharmaceutical products through optimized buffer formulations. This trend drives research into novel buffer components and formulations that can improve product quality and reduce manufacturing costs.
For example, researchers are exploring the use of amino acids as buffer components to enhance protein stability during downstream processing. This innovation can lead to higher quality biopharmaceuticals and more efficient production processes, making buffer optimization a critical factor in the market's evolution and growth.
Regional Analysis
Europe Dominates with 37.4% Market Share in the Biological Buffers Market
Europe's robust 37.4% share in the biological buffers market can be attributed to its strong foundation in pharmaceutical and biotechnology research. The region is home to numerous leading pharmaceutical companies and research institutions that demand high-quality, reliable biological buffers for various applications, including drug development and molecular diagnostics. Additionally, Europe's stringent regulations regarding pharmaceutical manufacturing and research ensure a consistent demand for standardized, high-grade biological buffers.
The market dynamics in Europe are influenced by its advanced healthcare infrastructure and substantial investments in biotechnology and healthcare research. The presence of a highly educated workforce and cutting-edge research facilities further supports the development and production of biological buffers. Moreover, collaborations between academia and industry enhance innovation in this sector, sustaining Europe’s market leadership.
The future of Europe in the biological buffers market appears promising, with potential for growth as the biotechnology sector continues to expand. Increased funding for research in genomics and proteomics and rising demand for personalized medicine are expected to drive further use of biological buffers. Europe's commitment to maintaining high standards in research and development is likely to keep it at the forefront of the market.

Regional Market Share AnalysisNorth America: Holding approximately 30% of the global market, North America's significant share is driven by its strong biotech sector and extensive research activities, particularly in the United States. The region's innovative approach to biopharmaceuticals and molecular biology research fuels a steady demand for biological buffers.
Asia Pacific: This region accounts for about 20% of the market. Growth is spurred by rapid advancements in healthcare infrastructure and increasing investments in biotechnology in countries like China, Japan, and India. The expanding pharmaceutical sector in Asia Pacific is poised to boost the demand for biological buffers.
Middle East & Africa: With around 5% of the market, the Middle East and Africa are gradually increasing their stake due to developments in healthcare sectors and rising educational standards in research fields. Investments in new medical facilities and universities are expected to propel market growth.
Latin America: Representing 8% of the market, Latin America's growth is supported by improving healthcare systems and a growing focus on research and development in biotechnology across countries like Brazil and Argentina.
Key Regions and Countries
- North America
- The US
- Canada
- Mexico
- Western Europe
- Germany
- France
- The UK
- Spain
- Italy
- Portugal
- Ireland
- Austria
- Switzerland
- Benelux
- Nordic
- Rest of Western Europe
- Eastern Europe
- Russia
- Poland
- The Czech Republic
- Greece
- Rest of Eastern Europe
- APAC
- China
- Japan
- South Korea
- India
- Australia & New Zealand
- Indonesia
- Malaysia
- Philippines
- Singapore
- Thailand
- Vietnam
- Rest of APAC
- Latin America
- Brazil
- Colombia
- Chile
- Argentina
- Costa Rica
- Rest of Latin America
- Middle East & Africa
- Algeria
- Egypt
- Israel
- Kuwait
- Nigeria
- Saudi Arabia
- South Africa
- Turkey
- United Arab Emirates
- Rest of MEA
Key Players Analysis
In the Biological Buffers Market, key players significantly influence industry standards and innovation. Merck KGaA and Thermo Fisher Scientific Inc. lead with comprehensive product lines and strong R&D investments, setting high industry benchmarks. Avantor, Inc. and Lonza Group AG leverage their extensive global networks to provide reliable buffer solutions for various applications.
Bio-Rad Laboratories, Inc. and GE Healthcare offer specialized products catering to the growing needs of biological research and clinical diagnostics. Corning Incorporated and Promega Corporation stand out for their innovative approaches in buffer formulation and application-specific solutions. MP Biomedicals, LLC and Becton, Dickinson and Company excel in providing high-quality buffers for laboratory and clinical use.
QIAGEN N.V. and Repligen Corporation focus on biopharmaceutical production, enhancing buffer efficiency and compatibility with bioprocessing systems. Roche Diagnostics and Takara Bio Inc. contribute significantly through advanced buffer technologies supporting molecular biology applications. Biological Industries emphasizes high-purity buffers, catering to cell culture and bioproduction needs. These companies collectively drive market growth through strategic positioning, innovative products, and strong market influence.
Market Key Players
- Merck KGaA
- Thermo Fisher Scientific Inc.
- Avantor, Inc.
- Lonza Group AG
- Bio-Rad Laboratories, Inc.
- GE Healthcare
- Corning Incorporated
- Promega Corporation
- MP Biomedicals, LLC
- Becton, Dickinson and Company
- QIAGEN N.V.
- Repligen Corporation
- Roche Diagnostics
- Takara Bio Inc.
- Biological Industries
Recent Developments
2024: BrainStorm Cell Therapeutics is preparing to commence a Phase IIIb trial for its stem cell therapy, NurOwn, aimed at treating ALS. This trial, aligned with FDA parameters, marks a critical step for the company after a challenging development journey.
2024: Boehringer Ingelheim has acquired Nerio Therapeutics for USD 1.3 billion to bolster its immuno-oncology pipeline. This strategic acquisition is expected to enhance Boehringer's capabilities in developing cancer treatments.
2024: GSK and Flagship Pioneering announced a partnership involving an upfront payment of USD 150 million for initial development in respiratory and immunology programs. The collaboration includes potential milestone payments up to USD 720 million for each of the 10 programs that GSK might option, highlighting a significant investment in innovative healthcare solutions.
Report Scope
Report Features Description Market Value (2023) USD 786.2 Billion Forecast Revenue (2033) USD 1,577.0 Billion CAGR (2024-2033) 7.4% Base Year for Estimation 2023 Historic Period 2018-2023 Forecast Period 2024-2033 Report Coverage Revenue Forecast, Market Dynamics, Competitive Landscape, Recent Developments Segments Covered By Type (Phosphate Buffers, Acetate Buffers, TRIS Buffers, Carbonate Buffers, Good’s Buffers, Others), By Form (Liquid, Powder), By Application (Research Laboratories, Clinical Laboratories, Pharmaceutical Industry, Biotechnology Industry, Academic Institutes), By End-User (Pharmaceutical Companies, Biotechnology Companies, Academic & Research Institutes, Clinical Laboratories) Regional Analysis North America - The US, Canada, & Mexico; Western Europe - Germany, France, The UK, Spain, Italy, Portugal, Ireland, Austria, Switzerland, Benelux, Nordic, & Rest of Western Europe; Eastern Europe - Russia, Poland, The Czech Republic, Greece, & Rest of Eastern Europe; APAC - China, Japan, South Korea, India, Australia & New Zealand, Indonesia, Malaysia, Philippines, Singapore, Thailand, Vietnam, & Rest of APAC; Latin America - Brazil, Colombia, Chile, Argentina, Costa Rica, & Rest of Latin America; Middle East & Africa - Algeria, Egypt, Israel, Kuwait, Nigeria, Saudi Arabia, South Africa, Turkey, United Arab Emirates, & Rest of MEA Competitive Landscape Merck KGaA, Thermo Fisher Scientific Inc., Avantor, Inc., Lonza Group AG, Bio-Rad Laboratories, Inc., GE Healthcare, Corning Incorporated, Promega Corporation, MP Biomedicals, LLC, Becton, Dickinson and Company, QIAGEN N.V., Repligen Corporation, Roche Diagnostics, Takara Bio Inc., Biological Industries Customization Scope Customization for segments, region/country-level will be provided. Moreover, additional customization can be done based on the requirements. Purchase Options We have three licenses to opt for: Single User License, Multi-User License (Up to 5 Users), Corporate Use License (Unlimited User and Printable PDF) -
- 1. Executive Summary
- 1.1. Definition
- 1.2. Taxonomy
- 1.3. Research Scope
- 1.4. Key Analysis
- 1.5. Key Findings by Major Segments
- 1.6. Top strategies by Major Players
- 2. Global Biological Buffers Market Overview
- 2.1. Biological Buffers Market Dynamics
- 2.1.1. Drivers
- 2.1.2. Opportunities
- 2.1.3. Restraints
- 2.1.4. Challenges
- 2.2. Macro-economic Factors
- 2.3. Regulatory Framework
- 2.4. Market Investment Feasibility Index
- 2.5. PEST Analysis
- 2.6. PORTER’S Five Force Analysis
- 2.7. Drivers & Restraints Impact Analysis
- 2.8. Industry Chain Analysis
- 2.9. Cost Structure Analysis
- 2.10. Marketing Strategy
- 2.11. Russia-Ukraine War Impact Analysis
- 2.12. Opportunity Map Analysis
- 2.13. Market Competition Scenario Analysis
- 2.14. Product Life Cycle Analysis
- 2.15. Opportunity Orbits
- 2.16. Manufacturer Intensity Map
- 2.17. Major Companies sales by Value & Volume
- 2.1. Biological Buffers Market Dynamics
- 3. Global Biological Buffers Market Analysis, Opportunity and Forecast, 2016-2032
- 3.1. Global Biological Buffers Market Analysis, 2016-2021
- 3.2. Global Biological Buffers Market Opportunity and Forecast, 2023-2032
- 3.3. Global Biological Buffers Market Analysis, Opportunity and Forecast, By By Type, 2016-2032
- 3.3.1. Global Biological Buffers Market Analysis by By Type: Introduction
- 3.3.2. Market Size Absolute $ Opportunity Analysis and Forecast, By By Type, 2016-2032
- 3.3.3. Phosphate Type
- 3.3.4. Acetate Type
- 3.3.5. TRIS Type
- 3.3.6. Other Types
- 3.4. Global Biological Buffers Market Analysis, Opportunity and Forecast, By By End-User, 2016-2032
- 3.4.1. Global Biological Buffers Market Analysis by By End-User: Introduction
- 3.4.2. Market Size Absolute $ Opportunity Analysis and Forecast, By By End-User, 2016-2032
- 3.4.3. Research Institution
- 3.4.4. Pharmaceutical Industry
- 3.4.5. Other End-Users
- 4. North America Biological Buffers Market Analysis, Opportunity and Forecast, 2016-2032
- 4.1. North America Biological Buffers Market Analysis, 2016-2021
- 4.2. North America Biological Buffers Market Opportunity and Forecast, 2023-2032
- 4.3. North America Biological Buffers Market Analysis, Opportunity and Forecast, By By Type, 2016-2032
- 4.3.1. North America Biological Buffers Market Analysis by By Type: Introduction
- 4.3.2. Market Size Absolute $ Opportunity Analysis and Forecast, By By Type, 2016-2032
- 4.3.3. Phosphate Type
- 4.3.4. Acetate Type
- 4.3.5. TRIS Type
- 4.3.6. Other Types
- 4.4. North America Biological Buffers Market Analysis, Opportunity and Forecast, By By End-User, 2016-2032
- 4.4.1. North America Biological Buffers Market Analysis by By End-User: Introduction
- 4.4.2. Market Size Absolute $ Opportunity Analysis and Forecast, By By End-User, 2016-2032
- 4.4.3. Research Institution
- 4.4.4. Pharmaceutical Industry
- 4.4.5. Other End-Users
- 4.5. North America Biological Buffers Market Analysis, Opportunity and Forecast, By Country , 2016-2032
- 4.5.1. North America Biological Buffers Market Analysis by Country : Introduction
- 4.5.2. Market Size Absolute $ Opportunity Analysis and Forecast, Country , 2016-2032
- 4.5.2.1. The US
- 4.5.2.2. Canada
- 4.5.2.3. Mexico
- 5. Western Europe Biological Buffers Market Analysis, Opportunity and Forecast, 2016-2032
- 5.1. Western Europe Biological Buffers Market Analysis, 2016-2021
- 5.2. Western Europe Biological Buffers Market Opportunity and Forecast, 2023-2032
- 5.3. Western Europe Biological Buffers Market Analysis, Opportunity and Forecast, By By Type, 2016-2032
- 5.3.1. Western Europe Biological Buffers Market Analysis by By Type: Introduction
- 5.3.2. Market Size Absolute $ Opportunity Analysis and Forecast, By By Type, 2016-2032
- 5.3.3. Phosphate Type
- 5.3.4. Acetate Type
- 5.3.5. TRIS Type
- 5.3.6. Other Types
- 5.4. Western Europe Biological Buffers Market Analysis, Opportunity and Forecast, By By End-User, 2016-2032
- 5.4.1. Western Europe Biological Buffers Market Analysis by By End-User: Introduction
- 5.4.2. Market Size Absolute $ Opportunity Analysis and Forecast, By By End-User, 2016-2032
- 5.4.3. Research Institution
- 5.4.4. Pharmaceutical Industry
- 5.4.5. Other End-Users
- 5.5. Western Europe Biological Buffers Market Analysis, Opportunity and Forecast, By Country , 2016-2032
- 5.5.1. Western Europe Biological Buffers Market Analysis by Country : Introduction
- 5.5.2. Market Size Absolute $ Opportunity Analysis and Forecast, Country , 2016-2032
- 5.5.2.1. Germany
- 5.5.2.2. France
- 5.5.2.3. The UK
- 5.5.2.4. Spain
- 5.5.2.5. Italy
- 5.5.2.6. Portugal
- 5.5.2.7. Ireland
- 5.5.2.8. Austria
- 5.5.2.9. Switzerland
- 5.5.2.10. Benelux
- 5.5.2.11. Nordic
- 5.5.2.12. Rest of Western Europe
- 6. Eastern Europe Biological Buffers Market Analysis, Opportunity and Forecast, 2016-2032
- 6.1. Eastern Europe Biological Buffers Market Analysis, 2016-2021
- 6.2. Eastern Europe Biological Buffers Market Opportunity and Forecast, 2023-2032
- 6.3. Eastern Europe Biological Buffers Market Analysis, Opportunity and Forecast, By By Type, 2016-2032
- 6.3.1. Eastern Europe Biological Buffers Market Analysis by By Type: Introduction
- 6.3.2. Market Size Absolute $ Opportunity Analysis and Forecast, By By Type, 2016-2032
- 6.3.3. Phosphate Type
- 6.3.4. Acetate Type
- 6.3.5. TRIS Type
- 6.3.6. Other Types
- 6.4. Eastern Europe Biological Buffers Market Analysis, Opportunity and Forecast, By By End-User, 2016-2032
- 6.4.1. Eastern Europe Biological Buffers Market Analysis by By End-User: Introduction
- 6.4.2. Market Size Absolute $ Opportunity Analysis and Forecast, By By End-User, 2016-2032
- 6.4.3. Research Institution
- 6.4.4. Pharmaceutical Industry
- 6.4.5. Other End-Users
- 6.5. Eastern Europe Biological Buffers Market Analysis, Opportunity and Forecast, By Country , 2016-2032
- 6.5.1. Eastern Europe Biological Buffers Market Analysis by Country : Introduction
- 6.5.2. Market Size Absolute $ Opportunity Analysis and Forecast, Country , 2016-2032
- 6.5.2.1. Russia
- 6.5.2.2. Poland
- 6.5.2.3. The Czech Republic
- 6.5.2.4. Greece
- 6.5.2.5. Rest of Eastern Europe
- 7. APAC Biological Buffers Market Analysis, Opportunity and Forecast, 2016-2032
- 7.1. APAC Biological Buffers Market Analysis, 2016-2021
- 7.2. APAC Biological Buffers Market Opportunity and Forecast, 2023-2032
- 7.3. APAC Biological Buffers Market Analysis, Opportunity and Forecast, By By Type, 2016-2032
- 7.3.1. APAC Biological Buffers Market Analysis by By Type: Introduction
- 7.3.2. Market Size Absolute $ Opportunity Analysis and Forecast, By By Type, 2016-2032
- 7.3.3. Phosphate Type
- 7.3.4. Acetate Type
- 7.3.5. TRIS Type
- 7.3.6. Other Types
- 7.4. APAC Biological Buffers Market Analysis, Opportunity and Forecast, By By End-User, 2016-2032
- 7.4.1. APAC Biological Buffers Market Analysis by By End-User: Introduction
- 7.4.2. Market Size Absolute $ Opportunity Analysis and Forecast, By By End-User, 2016-2032
- 7.4.3. Research Institution
- 7.4.4. Pharmaceutical Industry
- 7.4.5. Other End-Users
- 7.5. APAC Biological Buffers Market Analysis, Opportunity and Forecast, By Country , 2016-2032
- 7.5.1. APAC Biological Buffers Market Analysis by Country : Introduction
- 7.5.2. Market Size Absolute $ Opportunity Analysis and Forecast, Country , 2016-2032
- 7.5.2.1. China
- 7.5.2.2. Japan
- 7.5.2.3. South Korea
- 7.5.2.4. India
- 7.5.2.5. Australia & New Zeland
- 7.5.2.6. Indonesia
- 7.5.2.7. Malaysia
- 7.5.2.8. Philippines
- 7.5.2.9. Singapore
- 7.5.2.10. Thailand
- 7.5.2.11. Vietnam
- 7.5.2.12. Rest of APAC
- 8. Latin America Biological Buffers Market Analysis, Opportunity and Forecast, 2016-2032
- 8.1. Latin America Biological Buffers Market Analysis, 2016-2021
- 8.2. Latin America Biological Buffers Market Opportunity and Forecast, 2023-2032
- 8.3. Latin America Biological Buffers Market Analysis, Opportunity and Forecast, By By Type, 2016-2032
- 8.3.1. Latin America Biological Buffers Market Analysis by By Type: Introduction
- 8.3.2. Market Size Absolute $ Opportunity Analysis and Forecast, By By Type, 2016-2032
- 8.3.3. Phosphate Type
- 8.3.4. Acetate Type
- 8.3.5. TRIS Type
- 8.3.6. Other Types
- 8.4. Latin America Biological Buffers Market Analysis, Opportunity and Forecast, By By End-User, 2016-2032
- 8.4.1. Latin America Biological Buffers Market Analysis by By End-User: Introduction
- 8.4.2. Market Size Absolute $ Opportunity Analysis and Forecast, By By End-User, 2016-2032
- 8.4.3. Research Institution
- 8.4.4. Pharmaceutical Industry
- 8.4.5. Other End-Users
- 8.5. Latin America Biological Buffers Market Analysis, Opportunity and Forecast, By Country , 2016-2032
- 8.5.1. Latin America Biological Buffers Market Analysis by Country : Introduction
- 8.5.2. Market Size Absolute $ Opportunity Analysis and Forecast, Country , 2016-2032
- 8.5.2.1. Brazil
- 8.5.2.2. Colombia
- 8.5.2.3. Chile
- 8.5.2.4. Argentina
- 8.5.2.5. Costa Rica
- 8.5.2.6. Rest of Latin America
- 9. Middle East & Africa Biological Buffers Market Analysis, Opportunity and Forecast, 2016-2032
- 9.1. Middle East & Africa Biological Buffers Market Analysis, 2016-2021
- 9.2. Middle East & Africa Biological Buffers Market Opportunity and Forecast, 2023-2032
- 9.3. Middle East & Africa Biological Buffers Market Analysis, Opportunity and Forecast, By By Type, 2016-2032
- 9.3.1. Middle East & Africa Biological Buffers Market Analysis by By Type: Introduction
- 9.3.2. Market Size Absolute $ Opportunity Analysis and Forecast, By By Type, 2016-2032
- 9.3.3. Phosphate Type
- 9.3.4. Acetate Type
- 9.3.5. TRIS Type
- 9.3.6. Other Types
- 9.4. Middle East & Africa Biological Buffers Market Analysis, Opportunity and Forecast, By By End-User, 2016-2032
- 9.4.1. Middle East & Africa Biological Buffers Market Analysis by By End-User: Introduction
- 9.4.2. Market Size Absolute $ Opportunity Analysis and Forecast, By By End-User, 2016-2032
- 9.4.3. Research Institution
- 9.4.4. Pharmaceutical Industry
- 9.4.5. Other End-Users
- 9.5. Middle East & Africa Biological Buffers Market Analysis, Opportunity and Forecast, By Country , 2016-2032
- 9.5.1. Middle East & Africa Biological Buffers Market Analysis by Country : Introduction
- 9.5.2. Market Size Absolute $ Opportunity Analysis and Forecast, Country , 2016-2032
- 9.5.2.1. Algeria
- 9.5.2.2. Egypt
- 9.5.2.3. Israel
- 9.5.2.4. Kuwait
- 9.5.2.5. Nigeria
- 9.5.2.6. Saudi Arabia
- 9.5.2.7. South Africa
- 9.5.2.8. Turkey
- 9.5.2.9. The UAE
- 9.5.2.10. Rest of MEA
- 10. Global Biological Buffers Market Analysis, Opportunity and Forecast, By Region , 2016-2032
- 10.1. Global Biological Buffers Market Analysis by Region : Introduction
- 10.2. Market Size Absolute $ Opportunity Analysis and Forecast, By Region , 2016-2032
- 10.2.1. North America
- 10.2.2. Western Europe
- 10.2.3. Eastern Europe
- 10.2.4. APAC
- 10.2.5. Latin America
- 10.2.6. Middle East & Africa
- 11. Global Biological Buffers Market Competitive Landscape, Market Share Analysis, and Company Profiles
- 11.1. Market Share Analysis
- 11.2. Company Profiles
- 11.3. Merck KGaA
- 11.3.1. Company Overview
- 11.3.2. Financial Highlights
- 11.3.3. Product Portfolio
- 11.3.4. SWOT Analysis
- 11.3.5. Key Strategies and Developments
- 11.4. Thermo Fisher Scientific Inc
- 11.4.1. Company Overview
- 11.4.2. Financial Highlights
- 11.4.3. Product Portfolio
- 11.4.4. SWOT Analysis
- 11.4.5. Key Strategies and Developments
- 11.5. Avantor
- 11.5.1. Company Overview
- 11.5.2. Financial Highlights
- 11.5.3. Product Portfolio
- 11.5.4. SWOT Analysis
- 11.5.5. Key Strategies and Developments
- 11.6. GE Healthcare
- 11.6.1. Company Overview
- 11.6.2. Financial Highlights
- 11.6.3. Product Portfolio
- 11.6.4. SWOT Analysis
- 11.6.5. Key Strategies and Developments
- 11.7. Santa Cruz Biotechnology, Inc.
- 11.7.1. Company Overview
- 11.7.2. Financial Highlights
- 11.7.3. Product Portfolio
- 11.7.4. SWOT Analysis
- 11.7.5. Key Strategies and Developments
- 11.8. Lonza Group Ltd.
- 11.8.1. Company Overview
- 11.8.2. Financial Highlights
- 11.8.3. Product Portfolio
- 11.8.4. SWOT Analysis
- 11.8.5. Key Strategies and Developments
- 11.9. Bio-Rad Laboratories, Inc
- 11.9.1. Company Overview
- 11.9.2. Financial Highlights
- 11.9.3. Product Portfolio
- 11.9.4. SWOT Analysis
- 11.9.5. Key Strategies and Developments
- 11.10. F. Hoffmann-La Roche Ltd.
- 11.10.1. Company Overview
- 11.10.2. Financial Highlights
- 11.10.3. Product Portfolio
- 11.10.4. SWOT Analysis
- 11.10.5. Key Strategies and Developments
- 11.11. Hamilton Company
- 11.11.1. Company Overview
- 11.11.2. Financial Highlights
- 11.11.3. Product Portfolio
- 11.11.4. SWOT Analysis
- 11.11.5. Key Strategies and Developments
- 11.12. BASF SE
- 11.12.1. Company Overview
- 11.12.2. Financial Highlights
- 11.12.3. Product Portfolio
- 11.12.4. SWOT Analysis
- 11.12.5. Key Strategies and Developments
- 12. Assumptions and Acronyms
- 13. Research Methodology
- 14. Contact
List of Figures
-
- Figure 1: Global Biological Buffers Market Revenue (US$ Mn) Market Share by By Type in 2022
- Figure 2: Global Biological Buffers Market Attractiveness Analysis by By Type, 2016-2032
- Figure 3: Global Biological Buffers Market Revenue (US$ Mn) Market Share by By End-Userin 2022
- Figure 4: Global Biological Buffers Market Attractiveness Analysis by By End-User, 2016-2032
- Figure 5: Global Biological Buffers Market Revenue (US$ Mn) Market Share by Region in 2022
- Figure 6: Global Biological Buffers Market Attractiveness Analysis by Region, 2016-2032
- Figure 7: Global Biological Buffers Market Revenue (US$ Mn) (2016-2032)
- Figure 8: Global Biological Buffers Market Revenue (US$ Mn) Comparison by Region (2016-2032)
- Figure 9: Global Biological Buffers Market Revenue (US$ Mn) Comparison by By Type (2016-2032)
- Figure 10: Global Biological Buffers Market Revenue (US$ Mn) Comparison by By End-User (2016-2032)
- Figure 11: Global Biological Buffers Market Y-o-Y Growth Rate Comparison by Region (2016-2032)
- Figure 12: Global Biological Buffers Market Y-o-Y Growth Rate Comparison by By Type (2016-2032)
- Figure 13: Global Biological Buffers Market Y-o-Y Growth Rate Comparison by By End-User (2016-2032)
- Figure 14: Global Biological Buffers Market Share Comparison by Region (2016-2032)
- Figure 15: Global Biological Buffers Market Share Comparison by By Type (2016-2032)
- Figure 16: Global Biological Buffers Market Share Comparison by By End-User (2016-2032)
- Figure 17: North America Biological Buffers Market Revenue (US$ Mn) Market Share by By Typein 2022
- Figure 18: North America Biological Buffers Market Attractiveness Analysis by By Type, 2016-2032
- Figure 19: North America Biological Buffers Market Revenue (US$ Mn) Market Share by By End-Userin 2022
- Figure 20: North America Biological Buffers Market Attractiveness Analysis by By End-User, 2016-2032
- Figure 21: North America Biological Buffers Market Revenue (US$ Mn) Market Share by Country in 2022
- Figure 22: North America Biological Buffers Market Attractiveness Analysis by Country, 2016-2032
- Figure 23: North America Biological Buffers Market Revenue (US$ Mn) (2016-2032)
- Figure 24: North America Biological Buffers Market Revenue (US$ Mn) Comparison by Country (2016-2032)
- Figure 25: North America Biological Buffers Market Revenue (US$ Mn) Comparison by By Type (2016-2032)
- Figure 26: North America Biological Buffers Market Revenue (US$ Mn) Comparison by By End-User (2016-2032)
- Figure 27: North America Biological Buffers Market Y-o-Y Growth Rate Comparison by Country (2016-2032)
- Figure 28: North America Biological Buffers Market Y-o-Y Growth Rate Comparison by By Type (2016-2032)
- Figure 29: North America Biological Buffers Market Y-o-Y Growth Rate Comparison by By End-User (2016-2032)
- Figure 30: North America Biological Buffers Market Share Comparison by Country (2016-2032)
- Figure 31: North America Biological Buffers Market Share Comparison by By Type (2016-2032)
- Figure 32: North America Biological Buffers Market Share Comparison by By End-User (2016-2032)
- Figure 33: Western Europe Biological Buffers Market Revenue (US$ Mn) Market Share by By Typein 2022
- Figure 34: Western Europe Biological Buffers Market Attractiveness Analysis by By Type, 2016-2032
- Figure 35: Western Europe Biological Buffers Market Revenue (US$ Mn) Market Share by By End-Userin 2022
- Figure 36: Western Europe Biological Buffers Market Attractiveness Analysis by By End-User, 2016-2032
- Figure 37: Western Europe Biological Buffers Market Revenue (US$ Mn) Market Share by Country in 2022
- Figure 38: Western Europe Biological Buffers Market Attractiveness Analysis by Country, 2016-2032
- Figure 39: Western Europe Biological Buffers Market Revenue (US$ Mn) (2016-2032)
- Figure 40: Western Europe Biological Buffers Market Revenue (US$ Mn) Comparison by Country (2016-2032)
- Figure 41: Western Europe Biological Buffers Market Revenue (US$ Mn) Comparison by By Type (2016-2032)
- Figure 42: Western Europe Biological Buffers Market Revenue (US$ Mn) Comparison by By End-User (2016-2032)
- Figure 43: Western Europe Biological Buffers Market Y-o-Y Growth Rate Comparison by Country (2016-2032)
- Figure 44: Western Europe Biological Buffers Market Y-o-Y Growth Rate Comparison by By Type (2016-2032)
- Figure 45: Western Europe Biological Buffers Market Y-o-Y Growth Rate Comparison by By End-User (2016-2032)
- Figure 46: Western Europe Biological Buffers Market Share Comparison by Country (2016-2032)
- Figure 47: Western Europe Biological Buffers Market Share Comparison by By Type (2016-2032)
- Figure 48: Western Europe Biological Buffers Market Share Comparison by By End-User (2016-2032)
- Figure 49: Eastern Europe Biological Buffers Market Revenue (US$ Mn) Market Share by By Typein 2022
- Figure 50: Eastern Europe Biological Buffers Market Attractiveness Analysis by By Type, 2016-2032
- Figure 51: Eastern Europe Biological Buffers Market Revenue (US$ Mn) Market Share by By End-Userin 2022
- Figure 52: Eastern Europe Biological Buffers Market Attractiveness Analysis by By End-User, 2016-2032
- Figure 53: Eastern Europe Biological Buffers Market Revenue (US$ Mn) Market Share by Country in 2022
- Figure 54: Eastern Europe Biological Buffers Market Attractiveness Analysis by Country, 2016-2032
- Figure 55: Eastern Europe Biological Buffers Market Revenue (US$ Mn) (2016-2032)
- Figure 56: Eastern Europe Biological Buffers Market Revenue (US$ Mn) Comparison by Country (2016-2032)
- Figure 57: Eastern Europe Biological Buffers Market Revenue (US$ Mn) Comparison by By Type (2016-2032)
- Figure 58: Eastern Europe Biological Buffers Market Revenue (US$ Mn) Comparison by By End-User (2016-2032)
- Figure 59: Eastern Europe Biological Buffers Market Y-o-Y Growth Rate Comparison by Country (2016-2032)
- Figure 60: Eastern Europe Biological Buffers Market Y-o-Y Growth Rate Comparison by By Type (2016-2032)
- Figure 61: Eastern Europe Biological Buffers Market Y-o-Y Growth Rate Comparison by By End-User (2016-2032)
- Figure 62: Eastern Europe Biological Buffers Market Share Comparison by Country (2016-2032)
- Figure 63: Eastern Europe Biological Buffers Market Share Comparison by By Type (2016-2032)
- Figure 64: Eastern Europe Biological Buffers Market Share Comparison by By End-User (2016-2032)
- Figure 65: APAC Biological Buffers Market Revenue (US$ Mn) Market Share by By Typein 2022
- Figure 66: APAC Biological Buffers Market Attractiveness Analysis by By Type, 2016-2032
- Figure 67: APAC Biological Buffers Market Revenue (US$ Mn) Market Share by By End-Userin 2022
- Figure 68: APAC Biological Buffers Market Attractiveness Analysis by By End-User, 2016-2032
- Figure 69: APAC Biological Buffers Market Revenue (US$ Mn) Market Share by Country in 2022
- Figure 70: APAC Biological Buffers Market Attractiveness Analysis by Country, 2016-2032
- Figure 71: APAC Biological Buffers Market Revenue (US$ Mn) (2016-2032)
- Figure 72: APAC Biological Buffers Market Revenue (US$ Mn) Comparison by Country (2016-2032)
- Figure 73: APAC Biological Buffers Market Revenue (US$ Mn) Comparison by By Type (2016-2032)
- Figure 74: APAC Biological Buffers Market Revenue (US$ Mn) Comparison by By End-User (2016-2032)
- Figure 75: APAC Biological Buffers Market Y-o-Y Growth Rate Comparison by Country (2016-2032)
- Figure 76: APAC Biological Buffers Market Y-o-Y Growth Rate Comparison by By Type (2016-2032)
- Figure 77: APAC Biological Buffers Market Y-o-Y Growth Rate Comparison by By End-User (2016-2032)
- Figure 78: APAC Biological Buffers Market Share Comparison by Country (2016-2032)
- Figure 79: APAC Biological Buffers Market Share Comparison by By Type (2016-2032)
- Figure 80: APAC Biological Buffers Market Share Comparison by By End-User (2016-2032)
- Figure 81: Latin America Biological Buffers Market Revenue (US$ Mn) Market Share by By Typein 2022
- Figure 82: Latin America Biological Buffers Market Attractiveness Analysis by By Type, 2016-2032
- Figure 83: Latin America Biological Buffers Market Revenue (US$ Mn) Market Share by By End-Userin 2022
- Figure 84: Latin America Biological Buffers Market Attractiveness Analysis by By End-User, 2016-2032
- Figure 85: Latin America Biological Buffers Market Revenue (US$ Mn) Market Share by Country in 2022
- Figure 86: Latin America Biological Buffers Market Attractiveness Analysis by Country, 2016-2032
- Figure 87: Latin America Biological Buffers Market Revenue (US$ Mn) (2016-2032)
- Figure 88: Latin America Biological Buffers Market Revenue (US$ Mn) Comparison by Country (2016-2032)
- Figure 89: Latin America Biological Buffers Market Revenue (US$ Mn) Comparison by By Type (2016-2032)
- Figure 90: Latin America Biological Buffers Market Revenue (US$ Mn) Comparison by By End-User (2016-2032)
- Figure 91: Latin America Biological Buffers Market Y-o-Y Growth Rate Comparison by Country (2016-2032)
- Figure 92: Latin America Biological Buffers Market Y-o-Y Growth Rate Comparison by By Type (2016-2032)
- Figure 93: Latin America Biological Buffers Market Y-o-Y Growth Rate Comparison by By End-User (2016-2032)
- Figure 94: Latin America Biological Buffers Market Share Comparison by Country (2016-2032)
- Figure 95: Latin America Biological Buffers Market Share Comparison by By Type (2016-2032)
- Figure 96: Latin America Biological Buffers Market Share Comparison by By End-User (2016-2032)
- Figure 97: Middle East & Africa Biological Buffers Market Revenue (US$ Mn) Market Share by By Typein 2022
- Figure 98: Middle East & Africa Biological Buffers Market Attractiveness Analysis by By Type, 2016-2032
- Figure 99: Middle East & Africa Biological Buffers Market Revenue (US$ Mn) Market Share by By End-Userin 2022
- Figure 100: Middle East & Africa Biological Buffers Market Attractiveness Analysis by By End-User, 2016-2032
- Figure 101: Middle East & Africa Biological Buffers Market Revenue (US$ Mn) Market Share by Country in 2022
- Figure 102: Middle East & Africa Biological Buffers Market Attractiveness Analysis by Country, 2016-2032
- Figure 103: Middle East & Africa Biological Buffers Market Revenue (US$ Mn) (2016-2032)
- Figure 104: Middle East & Africa Biological Buffers Market Revenue (US$ Mn) Comparison by Country (2016-2032)
- Figure 105: Middle East & Africa Biological Buffers Market Revenue (US$ Mn) Comparison by By Type (2016-2032)
- Figure 106: Middle East & Africa Biological Buffers Market Revenue (US$ Mn) Comparison by By End-User (2016-2032)
- Figure 107: Middle East & Africa Biological Buffers Market Y-o-Y Growth Rate Comparison by Country (2016-2032)
- Figure 108: Middle East & Africa Biological Buffers Market Y-o-Y Growth Rate Comparison by By Type (2016-2032)
- Figure 109: Middle East & Africa Biological Buffers Market Y-o-Y Growth Rate Comparison by By End-User (2016-2032)
- Figure 110: Middle East & Africa Biological Buffers Market Share Comparison by Country (2016-2032)
- Figure 111: Middle East & Africa Biological Buffers Market Share Comparison by By Type (2016-2032)
- Figure 112: Middle East & Africa Biological Buffers Market Share Comparison by By End-User (2016-2032)
List of Tables
- Table 1: Global Biological Buffers Market Comparison by By Type (2016-2032)
- Table 2: Global Biological Buffers Market Comparison by By End-User (2016-2032)
- Table 3: Global Biological Buffers Market Revenue (US$ Mn) Comparison by Region (2016-2032)
- Table 4: Global Biological Buffers Market Revenue (US$ Mn) (2016-2032)
- Table 5: Global Biological Buffers Market Revenue (US$ Mn) Comparison by Region (2016-2032)
- Table 6: Global Biological Buffers Market Revenue (US$ Mn) Comparison by By Type (2016-2032)
- Table 7: Global Biological Buffers Market Revenue (US$ Mn) Comparison by By End-User (2016-2032)
- Table 8: Global Biological Buffers Market Y-o-Y Growth Rate Comparison by Region (2016-2032)
- Table 9: Global Biological Buffers Market Y-o-Y Growth Rate Comparison by By Type (2016-2032)
- Table 10: Global Biological Buffers Market Y-o-Y Growth Rate Comparison by By End-User (2016-2032)
- Table 11: Global Biological Buffers Market Share Comparison by Region (2016-2032)
- Table 12: Global Biological Buffers Market Share Comparison by By Type (2016-2032)
- Table 13: Global Biological Buffers Market Share Comparison by By End-User (2016-2032)
- Table 14: North America Biological Buffers Market Comparison by By End-User (2016-2032)
- Table 15: North America Biological Buffers Market Revenue (US$ Mn) Comparison by Country (2016-2032)
- Table 16: North America Biological Buffers Market Revenue (US$ Mn) (2016-2032)
- Table 17: North America Biological Buffers Market Revenue (US$ Mn) Comparison by Country (2016-2032)
- Table 18: North America Biological Buffers Market Revenue (US$ Mn) Comparison by By Type (2016-2032)
- Table 19: North America Biological Buffers Market Revenue (US$ Mn) Comparison by By End-User (2016-2032)
- Table 20: North America Biological Buffers Market Y-o-Y Growth Rate Comparison by Country (2016-2032)
- Table 21: North America Biological Buffers Market Y-o-Y Growth Rate Comparison by By Type (2016-2032)
- Table 22: North America Biological Buffers Market Y-o-Y Growth Rate Comparison by By End-User (2016-2032)
- Table 23: North America Biological Buffers Market Share Comparison by Country (2016-2032)
- Table 24: North America Biological Buffers Market Share Comparison by By Type (2016-2032)
- Table 25: North America Biological Buffers Market Share Comparison by By End-User (2016-2032)
- Table 26: Western Europe Biological Buffers Market Comparison by By Type (2016-2032)
- Table 27: Western Europe Biological Buffers Market Comparison by By End-User (2016-2032)
- Table 28: Western Europe Biological Buffers Market Revenue (US$ Mn) Comparison by Country (2016-2032)
- Table 29: Western Europe Biological Buffers Market Revenue (US$ Mn) (2016-2032)
- Table 30: Western Europe Biological Buffers Market Revenue (US$ Mn) Comparison by Country (2016-2032)
- Table 31: Western Europe Biological Buffers Market Revenue (US$ Mn) Comparison by By Type (2016-2032)
- Table 32: Western Europe Biological Buffers Market Revenue (US$ Mn) Comparison by By End-User (2016-2032)
- Table 33: Western Europe Biological Buffers Market Y-o-Y Growth Rate Comparison by Country (2016-2032)
- Table 34: Western Europe Biological Buffers Market Y-o-Y Growth Rate Comparison by By Type (2016-2032)
- Table 35: Western Europe Biological Buffers Market Y-o-Y Growth Rate Comparison by By End-User (2016-2032)
- Table 36: Western Europe Biological Buffers Market Share Comparison by Country (2016-2032)
- Table 37: Western Europe Biological Buffers Market Share Comparison by By Type (2016-2032)
- Table 38: Western Europe Biological Buffers Market Share Comparison by By End-User (2016-2032)
- Table 39: Eastern Europe Biological Buffers Market Comparison by By Type (2016-2032)
- Table 40: Eastern Europe Biological Buffers Market Comparison by By End-User (2016-2032)
- Table 41: Eastern Europe Biological Buffers Market Revenue (US$ Mn) Comparison by Country (2016-2032)
- Table 42: Eastern Europe Biological Buffers Market Revenue (US$ Mn) (2016-2032)
- Table 43: Eastern Europe Biological Buffers Market Revenue (US$ Mn) Comparison by Country (2016-2032)
- Table 44: Eastern Europe Biological Buffers Market Revenue (US$ Mn) Comparison by By Type (2016-2032)
- Table 45: Eastern Europe Biological Buffers Market Revenue (US$ Mn) Comparison by By End-User (2016-2032)
- Table 46: Eastern Europe Biological Buffers Market Y-o-Y Growth Rate Comparison by Country (2016-2032)
- Table 47: Eastern Europe Biological Buffers Market Y-o-Y Growth Rate Comparison by By Type (2016-2032)
- Table 48: Eastern Europe Biological Buffers Market Y-o-Y Growth Rate Comparison by By End-User (2016-2032)
- Table 49: Eastern Europe Biological Buffers Market Share Comparison by Country (2016-2032)
- Table 50: Eastern Europe Biological Buffers Market Share Comparison by By Type (2016-2032)
- Table 51: Eastern Europe Biological Buffers Market Share Comparison by By End-User (2016-2032)
- Table 52: APAC Biological Buffers Market Comparison by By Type (2016-2032)
- Table 53: APAC Biological Buffers Market Comparison by By End-User (2016-2032)
- Table 54: APAC Biological Buffers Market Revenue (US$ Mn) Comparison by Country (2016-2032)
- Table 55: APAC Biological Buffers Market Revenue (US$ Mn) (2016-2032)
- Table 56: APAC Biological Buffers Market Revenue (US$ Mn) Comparison by Country (2016-2032)
- Table 57: APAC Biological Buffers Market Revenue (US$ Mn) Comparison by By Type (2016-2032)
- Table 58: APAC Biological Buffers Market Revenue (US$ Mn) Comparison by By End-User (2016-2032)
- Table 59: APAC Biological Buffers Market Y-o-Y Growth Rate Comparison by Country (2016-2032)
- Table 60: APAC Biological Buffers Market Y-o-Y Growth Rate Comparison by By Type (2016-2032)
- Table 61: APAC Biological Buffers Market Y-o-Y Growth Rate Comparison by By End-User (2016-2032)
- Table 62: APAC Biological Buffers Market Share Comparison by Country (2016-2032)
- Table 63: APAC Biological Buffers Market Share Comparison by By Type (2016-2032)
- Table 64: APAC Biological Buffers Market Share Comparison by By End-User (2016-2032)
- Table 65: Latin America Biological Buffers Market Comparison by By Type (2016-2032)
- Table 66: Latin America Biological Buffers Market Comparison by By End-User (2016-2032)
- Table 67: Latin America Biological Buffers Market Revenue (US$ Mn) Comparison by Country (2016-2032)
- Table 68: Latin America Biological Buffers Market Revenue (US$ Mn) (2016-2032)
- Table 69: Latin America Biological Buffers Market Revenue (US$ Mn) Comparison by Country (2016-2032)
- Table 70: Latin America Biological Buffers Market Revenue (US$ Mn) Comparison by By Type (2016-2032)
- Table 71: Latin America Biological Buffers Market Revenue (US$ Mn) Comparison by By End-User (2016-2032)
- Table 72: Latin America Biological Buffers Market Y-o-Y Growth Rate Comparison by Country (2016-2032)
- Table 73: Latin America Biological Buffers Market Y-o-Y Growth Rate Comparison by By Type (2016-2032)
- Table 74: Latin America Biological Buffers Market Y-o-Y Growth Rate Comparison by By End-User (2016-2032)
- Table 75: Latin America Biological Buffers Market Share Comparison by Country (2016-2032)
- Table 76: Latin America Biological Buffers Market Share Comparison by By Type (2016-2032)
- Table 77: Latin America Biological Buffers Market Share Comparison by By End-User (2016-2032)
- Table 78: Middle East & Africa Biological Buffers Market Comparison by By Type (2016-2032)
- Table 79: Middle East & Africa Biological Buffers Market Comparison by By End-User (2016-2032)
- Table 80: Middle East & Africa Biological Buffers Market Revenue (US$ Mn) Comparison by Country (2016-2032)
- Table 81: Middle East & Africa Biological Buffers Market Revenue (US$ Mn) (2016-2032)
- Table 82: Middle East & Africa Biological Buffers Market Revenue (US$ Mn) Comparison by Country (2016-2032)
- Table 83: Middle East & Africa Biological Buffers Market Revenue (US$ Mn) Comparison by By Type (2016-2032)
- Table 84: Middle East & Africa Biological Buffers Market Revenue (US$ Mn) Comparison by By End-User (2016-2032)
- Table 85: Middle East & Africa Biological Buffers Market Y-o-Y Growth Rate Comparison by Country (2016-2032)
- Table 86: Middle East & Africa Biological Buffers Market Y-o-Y Growth Rate Comparison by By Type (2016-2032)
- Table 87: Middle East & Africa Biological Buffers Market Y-o-Y Growth Rate Comparison by By End-User (2016-2032)
- Table 88: Middle East & Africa Biological Buffers Market Share Comparison by Country (2016-2032)
- Table 89: Middle East & Africa Biological Buffers Market Share Comparison by By Type (2016-2032)
- Table 90: Middle East & Africa Biological Buffers Market Share Comparison by By End-User (2016-2032)
- 1. Executive Summary
-
- Merck KGaA
- Thermo Fisher Scientific Inc.
- Avantor, Inc.
- Lonza Group AG
- Bio-Rad Laboratories, Inc.
- GE Healthcare
- Corning Incorporated
- Promega Corporation
- MP Biomedicals, LLC
- Becton, Dickinson and Company
- QIAGEN N.V.
- Repligen Corporation
- Roche Diagnostics
- Takara Bio Inc.
- Biological Industries
Our Clients


View Our Licence Options
