Global Biological Buffers Market By Type (Phosphate Type, Acetate Type, Other), By End-User (Research Institution, Pharmaceutical Industry, Other), By Region And Companies - Industry Segment Outlook, Market Assessment, Competition Scenario, Trends, And Forecast 2023-2032
38028
June 2023
152
Report Overview
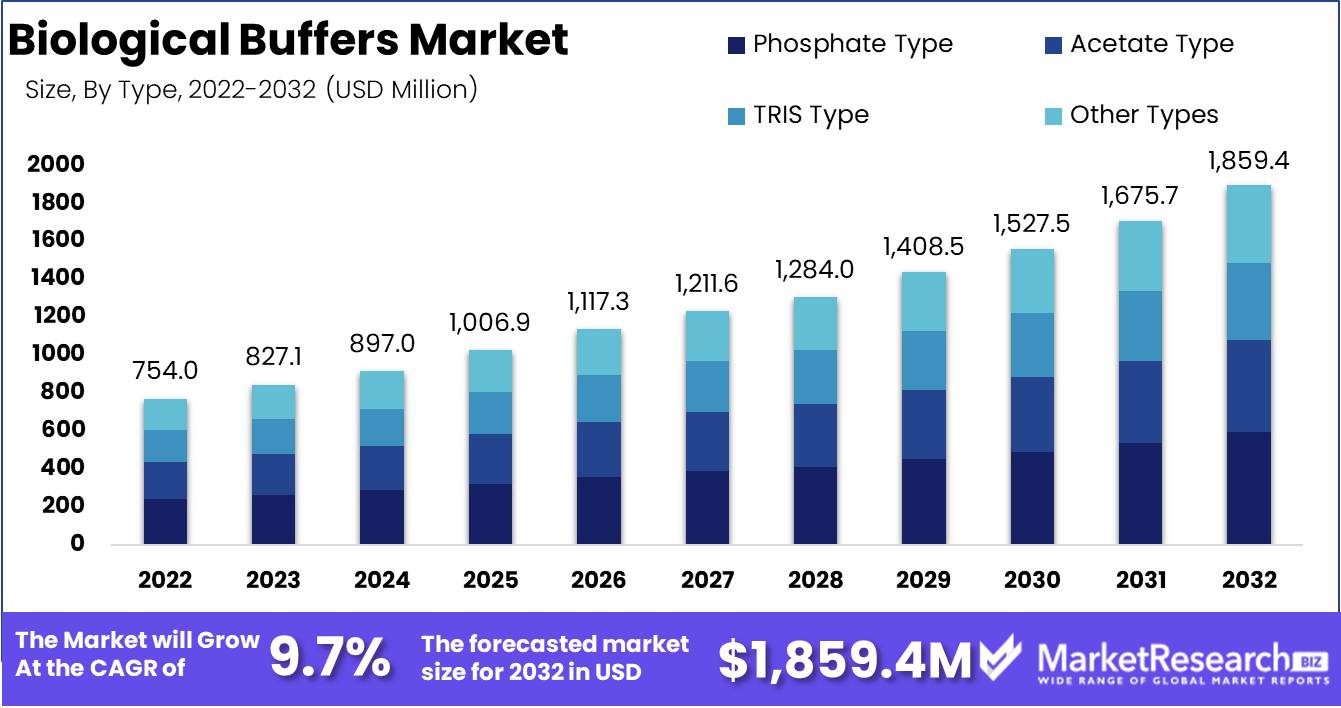
Global Biological Buffers Market size is expected to be worth around USD 1,859.4 Mn by 2032 from USD 754.0 Mn in 2022, growing at a CAGR of 9.7% during the forecast period from 2023 to 2032.
Biological buffers, which stabilize pH in biological systems, have a complex global market. Even with strong acids or bases, these buffers resist pH swings. These buffers play a crucial role in biological research, diagnostics, and analytical chemistry, ensuring precise and reliable experimental results. This vast market has a variety of products, including biological and pharmaceutical buffers, biochemical-grade buffers, and diagnostic-grade buffers, all of which contribute to its growth and vitality.
The global biological buffers market has seen many major discoveries and game-changing technologies recently. Concentrated solutions make biological buffers more dispensable and efficient. High-purity diagnostic buffers have revolutionized medical diagnostics by increasing precision and efficacy.
The global biological buffers market has attracted several companies due to rising demand across many sectors. These visionary enterprises, aware of the indispensable role performed by biological buffers, have launched on ambitious journeys, spending large resources on tireless research and development activities, all aimed at creating superior and more efficient varieties of these indispensable buffers.
Biological buffers are also being used in many products and services. The pharmaceutical industry has intentionally used biological buffers in every stage of drug development and manufacture to improve therapeutic interventions' quality and efficacy. The diagnostics industry uses premium-grade buffers to identify diseases with unmatched accuracy, improving diagnostic capabilities and patient outcomes.
As one explores this lively ecosystem, pharmaceutical, and biotechnology giants play a major role as investors. These industry titans use biological buffers for medication development, production, and quality control. To maximize illness detection and experimental analysis, diagnostic and analytical sectors require top-tier biological buffers.
The global biological buffers market is indispensable. As these buffers are used more across disciplines, transparency, explication, and accountability must be prioritized throughout their production, distribution, and use. Industry stakeholders must preserve ethical standards and adopt responsible procedures, ensuring the safety and efficacy of biological buffers in various applications.
The global biological buffers market has many business applications. The pharmaceutical and biotechnology industries, where the indispensable role played by biological buffers in the development and production of life-changing medications, are the most prominent examples of these applications. These buffers are indispensable in the diagnostic industry, enabling reliable illness detection and diagnosis. Research labs and top universities use biological buffers to maintain precise and reproducible experimental settings, advancing science and knowledge.
Driving factors
Growing Interest in Biological Buffers in Life Sciences
In recent years, the global market for biological buffers has expanded significantly due to rising demand in life sciences research and biopharmaceutical manufacturing. Biological buffers aid in maintaining a stable pH range in a solution, making them indispensable for cell culture advancements and other laboratory techniques. The need for pH regulation in numerous industries, including healthcare and pharmaceuticals, is fueling the expansion of biological buffers.
Regulatory Impact on the Market for Biological Buffers
In addition, there are regulations governing the use of biological buffers in various applications. Any changes to these regulations may have an effect on the market, so market participants must remain current to ensure compliance.
Emerging Technologies Shape the Market for Biological Buffers
Several emerging technologies could affect the market for biological buffers as a result of the accelerated development of technology. These include the development of bioreactors for the production of biopharmaceuticals and the rise of green chemistry principles for the production of sustainable biological buffers.
Disruptive Potential of Substitutes in the Market for Biological Buffers
The availability of substitutes and alternatives is a potential factor that could impact the competitive landscape of the market for biological buffers. The use of buffer solutions derived from natural sources, for instance, could disrupt the market for synthetic buffers.
Consumer Tendencies Promoting Resilient Biological Buffers
Additionally, emerging trends and variations in consumer behavior may impact the market for biological buffers. For instance, the increasing demand for personalized medicine and the expanding trend of green chemistry in the healthcare and pharmaceutical industries may motivate the use of sustainable biological buffers.
Restraining Factors
Factors Restricting the Market for Biological Buffers
Several restraining factors have a significant impact on the biological buffers market, including raw material price volatility, regulatory requirements, and alternative methods. In recent years, the global market for biological buffers has experienced a significant increase in demand, which has led to stricter regulations regarding product quality control, safety, and efficacy.
The Impact of Raw Material Price Volatility on Market Buffers
The price volatility of raw materials is one of the main restraints on the market for biological buffers. The cost of raw materials is a significant portion of the manufacturing cost of biological buffers, and fluctuations in their prices can result in substantial price changes for the final product. The limited availability of certain raw materials utilized in the production of biological buffers exacerbates the problem.
Regulatory Obstacles for the Market for Biological Buffers
Regulatory requirements are another major factor affecting the market for biological buffers. The production and distribution of biological buffers are subject to stringent regulations designed to ensure the product's safety and efficacy. These regulations vary by region and have become more stringent in recent years as product safety concerns have increased.
Compliance Expenses Impact Buffers Market
Compliance with regulatory requirements necessitates substantial investments of time and resources, which can be a significant barrier to entry for new market participants. Existing market participants' profitability may also be affected by the high cost of compliance.
Impact of Alternative Methods on the Market for Buffers
The market for biological buffers is also affected by the availability of alternative methods. Biological buffers can be replaced by a variety of alternative methods. In some instances, these alternatives may not be as effective as biological buffers, but they can be more cost-effective.
Type Analysis
Among the various varieties of biological buffers, the phosphate type segment dominates the market, accounting for the largest share of the market. This segment is expected to witness the most rapid growth over the next few years, driven by factors such as economic growth in emergent economies, consumer trends and behavior, and the growing demand for biochemical research.
Emerging nations have a substantial impact on the adoption of biological buffers of the phosphate type. As more countries in regions such as Asia-Pacific and Latin America endeavor to develop their healthcare and research infrastructure, the demand for high-quality biological buffers is expected to rise. In recent years, countries like India, China, and Brazil have witnessed significant economic growth, resulting in increased investments in the life sciences and research sectors. This has driven a rise in research institutions and pharmaceutical companies, which fuels the demand for biological buffers.
The demand for advanced biological buffers is driven by the trend toward personalized medicine and the increased emphasis on drug discovery research. This has resulted in a transition towards the use of phosphate-type buffers in numerous research environments. Phosphate-type buffers are preferable because they are exceptionally effective at maintaining a pH within the optimal range for enzyme activity. The growing demand for better biological buffers is driving manufacturers to concentrate on creating innovative buffer formulations that provide greater precision and consistency.
Because of the high demand from the research and pharmaceutical industries, the phosphate-type segment is anticipated to register the highest growth rate in the coming years. The demand for advanced biological buffers is also growing as a result of the increasing prevalence of chronic diseases and the increasing pressure to develop effective treatments. Phosphate-type buffers are crucial for a variety of research applications, including cell culture and protein purification, because they can sustain an optimal pH for enzyme activity. The rising demand for high-quality biological buffers is expected to drive the adoption of phosphate-type biological buffers in the global biological buffer market.
End-User Analysis
The research institution market segment dominates the global biological buffers market, accounting for the greatest market share. In the coming years, the segment is expected to witness the highest growth rate, driven by factors such as economic development in emerging economies, consumer trends and behavior, and the growing need for biochemical research.
The economic growth of emerging economies is driving the adoption of biological buffers in research institutions. The rise in disposable income is driving market growth, along with increased investments in the research and pharmaceutical sectors. Numerous emerging economies, including China, India, and Brazil, are attempting to become significant players in the pharmaceutical industry, which has resulted in the growth of research institutions and other life sciences industries. This has resulted in the exponential growth of the market for biological buffers.
Driving the growth of the biological buffers market are consumer behavior trends, which are crucial. The growing need for advanced research institution instruments to study biological systems and the increasing emphasis on drug development and personalized medicine are propelling the demand for advanced biological buffers, thereby fostering the segment's growth. In addition, the adoption of automation in research institutions is accelerating the demand for high-quality biological buffers and other reagents.
The research institution segment is anticipated to experience the quickest growth rate over the coming years, driven by the rising adoption of in-vitro models for research purposes. Advanced biological buffers are crucial for maintaining the stability and accuracy of these models, driving the demand for high-quality buffers among research institutions. In addition, the growing demand for cutting-edge research tools to study intricate biological processes is driving the demand for biological buffers, which is expected to propel the growth of the research institution segment in the global biological buffers market.
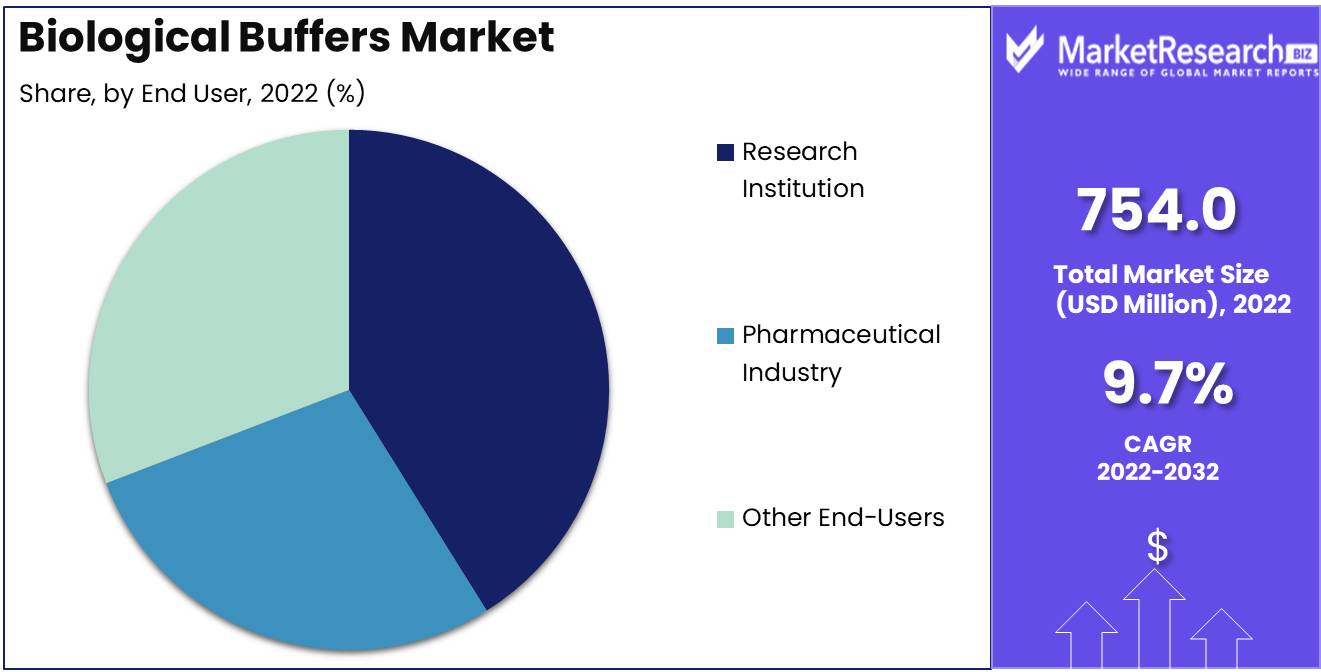
Key Market Segments
By Type
- Phosphate Type
- Acetate Type
- TRIS Type
- Other Types
By End-User
- Research Institution
- Pharmaceutical Industry
- Other End-Users
Growth Opportunity
Demand for Advanced Biological Buffers Is Growing
The production of biologics, diagnostics, and vaccines relies heavily on biological buffers. As these industries continue to expand, the demand for formulations of high-quality buffers increases. Manufacturers are investing significantly in R&D to create novel buffer formulations with improved performance, stability, and compatibility with a wide range of applications.
The Market for Customized Buffer Formulations Growing
With the increasing demand for advanced biologics, the need for precise and dependable buffers that optimize product quality and yield is growing. Innovative formulations assure the stability of biological products during storage, transport, and use.
Emerging Markets Drive the Growth of Biological Buffers
The market for biological buffers is expanding significantly as manufacturers seek out new opportunities. Emerging markets, such as Asia-Pacific and Latin America, are gaining importance for the production of buffers. These regions have a rising demand for biologics, lower production costs, and favorable regulatory environments. Consequently, major manufacturers are expanding their operations in these regions, thereby establishing partnership opportunities and fostering market expansion.
Precision and Dependability in Biopharmaceutical Buffers
The demand for customized buffers is increasing, with manufacturers seeking formulations that meet their specific requirements. pH, ionic strength, and compatibility are just a few of the factors that can be customized. As biologics become more complex and diverse, the need for customized buffers to ensure optimum yield and product quality increases.
Buffer Production is Revolutionized by Automation
The industry is being transformed by the incorporation of automation technology into buffer production. Automation increases productivity and accuracy while decreasing the likelihood of human error. Utilizing automation, manufacturers are optimizing production processes, increasing yields, and decreasing costs. By automating crucial buffer preparation stages, manufacturers can ensure product quality consistency and increase output.
Latest Trends
Demand for Biological Buffers is Growing
Pharmaceutical and biotechnology companies are increasing their demand for biological buffers in the market. Biological buffers are essential for maintaining the pH of a solution, stabilizing proteins and enzymes, and enhancing the precision and sensitivity of analytical techniques. They are extensively utilized in research and development activities as well as the manufacturing of numerous pharmaceutical and biotech products, making them a crucial component of the life sciences sector.
Animal-Free Buffers Revolutionize the Market
In the manufacturing of biological buffers, animal-derived products are frequently used. Nevertheless, animal-derived products have limitations in terms of stability, reproducibility, and contamination risks. To overcome the limitations of animal-derived products, a number of manufacturers offer animal-free buffers that eradicate contamination risks and guarantee high efficacy. These buffers are easy to use, have a long shelf life, and are extremely stable, making them an ideal solution for companies that place a premium on quality and efficiency in their products.
Formulations of Specialized Buffers for Diverse Applications
Different applications necessitate buffer formulations that cater to specific requirements, such as pH, ionic strength, and temperature stability. To satisfy the growing demand for specialized buffer formulations, a number of manufacturers offer application-specific formulations that cater to specific needs, such as enzymatic assays, protein crystallization, cell culture, and DNA sequencing. Companies can achieve reproducibility and consistency with these specialized formulations, which are crucial to the efficiency of their products and research.
Buffer Solutions That are Ready to Use are Becoming More and More Common
Preparing buffer solutions requires trained personnel and precise calculations of ingredients and pH levels. Several manufacturers offer ready-to-use formats that require minimal or no preparation in order to simplify the buffer preparation procedure. These formats are easy to use, save time, and reduce the likelihood of making mistakes. The adoption of these formats by biotech companies and laboratories is influenced by their convenience and efficiency.
Enhanced Stability through the Use of Concentrated Buffers
To maintain their effectiveness and extend their expiration life, buffers must be stored and transported under the proper conditions. Traditional storage methods have limitations in terms of buffer stability and contamination risks, as powdered or liquid buffers must be reconstituted or diluted prior to buffer preparation. Several manufacturers offer lyophilized or concentrated buffers that offer improved stability and storage convenience to overcome these obstacles.
Regional Analysis
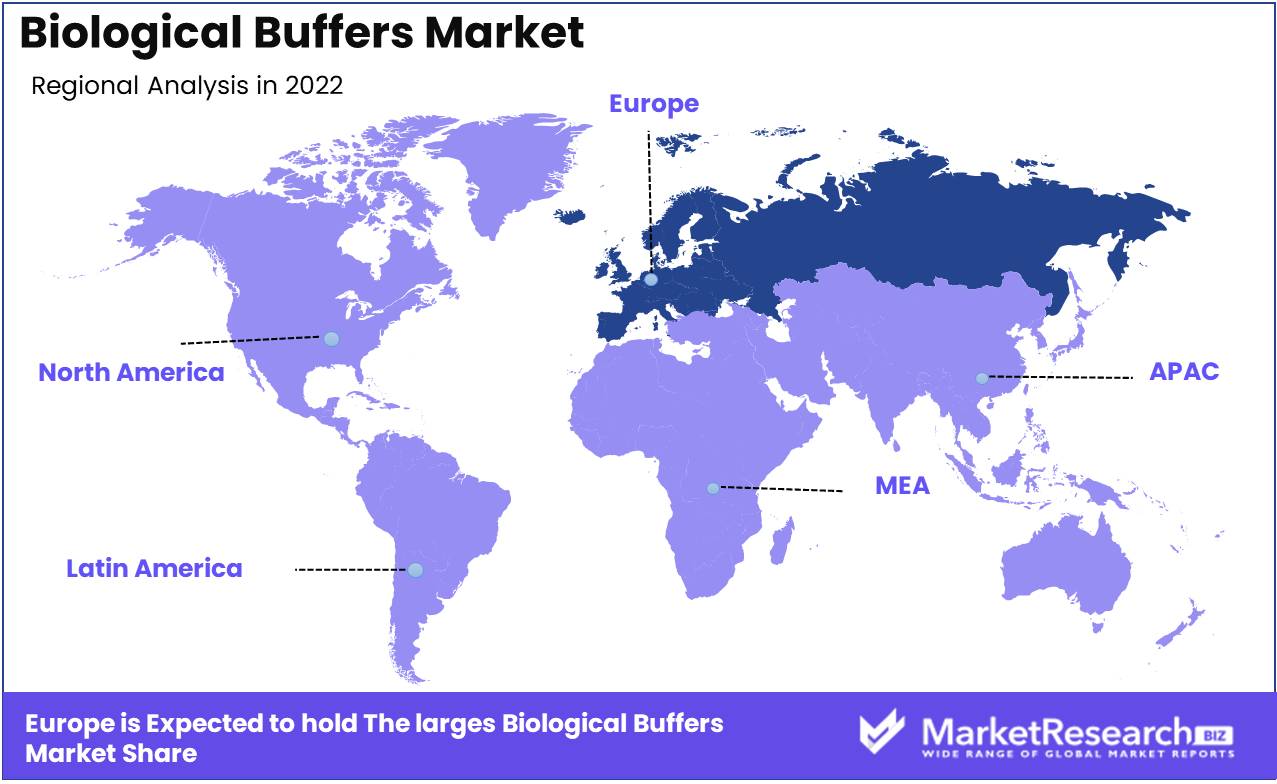
Europe dominates the biological buffers market. Biological buffers exist in many scientific labs. Protein expression, electrophoresis, and immunoassays require these chemicals to stabilize biomolecules and regulate pH. Biological buffers are therefore in high demand in the scientific community. The production and demand for these chemicals vary by region.
Europe is a leader in the production and supply of biological buffers. Europe's dominant market position, strong pharmaceutical industry, and a large number of research centers and colleges in the region all contribute to the biological buffers industry's growth, according to the present report.
European countries produce biological buffers. Germany, the UK, France, and Italy are examples. Germany produces 30% of all biological buffers in Europe. UK and France follow with 15% and 12%.
Europe's pharmaceutical industry dominates the biological buffers market. The demand for biological buffers and medication production go hand in hand. High-quality biological buffers are in demand due to chronic disease incidence and pharmaceutical industry developments. Europe also has various research centers and academic institutions for biological buffers research and development.
Several factors explain Europe's biological buffers market dominance. The region has invested heavily in the pharmaceutical industry. This investment has led to the development of modern biological buffer facilities and technology that enable the production of high-quality biological buffers.
Second, the European Union supports regional scientific research and development through various organizations and agencies. These groups fund local and international biological buffers research.
Key Regions and Countries
North America
- US
- Canada
- Mexico
Western Europe
- Germany
- France
- The UK
- Spain
- Italy
- Portugal
- Ireland
- Austria
- Switzerland
- Benelux
- Nordic
- Rest of Western Europe
Eastern Europe
- Russia
- Poland
- The Czech Republic
- Greece
- Rest of Eastern Europel
APAC
- China
- Japan
- South Korea
- India
- Australia & New Zealand
- Indonesia
- Malaysia
- Philippines
- Singapore
- Thailand
- Vietnam
- Rest of APAC
Latin America
- Brazil
- Colombia
- Chile
- Argentina
- Costa Rica
- Rest of Latin America
Middle East & Africa
- Algeria
- Egypt
- Israel
- Kuwait
- Nigeria
- Saudi Arabia
- South Africa
- Turkey
- United Arab Emirates
- Rest of MEA
Key Players Analysis
Increased life sciences research funding, biopharmaceutical manufacturing adoption of buffer solutions, and disease diagnosis demand have driven the global biological buffers market. Key competitors in this market are creating breakthrough biological buffer solutions and expanding globally through strategic collaborations and partnerships.
Merck KGaA, a global biological buffers market leader, offers a wide range of buffer solutions for life science applications. The company sells TRIS, HEPES, MOPS, MES, and TAPS buffers. Merck KGaA launches innovative products and forms strategic collaborations to grow its market share.
Pierce buffer solutions from Thermo Fisher Scientific Inc. are another key competitor in the global biological buffers market. The global corporation acquires and partners to grow its product line. Thermo Fisher Scientific Inc. bought Patheon, a renowned pharmaceutical and biotechnology contract manufacturer.
Avantor Performance Materials, LLC, Bio-Rad Laboratories Inc., Lonza Group AG, and Biological Industries Israel Beit-Haemek Ltd. also dominate the global biological buffers market. These companies develop unique biological buffer solutions and expand globally through strategic partnerships and collaborations. These leading players are projected to continue to drive considerable growth in the global biological buffers market due to increased demand for buffer solutions in life science applications.
Top Key Players in the Biological Buffers Market
- Merck KGaA
- Thermo Fisher Scientific Inc
- Avantor
- GE Healthcare
- Santa Cruz Biotechnology, Inc.
- Lonza Group Ltd.
- Bio-Rad Laboratories, Inc
- F. Hoffmann-La Roche Ltd.
- Hamilton Company
- BASF SE
Recent Development
- In 2019, A new class of pH-responsive biodegradable buffers was introduced.
- In 2020, Scientists improved biological buffers' stability and selectivity.
- In 2021, Researchers worked on finding buffer solutions with low environmental impact as sustainable practices became more popular.
- In 2022, Nanotechnology will advance buffer development.
- In 2023, Multiplexed assays and high-throughput analysis have led to the development of new buffer systems.
Report Scope:
Report Features Description Market Value (2022) USD 754.0 Mn Forecast Revenue (2032) USD 1,859.4 Mn CAGR (2023-2032) 9.7% Base Year for Estimation 2022 Historic Period 2016-2022 Forecast Period 2023-2032 Report Coverage Revenue Forecast, Market Dynamics, COVID-19 Impact, Competitive Landscape, Recent Developments Segments Covered By Type (Phosphate Type, Acetate Type, TRIS Type, Other Types), By End-User (Research Institution, Pharmaceutical Industry, Other End-Users) Regional Analysis North America – The US, Canada, & Mexico; Western Europe – Germany, France, The UK, Spain, Italy, Portugal, Ireland, Austria, Switzerland, Benelux, Nordic, & Rest of Western Europe; Eastern Europe – Russia, Poland, The Czech Republic, Greece, & Rest of Eastern Europe; APAC – China, Japan, South Korea, India, Australia & New Zealand, Indonesia, Malaysia, Philippines, Singapore, Thailand, Vietnam, & Rest of APAC; Latin America – Brazil, Colombia, Chile, Argentina, Costa Rica, & Rest of Latin America; Middle East & Africa – Algeria, Egypt, Israel, Kuwait, Nigeria, Saudi Arabia, South Africa, Turkey, United Arab Emirates, & Rest of MEA Competitive Landscape Merck KGaA, Thermo Fisher Scientific Inc., Avantor, GE Healthcare, Santa Cruz Biotechnology, Inc., Lonza Group Ltd., Bio-Rad Laboratories, Inc., F. Hoffmann-La Roche Ltd., Hamilton Company, BASF SE Customization Scope Customization for segments, region/country-level will be provided. Moreover, additional customization can be done based on the requirements. Purchase Options We have three licenses to opt for: Single User License, Multi-User License (Up to 5 Users), Corporate Use License (Unlimited User and Printable PDF) - Merck KGaA
- Thermo Fisher Scientific Inc
- Avantor
- GE Healthcare
- Santa Cruz Biotechnology, Inc.
- Lonza Group Ltd.
- Bio-Rad Laboratories, Inc
- F. Hoffmann-La Roche Ltd.
- Hamilton Company
- BASF SE
- 1. Executive Summary
- 1.1. Definition
- 1.2. Taxonomy
- 1.3. Research Scope
- 1.4. Key Analysis
- 1.5. Key Findings by Major Segments
- 1.6. Top strategies by Major Players
- 2. Global Biological Buffers Market Overview
- 2.1. Biological Buffers Market Dynamics
- 2.1.1. Drivers
- 2.1.2. Opportunities
- 2.1.3. Restraints
- 2.1.4. Challenges
- 2.2. Macro-economic Factors
- 2.3. Regulatory Framework
- 2.4. Market Investment Feasibility Index
- 2.5. PEST Analysis
- 2.6. PORTER’S Five Force Analysis
- 2.7. Drivers & Restraints Impact Analysis
- 2.8. Industry Chain Analysis
- 2.9. Cost Structure Analysis
- 2.10. Marketing Strategy
- 2.11. Russia-Ukraine War Impact Analysis
- 2.12. Opportunity Map Analysis
- 2.13. Market Competition Scenario Analysis
- 2.14. Product Life Cycle Analysis
- 2.15. Opportunity Orbits
- 2.16. Manufacturer Intensity Map
- 2.17. Major Companies sales by Value & Volume
- 2.1. Biological Buffers Market Dynamics
- 3. Global Biological Buffers Market Analysis, Opportunity and Forecast, 2016-2032
- 3.1. Global Biological Buffers Market Analysis, 2016-2021
- 3.2. Global Biological Buffers Market Opportunity and Forecast, 2023-2032
- 3.3. Global Biological Buffers Market Analysis, Opportunity and Forecast, By By Type, 2016-2032
- 3.3.1. Global Biological Buffers Market Analysis by By Type: Introduction
- 3.3.2. Market Size Absolute $ Opportunity Analysis and Forecast, By By Type, 2016-2032
- 3.3.3. Phosphate Type
- 3.3.4. Acetate Type
- 3.3.5. TRIS Type
- 3.3.6. Other Types
- 3.4. Global Biological Buffers Market Analysis, Opportunity and Forecast, By By End-User, 2016-2032
- 3.4.1. Global Biological Buffers Market Analysis by By End-User: Introduction
- 3.4.2. Market Size Absolute $ Opportunity Analysis and Forecast, By By End-User, 2016-2032
- 3.4.3. Research Institution
- 3.4.4. Pharmaceutical Industry
- 3.4.5. Other End-Users
- 4. North America Biological Buffers Market Analysis, Opportunity and Forecast, 2016-2032
- 4.1. North America Biological Buffers Market Analysis, 2016-2021
- 4.2. North America Biological Buffers Market Opportunity and Forecast, 2023-2032
- 4.3. North America Biological Buffers Market Analysis, Opportunity and Forecast, By By Type, 2016-2032
- 4.3.1. North America Biological Buffers Market Analysis by By Type: Introduction
- 4.3.2. Market Size Absolute $ Opportunity Analysis and Forecast, By By Type, 2016-2032
- 4.3.3. Phosphate Type
- 4.3.4. Acetate Type
- 4.3.5. TRIS Type
- 4.3.6. Other Types
- 4.4. North America Biological Buffers Market Analysis, Opportunity and Forecast, By By End-User, 2016-2032
- 4.4.1. North America Biological Buffers Market Analysis by By End-User: Introduction
- 4.4.2. Market Size Absolute $ Opportunity Analysis and Forecast, By By End-User, 2016-2032
- 4.4.3. Research Institution
- 4.4.4. Pharmaceutical Industry
- 4.4.5. Other End-Users
- 4.5. North America Biological Buffers Market Analysis, Opportunity and Forecast, By Country , 2016-2032
- 4.5.1. North America Biological Buffers Market Analysis by Country : Introduction
- 4.5.2. Market Size Absolute $ Opportunity Analysis and Forecast, Country , 2016-2032
- 4.5.2.1. The US
- 4.5.2.2. Canada
- 4.5.2.3. Mexico
- 5. Western Europe Biological Buffers Market Analysis, Opportunity and Forecast, 2016-2032
- 5.1. Western Europe Biological Buffers Market Analysis, 2016-2021
- 5.2. Western Europe Biological Buffers Market Opportunity and Forecast, 2023-2032
- 5.3. Western Europe Biological Buffers Market Analysis, Opportunity and Forecast, By By Type, 2016-2032
- 5.3.1. Western Europe Biological Buffers Market Analysis by By Type: Introduction
- 5.3.2. Market Size Absolute $ Opportunity Analysis and Forecast, By By Type, 2016-2032
- 5.3.3. Phosphate Type
- 5.3.4. Acetate Type
- 5.3.5. TRIS Type
- 5.3.6. Other Types
- 5.4. Western Europe Biological Buffers Market Analysis, Opportunity and Forecast, By By End-User, 2016-2032
- 5.4.1. Western Europe Biological Buffers Market Analysis by By End-User: Introduction
- 5.4.2. Market Size Absolute $ Opportunity Analysis and Forecast, By By End-User, 2016-2032
- 5.4.3. Research Institution
- 5.4.4. Pharmaceutical Industry
- 5.4.5. Other End-Users
- 5.5. Western Europe Biological Buffers Market Analysis, Opportunity and Forecast, By Country , 2016-2032
- 5.5.1. Western Europe Biological Buffers Market Analysis by Country : Introduction
- 5.5.2. Market Size Absolute $ Opportunity Analysis and Forecast, Country , 2016-2032
- 5.5.2.1. Germany
- 5.5.2.2. France
- 5.5.2.3. The UK
- 5.5.2.4. Spain
- 5.5.2.5. Italy
- 5.5.2.6. Portugal
- 5.5.2.7. Ireland
- 5.5.2.8. Austria
- 5.5.2.9. Switzerland
- 5.5.2.10. Benelux
- 5.5.2.11. Nordic
- 5.5.2.12. Rest of Western Europe
- 6. Eastern Europe Biological Buffers Market Analysis, Opportunity and Forecast, 2016-2032
- 6.1. Eastern Europe Biological Buffers Market Analysis, 2016-2021
- 6.2. Eastern Europe Biological Buffers Market Opportunity and Forecast, 2023-2032
- 6.3. Eastern Europe Biological Buffers Market Analysis, Opportunity and Forecast, By By Type, 2016-2032
- 6.3.1. Eastern Europe Biological Buffers Market Analysis by By Type: Introduction
- 6.3.2. Market Size Absolute $ Opportunity Analysis and Forecast, By By Type, 2016-2032
- 6.3.3. Phosphate Type
- 6.3.4. Acetate Type
- 6.3.5. TRIS Type
- 6.3.6. Other Types
- 6.4. Eastern Europe Biological Buffers Market Analysis, Opportunity and Forecast, By By End-User, 2016-2032
- 6.4.1. Eastern Europe Biological Buffers Market Analysis by By End-User: Introduction
- 6.4.2. Market Size Absolute $ Opportunity Analysis and Forecast, By By End-User, 2016-2032
- 6.4.3. Research Institution
- 6.4.4. Pharmaceutical Industry
- 6.4.5. Other End-Users
- 6.5. Eastern Europe Biological Buffers Market Analysis, Opportunity and Forecast, By Country , 2016-2032
- 6.5.1. Eastern Europe Biological Buffers Market Analysis by Country : Introduction
- 6.5.2. Market Size Absolute $ Opportunity Analysis and Forecast, Country , 2016-2032
- 6.5.2.1. Russia
- 6.5.2.2. Poland
- 6.5.2.3. The Czech Republic
- 6.5.2.4. Greece
- 6.5.2.5. Rest of Eastern Europe
- 7. APAC Biological Buffers Market Analysis, Opportunity and Forecast, 2016-2032
- 7.1. APAC Biological Buffers Market Analysis, 2016-2021
- 7.2. APAC Biological Buffers Market Opportunity and Forecast, 2023-2032
- 7.3. APAC Biological Buffers Market Analysis, Opportunity and Forecast, By By Type, 2016-2032
- 7.3.1. APAC Biological Buffers Market Analysis by By Type: Introduction
- 7.3.2. Market Size Absolute $ Opportunity Analysis and Forecast, By By Type, 2016-2032
- 7.3.3. Phosphate Type
- 7.3.4. Acetate Type
- 7.3.5. TRIS Type
- 7.3.6. Other Types
- 7.4. APAC Biological Buffers Market Analysis, Opportunity and Forecast, By By End-User, 2016-2032
- 7.4.1. APAC Biological Buffers Market Analysis by By End-User: Introduction
- 7.4.2. Market Size Absolute $ Opportunity Analysis and Forecast, By By End-User, 2016-2032
- 7.4.3. Research Institution
- 7.4.4. Pharmaceutical Industry
- 7.4.5. Other End-Users
- 7.5. APAC Biological Buffers Market Analysis, Opportunity and Forecast, By Country , 2016-2032
- 7.5.1. APAC Biological Buffers Market Analysis by Country : Introduction
- 7.5.2. Market Size Absolute $ Opportunity Analysis and Forecast, Country , 2016-2032
- 7.5.2.1. China
- 7.5.2.2. Japan
- 7.5.2.3. South Korea
- 7.5.2.4. India
- 7.5.2.5. Australia & New Zeland
- 7.5.2.6. Indonesia
- 7.5.2.7. Malaysia
- 7.5.2.8. Philippines
- 7.5.2.9. Singapore
- 7.5.2.10. Thailand
- 7.5.2.11. Vietnam
- 7.5.2.12. Rest of APAC
- 8. Latin America Biological Buffers Market Analysis, Opportunity and Forecast, 2016-2032
- 8.1. Latin America Biological Buffers Market Analysis, 2016-2021
- 8.2. Latin America Biological Buffers Market Opportunity and Forecast, 2023-2032
- 8.3. Latin America Biological Buffers Market Analysis, Opportunity and Forecast, By By Type, 2016-2032
- 8.3.1. Latin America Biological Buffers Market Analysis by By Type: Introduction
- 8.3.2. Market Size Absolute $ Opportunity Analysis and Forecast, By By Type, 2016-2032
- 8.3.3. Phosphate Type
- 8.3.4. Acetate Type
- 8.3.5. TRIS Type
- 8.3.6. Other Types
- 8.4. Latin America Biological Buffers Market Analysis, Opportunity and Forecast, By By End-User, 2016-2032
- 8.4.1. Latin America Biological Buffers Market Analysis by By End-User: Introduction
- 8.4.2. Market Size Absolute $ Opportunity Analysis and Forecast, By By End-User, 2016-2032
- 8.4.3. Research Institution
- 8.4.4. Pharmaceutical Industry
- 8.4.5. Other End-Users
- 8.5. Latin America Biological Buffers Market Analysis, Opportunity and Forecast, By Country , 2016-2032
- 8.5.1. Latin America Biological Buffers Market Analysis by Country : Introduction
- 8.5.2. Market Size Absolute $ Opportunity Analysis and Forecast, Country , 2016-2032
- 8.5.2.1. Brazil
- 8.5.2.2. Colombia
- 8.5.2.3. Chile
- 8.5.2.4. Argentina
- 8.5.2.5. Costa Rica
- 8.5.2.6. Rest of Latin America
- 9. Middle East & Africa Biological Buffers Market Analysis, Opportunity and Forecast, 2016-2032
- 9.1. Middle East & Africa Biological Buffers Market Analysis, 2016-2021
- 9.2. Middle East & Africa Biological Buffers Market Opportunity and Forecast, 2023-2032
- 9.3. Middle East & Africa Biological Buffers Market Analysis, Opportunity and Forecast, By By Type, 2016-2032
- 9.3.1. Middle East & Africa Biological Buffers Market Analysis by By Type: Introduction
- 9.3.2. Market Size Absolute $ Opportunity Analysis and Forecast, By By Type, 2016-2032
- 9.3.3. Phosphate Type
- 9.3.4. Acetate Type
- 9.3.5. TRIS Type
- 9.3.6. Other Types
- 9.4. Middle East & Africa Biological Buffers Market Analysis, Opportunity and Forecast, By By End-User, 2016-2032
- 9.4.1. Middle East & Africa Biological Buffers Market Analysis by By End-User: Introduction
- 9.4.2. Market Size Absolute $ Opportunity Analysis and Forecast, By By End-User, 2016-2032
- 9.4.3. Research Institution
- 9.4.4. Pharmaceutical Industry
- 9.4.5. Other End-Users
- 9.5. Middle East & Africa Biological Buffers Market Analysis, Opportunity and Forecast, By Country , 2016-2032
- 9.5.1. Middle East & Africa Biological Buffers Market Analysis by Country : Introduction
- 9.5.2. Market Size Absolute $ Opportunity Analysis and Forecast, Country , 2016-2032
- 9.5.2.1. Algeria
- 9.5.2.2. Egypt
- 9.5.2.3. Israel
- 9.5.2.4. Kuwait
- 9.5.2.5. Nigeria
- 9.5.2.6. Saudi Arabia
- 9.5.2.7. South Africa
- 9.5.2.8. Turkey
- 9.5.2.9. The UAE
- 9.5.2.10. Rest of MEA
- 10. Global Biological Buffers Market Analysis, Opportunity and Forecast, By Region , 2016-2032
- 10.1. Global Biological Buffers Market Analysis by Region : Introduction
- 10.2. Market Size Absolute $ Opportunity Analysis and Forecast, By Region , 2016-2032
- 10.2.1. North America
- 10.2.2. Western Europe
- 10.2.3. Eastern Europe
- 10.2.4. APAC
- 10.2.5. Latin America
- 10.2.6. Middle East & Africa
- 11. Global Biological Buffers Market Competitive Landscape, Market Share Analysis, and Company Profiles
- 11.1. Market Share Analysis
- 11.2. Company Profiles
- 11.3. Merck KGaA
- 11.3.1. Company Overview
- 11.3.2. Financial Highlights
- 11.3.3. Product Portfolio
- 11.3.4. SWOT Analysis
- 11.3.5. Key Strategies and Developments
- 11.4. Thermo Fisher Scientific Inc
- 11.4.1. Company Overview
- 11.4.2. Financial Highlights
- 11.4.3. Product Portfolio
- 11.4.4. SWOT Analysis
- 11.4.5. Key Strategies and Developments
- 11.5. Avantor
- 11.5.1. Company Overview
- 11.5.2. Financial Highlights
- 11.5.3. Product Portfolio
- 11.5.4. SWOT Analysis
- 11.5.5. Key Strategies and Developments
- 11.6. GE Healthcare
- 11.6.1. Company Overview
- 11.6.2. Financial Highlights
- 11.6.3. Product Portfolio
- 11.6.4. SWOT Analysis
- 11.6.5. Key Strategies and Developments
- 11.7. Santa Cruz Biotechnology, Inc.
- 11.7.1. Company Overview
- 11.7.2. Financial Highlights
- 11.7.3. Product Portfolio
- 11.7.4. SWOT Analysis
- 11.7.5. Key Strategies and Developments
- 11.8. Lonza Group Ltd.
- 11.8.1. Company Overview
- 11.8.2. Financial Highlights
- 11.8.3. Product Portfolio
- 11.8.4. SWOT Analysis
- 11.8.5. Key Strategies and Developments
- 11.9. Bio-Rad Laboratories, Inc
- 11.9.1. Company Overview
- 11.9.2. Financial Highlights
- 11.9.3. Product Portfolio
- 11.9.4. SWOT Analysis
- 11.9.5. Key Strategies and Developments
- 11.10. F. Hoffmann-La Roche Ltd.
- 11.10.1. Company Overview
- 11.10.2. Financial Highlights
- 11.10.3. Product Portfolio
- 11.10.4. SWOT Analysis
- 11.10.5. Key Strategies and Developments
- 11.11. Hamilton Company
- 11.11.1. Company Overview
- 11.11.2. Financial Highlights
- 11.11.3. Product Portfolio
- 11.11.4. SWOT Analysis
- 11.11.5. Key Strategies and Developments
- 11.12. BASF SE
- 11.12.1. Company Overview
- 11.12.2. Financial Highlights
- 11.12.3. Product Portfolio
- 11.12.4. SWOT Analysis
- 11.12.5. Key Strategies and Developments
- 12. Assumptions and Acronyms
- 13. Research Methodology
- 14. Contact
- Figure 1: Global Biological Buffers Market Revenue (US$ Mn) Market Share by By Type in 2022
- Figure 2: Global Biological Buffers Market Attractiveness Analysis by By Type, 2016-2032
- Figure 3: Global Biological Buffers Market Revenue (US$ Mn) Market Share by By End-Userin 2022
- Figure 4: Global Biological Buffers Market Attractiveness Analysis by By End-User, 2016-2032
- Figure 5: Global Biological Buffers Market Revenue (US$ Mn) Market Share by Region in 2022
- Figure 6: Global Biological Buffers Market Attractiveness Analysis by Region, 2016-2032
- Figure 7: Global Biological Buffers Market Revenue (US$ Mn) (2016-2032)
- Figure 8: Global Biological Buffers Market Revenue (US$ Mn) Comparison by Region (2016-2032)
- Figure 9: Global Biological Buffers Market Revenue (US$ Mn) Comparison by By Type (2016-2032)
- Figure 10: Global Biological Buffers Market Revenue (US$ Mn) Comparison by By End-User (2016-2032)
- Figure 11: Global Biological Buffers Market Y-o-Y Growth Rate Comparison by Region (2016-2032)
- Figure 12: Global Biological Buffers Market Y-o-Y Growth Rate Comparison by By Type (2016-2032)
- Figure 13: Global Biological Buffers Market Y-o-Y Growth Rate Comparison by By End-User (2016-2032)
- Figure 14: Global Biological Buffers Market Share Comparison by Region (2016-2032)
- Figure 15: Global Biological Buffers Market Share Comparison by By Type (2016-2032)
- Figure 16: Global Biological Buffers Market Share Comparison by By End-User (2016-2032)
- Figure 17: North America Biological Buffers Market Revenue (US$ Mn) Market Share by By Typein 2022
- Figure 18: North America Biological Buffers Market Attractiveness Analysis by By Type, 2016-2032
- Figure 19: North America Biological Buffers Market Revenue (US$ Mn) Market Share by By End-Userin 2022
- Figure 20: North America Biological Buffers Market Attractiveness Analysis by By End-User, 2016-2032
- Figure 21: North America Biological Buffers Market Revenue (US$ Mn) Market Share by Country in 2022
- Figure 22: North America Biological Buffers Market Attractiveness Analysis by Country, 2016-2032
- Figure 23: North America Biological Buffers Market Revenue (US$ Mn) (2016-2032)
- Figure 24: North America Biological Buffers Market Revenue (US$ Mn) Comparison by Country (2016-2032)
- Figure 25: North America Biological Buffers Market Revenue (US$ Mn) Comparison by By Type (2016-2032)
- Figure 26: North America Biological Buffers Market Revenue (US$ Mn) Comparison by By End-User (2016-2032)
- Figure 27: North America Biological Buffers Market Y-o-Y Growth Rate Comparison by Country (2016-2032)
- Figure 28: North America Biological Buffers Market Y-o-Y Growth Rate Comparison by By Type (2016-2032)
- Figure 29: North America Biological Buffers Market Y-o-Y Growth Rate Comparison by By End-User (2016-2032)
- Figure 30: North America Biological Buffers Market Share Comparison by Country (2016-2032)
- Figure 31: North America Biological Buffers Market Share Comparison by By Type (2016-2032)
- Figure 32: North America Biological Buffers Market Share Comparison by By End-User (2016-2032)
- Figure 33: Western Europe Biological Buffers Market Revenue (US$ Mn) Market Share by By Typein 2022
- Figure 34: Western Europe Biological Buffers Market Attractiveness Analysis by By Type, 2016-2032
- Figure 35: Western Europe Biological Buffers Market Revenue (US$ Mn) Market Share by By End-Userin 2022
- Figure 36: Western Europe Biological Buffers Market Attractiveness Analysis by By End-User, 2016-2032
- Figure 37: Western Europe Biological Buffers Market Revenue (US$ Mn) Market Share by Country in 2022
- Figure 38: Western Europe Biological Buffers Market Attractiveness Analysis by Country, 2016-2032
- Figure 39: Western Europe Biological Buffers Market Revenue (US$ Mn) (2016-2032)
- Figure 40: Western Europe Biological Buffers Market Revenue (US$ Mn) Comparison by Country (2016-2032)
- Figure 41: Western Europe Biological Buffers Market Revenue (US$ Mn) Comparison by By Type (2016-2032)
- Figure 42: Western Europe Biological Buffers Market Revenue (US$ Mn) Comparison by By End-User (2016-2032)
- Figure 43: Western Europe Biological Buffers Market Y-o-Y Growth Rate Comparison by Country (2016-2032)
- Figure 44: Western Europe Biological Buffers Market Y-o-Y Growth Rate Comparison by By Type (2016-2032)
- Figure 45: Western Europe Biological Buffers Market Y-o-Y Growth Rate Comparison by By End-User (2016-2032)
- Figure 46: Western Europe Biological Buffers Market Share Comparison by Country (2016-2032)
- Figure 47: Western Europe Biological Buffers Market Share Comparison by By Type (2016-2032)
- Figure 48: Western Europe Biological Buffers Market Share Comparison by By End-User (2016-2032)
- Figure 49: Eastern Europe Biological Buffers Market Revenue (US$ Mn) Market Share by By Typein 2022
- Figure 50: Eastern Europe Biological Buffers Market Attractiveness Analysis by By Type, 2016-2032
- Figure 51: Eastern Europe Biological Buffers Market Revenue (US$ Mn) Market Share by By End-Userin 2022
- Figure 52: Eastern Europe Biological Buffers Market Attractiveness Analysis by By End-User, 2016-2032
- Figure 53: Eastern Europe Biological Buffers Market Revenue (US$ Mn) Market Share by Country in 2022
- Figure 54: Eastern Europe Biological Buffers Market Attractiveness Analysis by Country, 2016-2032
- Figure 55: Eastern Europe Biological Buffers Market Revenue (US$ Mn) (2016-2032)
- Figure 56: Eastern Europe Biological Buffers Market Revenue (US$ Mn) Comparison by Country (2016-2032)
- Figure 57: Eastern Europe Biological Buffers Market Revenue (US$ Mn) Comparison by By Type (2016-2032)
- Figure 58: Eastern Europe Biological Buffers Market Revenue (US$ Mn) Comparison by By End-User (2016-2032)
- Figure 59: Eastern Europe Biological Buffers Market Y-o-Y Growth Rate Comparison by Country (2016-2032)
- Figure 60: Eastern Europe Biological Buffers Market Y-o-Y Growth Rate Comparison by By Type (2016-2032)
- Figure 61: Eastern Europe Biological Buffers Market Y-o-Y Growth Rate Comparison by By End-User (2016-2032)
- Figure 62: Eastern Europe Biological Buffers Market Share Comparison by Country (2016-2032)
- Figure 63: Eastern Europe Biological Buffers Market Share Comparison by By Type (2016-2032)
- Figure 64: Eastern Europe Biological Buffers Market Share Comparison by By End-User (2016-2032)
- Figure 65: APAC Biological Buffers Market Revenue (US$ Mn) Market Share by By Typein 2022
- Figure 66: APAC Biological Buffers Market Attractiveness Analysis by By Type, 2016-2032
- Figure 67: APAC Biological Buffers Market Revenue (US$ Mn) Market Share by By End-Userin 2022
- Figure 68: APAC Biological Buffers Market Attractiveness Analysis by By End-User, 2016-2032
- Figure 69: APAC Biological Buffers Market Revenue (US$ Mn) Market Share by Country in 2022
- Figure 70: APAC Biological Buffers Market Attractiveness Analysis by Country, 2016-2032
- Figure 71: APAC Biological Buffers Market Revenue (US$ Mn) (2016-2032)
- Figure 72: APAC Biological Buffers Market Revenue (US$ Mn) Comparison by Country (2016-2032)
- Figure 73: APAC Biological Buffers Market Revenue (US$ Mn) Comparison by By Type (2016-2032)
- Figure 74: APAC Biological Buffers Market Revenue (US$ Mn) Comparison by By End-User (2016-2032)
- Figure 75: APAC Biological Buffers Market Y-o-Y Growth Rate Comparison by Country (2016-2032)
- Figure 76: APAC Biological Buffers Market Y-o-Y Growth Rate Comparison by By Type (2016-2032)
- Figure 77: APAC Biological Buffers Market Y-o-Y Growth Rate Comparison by By End-User (2016-2032)
- Figure 78: APAC Biological Buffers Market Share Comparison by Country (2016-2032)
- Figure 79: APAC Biological Buffers Market Share Comparison by By Type (2016-2032)
- Figure 80: APAC Biological Buffers Market Share Comparison by By End-User (2016-2032)
- Figure 81: Latin America Biological Buffers Market Revenue (US$ Mn) Market Share by By Typein 2022
- Figure 82: Latin America Biological Buffers Market Attractiveness Analysis by By Type, 2016-2032
- Figure 83: Latin America Biological Buffers Market Revenue (US$ Mn) Market Share by By End-Userin 2022
- Figure 84: Latin America Biological Buffers Market Attractiveness Analysis by By End-User, 2016-2032
- Figure 85: Latin America Biological Buffers Market Revenue (US$ Mn) Market Share by Country in 2022
- Figure 86: Latin America Biological Buffers Market Attractiveness Analysis by Country, 2016-2032
- Figure 87: Latin America Biological Buffers Market Revenue (US$ Mn) (2016-2032)
- Figure 88: Latin America Biological Buffers Market Revenue (US$ Mn) Comparison by Country (2016-2032)
- Figure 89: Latin America Biological Buffers Market Revenue (US$ Mn) Comparison by By Type (2016-2032)
- Figure 90: Latin America Biological Buffers Market Revenue (US$ Mn) Comparison by By End-User (2016-2032)
- Figure 91: Latin America Biological Buffers Market Y-o-Y Growth Rate Comparison by Country (2016-2032)
- Figure 92: Latin America Biological Buffers Market Y-o-Y Growth Rate Comparison by By Type (2016-2032)
- Figure 93: Latin America Biological Buffers Market Y-o-Y Growth Rate Comparison by By End-User (2016-2032)
- Figure 94: Latin America Biological Buffers Market Share Comparison by Country (2016-2032)
- Figure 95: Latin America Biological Buffers Market Share Comparison by By Type (2016-2032)
- Figure 96: Latin America Biological Buffers Market Share Comparison by By End-User (2016-2032)
- Figure 97: Middle East & Africa Biological Buffers Market Revenue (US$ Mn) Market Share by By Typein 2022
- Figure 98: Middle East & Africa Biological Buffers Market Attractiveness Analysis by By Type, 2016-2032
- Figure 99: Middle East & Africa Biological Buffers Market Revenue (US$ Mn) Market Share by By End-Userin 2022
- Figure 100: Middle East & Africa Biological Buffers Market Attractiveness Analysis by By End-User, 2016-2032
- Figure 101: Middle East & Africa Biological Buffers Market Revenue (US$ Mn) Market Share by Country in 2022
- Figure 102: Middle East & Africa Biological Buffers Market Attractiveness Analysis by Country, 2016-2032
- Figure 103: Middle East & Africa Biological Buffers Market Revenue (US$ Mn) (2016-2032)
- Figure 104: Middle East & Africa Biological Buffers Market Revenue (US$ Mn) Comparison by Country (2016-2032)
- Figure 105: Middle East & Africa Biological Buffers Market Revenue (US$ Mn) Comparison by By Type (2016-2032)
- Figure 106: Middle East & Africa Biological Buffers Market Revenue (US$ Mn) Comparison by By End-User (2016-2032)
- Figure 107: Middle East & Africa Biological Buffers Market Y-o-Y Growth Rate Comparison by Country (2016-2032)
- Figure 108: Middle East & Africa Biological Buffers Market Y-o-Y Growth Rate Comparison by By Type (2016-2032)
- Figure 109: Middle East & Africa Biological Buffers Market Y-o-Y Growth Rate Comparison by By End-User (2016-2032)
- Figure 110: Middle East & Africa Biological Buffers Market Share Comparison by Country (2016-2032)
- Figure 111: Middle East & Africa Biological Buffers Market Share Comparison by By Type (2016-2032)
- Figure 112: Middle East & Africa Biological Buffers Market Share Comparison by By End-User (2016-2032)
- Table 1: Global Biological Buffers Market Comparison by By Type (2016-2032)
- Table 2: Global Biological Buffers Market Comparison by By End-User (2016-2032)
- Table 3: Global Biological Buffers Market Revenue (US$ Mn) Comparison by Region (2016-2032)
- Table 4: Global Biological Buffers Market Revenue (US$ Mn) (2016-2032)
- Table 5: Global Biological Buffers Market Revenue (US$ Mn) Comparison by Region (2016-2032)
- Table 6: Global Biological Buffers Market Revenue (US$ Mn) Comparison by By Type (2016-2032)
- Table 7: Global Biological Buffers Market Revenue (US$ Mn) Comparison by By End-User (2016-2032)
- Table 8: Global Biological Buffers Market Y-o-Y Growth Rate Comparison by Region (2016-2032)
- Table 9: Global Biological Buffers Market Y-o-Y Growth Rate Comparison by By Type (2016-2032)
- Table 10: Global Biological Buffers Market Y-o-Y Growth Rate Comparison by By End-User (2016-2032)
- Table 11: Global Biological Buffers Market Share Comparison by Region (2016-2032)
- Table 12: Global Biological Buffers Market Share Comparison by By Type (2016-2032)
- Table 13: Global Biological Buffers Market Share Comparison by By End-User (2016-2032)
- Table 14: North America Biological Buffers Market Comparison by By End-User (2016-2032)
- Table 15: North America Biological Buffers Market Revenue (US$ Mn) Comparison by Country (2016-2032)
- Table 16: North America Biological Buffers Market Revenue (US$ Mn) (2016-2032)
- Table 17: North America Biological Buffers Market Revenue (US$ Mn) Comparison by Country (2016-2032)
- Table 18: North America Biological Buffers Market Revenue (US$ Mn) Comparison by By Type (2016-2032)
- Table 19: North America Biological Buffers Market Revenue (US$ Mn) Comparison by By End-User (2016-2032)
- Table 20: North America Biological Buffers Market Y-o-Y Growth Rate Comparison by Country (2016-2032)
- Table 21: North America Biological Buffers Market Y-o-Y Growth Rate Comparison by By Type (2016-2032)
- Table 22: North America Biological Buffers Market Y-o-Y Growth Rate Comparison by By End-User (2016-2032)
- Table 23: North America Biological Buffers Market Share Comparison by Country (2016-2032)
- Table 24: North America Biological Buffers Market Share Comparison by By Type (2016-2032)
- Table 25: North America Biological Buffers Market Share Comparison by By End-User (2016-2032)
- Table 26: Western Europe Biological Buffers Market Comparison by By Type (2016-2032)
- Table 27: Western Europe Biological Buffers Market Comparison by By End-User (2016-2032)
- Table 28: Western Europe Biological Buffers Market Revenue (US$ Mn) Comparison by Country (2016-2032)
- Table 29: Western Europe Biological Buffers Market Revenue (US$ Mn) (2016-2032)
- Table 30: Western Europe Biological Buffers Market Revenue (US$ Mn) Comparison by Country (2016-2032)
- Table 31: Western Europe Biological Buffers Market Revenue (US$ Mn) Comparison by By Type (2016-2032)
- Table 32: Western Europe Biological Buffers Market Revenue (US$ Mn) Comparison by By End-User (2016-2032)
- Table 33: Western Europe Biological Buffers Market Y-o-Y Growth Rate Comparison by Country (2016-2032)
- Table 34: Western Europe Biological Buffers Market Y-o-Y Growth Rate Comparison by By Type (2016-2032)
- Table 35: Western Europe Biological Buffers Market Y-o-Y Growth Rate Comparison by By End-User (2016-2032)
- Table 36: Western Europe Biological Buffers Market Share Comparison by Country (2016-2032)
- Table 37: Western Europe Biological Buffers Market Share Comparison by By Type (2016-2032)
- Table 38: Western Europe Biological Buffers Market Share Comparison by By End-User (2016-2032)
- Table 39: Eastern Europe Biological Buffers Market Comparison by By Type (2016-2032)
- Table 40: Eastern Europe Biological Buffers Market Comparison by By End-User (2016-2032)
- Table 41: Eastern Europe Biological Buffers Market Revenue (US$ Mn) Comparison by Country (2016-2032)
- Table 42: Eastern Europe Biological Buffers Market Revenue (US$ Mn) (2016-2032)
- Table 43: Eastern Europe Biological Buffers Market Revenue (US$ Mn) Comparison by Country (2016-2032)
- Table 44: Eastern Europe Biological Buffers Market Revenue (US$ Mn) Comparison by By Type (2016-2032)
- Table 45: Eastern Europe Biological Buffers Market Revenue (US$ Mn) Comparison by By End-User (2016-2032)
- Table 46: Eastern Europe Biological Buffers Market Y-o-Y Growth Rate Comparison by Country (2016-2032)
- Table 47: Eastern Europe Biological Buffers Market Y-o-Y Growth Rate Comparison by By Type (2016-2032)
- Table 48: Eastern Europe Biological Buffers Market Y-o-Y Growth Rate Comparison by By End-User (2016-2032)
- Table 49: Eastern Europe Biological Buffers Market Share Comparison by Country (2016-2032)
- Table 50: Eastern Europe Biological Buffers Market Share Comparison by By Type (2016-2032)
- Table 51: Eastern Europe Biological Buffers Market Share Comparison by By End-User (2016-2032)
- Table 52: APAC Biological Buffers Market Comparison by By Type (2016-2032)
- Table 53: APAC Biological Buffers Market Comparison by By End-User (2016-2032)
- Table 54: APAC Biological Buffers Market Revenue (US$ Mn) Comparison by Country (2016-2032)
- Table 55: APAC Biological Buffers Market Revenue (US$ Mn) (2016-2032)
- Table 56: APAC Biological Buffers Market Revenue (US$ Mn) Comparison by Country (2016-2032)
- Table 57: APAC Biological Buffers Market Revenue (US$ Mn) Comparison by By Type (2016-2032)
- Table 58: APAC Biological Buffers Market Revenue (US$ Mn) Comparison by By End-User (2016-2032)
- Table 59: APAC Biological Buffers Market Y-o-Y Growth Rate Comparison by Country (2016-2032)
- Table 60: APAC Biological Buffers Market Y-o-Y Growth Rate Comparison by By Type (2016-2032)
- Table 61: APAC Biological Buffers Market Y-o-Y Growth Rate Comparison by By End-User (2016-2032)
- Table 62: APAC Biological Buffers Market Share Comparison by Country (2016-2032)
- Table 63: APAC Biological Buffers Market Share Comparison by By Type (2016-2032)
- Table 64: APAC Biological Buffers Market Share Comparison by By End-User (2016-2032)
- Table 65: Latin America Biological Buffers Market Comparison by By Type (2016-2032)
- Table 66: Latin America Biological Buffers Market Comparison by By End-User (2016-2032)
- Table 67: Latin America Biological Buffers Market Revenue (US$ Mn) Comparison by Country (2016-2032)
- Table 68: Latin America Biological Buffers Market Revenue (US$ Mn) (2016-2032)
- Table 69: Latin America Biological Buffers Market Revenue (US$ Mn) Comparison by Country (2016-2032)
- Table 70: Latin America Biological Buffers Market Revenue (US$ Mn) Comparison by By Type (2016-2032)
- Table 71: Latin America Biological Buffers Market Revenue (US$ Mn) Comparison by By End-User (2016-2032)
- Table 72: Latin America Biological Buffers Market Y-o-Y Growth Rate Comparison by Country (2016-2032)
- Table 73: Latin America Biological Buffers Market Y-o-Y Growth Rate Comparison by By Type (2016-2032)
- Table 74: Latin America Biological Buffers Market Y-o-Y Growth Rate Comparison by By End-User (2016-2032)
- Table 75: Latin America Biological Buffers Market Share Comparison by Country (2016-2032)
- Table 76: Latin America Biological Buffers Market Share Comparison by By Type (2016-2032)
- Table 77: Latin America Biological Buffers Market Share Comparison by By End-User (2016-2032)
- Table 78: Middle East & Africa Biological Buffers Market Comparison by By Type (2016-2032)
- Table 79: Middle East & Africa Biological Buffers Market Comparison by By End-User (2016-2032)
- Table 80: Middle East & Africa Biological Buffers Market Revenue (US$ Mn) Comparison by Country (2016-2032)
- Table 81: Middle East & Africa Biological Buffers Market Revenue (US$ Mn) (2016-2032)
- Table 82: Middle East & Africa Biological Buffers Market Revenue (US$ Mn) Comparison by Country (2016-2032)
- Table 83: Middle East & Africa Biological Buffers Market Revenue (US$ Mn) Comparison by By Type (2016-2032)
- Table 84: Middle East & Africa Biological Buffers Market Revenue (US$ Mn) Comparison by By End-User (2016-2032)
- Table 85: Middle East & Africa Biological Buffers Market Y-o-Y Growth Rate Comparison by Country (2016-2032)
- Table 86: Middle East & Africa Biological Buffers Market Y-o-Y Growth Rate Comparison by By Type (2016-2032)
- Table 87: Middle East & Africa Biological Buffers Market Y-o-Y Growth Rate Comparison by By End-User (2016-2032)
- Table 88: Middle East & Africa Biological Buffers Market Share Comparison by Country (2016-2032)
- Table 89: Middle East & Africa Biological Buffers Market Share Comparison by By Type (2016-2032)
- Table 90: Middle East & Africa Biological Buffers Market Share Comparison by By End-User (2016-2032)
- 1. Executive Summary
Inquiry Form
Why Choose Us
- 360 Degree Approach
- Growth Consulting
- 24/7 Research Support
- Comprehensive-Level of Customization
- Competitive Intelligence
- Single-Country/ Region Intelligence
- Post-Sale Service Assistance
- Access to Lead Analysts
- Available in PDF, Excel, Word/ PPT
Request for Customization
OUR CLIENTS
Don't just take our word. We are trusted by these great companies!