
Bio-Based Polyethylene Terephthalate Market By Type(From Biomass, From Bio-Based Precursors), By Manufacturing Process(Extrusion, Injection Molding, Other), By Application(Bottles, Foam, Other), By End-User(Packaging, Consumer Goods), By Region And Companies - Industry Segment Outlook, Market Assessment, Competition Scenario, Trends, And Forecast 2023-2032
-
7039
-
Jul 2023
-
189
-


-
This report was compiled by Shreyas Rokade Shreyas Rokade is a seasoned Research Analyst with CMFE, bringing extensive expertise in market research and consulting, with a strong background in Chemical Engineering. Correspondence Team Lead-CMFE Linkedin | Detailed Market research Methodology Our methodology involves a mix of primary research, including interviews with leading mental health experts, and secondary research from reputable medical journals and databases. View Detailed Methodology Page
-
Quick Navigation
Report Overview
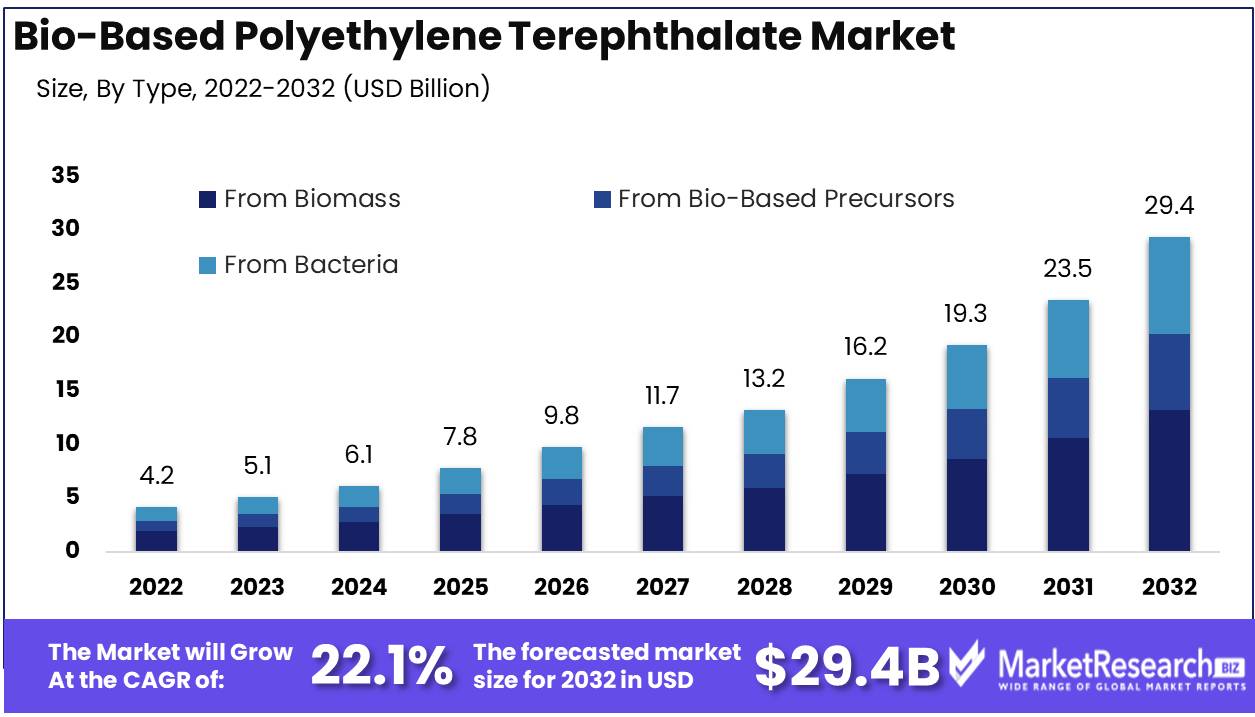
Bio-Based Polyethylene Terephthalate Market size is expected to be worth around USD 29.4 Bn by 2032 from USD 4.2 Bn in 2022, growing at a CAGR of 22.1% during the forecast period from 2023 to 2032.
Bio-based PET also referred to as renewable PET, is derived from renewable resources like maize, sugarcane, and beet pulp. It is a sustainable replacement for conventional PET, which is derived from fossil fuels. The objective of the bio-based PET market is to reduce greenhouse gas emissions, reduce dependence on nonrenewable resources, and promote a circular economy. This market intends to revolutionize industries by offering sustainable packaging solutions, decreasing carbon footprints, and fostering a greener future.
The significance and benefits of bio-based PET are numerous. It offers a significant reduction in carbon emissions as its primary benefit. Bio-based PET reduces reliance on fossil fuels, a significant contributor to greenhouse gas emissions, by using renewable resources. In addition, bio-based PET is recyclable and can be used to construct a closed-loop system in which the material is reused or repurposed after its initial application. This contributes to a circular economy and waste reduction.
The growth and prominence of the bio-based PET market have been propelled by notable innovations. Companies have been investing in research and development to enhance the properties and efficacy of bio-based PET, making it a viable alternative to conventional PET. To meet industry demands, innovations include enhancing its durability, strength, and thermal resistance. These developments have paved the way for the pervasive adoption of bio-based PET across numerous industries.
Across industries, substantial investments and incorporation of bio-based PET into products and services have been observed. Specifically, the packaging industry has adopted this sustainable material due to shifting consumer preferences and government regulations. Numerous prominent companies have integrated bio-based PET into their product lines, resulting in increased demand and market growth.
Driving factors
Increasing Demand for Eco-Friendly and Sustainable Packaging
The bio-based polyethylene terephthalate market (PET) is experiencing significant growth due to the rising demand for sustainable and eco-friendly packaging materials. As consumers become more environmentally conscious, there is a growing preference for products derived from renewable resources and with a lower environmental impact.
Growing awareness of the negative effects of conventional plastic packaging on the environment is one of the most important factors propelling this rising demand. The production of conventional plastics using fossil fuels results in the emission of greenhouse gases and contributes to global warming. In addition, the improper disposal of plastic waste has led to land and water pollution.
Growth of the Beverage and Food Industries
The growth of the beverage and food industries is further propelling the bio-based PET market. These industries are significant consumers of packaging materials and are always seeking innovative and sustainable packaging solutions. The increasing demand for packaged food and beverages, particularly in rapidly developing economies, has led to an increase in the production and consumption of bio-based PET.
Bio-Based PET Production Technologies
Another important factor propelling its market growth is advancements in bio-based production technologies. Researchers and industry professionals are continually attempting to enhance the efficacy and scalability of bio-based PET production processes. This has led to the development of new methods and technologies that permit the production of bio-based PET at a lower cost and with a smaller environmental footprint.
Expanding Focus on Reducing Carbon Footprint
The increasing emphasis on carbon footprint reduction across industries has provided a significant boost to the bio-based PET market. As part of their sustainability initiatives, governments and regulatory agencies actively promote the use of bio-based materials. As part of their corporate social responsibility initiatives, many businesses are also embracing sustainability and actively seeking eco-friendly packaging solutions, such as bio-based PET.
Restraining Factors
Cost Considerations in Relation to Conventional PET
Comparing the potential cost of bio-based PET to that of conventional PET is one of the most significant obstacles to the expansion of PET production. The production of bio-based PET requires complex manufacturing processes and renewable feedstock, which are typically more expensive than petroleum-based materials. In addition, conventional PET is currently more cost-effective due to economies of scale in its production. With technological advancements and increased demand, bio-based PET production can attain economies of scale, resulting in reduced costs and enhanced competitiveness.
Restricted Access to Bio-based PET Feedstock
The limited availability of bio-based PET feedstock is an additional issue that must be resolved. A sustainable and abundant supply of feedstock, such as plant-based sugars or agricultural refuse, is required for the production of bio-based PET. However, the availability and scalability of these feedstocks can be affected by a number of variables, such as climate change, land use, and competition from other industries. To assure a stable supply chain for bio-based PET, investments in R&D and collaborations with agricultural sectors are crucial. Implementing efficient agricultural methods and investigating alternative feedstock sources can assist in overcoming this constraining factor.
Type Analysis
Biomass dominates the bio-based polyethylene terephthalate market pet.
In recent years, the bio-based polyethylene terephthalate market (PET) has undergone a significant shift, with an increased emphasis on sustainability and the use of renewable resources. The From Biomass segment has emerged as the market's dominant growth-driving force, becoming one of the market's key participants.
Biomass refers to the production of bio-based PET from biomass sources such as maize, sugarcane, and other organic substances. This process entails converting these biomass sources into bio-based intermediates, which are subsequently utilized to produce PET resin. The use of biomass as a feedstock offers several advantages over traditional fossil fuel-based sources, including a reduction in greenhouse gas emissions and a lower reliance on limited resources.
The adoption of From Biomass has been especially prevalent in emerging economies, where accelerated economic growth has created a greater demand for sustainable and eco-friendly products. As these economies continue to expand, the demand for PET and other plastic products is expected to rise, driving the demand for sustainable alternatives.
Manufacturing Process Analysis
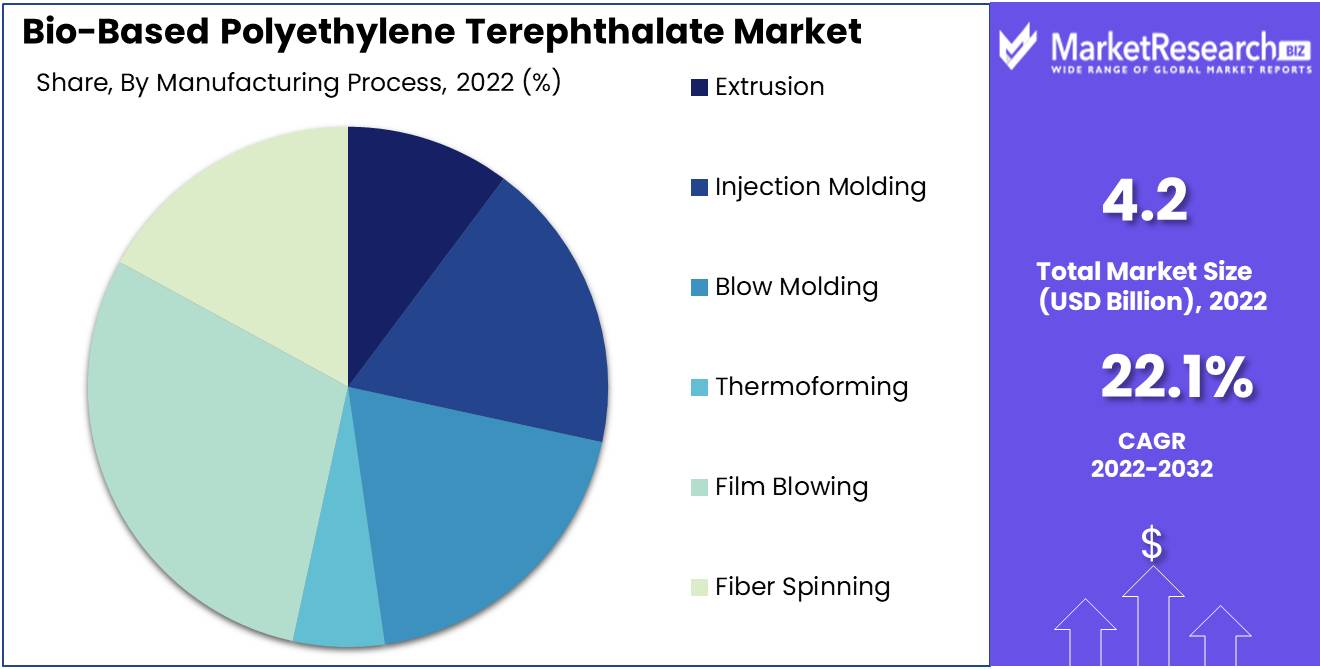
Film Blowing dominates the bio-based polyethylene terephthalate pet market.
Film Blowing has emerged as the dominant manufacturing technique in the Bio-Based PET market. The process of film blowing entails the extrusion of molten PET through a narrow slit, which is then cooled and solidified to form a thin, flexible film. This film has a wide range of applications, including packaging, agriculture, and construction.
Economic development in emerging economies has created a greater demand for packaging materials and other plastic products, which has driven the adoption of Film Blowing. As these economies continue to expand, there is a growing demand for lightweight, cost-effective, and environmentally favorable flexible packaging solutions. These requirements are satisfied by film blowing, making it an attractive option for manufacturers and end-users.
In the packaging industry, in particular, consumer trends and behaviors have also influenced the adoption of Film Blowing. Increasing consumer demand for convenience and usability in packaging has led to a shift toward flexible packaging solutions. Film blowing provides numerous benefits in terms of product protection, storage life, and aesthetics, making it a popular option among manufacturers and consumers.
Application Analysis
Bottles Segment Dominates the bio-based polyethylene terephthalate PET Market.
The Bottles Segment of the bio-based PET market has emerged as the dominant application. Bio-based PET bottles have a number of advantages over traditional petroleum-based PET bottles, including lower carbon emissions and less reliance on finite resources. The Bottles Segment includes a vast array of products, including water bottles, beverage bottles, and containers for personal care products.
The adoption of the Bottles Segment has been driven by economic growth in emergent economies, where rising disposable incomes and shifting lifestyle preferences have led to an increase in demand for packaged beverages and personal care products. As these economies continue to expand, the demand for bio-based PET bottles is expected to increase, driven by factors such as sustainability, convenience, and a concentration on healthier lifestyles.
Trends and behaviors of consumers have also played a significant role in driving the Bottles Segment's adoption. Increasingly, consumers search for products that reflect their values and promote sustainable practices. This has led to a shift in consumer preference for bio-based PET bottles, which are perceived to be more environmentally beneficial and safer for human health than traditional plastic bottles.
Key Market Segments
By Type
- From Biomass
- From Bio-Based Precursors
- From Bacteria
By Manufacturing Process
- Extrusion
- Injection Molding
- Blow Molding
- Thermoforming
- Film Blowing
- Fiber Spinning
By Application
- Bottles
- Foam
- Pressure Sensitive Adhesive Tape
- Substrate in Thin Film Solar Cells
- Cosmetics
By End-User
- Packaging
- Consumer Goods
- Automotive
Growth Opportunity
Utilizing Sustainability Initiatives to Penetrate Emerging Markets
The expansion of bio-based PET into emerging markets with sustainability initiatives represents an additional growth opportunity. These markets, which are characterized by rapid population growth and growing environmental concerns, provide a substantial customer base for sustainable packaging solutions. By targeting these markets and positioning bio-based PET as an eco-friendly alternative to conventional plastics, companies can gain a competitive edge and access new revenue streams.
Collaboration with Packaging Manufacturers and Brand Owners
Collaboration with brand proprietors and packaging manufacturers is essential for promoting the market adoption of bio-based PET. Companies can create a demand-pull effect that promotes the ubiquitous use of bio-based PET by partnering with influential brands that prioritize sustainability. In addition, close collaboration with packaging manufacturers enables the creation of innovative and customized packaging solutions made from bio-based PET, thereby enhancing its market potential.
Expansion of Applications for Bio-Based PET in Diverse Industries
Another growth opportunity is presented by the diversification of bio-based PET applications across industries. While packaging remains the primary use for bio-based PET, the automotive, textile, and consumer products industries have unrealized potential. Companies that investigate and invest in these new applications can take advantage of the rising demand for sustainable materials and expand their market reach.
Raising consumer awareness and educating them on bio-based packaging
Raising consumer awareness and educating them on the advantages of bio-based packaging is a crucial aspect of unleashing the growth potential of bio-based PET. Many consumers are still unaware of the environmental consequences of conventional plastics and the alternatives that are available. By engaging in educational campaigns and promoting the benefits of bio-based packaging, companies can increase consumer demand and adjust market preferences toward sustainable options.
Latest Trends
Bio-based PET Demand in the Beverage and Personal Care Industries
The beverage and personal care industries play a vital role in propelling the demand for PET bottles and containers made from bio-based materials. Consumers are becoming more aware of the environmental impact of traditional plastic packaging. This awareness has increased the demand for bio-based alternatives in these industries. With a substantially smaller carbon footprint than traditional PET, bio-based PET offers comparable performance characteristics. In addition, bio-based PET is recyclable, making it an ideal material for businesses committed to minimizing their environmental impact.
Use of biobased PET for food packaging
The food packaging industry is another significant sector where bio-based PET is making an impression. With rising food safety and sustainability concerns, there is a growing demand for packaging materials that can preserve product freshness while minimizing environmental impact. These criteria are met by bio-based PET, which provides a sustainable and dependable solution for food packaging. It is an excellent choice for preserving food quality and extending shelf life due to its superior barrier properties. In addition, the use of bio-based PET in food packaging reduces reliance on fossil fuels, thereby contributing to a greener and more sustainable future.
An increase in initiatives and partnerships promoting bio-based PET
The rapid development of the bio-based PET market can be partially attributed to the numerous partnerships and initiatives promoting its use. Diverse industry actors, including packaging manufacturers, beverage companies, and environmental organizations, have joined forces to promote the adoption of bio-based PET and increase public awareness of its benefits. These partnerships seek to educate consumers, collaborate on research and development, and establish a sustainable bio-based PET supply chain. Through collaborative efforts, the industry is striving to increase the adoption of bio-based PET, thereby ensuring its continued growth and impact.
Adoption of Bio-based PET in Models of the Circular Economy
In recent years, the concept of a circular economy has garnered considerable traction, highlighting the importance of minimizing waste and maximizing resource efficiency. In accordance with the principles of a circular economy, bio-based PET is a renewable and recyclable alternative to traditional polymers. By incorporating bio-based PET into models of the circular economy, we can reduce our reliance on fossil fuels and increase the use of sustainable materials. This integration ensures that bio-based PET continues to be an essential component of a circular economy, thereby contributing to the long-term sustainability of our planet.
Regional Analysis
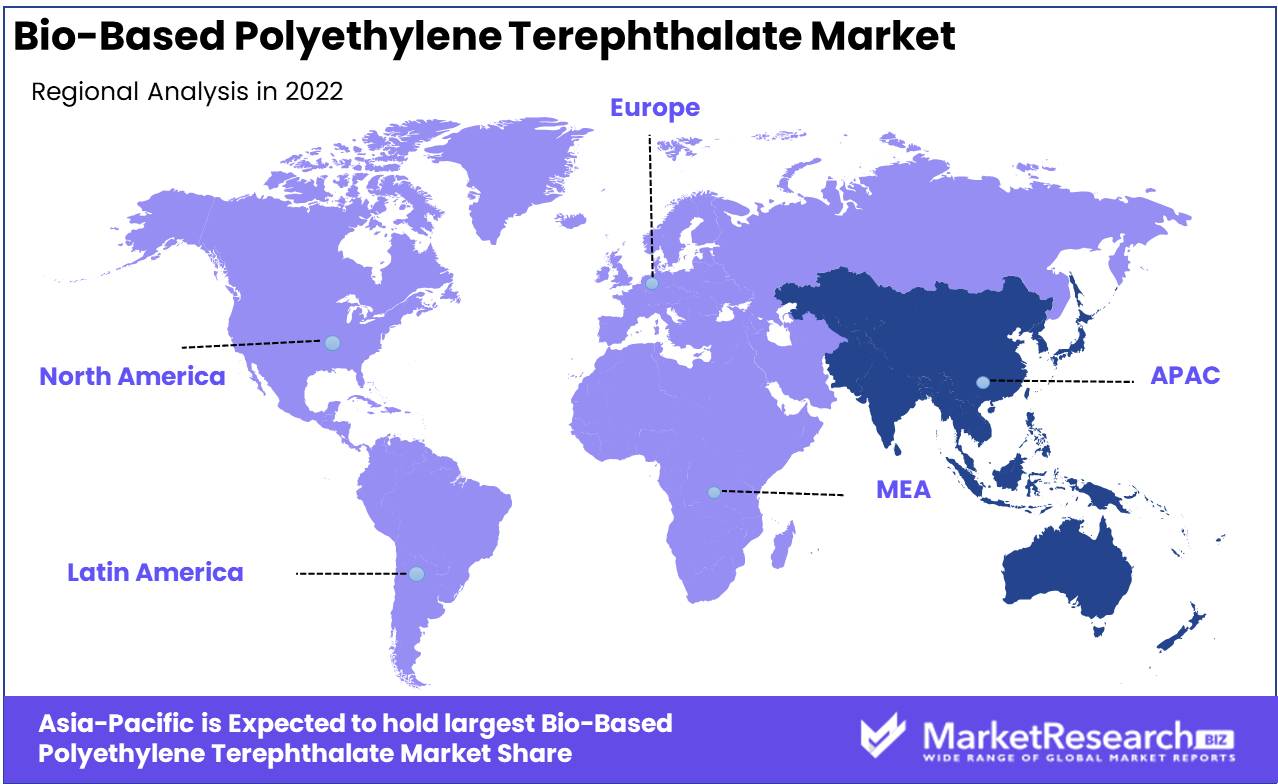
Asia-Pacific Region Dominates the Bio-based Polyethylene Terephthalate (PET) Market
The Asia-Pacific region has emerged as the market leader for bio-based polyethylene terephthalate (PET) worldwide. This region has witnessed a significant transition towards sustainable and eco-friendly materials due to its rapid economic growth, rising population, and increasing environmental concerns. PET, or polyethylene terephthalate, is a type of polyester extensively used in the packaging industry due to its superior mechanical properties, transparency, and recyclability.
In recent years, demand for bio-based PET has increased due to its reduced carbon footprint and renewable nature. In contrast to conventional PET, which is derived from fossil fuels, Bio-Based PET is made from renewable resources like sugarcane, maize, and other agricultural feedstocks. The Asia-Pacific region has embraced this eco-friendly alternative, leading to a surge in the production and consumption of bio-based PET.
The vast availability of feedstock in the Asia-Pacific region is one of the primary reasons for the region's bio-based PET market dominance. Countries with vast agricultural resources, such as China, India, Thailand, and Indonesia, are suitable for bio-based PET production. The abundance of sugarcane and other agricultural commodities provides a dependable and affordable resource for the production of bio-based PET.
Key Regions and Countries
North America
- US
- Canada
- Mexico
Western Europe
- Germany
- France
- The UK
- Spain
- Italy
- Portugal
- Ireland
- Austria
- Switzerland
- Benelux
- Nordic
- Rest of Western Europe
Eastern Europe
- Russia
- Poland
- The Czech Republic
- Greece
- Rest of Eastern Europe
APAC
- China
- Japan
- South Korea
- India
- Australia & New Zealand
- Indonesia
- Malaysia
- Philippines
- Singapore
- Thailand
- Vietnam
- Rest of APAC
Latin America
- Brazil
- Colombia
- Chile
- Argentina
- Costa Rica
- Rest of Latin America
Middle East & Africa
- Algeria
- Egypt
- Israel
- Kuwait
- Nigeria
- Saudi Arabia
- South Africa
- Turkey
- United Arab Emirates
- Rest of MEA
Avery Dennison Corporation in the United States is a prominent player in the bio-based PET market. Utilizing bio-based films and adhesives for a variety of applications, the company emphasizes sustainable solutions. Avery Dennison Corporation has established itself as a leading provider of sustainable packaging solutions for industries such as food and beverage, personal care, and logistics by offering a vast array of products.
Dupont, another prominent player in the bio-based PET market, takes pride in its innovative and advanced materials. Utilizing its expertise in polymer science and materials engineering, the company offers an array of bio-based PET products. Dupont's commitment to sustainability is demonstrated by its efforts to develop eco-friendly alternatives to conventional PET, thereby reducing the environmental impact of packaging and other applications.
Dow, a household name in the chemical industry, is an active participant in the bio-based PET market. The company is committed to developing sustainable materials, such as PET polymers made from bio-based sources. Dow's emphasis on research and development enables the company to innovate and produce products that not only satisfy market demands but also contribute to a sustainable future. Their commitment to sustainability distinguishes them in this extremely competitive market.
3M, a renowned manufacturer of a wide variety of products, has also made significant advances in the bio-based PET market. The company provides innovative solutions for a variety of industries with a strong emphasis on sustainability. Customers have eco-friendly options without sacrificing efficacy thanks to 3M's Bio-based PET films and adhesives. The company's commitment to sustainable practices positions them as a dominant market player.
Top Key Players in the bio-based polyethylene terephthalate Pet Market
- AVERY DENNISON CORPORATION (U.S.)
- Dupont (U.S.)
- Dow (U.S.)
- 3M (U.S.)
- H.B. Fuller Company (U.S.)
- Sealed Air (U.S.)
- SABIC (Saudi Arabia)
- Arkema (France)
- LyondellBasell (Netherlands)
- Exxon Mobil Corporation (U.S.)
- Mitsui Chemicals Inc.
- (Japan)
- Braskem (Brazil)
- TotalEnergies (France)
- Novamont SpA (Italy)
- SOLVAY (Belgium)
- DAIKIN (Japan)
- Biome Bioplastics (UK)
- PTT Global Chemical Public Company Limited (Thailand)
- KURARAY CO. Ltd. (Japan)
Recent Development
- In 2023, BASF, one of the world's largest chemical companies, is preparing for a game-changing surge by announcing plans to launch an innovative line of bio-based PET. BASF intends to redefine industry standards by introducing a more environmentally friendly solution, which represents a significant breakthrough in the field of sustainable materials.
- In 2022, DuPont, a company renowned for its expertise in developing high-performance polymers, made an important announcement. The company announced plans to expand its already remarkable bio-based PET portfolio, demonstrating its commitment to sustainability.
- In 2021, Nestlé, the world's largest food and beverage company, announced plans to launch a new line of beverage bottles made from bio-based PET. This innovative strategy is consistent with Nestlé's commitment to reducing its environmental footprint and enhancing the overall sustainability of its packaging.
Report Scope
Report Features Description Market Value (2022) USD 4.2 Bn Forecast Revenue (2032) USD 29.4 Bn CAGR (2023-2032) 22.1% Base Year for Estimation 2022 Historic Period 2016-2022 Forecast Period 2023-2032 Report Coverage Revenue Forecast, Market Dynamics, COVID-19 Impact, Competitive Landscape, Recent Developments Segments Covered By Type(From Biomass, From Bio-Based Precursors), By Manufacturing Process(Extrusion, Injection Molding, Other), By Application(Bottles, Foam, Other), By End-User(Packaging, Consumer Goods) Regional Analysis North America – The US, Canada, & Mexico; Western Europe – Germany, France, The UK, Spain, Italy, Portugal, Ireland, Austria, Switzerland, Benelux, Nordic, & Rest of Western Europe; Eastern Europe – Russia, Poland, The Czech Republic, Greece, & Rest of Eastern Europe; APAC – China, Japan, South Korea, India, Australia & New Zealand, Indonesia, Malaysia, Philippines, Singapore, Thailand, Vietnam, & Rest of APAC; Latin America – Brazil, Colombia, Chile, Argentina, Costa Rica, & Rest of Latin America; Middle East & Africa – Algeria, Egypt, Israel, Kuwait, Nigeria, Saudi Arabia, South Africa, Turkey, United Arab Emirates, & Rest of MEA Competitive Landscape AVERY DENNISON CORPORATION (U.S.), Dupont (U.S.), Dow (U.S.), 3M (U.S.), H.B. Fuller Company (U.S.), Sealed Air (U.S.), SABIC (Saudi Arabia), Arkema (France), LyondellBasell (Netherlands), Exxon Mobil Corporation (U.S.), Mitsui Chemicals Inc., (Japan), Braskem (Brazil), TotalEnergies (France), Novamont SpA (Italy), SOLVAY (Belgium), DAIKIN (Japan), Biome Bioplastics (UK), PTT Global Chemical Public Company Limited (Thailand), KURARAY CO. Ltd. (Japan) Customization Scope Customization for segments, region/country-level will be provided. Moreover, additional customization can be done based on the requirements. Purchase Options We have three licenses to opt for: Single User License, Multi-User License (Up to 5 Users), Corporate Use License (Unlimited User and Printable PDF) -
- 1. Executive Summary
- 1.1. Definition
- 1.2. Taxonomy
- 1.3. Research Scope
- 1.4. Key Analysis
- 1.5. Key Findings by Major Segments
- 1.6. Top strategies by Major Players
- 2. Global Packaged Coconut Water Market Overview
- 2.1. Packaged Coconut Water Market Dynamics
- 2.1.1. Drivers
- 2.1.2. Opportunities
- 2.1.3. Restraints
- 2.1.4. Challenges
- 2.2. Macro-economic Factors
- 2.3. Regulatory Framework
- 2.4. Market Investment Feasibility Index
- 2.5. PEST Analysis
- 2.6. PORTER’S Five Force Analysis
- 2.7. Drivers & Restraints Impact Analysis
- 2.8. Industry Chain Analysis
- 2.9. Cost Structure Analysis
- 2.10. Marketing Strategy
- 2.11. Russia-Ukraine War Impact Analysis
- 2.12. Opportunity Map Analysis
- 2.13. Market Competition Scenario Analysis
- 2.14. Product Life Cycle Analysis
- 2.15. Opportunity Orbits
- 2.16. Manufacturer Intensity Map
- 2.17. Major Companies sales by Value & Volume
- 2.1. Packaged Coconut Water Market Dynamics
- 3. Global Packaged Coconut Water Market Analysis, Opportunity and Forecast, 2016-2032
- 3.1. Global Packaged Coconut Water Market Analysis, 2016-2021
- 3.2. Global Packaged Coconut Water Market Opportunity and Forecast, 2023-2032
- 3.3. Global Packaged Coconut Water Market Analysis, Opportunity and Forecast, By By Type, 2016-2032
- 3.3.1. Global Packaged Coconut Water Market Analysis by By Type: Introduction
- 3.3.2. Market Size Absolute $ Opportunity Analysis and Forecast, By By Type, 2016-2032
- 3.3.3. From Biomass
- 3.3.4. From Bio-Based Precursors
- 3.3.5. From Bacteria
- 3.4. Global Packaged Coconut Water Market Analysis, Opportunity and Forecast, By By Manufacturing Process, 2016-2032
- 3.4.1. Global Packaged Coconut Water Market Analysis by By Manufacturing Process: Introduction
- 3.4.2. Market Size Absolute $ Opportunity Analysis and Forecast, By By Manufacturing Process, 2016-2032
- 3.4.3. Extrusion
- 3.4.4. Injection Molding
- 3.4.5. Blow Molding
- 3.4.6. Thermoforming
- 3.4.7. Film Blowing
- 3.4.8. Fiber Spinning
- 3.5. Global Packaged Coconut Water Market Analysis, Opportunity and Forecast, By By Application, 2016-2032
- 3.5.1. Global Packaged Coconut Water Market Analysis by By Application: Introduction
- 3.5.2. Market Size Absolute $ Opportunity Analysis and Forecast, By By Application, 2016-2032
- 3.5.3. Bottles
- 3.5.4. Foam
- 3.5.5. Pressure Sensitive Adhesive Tape
- 3.5.6. Substrate in Thin Film Solar Cells
- 3.5.7. Cosmetics
- 3.6. Global Packaged Coconut Water Market Analysis, Opportunity and Forecast, By By End-User, 2016-2032
- 3.6.1. Global Packaged Coconut Water Market Analysis by By End-User: Introduction
- 3.6.2. Market Size Absolute $ Opportunity Analysis and Forecast, By By End-User, 2016-2032
- 3.6.3. Packaging
- 3.6.4. Consumer Goods
- 3.6.5. Automotive
- 4. North America Packaged Coconut Water Market Analysis, Opportunity and Forecast, 2016-2032
- 4.1. North America Packaged Coconut Water Market Analysis, 2016-2021
- 4.2. North America Packaged Coconut Water Market Opportunity and Forecast, 2023-2032
- 4.3. North America Packaged Coconut Water Market Analysis, Opportunity and Forecast, By By Type, 2016-2032
- 4.3.1. North America Packaged Coconut Water Market Analysis by By Type: Introduction
- 4.3.2. Market Size Absolute $ Opportunity Analysis and Forecast, By By Type, 2016-2032
- 4.3.3. From Biomass
- 4.3.4. From Bio-Based Precursors
- 4.3.5. From Bacteria
- 4.4. North America Packaged Coconut Water Market Analysis, Opportunity and Forecast, By By Manufacturing Process, 2016-2032
- 4.4.1. North America Packaged Coconut Water Market Analysis by By Manufacturing Process: Introduction
- 4.4.2. Market Size Absolute $ Opportunity Analysis and Forecast, By By Manufacturing Process, 2016-2032
- 4.4.3. Extrusion
- 4.4.4. Injection Molding
- 4.4.5. Blow Molding
- 4.4.6. Thermoforming
- 4.4.7. Film Blowing
- 4.4.8. Fiber Spinning
- 4.5. North America Packaged Coconut Water Market Analysis, Opportunity and Forecast, By By Application, 2016-2032
- 4.5.1. North America Packaged Coconut Water Market Analysis by By Application: Introduction
- 4.5.2. Market Size Absolute $ Opportunity Analysis and Forecast, By By Application, 2016-2032
- 4.5.3. Bottles
- 4.5.4. Foam
- 4.5.5. Pressure Sensitive Adhesive Tape
- 4.5.6. Substrate in Thin Film Solar Cells
- 4.5.7. Cosmetics
- 4.6. North America Packaged Coconut Water Market Analysis, Opportunity and Forecast, By By End-User, 2016-2032
- 4.6.1. North America Packaged Coconut Water Market Analysis by By End-User: Introduction
- 4.6.2. Market Size Absolute $ Opportunity Analysis and Forecast, By By End-User, 2016-2032
- 4.6.3. Packaging
- 4.6.4. Consumer Goods
- 4.6.5. Automotive
- 4.7. North America Packaged Coconut Water Market Analysis, Opportunity and Forecast, By Country , 2016-2032
- 4.7.1. North America Packaged Coconut Water Market Analysis by Country : Introduction
- 4.7.2. Market Size Absolute $ Opportunity Analysis and Forecast, Country , 2016-2032
- 4.7.2.1. The US
- 4.7.2.2. Canada
- 4.7.2.3. Mexico
- 5. Western Europe Packaged Coconut Water Market Analysis, Opportunity and Forecast, 2016-2032
- 5.1. Western Europe Packaged Coconut Water Market Analysis, 2016-2021
- 5.2. Western Europe Packaged Coconut Water Market Opportunity and Forecast, 2023-2032
- 5.3. Western Europe Packaged Coconut Water Market Analysis, Opportunity and Forecast, By By Type, 2016-2032
- 5.3.1. Western Europe Packaged Coconut Water Market Analysis by By Type: Introduction
- 5.3.2. Market Size Absolute $ Opportunity Analysis and Forecast, By By Type, 2016-2032
- 5.3.3. From Biomass
- 5.3.4. From Bio-Based Precursors
- 5.3.5. From Bacteria
- 5.4. Western Europe Packaged Coconut Water Market Analysis, Opportunity and Forecast, By By Manufacturing Process, 2016-2032
- 5.4.1. Western Europe Packaged Coconut Water Market Analysis by By Manufacturing Process: Introduction
- 5.4.2. Market Size Absolute $ Opportunity Analysis and Forecast, By By Manufacturing Process, 2016-2032
- 5.4.3. Extrusion
- 5.4.4. Injection Molding
- 5.4.5. Blow Molding
- 5.4.6. Thermoforming
- 5.4.7. Film Blowing
- 5.4.8. Fiber Spinning
- 5.5. Western Europe Packaged Coconut Water Market Analysis, Opportunity and Forecast, By By Application, 2016-2032
- 5.5.1. Western Europe Packaged Coconut Water Market Analysis by By Application: Introduction
- 5.5.2. Market Size Absolute $ Opportunity Analysis and Forecast, By By Application, 2016-2032
- 5.5.3. Bottles
- 5.5.4. Foam
- 5.5.5. Pressure Sensitive Adhesive Tape
- 5.5.6. Substrate in Thin Film Solar Cells
- 5.5.7. Cosmetics
- 5.6. Western Europe Packaged Coconut Water Market Analysis, Opportunity and Forecast, By By End-User, 2016-2032
- 5.6.1. Western Europe Packaged Coconut Water Market Analysis by By End-User: Introduction
- 5.6.2. Market Size Absolute $ Opportunity Analysis and Forecast, By By End-User, 2016-2032
- 5.6.3. Packaging
- 5.6.4. Consumer Goods
- 5.6.5. Automotive
- 5.7. Western Europe Packaged Coconut Water Market Analysis, Opportunity and Forecast, By Country , 2016-2032
- 5.7.1. Western Europe Packaged Coconut Water Market Analysis by Country : Introduction
- 5.7.2. Market Size Absolute $ Opportunity Analysis and Forecast, Country , 2016-2032
- 5.7.2.1. Germany
- 5.7.2.2. France
- 5.7.2.3. The UK
- 5.7.2.4. Spain
- 5.7.2.5. Italy
- 5.7.2.6. Portugal
- 5.7.2.7. Ireland
- 5.7.2.8. Austria
- 5.7.2.9. Switzerland
- 5.7.2.10. Benelux
- 5.7.2.11. Nordic
- 5.7.2.12. Rest of Western Europe
- 6. Eastern Europe Packaged Coconut Water Market Analysis, Opportunity and Forecast, 2016-2032
- 6.1. Eastern Europe Packaged Coconut Water Market Analysis, 2016-2021
- 6.2. Eastern Europe Packaged Coconut Water Market Opportunity and Forecast, 2023-2032
- 6.3. Eastern Europe Packaged Coconut Water Market Analysis, Opportunity and Forecast, By By Type, 2016-2032
- 6.3.1. Eastern Europe Packaged Coconut Water Market Analysis by By Type: Introduction
- 6.3.2. Market Size Absolute $ Opportunity Analysis and Forecast, By By Type, 2016-2032
- 6.3.3. From Biomass
- 6.3.4. From Bio-Based Precursors
- 6.3.5. From Bacteria
- 6.4. Eastern Europe Packaged Coconut Water Market Analysis, Opportunity and Forecast, By By Manufacturing Process, 2016-2032
- 6.4.1. Eastern Europe Packaged Coconut Water Market Analysis by By Manufacturing Process: Introduction
- 6.4.2. Market Size Absolute $ Opportunity Analysis and Forecast, By By Manufacturing Process, 2016-2032
- 6.4.3. Extrusion
- 6.4.4. Injection Molding
- 6.4.5. Blow Molding
- 6.4.6. Thermoforming
- 6.4.7. Film Blowing
- 6.4.8. Fiber Spinning
- 6.5. Eastern Europe Packaged Coconut Water Market Analysis, Opportunity and Forecast, By By Application, 2016-2032
- 6.5.1. Eastern Europe Packaged Coconut Water Market Analysis by By Application: Introduction
- 6.5.2. Market Size Absolute $ Opportunity Analysis and Forecast, By By Application, 2016-2032
- 6.5.3. Bottles
- 6.5.4. Foam
- 6.5.5. Pressure Sensitive Adhesive Tape
- 6.5.6. Substrate in Thin Film Solar Cells
- 6.5.7. Cosmetics
- 6.6. Eastern Europe Packaged Coconut Water Market Analysis, Opportunity and Forecast, By By End-User, 2016-2032
- 6.6.1. Eastern Europe Packaged Coconut Water Market Analysis by By End-User: Introduction
- 6.6.2. Market Size Absolute $ Opportunity Analysis and Forecast, By By End-User, 2016-2032
- 6.6.3. Packaging
- 6.6.4. Consumer Goods
- 6.6.5. Automotive
- 6.7. Eastern Europe Packaged Coconut Water Market Analysis, Opportunity and Forecast, By Country , 2016-2032
- 6.7.1. Eastern Europe Packaged Coconut Water Market Analysis by Country : Introduction
- 6.7.2. Market Size Absolute $ Opportunity Analysis and Forecast, Country , 2016-2032
- 6.7.2.1. Russia
- 6.7.2.2. Poland
- 6.7.2.3. The Czech Republic
- 6.7.2.4. Greece
- 6.7.2.5. Rest of Eastern Europe
- 7. APAC Packaged Coconut Water Market Analysis, Opportunity and Forecast, 2016-2032
- 7.1. APAC Packaged Coconut Water Market Analysis, 2016-2021
- 7.2. APAC Packaged Coconut Water Market Opportunity and Forecast, 2023-2032
- 7.3. APAC Packaged Coconut Water Market Analysis, Opportunity and Forecast, By By Type, 2016-2032
- 7.3.1. APAC Packaged Coconut Water Market Analysis by By Type: Introduction
- 7.3.2. Market Size Absolute $ Opportunity Analysis and Forecast, By By Type, 2016-2032
- 7.3.3. From Biomass
- 7.3.4. From Bio-Based Precursors
- 7.3.5. From Bacteria
- 7.4. APAC Packaged Coconut Water Market Analysis, Opportunity and Forecast, By By Manufacturing Process, 2016-2032
- 7.4.1. APAC Packaged Coconut Water Market Analysis by By Manufacturing Process: Introduction
- 7.4.2. Market Size Absolute $ Opportunity Analysis and Forecast, By By Manufacturing Process, 2016-2032
- 7.4.3. Extrusion
- 7.4.4. Injection Molding
- 7.4.5. Blow Molding
- 7.4.6. Thermoforming
- 7.4.7. Film Blowing
- 7.4.8. Fiber Spinning
- 7.5. APAC Packaged Coconut Water Market Analysis, Opportunity and Forecast, By By Application, 2016-2032
- 7.5.1. APAC Packaged Coconut Water Market Analysis by By Application: Introduction
- 7.5.2. Market Size Absolute $ Opportunity Analysis and Forecast, By By Application, 2016-2032
- 7.5.3. Bottles
- 7.5.4. Foam
- 7.5.5. Pressure Sensitive Adhesive Tape
- 7.5.6. Substrate in Thin Film Solar Cells
- 7.5.7. Cosmetics
- 7.6. APAC Packaged Coconut Water Market Analysis, Opportunity and Forecast, By By End-User, 2016-2032
- 7.6.1. APAC Packaged Coconut Water Market Analysis by By End-User: Introduction
- 7.6.2. Market Size Absolute $ Opportunity Analysis and Forecast, By By End-User, 2016-2032
- 7.6.3. Packaging
- 7.6.4. Consumer Goods
- 7.6.5. Automotive
- 7.7. APAC Packaged Coconut Water Market Analysis, Opportunity and Forecast, By Country , 2016-2032
- 7.7.1. APAC Packaged Coconut Water Market Analysis by Country : Introduction
- 7.7.2. Market Size Absolute $ Opportunity Analysis and Forecast, Country , 2016-2032
- 7.7.2.1. China
- 7.7.2.2. Japan
- 7.7.2.3. South Korea
- 7.7.2.4. India
- 7.7.2.5. Australia & New Zeland
- 7.7.2.6. Indonesia
- 7.7.2.7. Malaysia
- 7.7.2.8. Philippines
- 7.7.2.9. Singapore
- 7.7.2.10. Thailand
- 7.7.2.11. Vietnam
- 7.7.2.12. Rest of APAC
- 8. Latin America Packaged Coconut Water Market Analysis, Opportunity and Forecast, 2016-2032
- 8.1. Latin America Packaged Coconut Water Market Analysis, 2016-2021
- 8.2. Latin America Packaged Coconut Water Market Opportunity and Forecast, 2023-2032
- 8.3. Latin America Packaged Coconut Water Market Analysis, Opportunity and Forecast, By By Type, 2016-2032
- 8.3.1. Latin America Packaged Coconut Water Market Analysis by By Type: Introduction
- 8.3.2. Market Size Absolute $ Opportunity Analysis and Forecast, By By Type, 2016-2032
- 8.3.3. From Biomass
- 8.3.4. From Bio-Based Precursors
- 8.3.5. From Bacteria
- 8.4. Latin America Packaged Coconut Water Market Analysis, Opportunity and Forecast, By By Manufacturing Process, 2016-2032
- 8.4.1. Latin America Packaged Coconut Water Market Analysis by By Manufacturing Process: Introduction
- 8.4.2. Market Size Absolute $ Opportunity Analysis and Forecast, By By Manufacturing Process, 2016-2032
- 8.4.3. Extrusion
- 8.4.4. Injection Molding
- 8.4.5. Blow Molding
- 8.4.6. Thermoforming
- 8.4.7. Film Blowing
- 8.4.8. Fiber Spinning
- 8.5. Latin America Packaged Coconut Water Market Analysis, Opportunity and Forecast, By By Application, 2016-2032
- 8.5.1. Latin America Packaged Coconut Water Market Analysis by By Application: Introduction
- 8.5.2. Market Size Absolute $ Opportunity Analysis and Forecast, By By Application, 2016-2032
- 8.5.3. Bottles
- 8.5.4. Foam
- 8.5.5. Pressure Sensitive Adhesive Tape
- 8.5.6. Substrate in Thin Film Solar Cells
- 8.5.7. Cosmetics
- 8.6. Latin America Packaged Coconut Water Market Analysis, Opportunity and Forecast, By By End-User, 2016-2032
- 8.6.1. Latin America Packaged Coconut Water Market Analysis by By End-User: Introduction
- 8.6.2. Market Size Absolute $ Opportunity Analysis and Forecast, By By End-User, 2016-2032
- 8.6.3. Packaging
- 8.6.4. Consumer Goods
- 8.6.5. Automotive
- 8.7. Latin America Packaged Coconut Water Market Analysis, Opportunity and Forecast, By Country , 2016-2032
- 8.7.1. Latin America Packaged Coconut Water Market Analysis by Country : Introduction
- 8.7.2. Market Size Absolute $ Opportunity Analysis and Forecast, Country , 2016-2032
- 8.7.2.1. Brazil
- 8.7.2.2. Colombia
- 8.7.2.3. Chile
- 8.7.2.4. Argentina
- 8.7.2.5. Costa Rica
- 8.7.2.6. Rest of Latin America
- 9. Middle East & Africa Packaged Coconut Water Market Analysis, Opportunity and Forecast, 2016-2032
- 9.1. Middle East & Africa Packaged Coconut Water Market Analysis, 2016-2021
- 9.2. Middle East & Africa Packaged Coconut Water Market Opportunity and Forecast, 2023-2032
- 9.3. Middle East & Africa Packaged Coconut Water Market Analysis, Opportunity and Forecast, By By Type, 2016-2032
- 9.3.1. Middle East & Africa Packaged Coconut Water Market Analysis by By Type: Introduction
- 9.3.2. Market Size Absolute $ Opportunity Analysis and Forecast, By By Type, 2016-2032
- 9.3.3. From Biomass
- 9.3.4. From Bio-Based Precursors
- 9.3.5. From Bacteria
- 9.4. Middle East & Africa Packaged Coconut Water Market Analysis, Opportunity and Forecast, By By Manufacturing Process, 2016-2032
- 9.4.1. Middle East & Africa Packaged Coconut Water Market Analysis by By Manufacturing Process: Introduction
- 9.4.2. Market Size Absolute $ Opportunity Analysis and Forecast, By By Manufacturing Process, 2016-2032
- 9.4.3. Extrusion
- 9.4.4. Injection Molding
- 9.4.5. Blow Molding
- 9.4.6. Thermoforming
- 9.4.7. Film Blowing
- 9.4.8. Fiber Spinning
- 9.5. Middle East & Africa Packaged Coconut Water Market Analysis, Opportunity and Forecast, By By Application, 2016-2032
- 9.5.1. Middle East & Africa Packaged Coconut Water Market Analysis by By Application: Introduction
- 9.5.2. Market Size Absolute $ Opportunity Analysis and Forecast, By By Application, 2016-2032
- 9.5.3. Bottles
- 9.5.4. Foam
- 9.5.5. Pressure Sensitive Adhesive Tape
- 9.5.6. Substrate in Thin Film Solar Cells
- 9.5.7. Cosmetics
- 9.6. Middle East & Africa Packaged Coconut Water Market Analysis, Opportunity and Forecast, By By End-User, 2016-2032
- 9.6.1. Middle East & Africa Packaged Coconut Water Market Analysis by By End-User: Introduction
- 9.6.2. Market Size Absolute $ Opportunity Analysis and Forecast, By By End-User, 2016-2032
- 9.6.3. Packaging
- 9.6.4. Consumer Goods
- 9.6.5. Automotive
- 9.7. Middle East & Africa Packaged Coconut Water Market Analysis, Opportunity and Forecast, By Country , 2016-2032
- 9.7.1. Middle East & Africa Packaged Coconut Water Market Analysis by Country : Introduction
- 9.7.2. Market Size Absolute $ Opportunity Analysis and Forecast, Country , 2016-2032
- 9.7.2.1. Algeria
- 9.7.2.2. Egypt
- 9.7.2.3. Israel
- 9.7.2.4. Kuwait
- 9.7.2.5. Nigeria
- 9.7.2.6. Saudi Arabia
- 9.7.2.7. South Africa
- 9.7.2.8. Turkey
- 9.7.2.9. The UAE
- 9.7.2.10. Rest of MEA
- 10. Global Packaged Coconut Water Market Analysis, Opportunity and Forecast, By Region , 2016-2032
- 10.1. Global Packaged Coconut Water Market Analysis by Region : Introduction
- 10.2. Market Size Absolute $ Opportunity Analysis and Forecast, By Region , 2016-2032
- 10.2.1. North America
- 10.2.2. Western Europe
- 10.2.3. Eastern Europe
- 10.2.4. APAC
- 10.2.5. Latin America
- 10.2.6. Middle East & Africa
- 11. Global Packaged Coconut Water Market Competitive Landscape, Market Share Analysis, and Company Profiles
- 11.1. Market Share Analysis
- 11.2. Company Profiles
- 11.3. AVERY DENNISON CORPORATION (U.S.)
- 11.3.1. Company Overview
- 11.3.2. Financial Highlights
- 11.3.3. Product Portfolio
- 11.3.4. SWOT Analysis
- 11.3.5. Key Strategies and Developments
- 11.4. Dupont (U.S.)
- 11.4.1. Company Overview
- 11.4.2. Financial Highlights
- 11.4.3. Product Portfolio
- 11.4.4. SWOT Analysis
- 11.4.5. Key Strategies and Developments
- 11.5. Dow (U.S.)
- 11.5.1. Company Overview
- 11.5.2. Financial Highlights
- 11.5.3. Product Portfolio
- 11.5.4. SWOT Analysis
- 11.5.5. Key Strategies and Developments
- 11.6. 3M (U.S.)
- 11.6.1. Company Overview
- 11.6.2. Financial Highlights
- 11.6.3. Product Portfolio
- 11.6.4. SWOT Analysis
- 11.6.5. Key Strategies and Developments
- 11.7. H.B. Fuller Company (U.S.)
- 11.7.1. Company Overview
- 11.7.2. Financial Highlights
- 11.7.3. Product Portfolio
- 11.7.4. SWOT Analysis
- 11.7.5. Key Strategies and Developments
- 11.8. Sealed Air (U.S.)
- 11.8.1. Company Overview
- 11.8.2. Financial Highlights
- 11.8.3. Product Portfolio
- 11.8.4. SWOT Analysis
- 11.8.5. Key Strategies and Developments
- 11.9. SABIC (Saudi Arabia)
- 11.9.1. Company Overview
- 11.9.2. Financial Highlights
- 11.9.3. Product Portfolio
- 11.9.4. SWOT Analysis
- 11.9.5. Key Strategies and Developments
- 11.10. Arkema (France)
- 11.10.1. Company Overview
- 11.10.2. Financial Highlights
- 11.10.3. Product Portfolio
- 11.10.4. SWOT Analysis
- 11.10.5. Key Strategies and Developments
- 11.11. LyondellBasell (Netherlands)
- 11.11.1. Company Overview
- 11.11.2. Financial Highlights
- 11.11.3. Product Portfolio
- 11.11.4. SWOT Analysis
- 11.11.5. Key Strategies and Developments
- 11.12. Exxon Mobil Corporation (U.S.)
- 11.12.1. Company Overview
- 11.12.2. Financial Highlights
- 11.12.3. Product Portfolio
- 11.12.4. SWOT Analysis
- 11.12.5. Key Strategies and Developments
- 11.13. Mitsui Chemicals Inc.
- 11.13.1. Company Overview
- 11.13.2. Financial Highlights
- 11.13.3. Product Portfolio
- 11.13.4. SWOT Analysis
- 11.13.5. Key Strategies and Developments
- 11.14. (Japan)
- 11.14.1. Company Overview
- 11.14.2. Financial Highlights
- 11.14.3. Product Portfolio
- 11.14.4. SWOT Analysis
- 11.14.5. Key Strategies and Developments
- 11.15. Braskem (Brazil)
- 11.15.1. Company Overview
- 11.15.2. Financial Highlights
- 11.15.3. Product Portfolio
- 11.15.4. SWOT Analysis
- 11.15.5. Key Strategies and Developments
- 11.16. TotalEnergies (France)
- 11.16.1. Company Overview
- 11.16.2. Financial Highlights
- 11.16.3. Product Portfolio
- 11.16.4. SWOT Analysis
- 11.16.5. Key Strategies and Developments
- 11.17. Novamont SpA (Italy)
- 11.17.1. Company Overview
- 11.17.2. Financial Highlights
- 11.17.3. Product Portfolio
- 11.17.4. SWOT Analysis
- 11.17.5. Key Strategies and Developments
- 11.18. SOLVAY (Belgium)
- 11.18.1. Company Overview
- 11.18.2. Financial Highlights
- 11.18.3. Product Portfolio
- 11.18.4. SWOT Analysis
- 11.18.5. Key Strategies and Developments
- 11.19. DAIKIN (Japan)
- 11.19.1. Company Overview
- 11.19.2. Financial Highlights
- 11.19.3. Product Portfolio
- 11.19.4. SWOT Analysis
- 11.19.5. Key Strategies and Developments
- 11.20. Biome Bioplastics (UK)
- 11.20.1. Company Overview
- 11.20.2. Financial Highlights
- 11.20.3. Product Portfolio
- 11.20.4. SWOT Analysis
- 11.20.5. Key Strategies and Developments
- 11.21. PTT Global Chemical Public Company Limited (Thailand)
- 11.21.1. Company Overview
- 11.21.2. Financial Highlights
- 11.21.3. Product Portfolio
- 11.21.4. SWOT Analysis
- 11.21.5. Key Strategies and Developments
- 11.22. KURARAY CO. Ltd. (Japan)
- 11.22.1. Company Overview
- 11.22.2. Financial Highlights
- 11.22.3. Product Portfolio
- 11.22.4. SWOT Analysis
- 11.22.5. Key Strategies and Developments
- 12. Assumptions and Acronyms
- 13. Research Methodology
- 14. Contact
- List of Figures
- Figure 1: Global Packaged Coconut Water Market Revenue (US$ Mn) Market Share by Type in 2022
- Figure 2: Global Packaged Coconut Water Market Attractiveness Analysis by Type, 2016-2032
- Figure 3: Global Packaged Coconut Water Market Revenue (US$ Mn) Market Share by Manufacturing Processin 2022
- Figure 4: Global Packaged Coconut Water Market Attractiveness Analysis by Manufacturing Process, 2016-2032
- Figure 5: Global Packaged Coconut Water Market Revenue (US$ Mn) Market Share by Applicationin 2022
- Figure 6: Global Packaged Coconut Water Market Attractiveness Analysis by Application, 2016-2032
- Figure 7: Global Packaged Coconut Water Market Revenue (US$ Mn) Market Share by End-Userin 2022
- Figure 8: Global Packaged Coconut Water Market Attractiveness Analysis by End-User, 2016-2032
- Figure 9: Global Packaged Coconut Water Market Revenue (US$ Mn) Market Share by Region in 2022
- Figure 10: Global Packaged Coconut Water Market Attractiveness Analysis by Region, 2016-2032
- Figure 11: Global Packaged Coconut Water Market Revenue (US$ Mn) (2016-2032)
- Figure 12: Global Packaged Coconut Water Market Revenue (US$ Mn) Comparison by Region (2016-2032)
- Figure 13: Global Packaged Coconut Water Market Revenue (US$ Mn) Comparison by Type (2016-2032)
- Figure 14: Global Packaged Coconut Water Market Revenue (US$ Mn) Comparison by Manufacturing Process (2016-2032)
- Figure 15: Global Packaged Coconut Water Market Revenue (US$ Mn) Comparison by Application (2016-2032)
- Figure 16: Global Packaged Coconut Water Market Revenue (US$ Mn) Comparison by End-User (2016-2032)
- Figure 17: Global Packaged Coconut Water Market Y-o-Y Growth Rate Comparison by Region (2016-2032)
- Figure 18: Global Packaged Coconut Water Market Y-o-Y Growth Rate Comparison by Type (2016-2032)
- Figure 19: Global Packaged Coconut Water Market Y-o-Y Growth Rate Comparison by Manufacturing Process (2016-2032)
- Figure 20: Global Packaged Coconut Water Market Y-o-Y Growth Rate Comparison by Application (2016-2032)
- Figure 21: Global Packaged Coconut Water Market Y-o-Y Growth Rate Comparison by End-User (2016-2032)
- Figure 22: Global Packaged Coconut Water Market Share Comparison by Region (2016-2032)
- Figure 23: Global Packaged Coconut Water Market Share Comparison by Type (2016-2032)
- Figure 24: Global Packaged Coconut Water Market Share Comparison by Manufacturing Process (2016-2032)
- Figure 25: Global Packaged Coconut Water Market Share Comparison by Application (2016-2032)
- Figure 26: Global Packaged Coconut Water Market Share Comparison by End-User (2016-2032)
- Figure 27: North America Packaged Coconut Water Market Revenue (US$ Mn) Market Share by Typein 2022
- Figure 28: North America Packaged Coconut Water Market Attractiveness Analysis by Type, 2016-2032
- Figure 29: North America Packaged Coconut Water Market Revenue (US$ Mn) Market Share by Manufacturing Processin 2022
- Figure 30: North America Packaged Coconut Water Market Attractiveness Analysis by Manufacturing Process, 2016-2032
- Figure 31: North America Packaged Coconut Water Market Revenue (US$ Mn) Market Share by Applicationin 2022
- Figure 32: North America Packaged Coconut Water Market Attractiveness Analysis by Application, 2016-2032
- Figure 33: North America Packaged Coconut Water Market Revenue (US$ Mn) Market Share by End-Userin 2022
- Figure 34: North America Packaged Coconut Water Market Attractiveness Analysis by End-User, 2016-2032
- Figure 35: North America Packaged Coconut Water Market Revenue (US$ Mn) Market Share by Country in 2022
- Figure 36: North America Packaged Coconut Water Market Attractiveness Analysis by Country, 2016-2032
- Figure 37: North America Packaged Coconut Water Market Revenue (US$ Mn) (2016-2032)
- Figure 38: North America Packaged Coconut Water Market Revenue (US$ Mn) Comparison by Country (2016-2032)
- Figure 39: North America Packaged Coconut Water Market Revenue (US$ Mn) Comparison by Type (2016-2032)
- Figure 40: North America Packaged Coconut Water Market Revenue (US$ Mn) Comparison by Manufacturing Process (2016-2032)
- Figure 41: North America Packaged Coconut Water Market Revenue (US$ Mn) Comparison by Application (2016-2032)
- Figure 42: North America Packaged Coconut Water Market Revenue (US$ Mn) Comparison by End-User (2016-2032)
- Figure 43: North America Packaged Coconut Water Market Y-o-Y Growth Rate Comparison by Country (2016-2032)
- Figure 44: North America Packaged Coconut Water Market Y-o-Y Growth Rate Comparison by Type (2016-2032)
- Figure 45: North America Packaged Coconut Water Market Y-o-Y Growth Rate Comparison by Manufacturing Process (2016-2032)
- Figure 46: North America Packaged Coconut Water Market Y-o-Y Growth Rate Comparison by Application (2016-2032)
- Figure 47: North America Packaged Coconut Water Market Y-o-Y Growth Rate Comparison by End-User (2016-2032)
- Figure 48: North America Packaged Coconut Water Market Share Comparison by Country (2016-2032)
- Figure 49: North America Packaged Coconut Water Market Share Comparison by Type (2016-2032)
- Figure 50: North America Packaged Coconut Water Market Share Comparison by Manufacturing Process (2016-2032)
- Figure 51: North America Packaged Coconut Water Market Share Comparison by Application (2016-2032)
- Figure 52: North America Packaged Coconut Water Market Share Comparison by End-User (2016-2032)
- Figure 53: Western Europe Packaged Coconut Water Market Revenue (US$ Mn) Market Share by Typein 2022
- Figure 54: Western Europe Packaged Coconut Water Market Attractiveness Analysis by Type, 2016-2032
- Figure 55: Western Europe Packaged Coconut Water Market Revenue (US$ Mn) Market Share by Manufacturing Processin 2022
- Figure 56: Western Europe Packaged Coconut Water Market Attractiveness Analysis by Manufacturing Process, 2016-2032
- Figure 57: Western Europe Packaged Coconut Water Market Revenue (US$ Mn) Market Share by Applicationin 2022
- Figure 58: Western Europe Packaged Coconut Water Market Attractiveness Analysis by Application, 2016-2032
- Figure 59: Western Europe Packaged Coconut Water Market Revenue (US$ Mn) Market Share by End-Userin 2022
- Figure 60: Western Europe Packaged Coconut Water Market Attractiveness Analysis by End-User, 2016-2032
- Figure 61: Western Europe Packaged Coconut Water Market Revenue (US$ Mn) Market Share by Country in 2022
- Figure 62: Western Europe Packaged Coconut Water Market Attractiveness Analysis by Country, 2016-2032
- Figure 63: Western Europe Packaged Coconut Water Market Revenue (US$ Mn) (2016-2032)
- Figure 64: Western Europe Packaged Coconut Water Market Revenue (US$ Mn) Comparison by Country (2016-2032)
- Figure 65: Western Europe Packaged Coconut Water Market Revenue (US$ Mn) Comparison by Type (2016-2032)
- Figure 66: Western Europe Packaged Coconut Water Market Revenue (US$ Mn) Comparison by Manufacturing Process (2016-2032)
- Figure 67: Western Europe Packaged Coconut Water Market Revenue (US$ Mn) Comparison by Application (2016-2032)
- Figure 68: Western Europe Packaged Coconut Water Market Revenue (US$ Mn) Comparison by End-User (2016-2032)
- Figure 69: Western Europe Packaged Coconut Water Market Y-o-Y Growth Rate Comparison by Country (2016-2032)
- Figure 70: Western Europe Packaged Coconut Water Market Y-o-Y Growth Rate Comparison by Type (2016-2032)
- Figure 71: Western Europe Packaged Coconut Water Market Y-o-Y Growth Rate Comparison by Manufacturing Process (2016-2032)
- Figure 72: Western Europe Packaged Coconut Water Market Y-o-Y Growth Rate Comparison by Application (2016-2032)
- Figure 73: Western Europe Packaged Coconut Water Market Y-o-Y Growth Rate Comparison by End-User (2016-2032)
- Figure 74: Western Europe Packaged Coconut Water Market Share Comparison by Country (2016-2032)
- Figure 75: Western Europe Packaged Coconut Water Market Share Comparison by Type (2016-2032)
- Figure 76: Western Europe Packaged Coconut Water Market Share Comparison by Manufacturing Process (2016-2032)
- Figure 77: Western Europe Packaged Coconut Water Market Share Comparison by Application (2016-2032)
- Figure 78: Western Europe Packaged Coconut Water Market Share Comparison by End-User (2016-2032)
- Figure 79: Eastern Europe Packaged Coconut Water Market Revenue (US$ Mn) Market Share by Typein 2022
- Figure 80: Eastern Europe Packaged Coconut Water Market Attractiveness Analysis by Type, 2016-2032
- Figure 81: Eastern Europe Packaged Coconut Water Market Revenue (US$ Mn) Market Share by Manufacturing Processin 2022
- Figure 82: Eastern Europe Packaged Coconut Water Market Attractiveness Analysis by Manufacturing Process, 2016-2032
- Figure 83: Eastern Europe Packaged Coconut Water Market Revenue (US$ Mn) Market Share by Applicationin 2022
- Figure 84: Eastern Europe Packaged Coconut Water Market Attractiveness Analysis by Application, 2016-2032
- Figure 85: Eastern Europe Packaged Coconut Water Market Revenue (US$ Mn) Market Share by End-Userin 2022
- Figure 86: Eastern Europe Packaged Coconut Water Market Attractiveness Analysis by End-User, 2016-2032
- Figure 87: Eastern Europe Packaged Coconut Water Market Revenue (US$ Mn) Market Share by Country in 2022
- Figure 88: Eastern Europe Packaged Coconut Water Market Attractiveness Analysis by Country, 2016-2032
- Figure 89: Eastern Europe Packaged Coconut Water Market Revenue (US$ Mn) (2016-2032)
- Figure 90: Eastern Europe Packaged Coconut Water Market Revenue (US$ Mn) Comparison by Country (2016-2032)
- Figure 91: Eastern Europe Packaged Coconut Water Market Revenue (US$ Mn) Comparison by Type (2016-2032)
- Figure 92: Eastern Europe Packaged Coconut Water Market Revenue (US$ Mn) Comparison by Manufacturing Process (2016-2032)
- Figure 93: Eastern Europe Packaged Coconut Water Market Revenue (US$ Mn) Comparison by Application (2016-2032)
- Figure 94: Eastern Europe Packaged Coconut Water Market Revenue (US$ Mn) Comparison by End-User (2016-2032)
- Figure 95: Eastern Europe Packaged Coconut Water Market Y-o-Y Growth Rate Comparison by Country (2016-2032)
- Figure 96: Eastern Europe Packaged Coconut Water Market Y-o-Y Growth Rate Comparison by Type (2016-2032)
- Figure 97: Eastern Europe Packaged Coconut Water Market Y-o-Y Growth Rate Comparison by Manufacturing Process (2016-2032)
- Figure 98: Eastern Europe Packaged Coconut Water Market Y-o-Y Growth Rate Comparison by Application (2016-2032)
- Figure 99: Eastern Europe Packaged Coconut Water Market Y-o-Y Growth Rate Comparison by End-User (2016-2032)
- Figure 100: Eastern Europe Packaged Coconut Water Market Share Comparison by Country (2016-2032)
- Figure 101: Eastern Europe Packaged Coconut Water Market Share Comparison by Type (2016-2032)
- Figure 102: Eastern Europe Packaged Coconut Water Market Share Comparison by Manufacturing Process (2016-2032)
- Figure 103: Eastern Europe Packaged Coconut Water Market Share Comparison by Application (2016-2032)
- Figure 104: Eastern Europe Packaged Coconut Water Market Share Comparison by End-User (2016-2032)
- Figure 105: APAC Packaged Coconut Water Market Revenue (US$ Mn) Market Share by Typein 2022
- Figure 106: APAC Packaged Coconut Water Market Attractiveness Analysis by Type, 2016-2032
- Figure 107: APAC Packaged Coconut Water Market Revenue (US$ Mn) Market Share by Manufacturing Processin 2022
- Figure 108: APAC Packaged Coconut Water Market Attractiveness Analysis by Manufacturing Process, 2016-2032
- Figure 109: APAC Packaged Coconut Water Market Revenue (US$ Mn) Market Share by Applicationin 2022
- Figure 110: APAC Packaged Coconut Water Market Attractiveness Analysis by Application, 2016-2032
- Figure 111: APAC Packaged Coconut Water Market Revenue (US$ Mn) Market Share by End-Userin 2022
- Figure 112: APAC Packaged Coconut Water Market Attractiveness Analysis by End-User, 2016-2032
- Figure 113: APAC Packaged Coconut Water Market Revenue (US$ Mn) Market Share by Country in 2022
- Figure 114: APAC Packaged Coconut Water Market Attractiveness Analysis by Country, 2016-2032
- Figure 115: APAC Packaged Coconut Water Market Revenue (US$ Mn) (2016-2032)
- Figure 116: APAC Packaged Coconut Water Market Revenue (US$ Mn) Comparison by Country (2016-2032)
- Figure 117: APAC Packaged Coconut Water Market Revenue (US$ Mn) Comparison by Type (2016-2032)
- Figure 118: APAC Packaged Coconut Water Market Revenue (US$ Mn) Comparison by Manufacturing Process (2016-2032)
- Figure 119: APAC Packaged Coconut Water Market Revenue (US$ Mn) Comparison by Application (2016-2032)
- Figure 120: APAC Packaged Coconut Water Market Revenue (US$ Mn) Comparison by End-User (2016-2032)
- Figure 121: APAC Packaged Coconut Water Market Y-o-Y Growth Rate Comparison by Country (2016-2032)
- Figure 122: APAC Packaged Coconut Water Market Y-o-Y Growth Rate Comparison by Type (2016-2032)
- Figure 123: APAC Packaged Coconut Water Market Y-o-Y Growth Rate Comparison by Manufacturing Process (2016-2032)
- Figure 124: APAC Packaged Coconut Water Market Y-o-Y Growth Rate Comparison by Application (2016-2032)
- Figure 125: APAC Packaged Coconut Water Market Y-o-Y Growth Rate Comparison by End-User (2016-2032)
- Figure 126: APAC Packaged Coconut Water Market Share Comparison by Country (2016-2032)
- Figure 127: APAC Packaged Coconut Water Market Share Comparison by Type (2016-2032)
- Figure 128: APAC Packaged Coconut Water Market Share Comparison by Manufacturing Process (2016-2032)
- Figure 129: APAC Packaged Coconut Water Market Share Comparison by Application (2016-2032)
- Figure 130: APAC Packaged Coconut Water Market Share Comparison by End-User (2016-2032)
- Figure 131: Latin America Packaged Coconut Water Market Revenue (US$ Mn) Market Share by Typein 2022
- Figure 132: Latin America Packaged Coconut Water Market Attractiveness Analysis by Type, 2016-2032
- Figure 133: Latin America Packaged Coconut Water Market Revenue (US$ Mn) Market Share by Manufacturing Processin 2022
- Figure 134: Latin America Packaged Coconut Water Market Attractiveness Analysis by Manufacturing Process, 2016-2032
- Figure 135: Latin America Packaged Coconut Water Market Revenue (US$ Mn) Market Share by Applicationin 2022
- Figure 136: Latin America Packaged Coconut Water Market Attractiveness Analysis by Application, 2016-2032
- Figure 137: Latin America Packaged Coconut Water Market Revenue (US$ Mn) Market Share by End-Userin 2022
- Figure 138: Latin America Packaged Coconut Water Market Attractiveness Analysis by End-User, 2016-2032
- Figure 139: Latin America Packaged Coconut Water Market Revenue (US$ Mn) Market Share by Country in 2022
- Figure 140: Latin America Packaged Coconut Water Market Attractiveness Analysis by Country, 2016-2032
- Figure 141: Latin America Packaged Coconut Water Market Revenue (US$ Mn) (2016-2032)
- Figure 142: Latin America Packaged Coconut Water Market Revenue (US$ Mn) Comparison by Country (2016-2032)
- Figure 143: Latin America Packaged Coconut Water Market Revenue (US$ Mn) Comparison by Type (2016-2032)
- Figure 144: Latin America Packaged Coconut Water Market Revenue (US$ Mn) Comparison by Manufacturing Process (2016-2032)
- Figure 145: Latin America Packaged Coconut Water Market Revenue (US$ Mn) Comparison by Application (2016-2032)
- Figure 146: Latin America Packaged Coconut Water Market Revenue (US$ Mn) Comparison by End-User (2016-2032)
- Figure 147: Latin America Packaged Coconut Water Market Y-o-Y Growth Rate Comparison by Country (2016-2032)
- Figure 148: Latin America Packaged Coconut Water Market Y-o-Y Growth Rate Comparison by Type (2016-2032)
- Figure 149: Latin America Packaged Coconut Water Market Y-o-Y Growth Rate Comparison by Manufacturing Process (2016-2032)
- Figure 150: Latin America Packaged Coconut Water Market Y-o-Y Growth Rate Comparison by Application (2016-2032)
- Figure 151: Latin America Packaged Coconut Water Market Y-o-Y Growth Rate Comparison by End-User (2016-2032)
- Figure 152: Latin America Packaged Coconut Water Market Share Comparison by Country (2016-2032)
- Figure 153: Latin America Packaged Coconut Water Market Share Comparison by Type (2016-2032)
- Figure 154: Latin America Packaged Coconut Water Market Share Comparison by Manufacturing Process (2016-2032)
- Figure 155: Latin America Packaged Coconut Water Market Share Comparison by Application (2016-2032)
- Figure 156: Latin America Packaged Coconut Water Market Share Comparison by End-User (2016-2032)
- Figure 157: Middle East & Africa Packaged Coconut Water Market Revenue (US$ Mn) Market Share by Typein 2022
- Figure 158: Middle East & Africa Packaged Coconut Water Market Attractiveness Analysis by Type, 2016-2032
- Figure 159: Middle East & Africa Packaged Coconut Water Market Revenue (US$ Mn) Market Share by Manufacturing Processin 2022
- Figure 160: Middle East & Africa Packaged Coconut Water Market Attractiveness Analysis by Manufacturing Process, 2016-2032
- Figure 161: Middle East & Africa Packaged Coconut Water Market Revenue (US$ Mn) Market Share by Applicationin 2022
- Figure 162: Middle East & Africa Packaged Coconut Water Market Attractiveness Analysis by Application, 2016-2032
- Figure 163: Middle East & Africa Packaged Coconut Water Market Revenue (US$ Mn) Market Share by End-Userin 2022
- Figure 164: Middle East & Africa Packaged Coconut Water Market Attractiveness Analysis by End-User, 2016-2032
- Figure 165: Middle East & Africa Packaged Coconut Water Market Revenue (US$ Mn) Market Share by Country in 2022
- Figure 166: Middle East & Africa Packaged Coconut Water Market Attractiveness Analysis by Country, 2016-2032
- Figure 167: Middle East & Africa Packaged Coconut Water Market Revenue (US$ Mn) (2016-2032)
- Figure 168: Middle East & Africa Packaged Coconut Water Market Revenue (US$ Mn) Comparison by Country (2016-2032)
- Figure 169: Middle East & Africa Packaged Coconut Water Market Revenue (US$ Mn) Comparison by Type (2016-2032)
- Figure 170: Middle East & Africa Packaged Coconut Water Market Revenue (US$ Mn) Comparison by Manufacturing Process (2016-2032)
- Figure 171: Middle East & Africa Packaged Coconut Water Market Revenue (US$ Mn) Comparison by Application (2016-2032)
- Figure 172: Middle East & Africa Packaged Coconut Water Market Revenue (US$ Mn) Comparison by End-User (2016-2032)
- Figure 173: Middle East & Africa Packaged Coconut Water Market Y-o-Y Growth Rate Comparison by Country (2016-2032)
- Figure 174: Middle East & Africa Packaged Coconut Water Market Y-o-Y Growth Rate Comparison by Type (2016-2032)
- Figure 175: Middle East & Africa Packaged Coconut Water Market Y-o-Y Growth Rate Comparison by Manufacturing Process (2016-2032)
- Figure 176: Middle East & Africa Packaged Coconut Water Market Y-o-Y Growth Rate Comparison by Application (2016-2032)
- Figure 177: Middle East & Africa Packaged Coconut Water Market Y-o-Y Growth Rate Comparison by End-User (2016-2032)
- Figure 178: Middle East & Africa Packaged Coconut Water Market Share Comparison by Country (2016-2032)
- Figure 179: Middle East & Africa Packaged Coconut Water Market Share Comparison by Type (2016-2032)
- Figure 180: Middle East & Africa Packaged Coconut Water Market Share Comparison by Manufacturing Process (2016-2032)
- Figure 181: Middle East & Africa Packaged Coconut Water Market Share Comparison by Application (2016-2032)
- Figure 182: Middle East & Africa Packaged Coconut Water Market Share Comparison by End-User (2016-2032)
List of Tables
- Table 1: Global Packaged Coconut Water Market Comparison by Type (2016-2032)
- Table 2: Global Packaged Coconut Water Market Comparison by Manufacturing Process (2016-2032)
- Table 3: Global Packaged Coconut Water Market Comparison by Application (2016-2032)
- Table 4: Global Packaged Coconut Water Market Comparison by End-User (2016-2032)
- Table 5: Global Packaged Coconut Water Market Revenue (US$ Mn) Comparison by Region (2016-2032)
- Table 6: Global Packaged Coconut Water Market Revenue (US$ Mn) (2016-2032)
- Table 7: Global Packaged Coconut Water Market Revenue (US$ Mn) Comparison by Region (2016-2032)
- Table 8: Global Packaged Coconut Water Market Revenue (US$ Mn) Comparison by Type (2016-2032)
- Table 9: Global Packaged Coconut Water Market Revenue (US$ Mn) Comparison by Manufacturing Process (2016-2032)
- Table 10: Global Packaged Coconut Water Market Revenue (US$ Mn) Comparison by Application (2016-2032)
- Table 11: Global Packaged Coconut Water Market Revenue (US$ Mn) Comparison by End-User (2016-2032)
- Table 12: Global Packaged Coconut Water Market Y-o-Y Growth Rate Comparison by Region (2016-2032)
- Table 13: Global Packaged Coconut Water Market Y-o-Y Growth Rate Comparison by Type (2016-2032)
- Table 14: Global Packaged Coconut Water Market Y-o-Y Growth Rate Comparison by Manufacturing Process (2016-2032)
- Table 15: Global Packaged Coconut Water Market Y-o-Y Growth Rate Comparison by Application (2016-2032)
- Table 16: Global Packaged Coconut Water Market Y-o-Y Growth Rate Comparison by End-User (2016-2032)
- Table 17: Global Packaged Coconut Water Market Share Comparison by Region (2016-2032)
- Table 18: Global Packaged Coconut Water Market Share Comparison by Type (2016-2032)
- Table 19: Global Packaged Coconut Water Market Share Comparison by Manufacturing Process (2016-2032)
- Table 20: Global Packaged Coconut Water Market Share Comparison by Application (2016-2032)
- Table 21: Global Packaged Coconut Water Market Share Comparison by End-User (2016-2032)
- Table 22: North America Packaged Coconut Water Market Comparison by Manufacturing Process (2016-2032)
- Table 23: North America Packaged Coconut Water Market Comparison by Application (2016-2032)
- Table 24: North America Packaged Coconut Water Market Comparison by End-User (2016-2032)
- Table 25: North America Packaged Coconut Water Market Revenue (US$ Mn) Comparison by Country (2016-2032)
- Table 26: North America Packaged Coconut Water Market Revenue (US$ Mn) (2016-2032)
- Table 27: North America Packaged Coconut Water Market Revenue (US$ Mn) Comparison by Country (2016-2032)
- Table 28: North America Packaged Coconut Water Market Revenue (US$ Mn) Comparison by Type (2016-2032)
- Table 29: North America Packaged Coconut Water Market Revenue (US$ Mn) Comparison by Manufacturing Process (2016-2032)
- Table 30: North America Packaged Coconut Water Market Revenue (US$ Mn) Comparison by Application (2016-2032)
- Table 31: North America Packaged Coconut Water Market Revenue (US$ Mn) Comparison by End-User (2016-2032)
- Table 32: North America Packaged Coconut Water Market Y-o-Y Growth Rate Comparison by Country (2016-2032)
- Table 33: North America Packaged Coconut Water Market Y-o-Y Growth Rate Comparison by Type (2016-2032)
- Table 34: North America Packaged Coconut Water Market Y-o-Y Growth Rate Comparison by Manufacturing Process (2016-2032)
- Table 35: North America Packaged Coconut Water Market Y-o-Y Growth Rate Comparison by Application (2016-2032)
- Table 36: North America Packaged Coconut Water Market Y-o-Y Growth Rate Comparison by End-User (2016-2032)
- Table 37: North America Packaged Coconut Water Market Share Comparison by Country (2016-2032)
- Table 38: North America Packaged Coconut Water Market Share Comparison by Type (2016-2032)
- Table 39: North America Packaged Coconut Water Market Share Comparison by Manufacturing Process (2016-2032)
- Table 40: North America Packaged Coconut Water Market Share Comparison by Application (2016-2032)
- Table 41: North America Packaged Coconut Water Market Share Comparison by End-User (2016-2032)
- Table 42: Western Europe Packaged Coconut Water Market Comparison by Type (2016-2032)
- Table 43: Western Europe Packaged Coconut Water Market Comparison by Manufacturing Process (2016-2032)
- Table 44: Western Europe Packaged Coconut Water Market Comparison by Application (2016-2032)
- Table 45: Western Europe Packaged Coconut Water Market Comparison by End-User (2016-2032)
- Table 46: Western Europe Packaged Coconut Water Market Revenue (US$ Mn) Comparison by Country (2016-2032)
- Table 47: Western Europe Packaged Coconut Water Market Revenue (US$ Mn) (2016-2032)
- Table 48: Western Europe Packaged Coconut Water Market Revenue (US$ Mn) Comparison by Country (2016-2032)
- Table 49: Western Europe Packaged Coconut Water Market Revenue (US$ Mn) Comparison by Type (2016-2032)
- Table 50: Western Europe Packaged Coconut Water Market Revenue (US$ Mn) Comparison by Manufacturing Process (2016-2032)
- Table 51: Western Europe Packaged Coconut Water Market Revenue (US$ Mn) Comparison by Application (2016-2032)
- Table 52: Western Europe Packaged Coconut Water Market Revenue (US$ Mn) Comparison by End-User (2016-2032)
- Table 53: Western Europe Packaged Coconut Water Market Y-o-Y Growth Rate Comparison by Country (2016-2032)
- Table 54: Western Europe Packaged Coconut Water Market Y-o-Y Growth Rate Comparison by Type (2016-2032)
- Table 55: Western Europe Packaged Coconut Water Market Y-o-Y Growth Rate Comparison by Manufacturing Process (2016-2032)
- Table 56: Western Europe Packaged Coconut Water Market Y-o-Y Growth Rate Comparison by Application (2016-2032)
- Table 57: Western Europe Packaged Coconut Water Market Y-o-Y Growth Rate Comparison by End-User (2016-2032)
- Table 58: Western Europe Packaged Coconut Water Market Share Comparison by Country (2016-2032)
- Table 59: Western Europe Packaged Coconut Water Market Share Comparison by Type (2016-2032)
- Table 60: Western Europe Packaged Coconut Water Market Share Comparison by Manufacturing Process (2016-2032)
- Table 61: Western Europe Packaged Coconut Water Market Share Comparison by Application (2016-2032)
- Table 62: Western Europe Packaged Coconut Water Market Share Comparison by End-User (2016-2032)
- Table 63: Eastern Europe Packaged Coconut Water Market Comparison by Type (2016-2032)
- Table 64: Eastern Europe Packaged Coconut Water Market Comparison by Manufacturing Process (2016-2032)
- Table 65: Eastern Europe Packaged Coconut Water Market Comparison by Application (2016-2032)
- Table 66: Eastern Europe Packaged Coconut Water Market Comparison by End-User (2016-2032)
- Table 67: Eastern Europe Packaged Coconut Water Market Revenue (US$ Mn) Comparison by Country (2016-2032)
- Table 68: Eastern Europe Packaged Coconut Water Market Revenue (US$ Mn) (2016-2032)
- Table 69: Eastern Europe Packaged Coconut Water Market Revenue (US$ Mn) Comparison by Country (2016-2032)
- Table 70: Eastern Europe Packaged Coconut Water Market Revenue (US$ Mn) Comparison by Type (2016-2032)
- Table 71: Eastern Europe Packaged Coconut Water Market Revenue (US$ Mn) Comparison by Manufacturing Process (2016-2032)
- Table 72: Eastern Europe Packaged Coconut Water Market Revenue (US$ Mn) Comparison by Application (2016-2032)
- Table 73: Eastern Europe Packaged Coconut Water Market Revenue (US$ Mn) Comparison by End-User (2016-2032)
- Table 74: Eastern Europe Packaged Coconut Water Market Y-o-Y Growth Rate Comparison by Country (2016-2032)
- Table 75: Eastern Europe Packaged Coconut Water Market Y-o-Y Growth Rate Comparison by Type (2016-2032)
- Table 76: Eastern Europe Packaged Coconut Water Market Y-o-Y Growth Rate Comparison by Manufacturing Process (2016-2032)
- Table 77: Eastern Europe Packaged Coconut Water Market Y-o-Y Growth Rate Comparison by Application (2016-2032)
- Table 78: Eastern Europe Packaged Coconut Water Market Y-o-Y Growth Rate Comparison by End-User (2016-2032)
- Table 79: Eastern Europe Packaged Coconut Water Market Share Comparison by Country (2016-2032)
- Table 80: Eastern Europe Packaged Coconut Water Market Share Comparison by Type (2016-2032)
- Table 81: Eastern Europe Packaged Coconut Water Market Share Comparison by Manufacturing Process (2016-2032)
- Table 82: Eastern Europe Packaged Coconut Water Market Share Comparison by Application (2016-2032)
- Table 83: Eastern Europe Packaged Coconut Water Market Share Comparison by End-User (2016-2032)
- Table 84: APAC Packaged Coconut Water Market Comparison by Type (2016-2032)
- Table 85: APAC Packaged Coconut Water Market Comparison by Manufacturing Process (2016-2032)
- Table 86: APAC Packaged Coconut Water Market Comparison by Application (2016-2032)
- Table 87: APAC Packaged Coconut Water Market Comparison by End-User (2016-2032)
- Table 88: APAC Packaged Coconut Water Market Revenue (US$ Mn) Comparison by Country (2016-2032)
- Table 89: APAC Packaged Coconut Water Market Revenue (US$ Mn) (2016-2032)
- Table 90: APAC Packaged Coconut Water Market Revenue (US$ Mn) Comparison by Country (2016-2032)
- Table 91: APAC Packaged Coconut Water Market Revenue (US$ Mn) Comparison by Type (2016-2032)
- Table 92: APAC Packaged Coconut Water Market Revenue (US$ Mn) Comparison by Manufacturing Process (2016-2032)
- Table 93: APAC Packaged Coconut Water Market Revenue (US$ Mn) Comparison by Application (2016-2032)
- Table 94: APAC Packaged Coconut Water Market Revenue (US$ Mn) Comparison by End-User (2016-2032)
- Table 95: APAC Packaged Coconut Water Market Y-o-Y Growth Rate Comparison by Country (2016-2032)
- Table 96: APAC Packaged Coconut Water Market Y-o-Y Growth Rate Comparison by Type (2016-2032)
- Table 97: APAC Packaged Coconut Water Market Y-o-Y Growth Rate Comparison by Manufacturing Process (2016-2032)
- Table 98: APAC Packaged Coconut Water Market Y-o-Y Growth Rate Comparison by Application (2016-2032)
- Table 99: APAC Packaged Coconut Water Market Y-o-Y Growth Rate Comparison by End-User (2016-2032)
- Table 100: APAC Packaged Coconut Water Market Share Comparison by Country (2016-2032)
- Table 101: APAC Packaged Coconut Water Market Share Comparison by Type (2016-2032)
- Table 102: APAC Packaged Coconut Water Market Share Comparison by Manufacturing Process (2016-2032)
- Table 103: APAC Packaged Coconut Water Market Share Comparison by Application (2016-2032)
- Table 104: APAC Packaged Coconut Water Market Share Comparison by End-User (2016-2032)
- Table 105: Latin America Packaged Coconut Water Market Comparison by Type (2016-2032)
- Table 106: Latin America Packaged Coconut Water Market Comparison by Manufacturing Process (2016-2032)
- Table 107: Latin America Packaged Coconut Water Market Comparison by Application (2016-2032)
- Table 108: Latin America Packaged Coconut Water Market Comparison by End-User (2016-2032)
- Table 109: Latin America Packaged Coconut Water Market Revenue (US$ Mn) Comparison by Country (2016-2032)
- Table 110: Latin America Packaged Coconut Water Market Revenue (US$ Mn) (2016-2032)
- Table 111: Latin America Packaged Coconut Water Market Revenue (US$ Mn) Comparison by Country (2016-2032)
- Table 112: Latin America Packaged Coconut Water Market Revenue (US$ Mn) Comparison by Type (2016-2032)
- Table 113: Latin America Packaged Coconut Water Market Revenue (US$ Mn) Comparison by Manufacturing Process (2016-2032)
- Table 114: Latin America Packaged Coconut Water Market Revenue (US$ Mn) Comparison by Application (2016-2032)
- Table 115: Latin America Packaged Coconut Water Market Revenue (US$ Mn) Comparison by End-User (2016-2032)
- Table 116: Latin America Packaged Coconut Water Market Y-o-Y Growth Rate Comparison by Country (2016-2032)
- Table 117: Latin America Packaged Coconut Water Market Y-o-Y Growth Rate Comparison by Type (2016-2032)
- Table 118: Latin America Packaged Coconut Water Market Y-o-Y Growth Rate Comparison by Manufacturing Process (2016-2032)
- Table 119: Latin America Packaged Coconut Water Market Y-o-Y Growth Rate Comparison by Application (2016-2032)
- Table 120: Latin America Packaged Coconut Water Market Y-o-Y Growth Rate Comparison by End-User (2016-2032)
- Table 121: Latin America Packaged Coconut Water Market Share Comparison by Country (2016-2032)
- Table 122: Latin America Packaged Coconut Water Market Share Comparison by Type (2016-2032)
- Table 123: Latin America Packaged Coconut Water Market Share Comparison by Manufacturing Process (2016-2032)
- Table 124: Latin America Packaged Coconut Water Market Share Comparison by Application (2016-2032)
- Table 125: Latin America Packaged Coconut Water Market Share Comparison by End-User (2016-2032)
- Table 126: Middle East & Africa Packaged Coconut Water Market Comparison by Type (2016-2032)
- Table 127: Middle East & Africa Packaged Coconut Water Market Comparison by Manufacturing Process (2016-2032)
- Table 128: Middle East & Africa Packaged Coconut Water Market Comparison by Application (2016-2032)
- Table 129: Middle East & Africa Packaged Coconut Water Market Comparison by End-User (2016-2032)
- Table 130: Middle East & Africa Packaged Coconut Water Market Revenue (US$ Mn) Comparison by Country (2016-2032)
- Table 131: Middle East & Africa Packaged Coconut Water Market Revenue (US$ Mn) (2016-2032)
- Table 132: Middle East & Africa Packaged Coconut Water Market Revenue (US$ Mn) Comparison by Country (2016-2032)
- Table 133: Middle East & Africa Packaged Coconut Water Market Revenue (US$ Mn) Comparison by Type (2016-2032)
- Table 134: Middle East & Africa Packaged Coconut Water Market Revenue (US$ Mn) Comparison by Manufacturing Process (2016-2032)
- Table 135: Middle East & Africa Packaged Coconut Water Market Revenue (US$ Mn) Comparison by Application (2016-2032)
- Table 136: Middle East & Africa Packaged Coconut Water Market Revenue (US$ Mn) Comparison by End-User (2016-2032)
- Table 137: Middle East & Africa Packaged Coconut Water Market Y-o-Y Growth Rate Comparison by Country (2016-2032)
- Table 138: Middle East & Africa Packaged Coconut Water Market Y-o-Y Growth Rate Comparison by Type (2016-2032)
- Table 139: Middle East & Africa Packaged Coconut Water Market Y-o-Y Growth Rate Comparison by Manufacturing Process (2016-2032)
- Table 140: Middle East & Africa Packaged Coconut Water Market Y-o-Y Growth Rate Comparison by Application (2016-2032)
- Table 141: Middle East & Africa Packaged Coconut Water Market Y-o-Y Growth Rate Comparison by End-User (2016-2032)
- Table 142: Middle East & Africa Packaged Coconut Water Market Share Comparison by Country (2016-2032)
- Table 143: Middle East & Africa Packaged Coconut Water Market Share Comparison by Type (2016-2032)
- Table 144: Middle East & Africa Packaged Coconut Water Market Share Comparison by Manufacturing Process (2016-2032)
- Table 145: Middle East & Africa Packaged Coconut Water Market Share Comparison by Application (2016-2032)
- Table 146: Middle East & Africa Packaged Coconut Water Market Share Comparison by End-User (2016-2032)
- 1. Executive Summary
-
- AVERY DENNISON CORPORATION (U.S.)
- Dupont (U.S.)
- Dow (U.S.)
- 3M (U.S.)
- H.B. Fuller Company (U.S.)
- Sealed Air (U.S.)
- SABIC (Saudi Arabia)
- Arkema (France)
- LyondellBasell (Netherlands)
- Exxon Mobil Corporation (U.S.)
- Mitsui Chemicals Inc.
- (Japan)
- Braskem (Brazil)
- TotalEnergies (France)
- Novamont SpA (Italy)
- SOLVAY (Belgium)
- DAIKIN (Japan)
- Biome Bioplastics (UK)
- PTT Global Chemical Public Company Limited (Thailand)
- KURARAY CO. Ltd. (Japan)
Our Clients


View Our Licence Options
