
Artificial Intelligence in Sports Market By Component (Software, Service), By Deployment Model (On-premise, Cloud), By Technology (Machine Learning, Natural Language Processing, and Others), By Application (Game Planning, Game Strategies, and Others), By Game Type (Football, Cricket, and Others), By Region And Companies - Industry Segment Outlook, Market Assessment, Competition Scenario, Trends, And Forecast 2024-2033
-
51393
-
Sept 2024
-
250
-


-
This report was compiled by Vishwa Gaul Vishwa is an experienced market research and consulting professional with over 8 years of expertise in the ICT industry, contributing to over 700 reports across telecommunications, software, hardware, and digital solutions. Correspondence Team Lead- ICT Linkedin | Detailed Market research Methodology Our methodology involves a mix of primary research, including interviews with leading mental health experts, and secondary research from reputable medical journals and databases. View Detailed Methodology Page
-
Quick Navigation
Report Overview
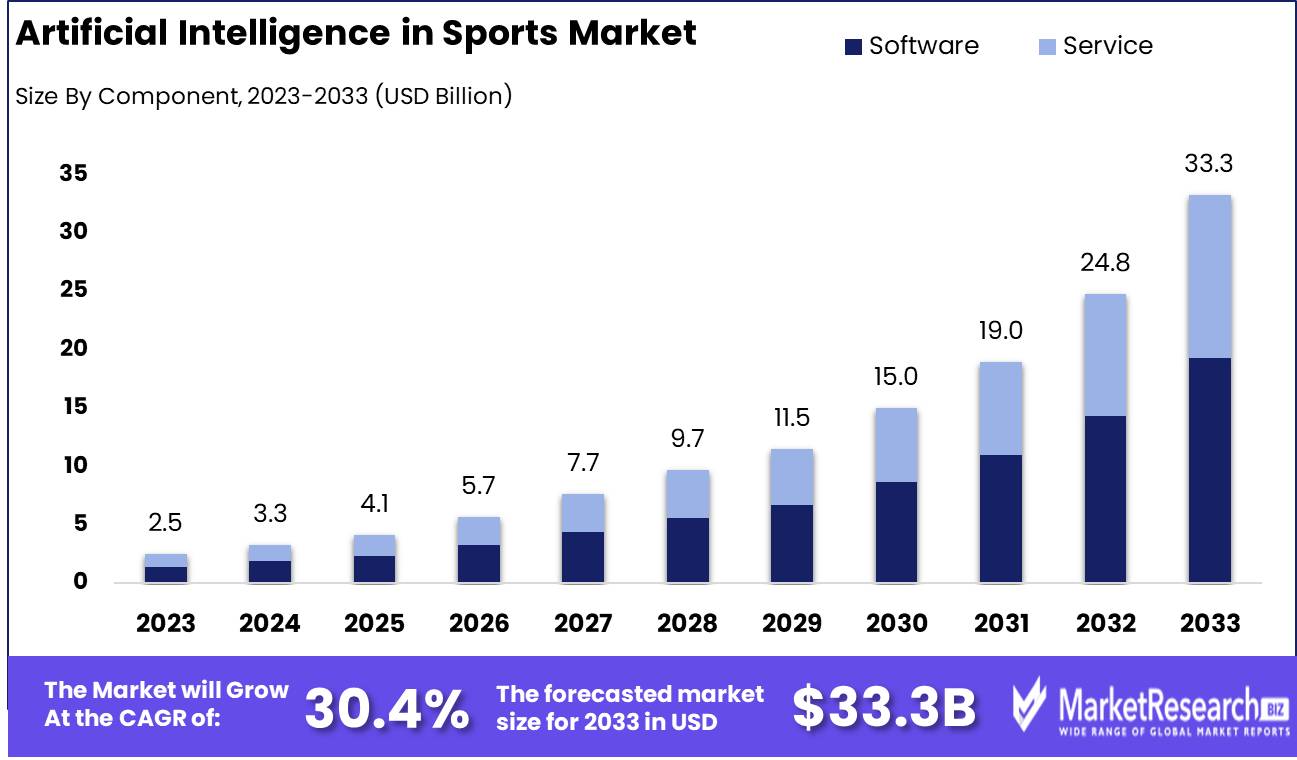
The Artificial Intelligence in Sports Market was valued at USD 2.5 billion in 2023. It is expected to reach USD 33.3 billion by 2033, with a Compound annual growth rate (CAGR) of 30.4% during the forecast period from 2024 to 2033.
The Artificial Intelligence in Sports market refers to the integration of AI technologies such as machine learning, computer vision, and data analytics to enhance various aspects of the sports industry. This includes performance optimization through player tracking and injury prevention, fan engagement via personalized content, and operational efficiency through predictive maintenance and game strategy development. AI is revolutionizing sports by providing deeper insights from data, enabling real-time decision-making, and improving both athletic and business outcomes. As AI adoption grows, it is reshaping how sports organizations, teams, and broadcasters innovate and compete in an increasingly data-driven environment.
The Artificial Intelligence (AI) in Sports Market is rapidly transforming under the influence of major technological investments and advancements. For instance, Accenture's significant commitment of $3 billion over the next three years into its Data & AI practice underscores a strategic push to harness AI for enhancing growth, efficiency, and resilience across various industries, including sports. This investment is poised to set a precedent for how data and AI can be innovatively used to refine athletic performance and fan engagement strategies.
Further invigorating the market, IBM's recent enhancements to the ESPN Fantasy Football app through its AI platform, WatsonX, exemplify the integration of AI in sports media. These updates aim to enrich the user experience for over 11 million users by providing faster and more accurate fantasy sports analytics. Additionally, Sportradar's introduction of Computer Vision technology represents a significant leap forward. By processing visual data from live sports events in real-time, this technology offers unprecedented speed and accuracy in sports statistics, enhancing both viewing and betting experiences.
Moreover, a global survey by Morning Consult highlights a growing consumer demand for personalized and efficient digital sports content. The survey, involving over 18,000 sports fans from 10 countries, reveals a strong preference for AI-driven enhancements in sports media. Fans are increasingly recognizing AI's potential to significantly improve their viewing experiences by offering personalized content and instant statistics.
These developments indicate a vibrant trajectory for the AI in Sports Market, driven by technological advancements and a clear demand for deeper, data-driven fan engagement. As AI continues to evolve, its role in sports is expected to expand, bringing more sophisticated analytics and enhanced interactive experiences to the forefront of the industry. This evolving landscape offers substantial opportunities for stakeholders to innovate and capture value in the ever-growing sports technology arena.
Key Takeaways
- Market Growth: The AI in Sports Market is expected to surge from USD 2.5 billion in 2023 to USD 33.3 billion by 2033, with a robust CAGR of 30.4%.
- Analyst Viewpoint Summary: AI is driving significant transformations in sports, enhancing performance, fan engagement, and operational efficiency. Investment in AI, such as Accenture’s $3 billion push, reflects the growing strategic importance of data-driven innovation in sports.
- By Component: Software Segment Dominated with a 58.5% market share in 2023, leading the market due to its critical role in performance analytics and decision-making.
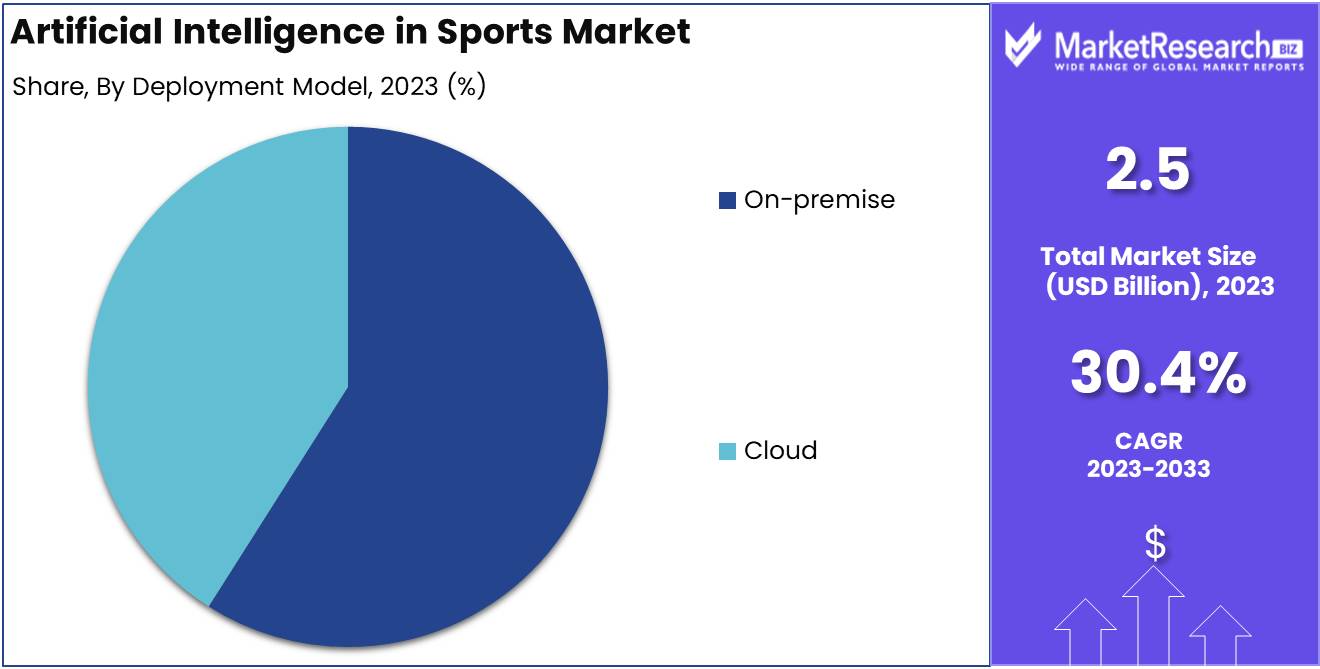
- By Deployment Model: On-premise Deployment Model Holds 59% of the market share in 2023, driven by large organizations prioritizing data control and security.
- By Technology: Machine Learning Technology Leads with 27% market share, widely used for predictive analytics, player tracking, and performance optimization.
- By Application: Performance Improvement Dominated the market with a 35% share in 2023, reflecting the high demand for AI in optimizing athlete performance.
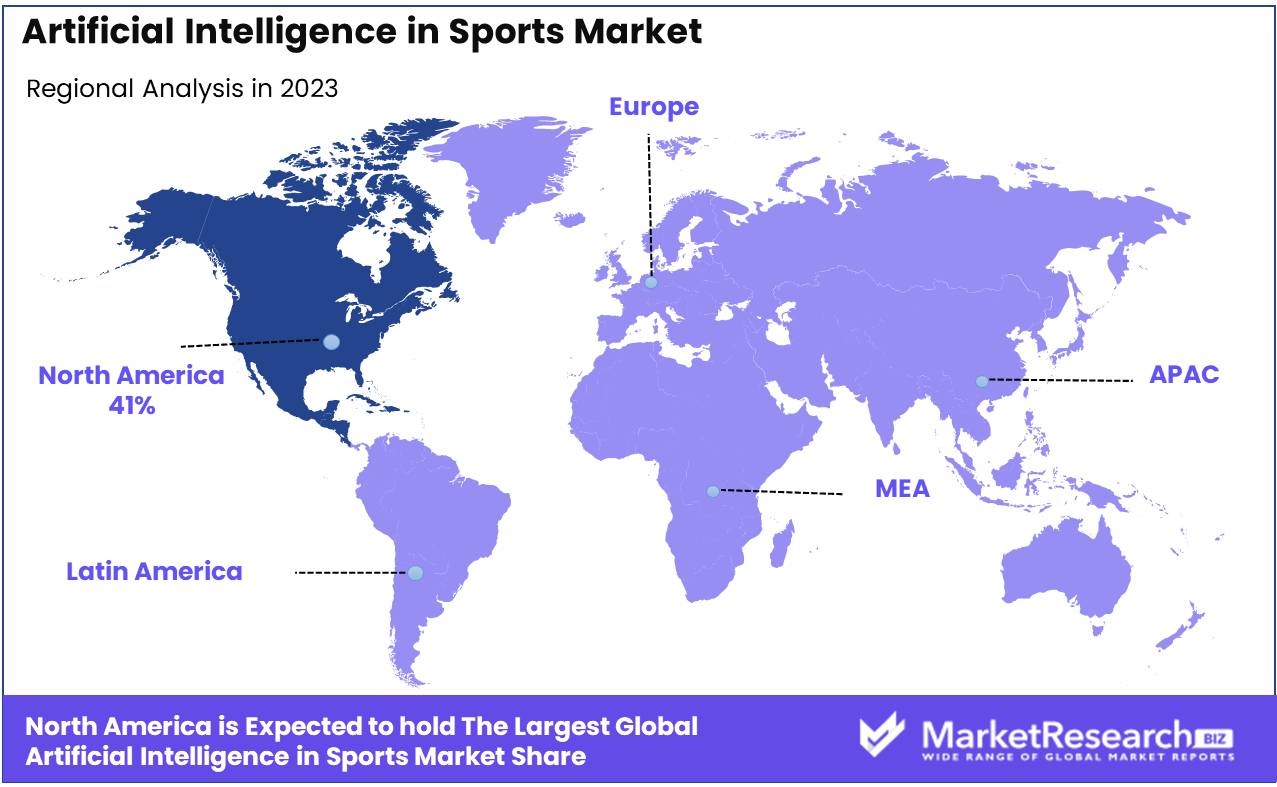
- Regional Growth: North America Leads with a 41% share in 2023, driven by advanced AI adoption in sports performance and real-time analytics.
- Growth Opportunity: AI-driven sports broadcasting is projected to significantly enhance fan experiences by offering personalized content and real-time insights.
- Restraining Factor: Data privacy and security concerns remain a critical barrier to AI adoption in sports, especially regarding the handling of sensitive athlete and fan data.
Driving Factors
Injury Prevention
Enhanced Fan Engagement
Enhanced fan engagement through AI is reshaping the sports industry by creating more interactive and personalized experiences for fans. AI technologies leverage data analytics and machine learning to understand fan preferences and behaviors, enabling sports organizations to offer targeted advertisements, personalized content, and interactive experiences during live events. For instance, AI can analyze social media data to gauge fan sentiments and trends, which can then be used to create engaging content that is likely to resonate with the audience. Additionally, virtual reality (VR) and augmented reality (AR), powered by AI, provide fans with immersive experiences, such as virtual tours of sports facilities and augmented live games, which significantly enhance fan participation and satisfaction.
The enhancement of fan engagement through AI not only attracts more fans but also opens up new revenue streams for sports organizations through customized merchandising, targeted advertising, and premium content offerings. This factor works synergistically with other market segments, such as sports analytics and game-day operations, to create a comprehensive ecosystem that maximizes fan loyalty and spending. The integration of AI into various fan engagement channels demonstrates its potential to transform the sports industry, making it a critical factor in the market’s expansion. By providing a more engaging and tailored fan experience, AI drives both the digital transformation of sports and its economic growth.
Restraining Factors
Data Privacy and Security Concerns
Data privacy and security concerns represent a significant barrier to the widespread adoption of AI in the sports industry. As AI systems become increasingly integral to performance analytics, fan engagement, and operational efficiency, the volume of sensitive data being collected and processed continues to grow exponentially. This includes personal information about athletes, biometric data, and fan behavior analytics, all of which are susceptible to breaches if not adequately safeguarded.
One key issue driving these concerns is the regulatory environment. Globally, laws such as the General Data Protection Regulation (GDPR) in the European Union and the California Consumer Privacy Act (CCPA) impose stringent restrictions on data collection, storage, and processing. Non-compliance can result in hefty fines, making organizations wary of fully integrating AI technologies. A PwC survey reported that 87% of consumers are concerned about how their personal data is handled, signaling a need for more robust privacy protocols in sports AI applications.
Additionally, the risk of cyberattacks targeting AI systems used by teams, leagues, and media outlets further exacerbates security concerns. As AI solutions become more connected to cloud infrastructure and IoT devices, the potential for large-scale data breaches grows. This increases the financial and reputational risks for organizations, causing some stakeholders to delay or limit their AI investments. This is particularly relevant in high-profile leagues, where sensitive data about player health, fitness, and strategy could be exploited if not properly protected.
High Implementation and Maintenance Costs
The high costs associated with implementing and maintaining AI systems present a formidable challenge for many sports organizations, particularly smaller clubs and leagues. Developing AI solutions requires substantial initial investment in software, hardware, and expertise. According to industry estimates, the global AI market is expected to grow from $150 billion in 2023 to over $1 trillion by 2030, but the capital-intensive nature of AI projects can delay the growth of AI adoption in sports.
For example, professional teams that wish to utilize AI for advanced player analytics, injury prevention, and game strategy optimization often need to invest in high-performance computing infrastructure and cutting-edge data science expertise. This level of investment can be difficult for many sports organizations, particularly in lower-tier leagues or emerging sports markets. Furthermore, AI systems require regular updates, ongoing data acquisition, and system integration, driving up the total cost of ownership over time.
The lack of financial resources can stifle innovation, as organizations may opt for less sophisticated, off-the-shelf AI solutions rather than custom, cutting-edge technologies that provide more value. This creates a disparity in access to AI capabilities between elite, well-funded teams and smaller or less profitable sports entities, potentially widening competitive imbalances.
Moreover, the cost of maintaining AI-driven systems such as continual upgrades, cybersecurity measures, and operational downtime adds further financial strain. This is especially relevant in an industry where margins can already be thin, and every operational decision is scrutinized for cost efficiency.
By Component Analysis
Software Segment Leads with Over 58.5% largest Market Share in 2023
In 2023, Software held a dominant market position in the By Component segment of the Artificial Intelligence in Sports Market, capturing more than 58.5% of the total market share, driven by its critical role in enhancing performance analytics, predictive modeling, and real-time decision-making systems across various sports. The adoption of AI-powered software has surged due to its capability to provide in-depth insights into player performance, injury prediction, fan engagement, and tactical analysis. Major sports leagues, teams, and training academies are investing heavily in AI-based software solutions, aiming to optimize team strategies, scout talent more effectively, and elevate fan experiences through personalized content.
The software segment is further bolstered by the integration of machine learning algorithms, computer vision, and natural language processing (NLP) technologies, which enable organizations to make data-driven decisions with greater accuracy and speed. As AI in sports continues to evolve, the software's adaptability, scalability, and ability to handle large datasets are key drivers propelling its sustained dominance in this market.
Service, although smaller in comparison, accounted for a significant portion of the market, contributing approximately 41.5% in 2023. Services within this segment encompass a range of offerings such as AI system implementation, consulting, and maintenance. As AI software becomes more complex, the demand for expertise in integration, customization, and ongoing technical support has increased, especially for organizations lacking in-house AI capabilities.
By Deployment Model Analysis
On-premise Deployment Model Dominates AI in Sports Market with 59% Largest Share in 2023
In 2023, On-premise held a dominant market position in the By Deployment Model segment of the Artificial Intelligence in Sports Market, capturing more than a 59% share. This notable market share highlights the preference for on-premise solutions, particularly among large sports organizations and enterprises prioritizing data security and control over their AI applications. On-premise AI deployments offer a higher level of customization, which is often crucial in applications such as performance analytics, player tracking, and fan engagement. Additionally, organizations with existing infrastructure in place favor on-premise deployment for its seamless integration with their proprietary systems, further driving its adoption. Despite higher upfront costs and maintenance requirements, the long-term benefits of enhanced security, privacy, and control make this deployment model attractive for key players in the sports industry.
Cloud, on the other hand, is gaining traction rapidly and is expected to exhibit significant growth in the coming years. The flexibility, scalability, and cost-efficiency of cloud-based AI solutions make them increasingly appealing, particularly to small and medium-sized sports organizations or those looking to reduce infrastructure expenses. Cloud-based platforms also enable real-time data analysis, remote access, and easy collaboration across locations, driving interest in applications like fan engagement platforms, predictive analytics, and digital marketing within sports organizations. While cloud currently holds a smaller market share compared to on-premise, the adoption curve suggests a strong upward trajectory, underpinned by the industry's broader digital transformation initiatives.
By Technology Analysis
Machine Learning Technology Leads AI in Sports Market with 27% Largest Market Share in 2023
In 2023, Machine Learning held a dominant market position in the By Technology segment of the Artificial Intelligence in Sports Market, capturing more than a 27% share. The prominence of Machine Learning (ML) stems from its extensive applications in predictive analytics, player performance tracking, and strategic decision-making processes. ML-driven solutions are leveraged to analyze vast amounts of sports data, enabling teams and coaches to make informed, real-time adjustments that can significantly impact outcomes. From player injury predictions to refining game tactics based on historical data, ML is reshaping how sports organizations operate. The ability of ML algorithms to learn and improve over time, combined with their scalability, has positioned this technology as the leader in AI applications within sports.
Natural Language Processing (NLP) is also playing an increasingly critical role, particularly in fan engagement and media applications. Although it holds a smaller market share compared to ML, NLP is essential for processing and analyzing vast streams of unstructured data, such as social media content, interviews, and fan communications. This technology enables real-time sentiment analysis, virtual assistants, and chatbots, enhancing fan interactions and delivering personalized experiences.
Computer Vision is a rapidly growing segment, with its application in areas such as player motion tracking, officiating, and live-action analysis. Computer Vision technology is utilized to extract insights from video footage, automating tasks such as referee decisions, player movement analysis, and even crowd behavior monitoring. While its current market share lags behind ML, Computer Vision's adoption is expected to surge as it becomes more integrated into real-time game analysis and broadcasting.
Data Analytics plays a foundational role, complementing ML, NLP, and Computer Vision by providing the tools to manage, visualize, and interpret large datasets generated within the sports industry. Although it doesn't drive AI applications on its own, Data Analytics is indispensable for aggregating and analyzing the information required for predictive models and performance optimization, offering crucial support across various AI technologies.
Others in this category include emerging technologies like neural networks and deep learning, which are slowly gaining traction in specialized applications such as advanced gameplay simulations and highly precise performance enhancement tools. While these technologies currently capture a smaller market share, their influence is anticipated to grow as sports organizations seek more advanced AI-driven insights.
By Application Analysis
Performance Improvement Dominates AI in Sports Market with 35% Largest Share in 2023
In 2023, Performance Improvement held a dominant market position in the By Application segment of the Artificial Intelligence in Sports Market, capturing more than a 35% share. This leadership reflects the growing demand for AI-driven tools to optimize athlete performance, which is becoming a key priority across professional and amateur sports. Performance improvement applications focus on analyzing biometric data, game performance metrics, and training regimes to help athletes and teams maximize their potential. From real-time monitoring of physical exertion to personalized training plans based on historical data, AI plays a central role in fine-tuning both individual and team performance. The reliance on AI for performance analysis, coupled with its ability to provide continuous feedback and adjustment, has made this the most significant application within the sports AI landscape.
Game Planning, while capturing a smaller share, is also integral to modern sports strategies. AI-powered tools for game planning allow coaches and analysts to simulate various game scenarios, review historical performance, and predict outcomes based on opponent analysis. The adoption of AI in this area is driven by its ability to process large datasets and deliver actionable insights that can shape in-game decisions, ultimately enhancing a team’s competitive edge.
Game Strategies leverage AI's predictive analytics capabilities to refine in-play tactics. AI applications in this area allow for real-time decision-making adjustments based on game flow, opponent behavior, and player conditions. While not as widely adopted as performance improvement tools, game strategy solutions are growing as coaches and managers increasingly turn to AI to refine their tactical approaches and gain an advantage during competitions.
Injury Prevention is another rapidly expanding segment, with AI technologies being used to monitor players’ biomechanics and identify risk factors that could lead to injury. By analyzing data from wearable devices and video footage, AI solutions can predict and help prevent injuries before they occur, allowing for better management of player health. While its current market share remains below that of performance improvement, the adoption of AI in injury prevention is expected to increase as sports organizations prioritize athlete safety and longevity.
Sports Recruitment is also benefiting from AI, with technologies being used to evaluate and scout talent more efficiently. AI algorithms analyze vast amounts of player data, from game footage to physical metrics, to identify high-potential talent that might otherwise be overlooked. While still a smaller segment, AI in recruitment is becoming a critical tool for teams aiming to build more competitive rosters based on data-driven insights rather than solely relying on traditional scouting methods.
Others in this category include emerging applications such as fan engagement, broadcast enhancements, and sponsorship optimization, which, while currently smaller in scale, hold potential for future growth as AI continues to evolve and expand its impact within the sports industry.
By Game Type Analysis
Football Leads AI in Sports Market with 41% Largest Share in 2023
In 2023, Football held a dominant market position in the By Game Type segment of the Artificial Intelligence in Sports Market, capturing more than a 41% share. Football’s leadership in this segment is driven by its global popularity and the increasing adoption of AI technologies for performance analysis, tactical planning, injury prevention, and fan engagement. Major football leagues and clubs are investing heavily in AI to optimize player performance, analyze match strategies, and gain competitive advantages. From AI-driven player tracking and biometric analysis to predicting game outcomes based on vast datasets, football has become a focal point for AI applications in sports. This widespread use of AI in football also extends to fan engagement, where machine learning and natural language processing technologies enhance the viewer experience through personalized content, predictive analytics, and interactive digital platforms.
Cricket, while capturing a smaller market share compared to football, is emerging as a key adopter of AI technology, particularly in regions like India, Australia, and the UK where the sport enjoys widespread popularity. AI in cricket is being used for performance analytics, injury prevention, and decision-making support for both players and coaches. Technologies such as ball-tracking, predictive scoring models, and match simulation are enhancing strategic planning and in-game decision-making, positioning cricket as a growing sector for AI deployment.
Tennis is also seeing significant AI integration, particularly in areas such as player performance tracking, match prediction, and fan engagement. AI-powered systems in tennis are used to analyze player movements, optimize training regimes, and offer real-time match analysis to both coaches and broadcasters. Though its share is smaller than that of football, AI is helping to enhance individual player performance and improve the overall quality of the sport.
Basketball and Baseball are both embracing AI for similar purposes, including player performance optimization, injury prevention, and game strategy refinement. In basketball, AI is used to analyze player movements, shooting techniques, and defensive patterns, providing real-time insights that influence coaching decisions. Baseball benefits from AI in player scouting, pitch prediction, and game simulation, where large datasets are analyzed to improve strategic outcomes. While their market shares are currently smaller than that of football, both sports are expected to increase their adoption of AI technologies in the coming years.
Others, including sports like rugby, golf, and athletics, represent a growing but still relatively minor share of AI adoption in the sports market. These sports are beginning to leverage AI for niche applications, such as injury prevention and fan engagement, with potential for increased AI integration as the technology becomes more accessible.
Key Market Segments
By Component
- Software
- Service
By Deployment Model
- On-premise
- Cloud
By Technology
- Machine Learning
- Natural Language Processing
- Computer Vision
- Data Analytics
- Others
By Application
- Game Planning
- Game Strategies
- Performance Improvement
- Injury Prevention
- Sports Recruitment
- Others
By Game Type
- Football
- Cricket
- Tennis
- Basketball
- Baseball
- Others
Growth Opportunity
Broadcasting and Media
AI is revolutionizing sports broadcasting by automating content creation, enabling personalized viewing experiences, and enhancing real-time data analysis. AI-driven analytics allow broadcasters to generate tailored highlights and real-time statistics, delivering a more immersive fan experience. With AI, sports networks can predict viewer preferences and deliver customized content to enhance engagement. This transformation has already gained momentum, and in 2024, it will be further amplified by innovations in machine learning, image recognition, and natural language processing. As media companies strive to retain viewers amid growing competition from digital platforms, AI presents an opportunity to create differentiated offerings.
Sports Recruitment and Scouting
AI’s impact on recruitment and scouting is reshaping how teams identify and evaluate talent. In 2024, AI-driven systems will further enhance data-driven scouting by analyzing vast datasets, including player performance metrics, injury history, and behavioral patterns. These advanced analytics reduce subjectivity, offering more precise insights into player potential. With AI, teams can make faster and more informed decisions regarding player acquisitions, minimizing risks associated with traditional scouting methods. As sports organizations seek competitive advantages, the adoption of AI in recruitment and scouting is expected to accelerate, making it a crucial growth area in the AI-driven sports ecosystem.
Latest Trends
AI in Sports Betting and Predictive Analysis
One of the most lucrative growth areas in the AI sports market is predictive analytics for sports betting. AI algorithms are increasingly being used to analyze historical data, player performance, and external factors like weather conditions, enabling more accurate predictions of game outcomes. This trend not only benefits bettors but also sports betting operators by enhancing their forecasting accuracy and reducing risks. With the global sports betting industry projected to exceed $140 billion by 2028, the role of AI in predictive analytics offers significant growth potential. Sports organizations and betting platforms that integrate AI can leverage advanced models to create more engaging and profitable wagering experiences.
AI and Virtual Training Environments
AI-driven virtual training environments are transforming how athletes prepare for competition, offering immersive, data-rich simulations that replicate real-world game conditions. These environments allow athletes to refine skills, analyze their performance, and make real-time adjustments without the physical strain of traditional training. By integrating AI with virtual reality (VR) and augmented reality (AR) technologies, sports teams can create highly personalized training regimens tailored to each athlete’s strengths and weaknesses. In 2024, this trend is expected to gain momentum as AI-powered virtual training becomes a key tool for teams looking to optimize performance, reduce injuries, and extend athletes' careers.
Regional Analysis
North America dominates the Artificial Intelligence in Sports market with the largest market share of 41%
The global AI-driven sports industry, North America holds a 41% sports market share, primarily fueled by technological advancements and the widespread adoption of AI technologies in sports analytics and athlete performance enhancement. The United States, leading this region, capitalizes on AI for real-time data processing and predictive analytics across major leagues and sports organizations. Canada also makes significant contributions, focusing on AI integration in coaching and sports health monitoring systems.
Europe stands as a strong competitor in the AI-driven sports industry, demonstrating robust growth in countries like Germany, the UK, and France. These nations are at the forefront of utilizing AI to enhance viewer experiences through virtual reality and sophisticated game analytics. The region's commitment to innovation is underscored by the development of AI applications designed to optimize team performance and fan engagement strategies.
The Asia-Pacific region is experiencing rapid growth in the AI sports sector, with countries like China, Japan, and India making substantial investments in sports technology. This region is keen on adopting AI for broadcasting, personalized fan experiences, and sports wearables, which are gaining popularity among the youthful populations. Noteworthy advancements are also occurring in emerging economies such as Thailand and Vietnam, where local startups are delving into AI-driven sports technologies.
In South America, Brazil and Mexico lead in integrating AI in sports, particularly in football, to enhance player development and match strategies. The region is exploring AI's potential to transform traditional sports structures and fan engagement, albeit at a slower pace compared to North America and Europe.
The Middle East and Africa are gradually embracing AI in sports, with nations like Saudi Arabia and the UAE investing in sports infrastructure and technology to enhance tourism and their global sports presence. The focus here is on employing AI to augment the capabilities of sports facilities and improve the overall experience for participants and spectators alike. This in-depth analysis by sports technologists and sports data analysts highlights the transformative impact of AI across global sports landscapes.
Key Regions and Countries
North America
- The US
- Canada
- Rest of North America
Europe
- Germany
- France
- The UK
- Spain
- Netherlands
- Russia
- Italy
- Rest of Europe
Asia-Pacific
- China
- Japan
- Singapore
- Thailand
- South Korea
- Vietnam
- India
- New Zealand
- Rest of Asia Pacific
Latin America
- Mexico
- Brazil
- Rest of Latin America
Middle East & Africa
- Saudi Arabia
- South Africa
- UAE
- Rest of the Middle East & Africa
Key Players Analysis
In 2024, the global Artificial Intelligence (AI) in Sports market is witnessing significant transformation, with several key players driving technological advancements and innovations that enhance performance analytics, fan engagement, and operational efficiencies.
SAP SE and SAS Institute Inc. lead the charge by leveraging their advanced data analytics platforms to provide comprehensive AI-driven insights into athlete performance, injury prevention, and team strategy optimization. SAP’s HANA-based solutions and SAS’s data science capabilities enable real-time data processing, which is crucial for dynamic in-game decision-making.
Opta Sports, part of the Perform Group, is a recognized leader in providing granular sports data analytics. Their AI-powered platforms are central to player performance tracking, offering rich, real-time data to teams, broadcasters, and betting firms alike, thus solidifying their role in both performance enhancement and audience engagement.
Catapult Group International Ltd. excels in wearable technology and AI-enhanced athlete tracking. Their solutions enable teams to monitor biometrics and physical output, reducing injuries and enhancing training protocols. This precision places Catapult at the forefront of AI’s application in athlete management.
TruMedia Networks, IBM Corporation, and Microsoft Corporation focus on integrating AI with cloud computing and advanced analytics to boost performance analysis and fan experiences. IBM’s Watson and Microsoft's Azure platforms offer scalable solutions that allow teams and sports organizations to leverage AI across various functions, including personalized fan experiences and operational optimization.
Meanwhile, Sportradar AG and Salesforce.com Inc. have distinguished themselves in sports betting and fan engagement through AI-powered customer insights and market intelligence tools. Their contributions continue to shape the future of sports AI applications.
Market Key Players
- SAP SE
- SAS Institute Inc
- Opta Sports (Perform Group)
- Catapult Group International Ltd
- TruMedia Networks
- Salesforce.com Inc.
- IBM Corporation
- Sportradar AG
- Microsoft Corporation
- Other Key Players
Recent Development
- In 2023, Accenture announced a significant investment in its Data & AI practice, committing $3 billion over the next three years. This investment aims to assist clients across various industries in using AI to enhance growth, efficiency, and resilience responsibly and swiftly.
- In 2023: IBM revealed enhancements and new features for the ESPN Fantasy Football app, developed in collaboration with ESPN. These updates leverage artificial intelligence technology built on IBM's watsonx, aimed at enriching the experience for over 11 million users of the app.
- In 2023 : Sportradar introduced a groundbreaking Computer Vision technology in 2023. This new development is designed to revolutionize the sports viewing and betting landscape by processing visual inputs from live sports events and gathering statistics at a speed 100 times faster than human capabilities, with data availability in mere milliseconds.
Report Scope
Report Features Description Market Value (2023) USD 2.5 Bn Forecast Revenue (2033) USD 33.3 Bn CAGR (2024-2032) 30.4% Base Year for Estimation 2023 Historic Period 2016-2023 Forecast Period 2024-2033 Report Coverage Revenue Forecast, Market Dynamics, COVID-19 Impact, Competitive Landscape, Recent Developments Segments Covered By Component (Software, Service), By Deployment Model (On-premise, Cloud), By Technology (Machine Learning, Natural Language Processing, Computer Vision, Data Analytics, Others), By Application (Game Planning, Game Strategies, Performance Improvement, Injury Prevention, Sports Recruitment, Others), By Game Type (Football, Cricket, Tennis, Basketball, Baseball, Others) Regional Analysis North America - The US, Canada, Rest of North America, Europe - Germany, France, The UK, Spain, Italy, Russia, Netherlands, Rest of Europe, Asia-Pacific - China, Japan, South Korea, India, New Zealand, Singapore, Thailand, Vietnam, Rest of Asia Pacific, Latin America - Brazil, Mexico, Rest of Latin America, Middle East & Africa - South Africa, Saudi Arabia, UAE, Rest of Middle East & Africa Competitive Landscape SAP SE, SAS Institute Inc, Opta Sports (Perform Group), Catapult Group International Ltd, TruMedia Networks, Salesforce.com Inc., IBM Corporation, Sportradar AG, Microsoft Corporation, Other Key Players Customization Scope Customization for segments, region/country-level will be provided. Moreover, additional customization can be done based on the requirements. Purchase Options We have three licenses to opt for Single User License, Multi-User License (Up to 5 Users), Corporate Use License (Unlimited User and Printable PDF) -
- 1. Executive Summary
- 1.1. Definition
- 1.2. Taxonomy
- 1.3. Research Scope
- 1.4. Key Analysis
- 1.5. Key Findings by Major Segments
- 1.6. Top strategies by Major Players
- 2. Global Artificial Intelligence in Sports Market Overview
- 2.1. Artificial Intelligence in Sports Market Dynamics
- 2.1.1. Drivers
- 2.1.2. Opportunities
- 2.1.3. Restraints
- 2.1.4. Challenges
- 2.2. Macro-economic Factors
- 2.3. Regulatory Framework
- 2.4. Market Investment Feasibility Index
- 2.5. PEST Analysis
- 2.6. PORTER’S Five Force Analysis
- 2.7. Drivers & Restraints Impact Analysis
- 2.8. Industry Chain Analysis
- 2.9. Cost Structure Analysis
- 2.10. Marketing Strategy
- 2.11. Russia-Ukraine War Impact Analysis
- 2.12. Opportunity Map Analysis
- 2.13. Market Competition Scenario Analysis
- 2.14. Product Life Cycle Analysis
- 2.15. Opportunity Orbits
- 2.16. Manufacturer Intensity Map
- 2.17. Major Companies sales by Value & Volume
- 2.1. Artificial Intelligence in Sports Market Dynamics
- 3. Global Artificial Intelligence in Sports Market Analysis, Opportunity and Forecast, 2016-2032
- 3.1. Global Artificial Intelligence in Sports Market Analysis, 2016-2021
- 3.2. Global Artificial Intelligence in Sports Market Opportunity and Forecast, 2023-2032
- 3.3. Global Artificial Intelligence in Sports Market Analysis, Opportunity and Forecast, By By Component, 2016-2032
- 3.3.1. Global Artificial Intelligence in Sports Market Analysis by By Component: Introduction
- 3.3.2. Market Size Absolute $ Opportunity Analysis and Forecast, By By Component, 2016-2032
- 3.3.3. Software
- 3.3.4. Service
- 3.4. Global Artificial Intelligence in Sports Market Analysis, Opportunity and Forecast, By By Deployment Model, 2016-2032
- 3.4.1. Global Artificial Intelligence in Sports Market Analysis by By Deployment Model: Introduction
- 3.4.2. Market Size Absolute $ Opportunity Analysis and Forecast, By By Deployment Model, 2016-2032
- 3.4.3. On-premise
- 3.4.4. Cloud
- 3.5. Global Artificial Intelligence in Sports Market Analysis, Opportunity and Forecast, By By Technology, 2016-2032
- 3.5.1. Global Artificial Intelligence in Sports Market Analysis by By Technology: Introduction
- 3.5.2. Market Size Absolute $ Opportunity Analysis and Forecast, By By Technology, 2016-2032
- 3.5.3. Machine Learning
- 3.5.4. Natural Language Processing
- 3.5.5. Computer Vision
- 3.5.6. Data Analytics
- 3.5.7. Others
- 3.6. Global Artificial Intelligence in Sports Market Analysis, Opportunity and Forecast, By By Application, 2016-2032
- 3.6.1. Global Artificial Intelligence in Sports Market Analysis by By Application: Introduction
- 3.6.2. Market Size Absolute $ Opportunity Analysis and Forecast, By By Application, 2016-2032
- 3.6.3. Game Planning
- 3.6.4. Game Strategies
- 3.6.5. Performance Improvement
- 3.6.6. Injury Prevention
- 3.6.7. Sports Recruitment
- 3.6.8. Others
- 3.7. Global Artificial Intelligence in Sports Market Analysis, Opportunity and Forecast, By By Game Type, 2016-2032
- 3.7.1. Global Artificial Intelligence in Sports Market Analysis by By Game Type: Introduction
- 3.7.2. Market Size Absolute $ Opportunity Analysis and Forecast, By By Game Type, 2016-2032
- 3.7.3. Football
- 3.7.4. Cricket
- 3.7.5. Tennis
- 3.7.6. Basketball
- 3.7.7. Baseball
- 3.7.8. Others
- 4. North America Artificial Intelligence in Sports Market Analysis, Opportunity and Forecast, 2016-2032
- 4.1. North America Artificial Intelligence in Sports Market Analysis, 2016-2021
- 4.2. North America Artificial Intelligence in Sports Market Opportunity and Forecast, 2023-2032
- 4.3. North America Artificial Intelligence in Sports Market Analysis, Opportunity and Forecast, By By Component, 2016-2032
- 4.3.1. North America Artificial Intelligence in Sports Market Analysis by By Component: Introduction
- 4.3.2. Market Size Absolute $ Opportunity Analysis and Forecast, By By Component, 2016-2032
- 4.3.3. Software
- 4.3.4. Service
- 4.4. North America Artificial Intelligence in Sports Market Analysis, Opportunity and Forecast, By By Deployment Model, 2016-2032
- 4.4.1. North America Artificial Intelligence in Sports Market Analysis by By Deployment Model: Introduction
- 4.4.2. Market Size Absolute $ Opportunity Analysis and Forecast, By By Deployment Model, 2016-2032
- 4.4.3. On-premise
- 4.4.4. Cloud
- 4.5. North America Artificial Intelligence in Sports Market Analysis, Opportunity and Forecast, By By Technology, 2016-2032
- 4.5.1. North America Artificial Intelligence in Sports Market Analysis by By Technology: Introduction
- 4.5.2. Market Size Absolute $ Opportunity Analysis and Forecast, By By Technology, 2016-2032
- 4.5.3. Machine Learning
- 4.5.4. Natural Language Processing
- 4.5.5. Computer Vision
- 4.5.6. Data Analytics
- 4.5.7. Others
- 4.6. North America Artificial Intelligence in Sports Market Analysis, Opportunity and Forecast, By By Application, 2016-2032
- 4.6.1. North America Artificial Intelligence in Sports Market Analysis by By Application: Introduction
- 4.6.2. Market Size Absolute $ Opportunity Analysis and Forecast, By By Application, 2016-2032
- 4.6.3. Game Planning
- 4.6.4. Game Strategies
- 4.6.5. Performance Improvement
- 4.6.6. Injury Prevention
- 4.6.7. Sports Recruitment
- 4.6.8. Others
- 4.7. North America Artificial Intelligence in Sports Market Analysis, Opportunity and Forecast, By By Game Type, 2016-2032
- 4.7.1. North America Artificial Intelligence in Sports Market Analysis by By Game Type: Introduction
- 4.7.2. Market Size Absolute $ Opportunity Analysis and Forecast, By By Game Type, 2016-2032
- 4.7.3. Football
- 4.7.4. Cricket
- 4.7.5. Tennis
- 4.7.6. Basketball
- 4.7.7. Baseball
- 4.7.8. Others
- 4.8. North America Artificial Intelligence in Sports Market Analysis, Opportunity and Forecast, By Country , 2016-2032
- 4.8.1. North America Artificial Intelligence in Sports Market Analysis by Country : Introduction
- 4.8.2. Market Size Absolute $ Opportunity Analysis and Forecast, Country , 2016-2032
- 4.8.2.1. The US
- 4.8.2.2. Canada
- 4.8.2.3. Mexico
- 5. Western Europe Artificial Intelligence in Sports Market Analysis, Opportunity and Forecast, 2016-2032
- 5.1. Western Europe Artificial Intelligence in Sports Market Analysis, 2016-2021
- 5.2. Western Europe Artificial Intelligence in Sports Market Opportunity and Forecast, 2023-2032
- 5.3. Western Europe Artificial Intelligence in Sports Market Analysis, Opportunity and Forecast, By By Component, 2016-2032
- 5.3.1. Western Europe Artificial Intelligence in Sports Market Analysis by By Component: Introduction
- 5.3.2. Market Size Absolute $ Opportunity Analysis and Forecast, By By Component, 2016-2032
- 5.3.3. Software
- 5.3.4. Service
- 5.4. Western Europe Artificial Intelligence in Sports Market Analysis, Opportunity and Forecast, By By Deployment Model, 2016-2032
- 5.4.1. Western Europe Artificial Intelligence in Sports Market Analysis by By Deployment Model: Introduction
- 5.4.2. Market Size Absolute $ Opportunity Analysis and Forecast, By By Deployment Model, 2016-2032
- 5.4.3. On-premise
- 5.4.4. Cloud
- 5.5. Western Europe Artificial Intelligence in Sports Market Analysis, Opportunity and Forecast, By By Technology, 2016-2032
- 5.5.1. Western Europe Artificial Intelligence in Sports Market Analysis by By Technology: Introduction
- 5.5.2. Market Size Absolute $ Opportunity Analysis and Forecast, By By Technology, 2016-2032
- 5.5.3. Machine Learning
- 5.5.4. Natural Language Processing
- 5.5.5. Computer Vision
- 5.5.6. Data Analytics
- 5.5.7. Others
- 5.6. Western Europe Artificial Intelligence in Sports Market Analysis, Opportunity and Forecast, By By Application, 2016-2032
- 5.6.1. Western Europe Artificial Intelligence in Sports Market Analysis by By Application: Introduction
- 5.6.2. Market Size Absolute $ Opportunity Analysis and Forecast, By By Application, 2016-2032
- 5.6.3. Game Planning
- 5.6.4. Game Strategies
- 5.6.5. Performance Improvement
- 5.6.6. Injury Prevention
- 5.6.7. Sports Recruitment
- 5.6.8. Others
- 5.7. Western Europe Artificial Intelligence in Sports Market Analysis, Opportunity and Forecast, By By Game Type, 2016-2032
- 5.7.1. Western Europe Artificial Intelligence in Sports Market Analysis by By Game Type: Introduction
- 5.7.2. Market Size Absolute $ Opportunity Analysis and Forecast, By By Game Type, 2016-2032
- 5.7.3. Football
- 5.7.4. Cricket
- 5.7.5. Tennis
- 5.7.6. Basketball
- 5.7.7. Baseball
- 5.7.8. Others
- 5.8. Western Europe Artificial Intelligence in Sports Market Analysis, Opportunity and Forecast, By Country , 2016-2032
- 5.8.1. Western Europe Artificial Intelligence in Sports Market Analysis by Country : Introduction
- 5.8.2. Market Size Absolute $ Opportunity Analysis and Forecast, Country , 2016-2032
- 5.8.2.1. Germany
- 5.8.2.2. France
- 5.8.2.3. The UK
- 5.8.2.4. Spain
- 5.8.2.5. Italy
- 5.8.2.6. Portugal
- 5.8.2.7. Ireland
- 5.8.2.8. Austria
- 5.8.2.9. Switzerland
- 5.8.2.10. Benelux
- 5.8.2.11. Nordic
- 5.8.2.12. Rest of Western Europe
- 6. Eastern Europe Artificial Intelligence in Sports Market Analysis, Opportunity and Forecast, 2016-2032
- 6.1. Eastern Europe Artificial Intelligence in Sports Market Analysis, 2016-2021
- 6.2. Eastern Europe Artificial Intelligence in Sports Market Opportunity and Forecast, 2023-2032
- 6.3. Eastern Europe Artificial Intelligence in Sports Market Analysis, Opportunity and Forecast, By By Component, 2016-2032
- 6.3.1. Eastern Europe Artificial Intelligence in Sports Market Analysis by By Component: Introduction
- 6.3.2. Market Size Absolute $ Opportunity Analysis and Forecast, By By Component, 2016-2032
- 6.3.3. Software
- 6.3.4. Service
- 6.4. Eastern Europe Artificial Intelligence in Sports Market Analysis, Opportunity and Forecast, By By Deployment Model, 2016-2032
- 6.4.1. Eastern Europe Artificial Intelligence in Sports Market Analysis by By Deployment Model: Introduction
- 6.4.2. Market Size Absolute $ Opportunity Analysis and Forecast, By By Deployment Model, 2016-2032
- 6.4.3. On-premise
- 6.4.4. Cloud
- 6.5. Eastern Europe Artificial Intelligence in Sports Market Analysis, Opportunity and Forecast, By By Technology, 2016-2032
- 6.5.1. Eastern Europe Artificial Intelligence in Sports Market Analysis by By Technology: Introduction
- 6.5.2. Market Size Absolute $ Opportunity Analysis and Forecast, By By Technology, 2016-2032
- 6.5.3. Machine Learning
- 6.5.4. Natural Language Processing
- 6.5.5. Computer Vision
- 6.5.6. Data Analytics
- 6.5.7. Others
- 6.6. Eastern Europe Artificial Intelligence in Sports Market Analysis, Opportunity and Forecast, By By Application, 2016-2032
- 6.6.1. Eastern Europe Artificial Intelligence in Sports Market Analysis by By Application: Introduction
- 6.6.2. Market Size Absolute $ Opportunity Analysis and Forecast, By By Application, 2016-2032
- 6.6.3. Game Planning
- 6.6.4. Game Strategies
- 6.6.5. Performance Improvement
- 6.6.6. Injury Prevention
- 6.6.7. Sports Recruitment
- 6.6.8. Others
- 6.7. Eastern Europe Artificial Intelligence in Sports Market Analysis, Opportunity and Forecast, By By Game Type, 2016-2032
- 6.7.1. Eastern Europe Artificial Intelligence in Sports Market Analysis by By Game Type: Introduction
- 6.7.2. Market Size Absolute $ Opportunity Analysis and Forecast, By By Game Type, 2016-2032
- 6.7.3. Football
- 6.7.4. Cricket
- 6.7.5. Tennis
- 6.7.6. Basketball
- 6.7.7. Baseball
- 6.7.8. Others
- 6.8. Eastern Europe Artificial Intelligence in Sports Market Analysis, Opportunity and Forecast, By Country , 2016-2032
- 6.8.1. Eastern Europe Artificial Intelligence in Sports Market Analysis by Country : Introduction
- 6.8.2. Market Size Absolute $ Opportunity Analysis and Forecast, Country , 2016-2032
- 6.8.2.1. Russia
- 6.8.2.2. Poland
- 6.8.2.3. The Czech Republic
- 6.8.2.4. Greece
- 6.8.2.5. Rest of Eastern Europe
- 7. APAC Artificial Intelligence in Sports Market Analysis, Opportunity and Forecast, 2016-2032
- 7.1. APAC Artificial Intelligence in Sports Market Analysis, 2016-2021
- 7.2. APAC Artificial Intelligence in Sports Market Opportunity and Forecast, 2023-2032
- 7.3. APAC Artificial Intelligence in Sports Market Analysis, Opportunity and Forecast, By By Component, 2016-2032
- 7.3.1. APAC Artificial Intelligence in Sports Market Analysis by By Component: Introduction
- 7.3.2. Market Size Absolute $ Opportunity Analysis and Forecast, By By Component, 2016-2032
- 7.3.3. Software
- 7.3.4. Service
- 7.4. APAC Artificial Intelligence in Sports Market Analysis, Opportunity and Forecast, By By Deployment Model, 2016-2032
- 7.4.1. APAC Artificial Intelligence in Sports Market Analysis by By Deployment Model: Introduction
- 7.4.2. Market Size Absolute $ Opportunity Analysis and Forecast, By By Deployment Model, 2016-2032
- 7.4.3. On-premise
- 7.4.4. Cloud
- 7.5. APAC Artificial Intelligence in Sports Market Analysis, Opportunity and Forecast, By By Technology, 2016-2032
- 7.5.1. APAC Artificial Intelligence in Sports Market Analysis by By Technology: Introduction
- 7.5.2. Market Size Absolute $ Opportunity Analysis and Forecast, By By Technology, 2016-2032
- 7.5.3. Machine Learning
- 7.5.4. Natural Language Processing
- 7.5.5. Computer Vision
- 7.5.6. Data Analytics
- 7.5.7. Others
- 7.6. APAC Artificial Intelligence in Sports Market Analysis, Opportunity and Forecast, By By Application, 2016-2032
- 7.6.1. APAC Artificial Intelligence in Sports Market Analysis by By Application: Introduction
- 7.6.2. Market Size Absolute $ Opportunity Analysis and Forecast, By By Application, 2016-2032
- 7.6.3. Game Planning
- 7.6.4. Game Strategies
- 7.6.5. Performance Improvement
- 7.6.6. Injury Prevention
- 7.6.7. Sports Recruitment
- 7.6.8. Others
- 7.7. APAC Artificial Intelligence in Sports Market Analysis, Opportunity and Forecast, By By Game Type, 2016-2032
- 7.7.1. APAC Artificial Intelligence in Sports Market Analysis by By Game Type: Introduction
- 7.7.2. Market Size Absolute $ Opportunity Analysis and Forecast, By By Game Type, 2016-2032
- 7.7.3. Football
- 7.7.4. Cricket
- 7.7.5. Tennis
- 7.7.6. Basketball
- 7.7.7. Baseball
- 7.7.8. Others
- 7.8. APAC Artificial Intelligence in Sports Market Analysis, Opportunity and Forecast, By Country , 2016-2032
- 7.8.1. APAC Artificial Intelligence in Sports Market Analysis by Country : Introduction
- 7.8.2. Market Size Absolute $ Opportunity Analysis and Forecast, Country , 2016-2032
- 7.8.2.1. China
- 7.8.2.2. Japan
- 7.8.2.3. South Korea
- 7.8.2.4. India
- 7.8.2.5. Australia & New Zeland
- 7.8.2.6. Indonesia
- 7.8.2.7. Malaysia
- 7.8.2.8. Philippines
- 7.8.2.9. Singapore
- 7.8.2.10. Thailand
- 7.8.2.11. Vietnam
- 7.8.2.12. Rest of APAC
- 8. Latin America Artificial Intelligence in Sports Market Analysis, Opportunity and Forecast, 2016-2032
- 8.1. Latin America Artificial Intelligence in Sports Market Analysis, 2016-2021
- 8.2. Latin America Artificial Intelligence in Sports Market Opportunity and Forecast, 2023-2032
- 8.3. Latin America Artificial Intelligence in Sports Market Analysis, Opportunity and Forecast, By By Component, 2016-2032
- 8.3.1. Latin America Artificial Intelligence in Sports Market Analysis by By Component: Introduction
- 8.3.2. Market Size Absolute $ Opportunity Analysis and Forecast, By By Component, 2016-2032
- 8.3.3. Software
- 8.3.4. Service
- 8.4. Latin America Artificial Intelligence in Sports Market Analysis, Opportunity and Forecast, By By Deployment Model, 2016-2032
- 8.4.1. Latin America Artificial Intelligence in Sports Market Analysis by By Deployment Model: Introduction
- 8.4.2. Market Size Absolute $ Opportunity Analysis and Forecast, By By Deployment Model, 2016-2032
- 8.4.3. On-premise
- 8.4.4. Cloud
- 8.5. Latin America Artificial Intelligence in Sports Market Analysis, Opportunity and Forecast, By By Technology, 2016-2032
- 8.5.1. Latin America Artificial Intelligence in Sports Market Analysis by By Technology: Introduction
- 8.5.2. Market Size Absolute $ Opportunity Analysis and Forecast, By By Technology, 2016-2032
- 8.5.3. Machine Learning
- 8.5.4. Natural Language Processing
- 8.5.5. Computer Vision
- 8.5.6. Data Analytics
- 8.5.7. Others
- 8.6. Latin America Artificial Intelligence in Sports Market Analysis, Opportunity and Forecast, By By Application, 2016-2032
- 8.6.1. Latin America Artificial Intelligence in Sports Market Analysis by By Application: Introduction
- 8.6.2. Market Size Absolute $ Opportunity Analysis and Forecast, By By Application, 2016-2032
- 8.6.3. Game Planning
- 8.6.4. Game Strategies
- 8.6.5. Performance Improvement
- 8.6.6. Injury Prevention
- 8.6.7. Sports Recruitment
- 8.6.8. Others
- 8.7. Latin America Artificial Intelligence in Sports Market Analysis, Opportunity and Forecast, By By Game Type, 2016-2032
- 8.7.1. Latin America Artificial Intelligence in Sports Market Analysis by By Game Type: Introduction
- 8.7.2. Market Size Absolute $ Opportunity Analysis and Forecast, By By Game Type, 2016-2032
- 8.7.3. Football
- 8.7.4. Cricket
- 8.7.5. Tennis
- 8.7.6. Basketball
- 8.7.7. Baseball
- 8.7.8. Others
- 8.8. Latin America Artificial Intelligence in Sports Market Analysis, Opportunity and Forecast, By Country , 2016-2032
- 8.8.1. Latin America Artificial Intelligence in Sports Market Analysis by Country : Introduction
- 8.8.2. Market Size Absolute $ Opportunity Analysis and Forecast, Country , 2016-2032
- 8.8.2.1. Brazil
- 8.8.2.2. Colombia
- 8.8.2.3. Chile
- 8.8.2.4. Argentina
- 8.8.2.5. Costa Rica
- 8.8.2.6. Rest of Latin America
- 9. Middle East & Africa Artificial Intelligence in Sports Market Analysis, Opportunity and Forecast, 2016-2032
- 9.1. Middle East & Africa Artificial Intelligence in Sports Market Analysis, 2016-2021
- 9.2. Middle East & Africa Artificial Intelligence in Sports Market Opportunity and Forecast, 2023-2032
- 9.3. Middle East & Africa Artificial Intelligence in Sports Market Analysis, Opportunity and Forecast, By By Component, 2016-2032
- 9.3.1. Middle East & Africa Artificial Intelligence in Sports Market Analysis by By Component: Introduction
- 9.3.2. Market Size Absolute $ Opportunity Analysis and Forecast, By By Component, 2016-2032
- 9.3.3. Software
- 9.3.4. Service
- 9.4. Middle East & Africa Artificial Intelligence in Sports Market Analysis, Opportunity and Forecast, By By Deployment Model, 2016-2032
- 9.4.1. Middle East & Africa Artificial Intelligence in Sports Market Analysis by By Deployment Model: Introduction
- 9.4.2. Market Size Absolute $ Opportunity Analysis and Forecast, By By Deployment Model, 2016-2032
- 9.4.3. On-premise
- 9.4.4. Cloud
- 9.5. Middle East & Africa Artificial Intelligence in Sports Market Analysis, Opportunity and Forecast, By By Technology, 2016-2032
- 9.5.1. Middle East & Africa Artificial Intelligence in Sports Market Analysis by By Technology: Introduction
- 9.5.2. Market Size Absolute $ Opportunity Analysis and Forecast, By By Technology, 2016-2032
- 9.5.3. Machine Learning
- 9.5.4. Natural Language Processing
- 9.5.5. Computer Vision
- 9.5.6. Data Analytics
- 9.5.7. Others
- 9.6. Middle East & Africa Artificial Intelligence in Sports Market Analysis, Opportunity and Forecast, By By Application, 2016-2032
- 9.6.1. Middle East & Africa Artificial Intelligence in Sports Market Analysis by By Application: Introduction
- 9.6.2. Market Size Absolute $ Opportunity Analysis and Forecast, By By Application, 2016-2032
- 9.6.3. Game Planning
- 9.6.4. Game Strategies
- 9.6.5. Performance Improvement
- 9.6.6. Injury Prevention
- 9.6.7. Sports Recruitment
- 9.6.8. Others
- 9.7. Middle East & Africa Artificial Intelligence in Sports Market Analysis, Opportunity and Forecast, By By Game Type, 2016-2032
- 9.7.1. Middle East & Africa Artificial Intelligence in Sports Market Analysis by By Game Type: Introduction
- 9.7.2. Market Size Absolute $ Opportunity Analysis and Forecast, By By Game Type, 2016-2032
- 9.7.3. Football
- 9.7.4. Cricket
- 9.7.5. Tennis
- 9.7.6. Basketball
- 9.7.7. Baseball
- 9.7.8. Others
- 9.8. Middle East & Africa Artificial Intelligence in Sports Market Analysis, Opportunity and Forecast, By Country , 2016-2032
- 9.8.1. Middle East & Africa Artificial Intelligence in Sports Market Analysis by Country : Introduction
- 9.8.2. Market Size Absolute $ Opportunity Analysis and Forecast, Country , 2016-2032
- 9.8.2.1. Algeria
- 9.8.2.2. Egypt
- 9.8.2.3. Israel
- 9.8.2.4. Kuwait
- 9.8.2.5. Nigeria
- 9.8.2.6. Saudi Arabia
- 9.8.2.7. South Africa
- 9.8.2.8. Turkey
- 9.8.2.9. The UAE
- 9.8.2.10. Rest of MEA
- 10. Global Artificial Intelligence in Sports Market Analysis, Opportunity and Forecast, By Region , 2016-2032
- 10.1. Global Artificial Intelligence in Sports Market Analysis by Region : Introduction
- 10.2. Market Size Absolute $ Opportunity Analysis and Forecast, By Region , 2016-2032
- 10.2.1. North America
- 10.2.2. Western Europe
- 10.2.3. Eastern Europe
- 10.2.4. APAC
- 10.2.5. Latin America
- 10.2.6. Middle East & Africa
- 11. Global Artificial Intelligence in Sports Market Competitive Landscape, Market Share Analysis, and Company Profiles
- 11.1. Market Share Analysis
- 11.2. Company Profiles
- 11.3. SAP SE
- 11.3.1. Company Overview
- 11.3.2. Financial Highlights
- 11.3.3. Product Portfolio
- 11.3.4. SWOT Analysis
- 11.3.5. Key Strategies and Developments
- 11.4. SAS Institute Inc
- 11.4.1. Company Overview
- 11.4.2. Financial Highlights
- 11.4.3. Product Portfolio
- 11.4.4. SWOT Analysis
- 11.4.5. Key Strategies and Developments
- 11.5. Opta Sports (Perform Group)
- 11.5.1. Company Overview
- 11.5.2. Financial Highlights
- 11.5.3. Product Portfolio
- 11.5.4. SWOT Analysis
- 11.5.5. Key Strategies and Developments
- 11.6. Catapult Group International Ltd
- 11.6.1. Company Overview
- 11.6.2. Financial Highlights
- 11.6.3. Product Portfolio
- 11.6.4. SWOT Analysis
- 11.6.5. Key Strategies and Developments
- 11.7. TruMedia Networks
- 11.7.1. Company Overview
- 11.7.2. Financial Highlights
- 11.7.3. Product Portfolio
- 11.7.4. SWOT Analysis
- 11.7.5. Key Strategies and Developments
- 11.8. Salesforce.com Inc.
- 11.8.1. Company Overview
- 11.8.2. Financial Highlights
- 11.8.3. Product Portfolio
- 11.8.4. SWOT Analysis
- 11.8.5. Key Strategies and Developments
- 11.9. IBM Corporation
- 11.9.1. Company Overview
- 11.9.2. Financial Highlights
- 11.9.3. Product Portfolio
- 11.9.4. SWOT Analysis
- 11.9.5. Key Strategies and Developments
- 11.10. Sportradar AG
- 11.10.1. Company Overview
- 11.10.2. Financial Highlights
- 11.10.3. Product Portfolio
- 11.10.4. SWOT Analysis
- 11.10.5. Key Strategies and Developments
- 11.11. Microsoft Corporation
- 11.11.1. Company Overview
- 11.11.2. Financial Highlights
- 11.11.3. Product Portfolio
- 11.11.4. SWOT Analysis
- 11.11.5. Key Strategies and Developments
- 11.12. Other Key Players
- 11.12.1. Company Overview
- 11.12.2. Financial Highlights
- 11.12.3. Product Portfolio
- 11.12.4. SWOT Analysis
- 11.12.5. Key Strategies and Developments
- 11.13.1. Company Overview
- 11.13.2. Financial Highlights
- 11.13.3. Product Portfolio
- 11.13.4. SWOT Analysis
- 11.13.5. Key Strategies and Developments
- 12. Assumptions and Acronyms
- 13. Research Methodology
- 14. Contact
List of Figures
- Figure 1: Global Artificial Intelligence in Sports Market Revenue (US$ Mn) Market Share by By Component in 2022
- Figure 2: Global Artificial Intelligence in Sports Market Market Attractiveness Analysis by By Component, 2016-2032
- Figure 3: Global Artificial Intelligence in Sports Market Revenue (US$ Mn) Market Share by By Deployment Modelin 2022
- Figure 4: Global Artificial Intelligence in Sports Market Market Attractiveness Analysis by By Deployment Model, 2016-2032
- Figure 5: Global Artificial Intelligence in Sports Market Revenue (US$ Mn) Market Share by By Technologyin 2022
- Figure 6: Global Artificial Intelligence in Sports Market Market Attractiveness Analysis by By Technology, 2016-2032
- Figure 7: Global Artificial Intelligence in Sports Market Revenue (US$ Mn) Market Share by By Applicationin 2022
- Figure 8: Global Artificial Intelligence in Sports Market Market Attractiveness Analysis by By Application, 2016-2032
- Figure 9: Global Artificial Intelligence in Sports Market Revenue (US$ Mn) Market Share by By Game Typein 2022
- Figure 10: Global Artificial Intelligence in Sports Market Market Attractiveness Analysis by By Game Type, 2016-2032
- Figure 11: Global Artificial Intelligence in Sports Market Revenue (US$ Mn) Market Share by Region in 2022
- Figure 12: Global Artificial Intelligence in Sports Market Market Attractiveness Analysis by Region, 2016-2032
- Figure 13: Global Artificial Intelligence in Sports Market Market Revenue (US$ Mn) (2016-2032)
- Figure 14: Global Artificial Intelligence in Sports Market Market Revenue (US$ Mn) Comparison by Region (2016-2032)
- Figure 15: Global Artificial Intelligence in Sports Market Market Revenue (US$ Mn) Comparison by By Component (2016-2032)
- Figure 16: Global Artificial Intelligence in Sports Market Market Revenue (US$ Mn) Comparison by By Deployment Model (2016-2032)
- Figure 17: Global Artificial Intelligence in Sports Market Market Revenue (US$ Mn) Comparison by By Technology (2016-2032)
- Figure 18: Global Artificial Intelligence in Sports Market Market Revenue (US$ Mn) Comparison by By Application (2016-2032)
- Figure 19: Global Artificial Intelligence in Sports Market Market Revenue (US$ Mn) Comparison by By Game Type (2016-2032)
- Figure 20: Global Artificial Intelligence in Sports Market Market Y-o-Y Growth Rate Comparison by Region (2016-2032)
- Figure 21: Global Artificial Intelligence in Sports Market Market Y-o-Y Growth Rate Comparison by By Component (2016-2032)
- Figure 22: Global Artificial Intelligence in Sports Market Market Y-o-Y Growth Rate Comparison by By Deployment Model (2016-2032)
- Figure 23: Global Artificial Intelligence in Sports Market Market Y-o-Y Growth Rate Comparison by By Technology (2016-2032)
- Figure 24: Global Artificial Intelligence in Sports Market Market Y-o-Y Growth Rate Comparison by By Application (2016-2032)
- Figure 25: Global Artificial Intelligence in Sports Market Market Y-o-Y Growth Rate Comparison by By Game Type (2016-2032)
- Figure 26: Global Artificial Intelligence in Sports Market Market Share Comparison by Region (2016-2032)
- Figure 27: Global Artificial Intelligence in Sports Market Market Share Comparison by By Component (2016-2032)
- Figure 28: Global Artificial Intelligence in Sports Market Market Share Comparison by By Deployment Model (2016-2032)
- Figure 29: Global Artificial Intelligence in Sports Market Market Share Comparison by By Technology (2016-2032)
- Figure 30: Global Artificial Intelligence in Sports Market Market Share Comparison by By Application (2016-2032)
- Figure 31: Global Artificial Intelligence in Sports Market Market Share Comparison by By Game Type (2016-2032)
- Figure 32: North America Artificial Intelligence in Sports Market Revenue (US$ Mn) Market Share by By Componentin 2022
- Figure 33: North America Artificial Intelligence in Sports Market Market Attractiveness Analysis by By Component, 2016-2032
- Figure 34: North America Artificial Intelligence in Sports Market Revenue (US$ Mn) Market Share by By Deployment Modelin 2022
- Figure 35: North America Artificial Intelligence in Sports Market Market Attractiveness Analysis by By Deployment Model, 2016-2032
- Figure 36: North America Artificial Intelligence in Sports Market Revenue (US$ Mn) Market Share by By Technologyin 2022
- Figure 37: North America Artificial Intelligence in Sports Market Market Attractiveness Analysis by By Technology, 2016-2032
- Figure 38: North America Artificial Intelligence in Sports Market Revenue (US$ Mn) Market Share by By Applicationin 2022
- Figure 39: North America Artificial Intelligence in Sports Market Market Attractiveness Analysis by By Application, 2016-2032
- Figure 40: North America Artificial Intelligence in Sports Market Revenue (US$ Mn) Market Share by By Game Typein 2022
- Figure 41: North America Artificial Intelligence in Sports Market Market Attractiveness Analysis by By Game Type, 2016-2032
- Figure 42: North America Artificial Intelligence in Sports Market Revenue (US$ Mn) Market Share by Country in 2022
- Figure 43: North America Artificial Intelligence in Sports Market Market Attractiveness Analysis by Country, 2016-2032
- Figure 44: North America Artificial Intelligence in Sports Market Market Revenue (US$ Mn) (2016-2032)
- Figure 45: North America Artificial Intelligence in Sports Market Market Revenue (US$ Mn) Comparison by Country (2016-2032)
- Figure 46: North America Artificial Intelligence in Sports Market Market Revenue (US$ Mn) Comparison by By Component (2016-2032)
- Figure 47: North America Artificial Intelligence in Sports Market Market Revenue (US$ Mn) Comparison by By Deployment Model (2016-2032)
- Figure 48: North America Artificial Intelligence in Sports Market Market Revenue (US$ Mn) Comparison by By Technology (2016-2032)
- Figure 49: North America Artificial Intelligence in Sports Market Market Revenue (US$ Mn) Comparison by By Application (2016-2032)
- Figure 50: North America Artificial Intelligence in Sports Market Market Revenue (US$ Mn) Comparison by By Game Type (2016-2032)
- Figure 51: North America Artificial Intelligence in Sports Market Market Y-o-Y Growth Rate Comparison by Country (2016-2032)
- Figure 52: North America Artificial Intelligence in Sports Market Market Y-o-Y Growth Rate Comparison by By Component (2016-2032)
- Figure 53: North America Artificial Intelligence in Sports Market Market Y-o-Y Growth Rate Comparison by By Deployment Model (2016-2032)
- Figure 54: North America Artificial Intelligence in Sports Market Market Y-o-Y Growth Rate Comparison by By Technology (2016-2032)
- Figure 55: North America Artificial Intelligence in Sports Market Market Y-o-Y Growth Rate Comparison by By Application (2016-2032)
- Figure 56: North America Artificial Intelligence in Sports Market Market Y-o-Y Growth Rate Comparison by By Game Type (2016-2032)
- Figure 57: North America Artificial Intelligence in Sports Market Market Share Comparison by Country (2016-2032)
- Figure 58: North America Artificial Intelligence in Sports Market Market Share Comparison by By Component (2016-2032)
- Figure 59: North America Artificial Intelligence in Sports Market Market Share Comparison by By Deployment Model (2016-2032)
- Figure 60: North America Artificial Intelligence in Sports Market Market Share Comparison by By Technology (2016-2032)
- Figure 61: North America Artificial Intelligence in Sports Market Market Share Comparison by By Application (2016-2032)
- Figure 62: North America Artificial Intelligence in Sports Market Market Share Comparison by By Game Type (2016-2032)
- Figure 63: Western Europe Artificial Intelligence in Sports Market Revenue (US$ Mn) Market Share by By Componentin 2022
- Figure 64: Western Europe Artificial Intelligence in Sports Market Market Attractiveness Analysis by By Component, 2016-2032
- Figure 65: Western Europe Artificial Intelligence in Sports Market Revenue (US$ Mn) Market Share by By Deployment Modelin 2022
- Figure 66: Western Europe Artificial Intelligence in Sports Market Market Attractiveness Analysis by By Deployment Model, 2016-2032
- Figure 67: Western Europe Artificial Intelligence in Sports Market Revenue (US$ Mn) Market Share by By Technologyin 2022
- Figure 68: Western Europe Artificial Intelligence in Sports Market Market Attractiveness Analysis by By Technology, 2016-2032
- Figure 69: Western Europe Artificial Intelligence in Sports Market Revenue (US$ Mn) Market Share by By Applicationin 2022
- Figure 70: Western Europe Artificial Intelligence in Sports Market Market Attractiveness Analysis by By Application, 2016-2032
- Figure 71: Western Europe Artificial Intelligence in Sports Market Revenue (US$ Mn) Market Share by By Game Typein 2022
- Figure 72: Western Europe Artificial Intelligence in Sports Market Market Attractiveness Analysis by By Game Type, 2016-2032
- Figure 73: Western Europe Artificial Intelligence in Sports Market Revenue (US$ Mn) Market Share by Country in 2022
- Figure 74: Western Europe Artificial Intelligence in Sports Market Market Attractiveness Analysis by Country, 2016-2032
- Figure 75: Western Europe Artificial Intelligence in Sports Market Market Revenue (US$ Mn) (2016-2032)
- Figure 76: Western Europe Artificial Intelligence in Sports Market Market Revenue (US$ Mn) Comparison by Country (2016-2032)
- Figure 77: Western Europe Artificial Intelligence in Sports Market Market Revenue (US$ Mn) Comparison by By Component (2016-2032)
- Figure 78: Western Europe Artificial Intelligence in Sports Market Market Revenue (US$ Mn) Comparison by By Deployment Model (2016-2032)
- Figure 79: Western Europe Artificial Intelligence in Sports Market Market Revenue (US$ Mn) Comparison by By Technology (2016-2032)
- Figure 80: Western Europe Artificial Intelligence in Sports Market Market Revenue (US$ Mn) Comparison by By Application (2016-2032)
- Figure 81: Western Europe Artificial Intelligence in Sports Market Market Revenue (US$ Mn) Comparison by By Game Type (2016-2032)
- Figure 82: Western Europe Artificial Intelligence in Sports Market Market Y-o-Y Growth Rate Comparison by Country (2016-2032)
- Figure 83: Western Europe Artificial Intelligence in Sports Market Market Y-o-Y Growth Rate Comparison by By Component (2016-2032)
- Figure 84: Western Europe Artificial Intelligence in Sports Market Market Y-o-Y Growth Rate Comparison by By Deployment Model (2016-2032)
- Figure 85: Western Europe Artificial Intelligence in Sports Market Market Y-o-Y Growth Rate Comparison by By Technology (2016-2032)
- Figure 86: Western Europe Artificial Intelligence in Sports Market Market Y-o-Y Growth Rate Comparison by By Application (2016-2032)
- Figure 87: Western Europe Artificial Intelligence in Sports Market Market Y-o-Y Growth Rate Comparison by By Game Type (2016-2032)
- Figure 88: Western Europe Artificial Intelligence in Sports Market Market Share Comparison by Country (2016-2032)
- Figure 89: Western Europe Artificial Intelligence in Sports Market Market Share Comparison by By Component (2016-2032)
- Figure 90: Western Europe Artificial Intelligence in Sports Market Market Share Comparison by By Deployment Model (2016-2032)
- Figure 91: Western Europe Artificial Intelligence in Sports Market Market Share Comparison by By Technology (2016-2032)
- Figure 92: Western Europe Artificial Intelligence in Sports Market Market Share Comparison by By Application (2016-2032)
- Figure 93: Western Europe Artificial Intelligence in Sports Market Market Share Comparison by By Game Type (2016-2032)
- Figure 94: Eastern Europe Artificial Intelligence in Sports Market Revenue (US$ Mn) Market Share by By Componentin 2022
- Figure 95: Eastern Europe Artificial Intelligence in Sports Market Market Attractiveness Analysis by By Component, 2016-2032
- Figure 96: Eastern Europe Artificial Intelligence in Sports Market Revenue (US$ Mn) Market Share by By Deployment Modelin 2022
- Figure 97: Eastern Europe Artificial Intelligence in Sports Market Market Attractiveness Analysis by By Deployment Model, 2016-2032
- Figure 98: Eastern Europe Artificial Intelligence in Sports Market Revenue (US$ Mn) Market Share by By Technologyin 2022
- Figure 99: Eastern Europe Artificial Intelligence in Sports Market Market Attractiveness Analysis by By Technology, 2016-2032
- Figure 100: Eastern Europe Artificial Intelligence in Sports Market Revenue (US$ Mn) Market Share by By Applicationin 2022
- Figure 101: Eastern Europe Artificial Intelligence in Sports Market Market Attractiveness Analysis by By Application, 2016-2032
- Figure 102: Eastern Europe Artificial Intelligence in Sports Market Revenue (US$ Mn) Market Share by By Game Typein 2022
- Figure 103: Eastern Europe Artificial Intelligence in Sports Market Market Attractiveness Analysis by By Game Type, 2016-2032
- Figure 104: Eastern Europe Artificial Intelligence in Sports Market Revenue (US$ Mn) Market Share by Country in 2022
- Figure 105: Eastern Europe Artificial Intelligence in Sports Market Market Attractiveness Analysis by Country, 2016-2032
- Figure 106: Eastern Europe Artificial Intelligence in Sports Market Market Revenue (US$ Mn) (2016-2032)
- Figure 107: Eastern Europe Artificial Intelligence in Sports Market Market Revenue (US$ Mn) Comparison by Country (2016-2032)
- Figure 108: Eastern Europe Artificial Intelligence in Sports Market Market Revenue (US$ Mn) Comparison by By Component (2016-2032)
- Figure 109: Eastern Europe Artificial Intelligence in Sports Market Market Revenue (US$ Mn) Comparison by By Deployment Model (2016-2032)
- Figure 110: Eastern Europe Artificial Intelligence in Sports Market Market Revenue (US$ Mn) Comparison by By Technology (2016-2032)
- Figure 111: Eastern Europe Artificial Intelligence in Sports Market Market Revenue (US$ Mn) Comparison by By Application (2016-2032)
- Figure 112: Eastern Europe Artificial Intelligence in Sports Market Market Revenue (US$ Mn) Comparison by By Game Type (2016-2032)
- Figure 113: Eastern Europe Artificial Intelligence in Sports Market Market Y-o-Y Growth Rate Comparison by Country (2016-2032)
- Figure 114: Eastern Europe Artificial Intelligence in Sports Market Market Y-o-Y Growth Rate Comparison by By Component (2016-2032)
- Figure 115: Eastern Europe Artificial Intelligence in Sports Market Market Y-o-Y Growth Rate Comparison by By Deployment Model (2016-2032)
- Figure 116: Eastern Europe Artificial Intelligence in Sports Market Market Y-o-Y Growth Rate Comparison by By Technology (2016-2032)
- Figure 117: Eastern Europe Artificial Intelligence in Sports Market Market Y-o-Y Growth Rate Comparison by By Application (2016-2032)
- Figure 118: Eastern Europe Artificial Intelligence in Sports Market Market Y-o-Y Growth Rate Comparison by By Game Type (2016-2032)
- Figure 119: Eastern Europe Artificial Intelligence in Sports Market Market Share Comparison by Country (2016-2032)
- Figure 120: Eastern Europe Artificial Intelligence in Sports Market Market Share Comparison by By Component (2016-2032)
- Figure 121: Eastern Europe Artificial Intelligence in Sports Market Market Share Comparison by By Deployment Model (2016-2032)
- Figure 122: Eastern Europe Artificial Intelligence in Sports Market Market Share Comparison by By Technology (2016-2032)
- Figure 123: Eastern Europe Artificial Intelligence in Sports Market Market Share Comparison by By Application (2016-2032)
- Figure 124: Eastern Europe Artificial Intelligence in Sports Market Market Share Comparison by By Game Type (2016-2032)
- Figure 125: APAC Artificial Intelligence in Sports Market Revenue (US$ Mn) Market Share by By Componentin 2022
- Figure 126: APAC Artificial Intelligence in Sports Market Market Attractiveness Analysis by By Component, 2016-2032
- Figure 127: APAC Artificial Intelligence in Sports Market Revenue (US$ Mn) Market Share by By Deployment Modelin 2022
- Figure 128: APAC Artificial Intelligence in Sports Market Market Attractiveness Analysis by By Deployment Model, 2016-2032
- Figure 129: APAC Artificial Intelligence in Sports Market Revenue (US$ Mn) Market Share by By Technologyin 2022
- Figure 130: APAC Artificial Intelligence in Sports Market Market Attractiveness Analysis by By Technology, 2016-2032
- Figure 131: APAC Artificial Intelligence in Sports Market Revenue (US$ Mn) Market Share by By Applicationin 2022
- Figure 132: APAC Artificial Intelligence in Sports Market Market Attractiveness Analysis by By Application, 2016-2032
- Figure 133: APAC Artificial Intelligence in Sports Market Revenue (US$ Mn) Market Share by By Game Typein 2022
- Figure 134: APAC Artificial Intelligence in Sports Market Market Attractiveness Analysis by By Game Type, 2016-2032
- Figure 135: APAC Artificial Intelligence in Sports Market Revenue (US$ Mn) Market Share by Country in 2022
- Figure 136: APAC Artificial Intelligence in Sports Market Market Attractiveness Analysis by Country, 2016-2032
- Figure 137: APAC Artificial Intelligence in Sports Market Market Revenue (US$ Mn) (2016-2032)
- Figure 138: APAC Artificial Intelligence in Sports Market Market Revenue (US$ Mn) Comparison by Country (2016-2032)
- Figure 139: APAC Artificial Intelligence in Sports Market Market Revenue (US$ Mn) Comparison by By Component (2016-2032)
- Figure 140: APAC Artificial Intelligence in Sports Market Market Revenue (US$ Mn) Comparison by By Deployment Model (2016-2032)
- Figure 141: APAC Artificial Intelligence in Sports Market Market Revenue (US$ Mn) Comparison by By Technology (2016-2032)
- Figure 142: APAC Artificial Intelligence in Sports Market Market Revenue (US$ Mn) Comparison by By Application (2016-2032)
- Figure 143: APAC Artificial Intelligence in Sports Market Market Revenue (US$ Mn) Comparison by By Game Type (2016-2032)
- Figure 144: APAC Artificial Intelligence in Sports Market Market Y-o-Y Growth Rate Comparison by Country (2016-2032)
- Figure 145: APAC Artificial Intelligence in Sports Market Market Y-o-Y Growth Rate Comparison by By Component (2016-2032)
- Figure 146: APAC Artificial Intelligence in Sports Market Market Y-o-Y Growth Rate Comparison by By Deployment Model (2016-2032)
- Figure 147: APAC Artificial Intelligence in Sports Market Market Y-o-Y Growth Rate Comparison by By Technology (2016-2032)
- Figure 148: APAC Artificial Intelligence in Sports Market Market Y-o-Y Growth Rate Comparison by By Application (2016-2032)
- Figure 149: APAC Artificial Intelligence in Sports Market Market Y-o-Y Growth Rate Comparison by By Game Type (2016-2032)
- Figure 150: APAC Artificial Intelligence in Sports Market Market Share Comparison by Country (2016-2032)
- Figure 151: APAC Artificial Intelligence in Sports Market Market Share Comparison by By Component (2016-2032)
- Figure 152: APAC Artificial Intelligence in Sports Market Market Share Comparison by By Deployment Model (2016-2032)
- Figure 153: APAC Artificial Intelligence in Sports Market Market Share Comparison by By Technology (2016-2032)
- Figure 154: APAC Artificial Intelligence in Sports Market Market Share Comparison by By Application (2016-2032)
- Figure 155: APAC Artificial Intelligence in Sports Market Market Share Comparison by By Game Type (2016-2032)
- Figure 156: Latin America Artificial Intelligence in Sports Market Revenue (US$ Mn) Market Share by By Componentin 2022
- Figure 157: Latin America Artificial Intelligence in Sports Market Market Attractiveness Analysis by By Component, 2016-2032
- Figure 158: Latin America Artificial Intelligence in Sports Market Revenue (US$ Mn) Market Share by By Deployment Modelin 2022
- Figure 159: Latin America Artificial Intelligence in Sports Market Market Attractiveness Analysis by By Deployment Model, 2016-2032
- Figure 160: Latin America Artificial Intelligence in Sports Market Revenue (US$ Mn) Market Share by By Technologyin 2022
- Figure 161: Latin America Artificial Intelligence in Sports Market Market Attractiveness Analysis by By Technology, 2016-2032
- Figure 162: Latin America Artificial Intelligence in Sports Market Revenue (US$ Mn) Market Share by By Applicationin 2022
- Figure 163: Latin America Artificial Intelligence in Sports Market Market Attractiveness Analysis by By Application, 2016-2032
- Figure 164: Latin America Artificial Intelligence in Sports Market Revenue (US$ Mn) Market Share by By Game Typein 2022
- Figure 165: Latin America Artificial Intelligence in Sports Market Market Attractiveness Analysis by By Game Type, 2016-2032
- Figure 166: Latin America Artificial Intelligence in Sports Market Revenue (US$ Mn) Market Share by Country in 2022
- Figure 167: Latin America Artificial Intelligence in Sports Market Market Attractiveness Analysis by Country, 2016-2032
- Figure 168: Latin America Artificial Intelligence in Sports Market Market Revenue (US$ Mn) (2016-2032)
- Figure 169: Latin America Artificial Intelligence in Sports Market Market Revenue (US$ Mn) Comparison by Country (2016-2032)
- Figure 170: Latin America Artificial Intelligence in Sports Market Market Revenue (US$ Mn) Comparison by By Component (2016-2032)
- Figure 171: Latin America Artificial Intelligence in Sports Market Market Revenue (US$ Mn) Comparison by By Deployment Model (2016-2032)
- Figure 172: Latin America Artificial Intelligence in Sports Market Market Revenue (US$ Mn) Comparison by By Technology (2016-2032)
- Figure 173: Latin America Artificial Intelligence in Sports Market Market Revenue (US$ Mn) Comparison by By Application (2016-2032)
- Figure 174: Latin America Artificial Intelligence in Sports Market Market Revenue (US$ Mn) Comparison by By Game Type (2016-2032)
- Figure 175: Latin America Artificial Intelligence in Sports Market Market Y-o-Y Growth Rate Comparison by Country (2016-2032)
- Figure 176: Latin America Artificial Intelligence in Sports Market Market Y-o-Y Growth Rate Comparison by By Component (2016-2032)
- Figure 177: Latin America Artificial Intelligence in Sports Market Market Y-o-Y Growth Rate Comparison by By Deployment Model (2016-2032)
- Figure 178: Latin America Artificial Intelligence in Sports Market Market Y-o-Y Growth Rate Comparison by By Technology (2016-2032)
- Figure 179: Latin America Artificial Intelligence in Sports Market Market Y-o-Y Growth Rate Comparison by By Application (2016-2032)
- Figure 180: Latin America Artificial Intelligence in Sports Market Market Y-o-Y Growth Rate Comparison by By Game Type (2016-2032)
- Figure 181: Latin America Artificial Intelligence in Sports Market Market Share Comparison by Country (2016-2032)
- Figure 182: Latin America Artificial Intelligence in Sports Market Market Share Comparison by By Component (2016-2032)
- Figure 183: Latin America Artificial Intelligence in Sports Market Market Share Comparison by By Deployment Model (2016-2032)
- Figure 184: Latin America Artificial Intelligence in Sports Market Market Share Comparison by By Technology (2016-2032)
- Figure 185: Latin America Artificial Intelligence in Sports Market Market Share Comparison by By Application (2016-2032)
- Figure 186: Latin America Artificial Intelligence in Sports Market Market Share Comparison by By Game Type (2016-2032)
- Figure 187: Middle East & Africa Artificial Intelligence in Sports Market Revenue (US$ Mn) Market Share by By Componentin 2022
- Figure 188: Middle East & Africa Artificial Intelligence in Sports Market Market Attractiveness Analysis by By Component, 2016-2032
- Figure 189: Middle East & Africa Artificial Intelligence in Sports Market Revenue (US$ Mn) Market Share by By Deployment Modelin 2022
- Figure 190: Middle East & Africa Artificial Intelligence in Sports Market Market Attractiveness Analysis by By Deployment Model, 2016-2032
- Figure 191: Middle East & Africa Artificial Intelligence in Sports Market Revenue (US$ Mn) Market Share by By Technologyin 2022
- Figure 192: Middle East & Africa Artificial Intelligence in Sports Market Market Attractiveness Analysis by By Technology, 2016-2032
- Figure 193: Middle East & Africa Artificial Intelligence in Sports Market Revenue (US$ Mn) Market Share by By Applicationin 2022
- Figure 194: Middle East & Africa Artificial Intelligence in Sports Market Market Attractiveness Analysis by By Application, 2016-2032
- Figure 195: Middle East & Africa Artificial Intelligence in Sports Market Revenue (US$ Mn) Market Share by By Game Typein 2022
- Figure 196: Middle East & Africa Artificial Intelligence in Sports Market Market Attractiveness Analysis by By Game Type, 2016-2032
- Figure 197: Middle East & Africa Artificial Intelligence in Sports Market Revenue (US$ Mn) Market Share by Country in 2022
- Figure 198: Middle East & Africa Artificial Intelligence in Sports Market Market Attractiveness Analysis by Country, 2016-2032
- Figure 199: Middle East & Africa Artificial Intelligence in Sports Market Market Revenue (US$ Mn) (2016-2032)
- Figure 200: Middle East & Africa Artificial Intelligence in Sports Market Market Revenue (US$ Mn) Comparison by Country (2016-2032)
- Figure 201: Middle East & Africa Artificial Intelligence in Sports Market Market Revenue (US$ Mn) Comparison by By Component (2016-2032)
- Figure 202: Middle East & Africa Artificial Intelligence in Sports Market Market Revenue (US$ Mn) Comparison by By Deployment Model (2016-2032)
- Figure 203: Middle East & Africa Artificial Intelligence in Sports Market Market Revenue (US$ Mn) Comparison by By Technology (2016-2032)
- Figure 204: Middle East & Africa Artificial Intelligence in Sports Market Market Revenue (US$ Mn) Comparison by By Application (2016-2032)
- Figure 205: Middle East & Africa Artificial Intelligence in Sports Market Market Revenue (US$ Mn) Comparison by By Game Type (2016-2032)
- Figure 206: Middle East & Africa Artificial Intelligence in Sports Market Market Y-o-Y Growth Rate Comparison by Country (2016-2032)
- Figure 207: Middle East & Africa Artificial Intelligence in Sports Market Market Y-o-Y Growth Rate Comparison by By Component (2016-2032)
- Figure 208: Middle East & Africa Artificial Intelligence in Sports Market Market Y-o-Y Growth Rate Comparison by By Deployment Model (2016-2032)
- Figure 209: Middle East & Africa Artificial Intelligence in Sports Market Market Y-o-Y Growth Rate Comparison by By Technology (2016-2032)
- Figure 210: Middle East & Africa Artificial Intelligence in Sports Market Market Y-o-Y Growth Rate Comparison by By Application (2016-2032)
- Figure 211: Middle East & Africa Artificial Intelligence in Sports Market Market Y-o-Y Growth Rate Comparison by By Game Type (2016-2032)
- Figure 212: Middle East & Africa Artificial Intelligence in Sports Market Market Share Comparison by Country (2016-2032)
- Figure 213: Middle East & Africa Artificial Intelligence in Sports Market Market Share Comparison by By Component (2016-2032)
- Figure 214: Middle East & Africa Artificial Intelligence in Sports Market Market Share Comparison by By Deployment Model (2016-2032)
- Figure 215: Middle East & Africa Artificial Intelligence in Sports Market Market Share Comparison by By Technology (2016-2032)
- Figure 216: Middle East & Africa Artificial Intelligence in Sports Market Market Share Comparison by By Application (2016-2032)
- Figure 217: Middle East & Africa Artificial Intelligence in Sports Market Market Share Comparison by By Game Type (2016-2032)
List of Tables
-
- Table 1: Global Artificial Intelligence in Sports Market Market Comparison by By Component (2016-2032)
- Table 2: Global Artificial Intelligence in Sports Market Market Comparison by By Deployment Model (2016-2032)
- Table 3: Global Artificial Intelligence in Sports Market Market Comparison by By Technology (2016-2032)
- Table 4: Global Artificial Intelligence in Sports Market Market Comparison by By Application (2016-2032)
- Table 5: Global Artificial Intelligence in Sports Market Market Comparison by By Game Type (2016-2032)
- Table 6: Global Artificial Intelligence in Sports Market Revenue (US$ Mn) Comparison by Region (2016-2032)
- Table 7: Global Artificial Intelligence in Sports Market Market Revenue (US$ Mn) (2016-2032)
- Table 8: Global Artificial Intelligence in Sports Market Market Revenue (US$ Mn) Comparison by Region (2016-2032)
- Table 9: Global Artificial Intelligence in Sports Market Market Revenue (US$ Mn) Comparison by By Component (2016-2032)
- Table 10: Global Artificial Intelligence in Sports Market Market Revenue (US$ Mn) Comparison by By Deployment Model (2016-2032)
- Table 11: Global Artificial Intelligence in Sports Market Market Revenue (US$ Mn) Comparison by By Technology (2016-2032)
- Table 12: Global Artificial Intelligence in Sports Market Market Revenue (US$ Mn) Comparison by By Application (2016-2032)
- Table 13: Global Artificial Intelligence in Sports Market Market Revenue (US$ Mn) Comparison by By Game Type (2016-2032)
- Table 14: Global Artificial Intelligence in Sports Market Market Y-o-Y Growth Rate Comparison by Region (2016-2032)
- Table 15: Global Artificial Intelligence in Sports Market Market Y-o-Y Growth Rate Comparison by By Component (2016-2032)
- Table 16: Global Artificial Intelligence in Sports Market Market Y-o-Y Growth Rate Comparison by By Deployment Model (2016-2032)
- Table 17: Global Artificial Intelligence in Sports Market Market Y-o-Y Growth Rate Comparison by By Technology (2016-2032)
- Table 18: Global Artificial Intelligence in Sports Market Market Y-o-Y Growth Rate Comparison by By Application (2016-2032)
- Table 19: Global Artificial Intelligence in Sports Market Market Y-o-Y Growth Rate Comparison by By Game Type (2016-2032)
- Table 20: Global Artificial Intelligence in Sports Market Market Share Comparison by Region (2016-2032)
- Table 21: Global Artificial Intelligence in Sports Market Market Share Comparison by By Component (2016-2032)
- Table 22: Global Artificial Intelligence in Sports Market Market Share Comparison by By Deployment Model (2016-2032)
- Table 23: Global Artificial Intelligence in Sports Market Market Share Comparison by By Technology (2016-2032)
- Table 24: Global Artificial Intelligence in Sports Market Market Share Comparison by By Application (2016-2032)
- Table 25: Global Artificial Intelligence in Sports Market Market Share Comparison by By Game Type (2016-2032)
- Table 26: North America Artificial Intelligence in Sports Market Market Comparison by By Deployment Model (2016-2032)
- Table 27: North America Artificial Intelligence in Sports Market Market Comparison by By Technology (2016-2032)
- Table 28: North America Artificial Intelligence in Sports Market Market Comparison by By Application (2016-2032)
- Table 29: North America Artificial Intelligence in Sports Market Market Comparison by By Game Type (2016-2032)
- Table 30: North America Artificial Intelligence in Sports Market Revenue (US$ Mn) Comparison by Country (2016-2032)
- Table 31: North America Artificial Intelligence in Sports Market Market Revenue (US$ Mn) (2016-2032)
- Table 32: North America Artificial Intelligence in Sports Market Market Revenue (US$ Mn) Comparison by Country (2016-2032)
- Table 33: North America Artificial Intelligence in Sports Market Market Revenue (US$ Mn) Comparison by By Component (2016-2032)
- Table 34: North America Artificial Intelligence in Sports Market Market Revenue (US$ Mn) Comparison by By Deployment Model (2016-2032)
- Table 35: North America Artificial Intelligence in Sports Market Market Revenue (US$ Mn) Comparison by By Technology (2016-2032)
- Table 36: North America Artificial Intelligence in Sports Market Market Revenue (US$ Mn) Comparison by By Application (2016-2032)
- Table 37: North America Artificial Intelligence in Sports Market Market Revenue (US$ Mn) Comparison by By Game Type (2016-2032)
- Table 38: North America Artificial Intelligence in Sports Market Market Y-o-Y Growth Rate Comparison by Country (2016-2032)
- Table 39: North America Artificial Intelligence in Sports Market Market Y-o-Y Growth Rate Comparison by By Component (2016-2032)
- Table 40: North America Artificial Intelligence in Sports Market Market Y-o-Y Growth Rate Comparison by By Deployment Model (2016-2032)
- Table 41: North America Artificial Intelligence in Sports Market Market Y-o-Y Growth Rate Comparison by By Technology (2016-2032)
- Table 42: North America Artificial Intelligence in Sports Market Market Y-o-Y Growth Rate Comparison by By Application (2016-2032)
- Table 43: North America Artificial Intelligence in Sports Market Market Y-o-Y Growth Rate Comparison by By Game Type (2016-2032)
- Table 44: North America Artificial Intelligence in Sports Market Market Share Comparison by Country (2016-2032)
- Table 45: North America Artificial Intelligence in Sports Market Market Share Comparison by By Component (2016-2032)
- Table 46: North America Artificial Intelligence in Sports Market Market Share Comparison by By Deployment Model (2016-2032)
- Table 47: North America Artificial Intelligence in Sports Market Market Share Comparison by By Technology (2016-2032)
- Table 48: North America Artificial Intelligence in Sports Market Market Share Comparison by By Application (2016-2032)
- Table 49: North America Artificial Intelligence in Sports Market Market Share Comparison by By Game Type (2016-2032)
- Table 50: Western Europe Artificial Intelligence in Sports Market Market Comparison by By Component (2016-2032)
- Table 51: Western Europe Artificial Intelligence in Sports Market Market Comparison by By Deployment Model (2016-2032)
- Table 52: Western Europe Artificial Intelligence in Sports Market Market Comparison by By Technology (2016-2032)
- Table 53: Western Europe Artificial Intelligence in Sports Market Market Comparison by By Application (2016-2032)
- Table 54: Western Europe Artificial Intelligence in Sports Market Market Comparison by By Game Type (2016-2032)
- Table 55: Western Europe Artificial Intelligence in Sports Market Revenue (US$ Mn) Comparison by Country (2016-2032)
- Table 56: Western Europe Artificial Intelligence in Sports Market Market Revenue (US$ Mn) (2016-2032)
- Table 57: Western Europe Artificial Intelligence in Sports Market Market Revenue (US$ Mn) Comparison by Country (2016-2032)
- Table 58: Western Europe Artificial Intelligence in Sports Market Market Revenue (US$ Mn) Comparison by By Component (2016-2032)
- Table 59: Western Europe Artificial Intelligence in Sports Market Market Revenue (US$ Mn) Comparison by By Deployment Model (2016-2032)
- Table 60: Western Europe Artificial Intelligence in Sports Market Market Revenue (US$ Mn) Comparison by By Technology (2016-2032)
- Table 61: Western Europe Artificial Intelligence in Sports Market Market Revenue (US$ Mn) Comparison by By Application (2016-2032)
- Table 62: Western Europe Artificial Intelligence in Sports Market Market Revenue (US$ Mn) Comparison by By Game Type (2016-2032)
- Table 63: Western Europe Artificial Intelligence in Sports Market Market Y-o-Y Growth Rate Comparison by Country (2016-2032)
- Table 64: Western Europe Artificial Intelligence in Sports Market Market Y-o-Y Growth Rate Comparison by By Component (2016-2032)
- Table 65: Western Europe Artificial Intelligence in Sports Market Market Y-o-Y Growth Rate Comparison by By Deployment Model (2016-2032)
- Table 66: Western Europe Artificial Intelligence in Sports Market Market Y-o-Y Growth Rate Comparison by By Technology (2016-2032)
- Table 67: Western Europe Artificial Intelligence in Sports Market Market Y-o-Y Growth Rate Comparison by By Application (2016-2032)
- Table 68: Western Europe Artificial Intelligence in Sports Market Market Y-o-Y Growth Rate Comparison by By Game Type (2016-2032)
- Table 69: Western Europe Artificial Intelligence in Sports Market Market Share Comparison by Country (2016-2032)
- Table 70: Western Europe Artificial Intelligence in Sports Market Market Share Comparison by By Component (2016-2032)
- Table 71: Western Europe Artificial Intelligence in Sports Market Market Share Comparison by By Deployment Model (2016-2032)
- Table 72: Western Europe Artificial Intelligence in Sports Market Market Share Comparison by By Technology (2016-2032)
- Table 73: Western Europe Artificial Intelligence in Sports Market Market Share Comparison by By Application (2016-2032)
- Table 74: Western Europe Artificial Intelligence in Sports Market Market Share Comparison by By Game Type (2016-2032)
- Table 75: Eastern Europe Artificial Intelligence in Sports Market Market Comparison by By Component (2016-2032)
- Table 76: Eastern Europe Artificial Intelligence in Sports Market Market Comparison by By Deployment Model (2016-2032)
- Table 77: Eastern Europe Artificial Intelligence in Sports Market Market Comparison by By Technology (2016-2032)
- Table 78: Eastern Europe Artificial Intelligence in Sports Market Market Comparison by By Application (2016-2032)
- Table 79: Eastern Europe Artificial Intelligence in Sports Market Market Comparison by By Game Type (2016-2032)
- Table 80: Eastern Europe Artificial Intelligence in Sports Market Revenue (US$ Mn) Comparison by Country (2016-2032)
- Table 81: Eastern Europe Artificial Intelligence in Sports Market Market Revenue (US$ Mn) (2016-2032)
- Table 82: Eastern Europe Artificial Intelligence in Sports Market Market Revenue (US$ Mn) Comparison by Country (2016-2032)
- Table 83: Eastern Europe Artificial Intelligence in Sports Market Market Revenue (US$ Mn) Comparison by By Component (2016-2032)
- Table 84: Eastern Europe Artificial Intelligence in Sports Market Market Revenue (US$ Mn) Comparison by By Deployment Model (2016-2032)
- Table 85: Eastern Europe Artificial Intelligence in Sports Market Market Revenue (US$ Mn) Comparison by By Technology (2016-2032)
- Table 86: Eastern Europe Artificial Intelligence in Sports Market Market Revenue (US$ Mn) Comparison by By Application (2016-2032)
- Table 87: Eastern Europe Artificial Intelligence in Sports Market Market Revenue (US$ Mn) Comparison by By Game Type (2016-2032)
- Table 88: Eastern Europe Artificial Intelligence in Sports Market Market Y-o-Y Growth Rate Comparison by Country (2016-2032)
- Table 89: Eastern Europe Artificial Intelligence in Sports Market Market Y-o-Y Growth Rate Comparison by By Component (2016-2032)
- Table 90: Eastern Europe Artificial Intelligence in Sports Market Market Y-o-Y Growth Rate Comparison by By Deployment Model (2016-2032)
- Table 91: Eastern Europe Artificial Intelligence in Sports Market Market Y-o-Y Growth Rate Comparison by By Technology (2016-2032)
- Table 92: Eastern Europe Artificial Intelligence in Sports Market Market Y-o-Y Growth Rate Comparison by By Application (2016-2032)
- Table 93: Eastern Europe Artificial Intelligence in Sports Market Market Y-o-Y Growth Rate Comparison by By Game Type (2016-2032)
- Table 94: Eastern Europe Artificial Intelligence in Sports Market Market Share Comparison by Country (2016-2032)
- Table 95: Eastern Europe Artificial Intelligence in Sports Market Market Share Comparison by By Component (2016-2032)
- Table 96: Eastern Europe Artificial Intelligence in Sports Market Market Share Comparison by By Deployment Model (2016-2032)
- Table 97: Eastern Europe Artificial Intelligence in Sports Market Market Share Comparison by By Technology (2016-2032)
- Table 98: Eastern Europe Artificial Intelligence in Sports Market Market Share Comparison by By Application (2016-2032)
- Table 99: Eastern Europe Artificial Intelligence in Sports Market Market Share Comparison by By Game Type (2016-2032)
- Table 100: APAC Artificial Intelligence in Sports Market Market Comparison by By Component (2016-2032)
- Table 101: APAC Artificial Intelligence in Sports Market Market Comparison by By Deployment Model (2016-2032)
- Table 102: APAC Artificial Intelligence in Sports Market Market Comparison by By Technology (2016-2032)
- Table 103: APAC Artificial Intelligence in Sports Market Market Comparison by By Application (2016-2032)
- Table 104: APAC Artificial Intelligence in Sports Market Market Comparison by By Game Type (2016-2032)
- Table 105: APAC Artificial Intelligence in Sports Market Revenue (US$ Mn) Comparison by Country (2016-2032)
- Table 106: APAC Artificial Intelligence in Sports Market Market Revenue (US$ Mn) (2016-2032)
- Table 107: APAC Artificial Intelligence in Sports Market Market Revenue (US$ Mn) Comparison by Country (2016-2032)
- Table 108: APAC Artificial Intelligence in Sports Market Market Revenue (US$ Mn) Comparison by By Component (2016-2032)
- Table 109: APAC Artificial Intelligence in Sports Market Market Revenue (US$ Mn) Comparison by By Deployment Model (2016-2032)
- Table 110: APAC Artificial Intelligence in Sports Market Market Revenue (US$ Mn) Comparison by By Technology (2016-2032)
- Table 111: APAC Artificial Intelligence in Sports Market Market Revenue (US$ Mn) Comparison by By Application (2016-2032)
- Table 112: APAC Artificial Intelligence in Sports Market Market Revenue (US$ Mn) Comparison by By Game Type (2016-2032)
- Table 113: APAC Artificial Intelligence in Sports Market Market Y-o-Y Growth Rate Comparison by Country (2016-2032)
- Table 114: APAC Artificial Intelligence in Sports Market Market Y-o-Y Growth Rate Comparison by By Component (2016-2032)
- Table 115: APAC Artificial Intelligence in Sports Market Market Y-o-Y Growth Rate Comparison by By Deployment Model (2016-2032)
- Table 116: APAC Artificial Intelligence in Sports Market Market Y-o-Y Growth Rate Comparison by By Technology (2016-2032)
- Table 117: APAC Artificial Intelligence in Sports Market Market Y-o-Y Growth Rate Comparison by By Application (2016-2032)
- Table 118: APAC Artificial Intelligence in Sports Market Market Y-o-Y Growth Rate Comparison by By Game Type (2016-2032)
- Table 119: APAC Artificial Intelligence in Sports Market Market Share Comparison by Country (2016-2032)
- Table 120: APAC Artificial Intelligence in Sports Market Market Share Comparison by By Component (2016-2032)
- Table 121: APAC Artificial Intelligence in Sports Market Market Share Comparison by By Deployment Model (2016-2032)
- Table 122: APAC Artificial Intelligence in Sports Market Market Share Comparison by By Technology (2016-2032)
- Table 123: APAC Artificial Intelligence in Sports Market Market Share Comparison by By Application (2016-2032)
- Table 124: APAC Artificial Intelligence in Sports Market Market Share Comparison by By Game Type (2016-2032)
- Table 125: Latin America Artificial Intelligence in Sports Market Market Comparison by By Component (2016-2032)
- Table 126: Latin America Artificial Intelligence in Sports Market Market Comparison by By Deployment Model (2016-2032)
- Table 127: Latin America Artificial Intelligence in Sports Market Market Comparison by By Technology (2016-2032)
- Table 128: Latin America Artificial Intelligence in Sports Market Market Comparison by By Application (2016-2032)
- Table 129: Latin America Artificial Intelligence in Sports Market Market Comparison by By Game Type (2016-2032)
- Table 130: Latin America Artificial Intelligence in Sports Market Revenue (US$ Mn) Comparison by Country (2016-2032)
- Table 131: Latin America Artificial Intelligence in Sports Market Market Revenue (US$ Mn) (2016-2032)
- Table 132: Latin America Artificial Intelligence in Sports Market Market Revenue (US$ Mn) Comparison by Country (2016-2032)
- Table 133: Latin America Artificial Intelligence in Sports Market Market Revenue (US$ Mn) Comparison by By Component (2016-2032)
- Table 134: Latin America Artificial Intelligence in Sports Market Market Revenue (US$ Mn) Comparison by By Deployment Model (2016-2032)
- Table 135: Latin America Artificial Intelligence in Sports Market Market Revenue (US$ Mn) Comparison by By Technology (2016-2032)
- Table 136: Latin America Artificial Intelligence in Sports Market Market Revenue (US$ Mn) Comparison by By Application (2016-2032)
- Table 137: Latin America Artificial Intelligence in Sports Market Market Revenue (US$ Mn) Comparison by By Game Type (2016-2032)
- Table 138: Latin America Artificial Intelligence in Sports Market Market Y-o-Y Growth Rate Comparison by Country (2016-2032)
- Table 139: Latin America Artificial Intelligence in Sports Market Market Y-o-Y Growth Rate Comparison by By Component (2016-2032)
- Table 140: Latin America Artificial Intelligence in Sports Market Market Y-o-Y Growth Rate Comparison by By Deployment Model (2016-2032)
- Table 141: Latin America Artificial Intelligence in Sports Market Market Y-o-Y Growth Rate Comparison by By Technology (2016-2032)
- Table 142: Latin America Artificial Intelligence in Sports Market Market Y-o-Y Growth Rate Comparison by By Application (2016-2032)
- Table 143: Latin America Artificial Intelligence in Sports Market Market Y-o-Y Growth Rate Comparison by By Game Type (2016-2032)
- Table 144: Latin America Artificial Intelligence in Sports Market Market Share Comparison by Country (2016-2032)
- Table 145: Latin America Artificial Intelligence in Sports Market Market Share Comparison by By Component (2016-2032)
- Table 146: Latin America Artificial Intelligence in Sports Market Market Share Comparison by By Deployment Model (2016-2032)
- Table 147: Latin America Artificial Intelligence in Sports Market Market Share Comparison by By Technology (2016-2032)
- Table 148: Latin America Artificial Intelligence in Sports Market Market Share Comparison by By Application (2016-2032)
- Table 149: Latin America Artificial Intelligence in Sports Market Market Share Comparison by By Game Type (2016-2032)
- Table 150: Middle East & Africa Artificial Intelligence in Sports Market Market Comparison by By Component (2016-2032)
- Table 151: Middle East & Africa Artificial Intelligence in Sports Market Market Comparison by By Deployment Model (2016-2032)
- Table 152: Middle East & Africa Artificial Intelligence in Sports Market Market Comparison by By Technology (2016-2032)
- Table 153: Middle East & Africa Artificial Intelligence in Sports Market Market Comparison by By Application (2016-2032)
- Table 154: Middle East & Africa Artificial Intelligence in Sports Market Market Comparison by By Game Type (2016-2032)
- Table 155: Middle East & Africa Artificial Intelligence in Sports Market Revenue (US$ Mn) Comparison by Country (2016-2032)
- Table 156: Middle East & Africa Artificial Intelligence in Sports Market Market Revenue (US$ Mn) (2016-2032)
- Table 157: Middle East & Africa Artificial Intelligence in Sports Market Market Revenue (US$ Mn) Comparison by Country (2016-2032)
- Table 158: Middle East & Africa Artificial Intelligence in Sports Market Market Revenue (US$ Mn) Comparison by By Component (2016-2032)
- Table 159: Middle East & Africa Artificial Intelligence in Sports Market Market Revenue (US$ Mn) Comparison by By Deployment Model (2016-2032)
- Table 160: Middle East & Africa Artificial Intelligence in Sports Market Market Revenue (US$ Mn) Comparison by By Technology (2016-2032)
- Table 161: Middle East & Africa Artificial Intelligence in Sports Market Market Revenue (US$ Mn) Comparison by By Application (2016-2032)
- Table 162: Middle East & Africa Artificial Intelligence in Sports Market Market Revenue (US$ Mn) Comparison by By Game Type (2016-2032)
- Table 163: Middle East & Africa Artificial Intelligence in Sports Market Market Y-o-Y Growth Rate Comparison by Country (2016-2032)
- Table 164: Middle East & Africa Artificial Intelligence in Sports Market Market Y-o-Y Growth Rate Comparison by By Component (2016-2032)
- Table 165: Middle East & Africa Artificial Intelligence in Sports Market Market Y-o-Y Growth Rate Comparison by By Deployment Model (2016-2032)
- Table 166: Middle East & Africa Artificial Intelligence in Sports Market Market Y-o-Y Growth Rate Comparison by By Technology (2016-2032)
- Table 167: Middle East & Africa Artificial Intelligence in Sports Market Market Y-o-Y Growth Rate Comparison by By Application (2016-2032)
- Table 168: Middle East & Africa Artificial Intelligence in Sports Market Market Y-o-Y Growth Rate Comparison by By Game Type (2016-2032)
- Table 169: Middle East & Africa Artificial Intelligence in Sports Market Market Share Comparison by Country (2016-2032)
- Table 170: Middle East & Africa Artificial Intelligence in Sports Market Market Share Comparison by By Component (2016-2032)
- Table 171: Middle East & Africa Artificial Intelligence in Sports Market Market Share Comparison by By Deployment Model (2016-2032)
- Table 172: Middle East & Africa Artificial Intelligence in Sports Market Market Share Comparison by By Technology (2016-2032)
- Table 173: Middle East & Africa Artificial Intelligence in Sports Market Market Share Comparison by By Application (2016-2032)
- Table 174: Middle East & Africa Artificial Intelligence in Sports Market Market Share Comparison by By Game Type (2016-2032)
- 1. Executive Summary
-
- SAP SE
- SAS Institute Inc
- Opta Sports (Perform Group)
- Catapult Group International Ltd
- TruMedia Networks
- Salesforce.com Inc.
- IBM Corporation
- Sportradar AG
- Microsoft Corporation
- Other Key Players
Our Clients


View Our Licence Options
