
Aquafeed Additives Market By Ingredient (Anti-Parasitic, Feed Acidifiers, Prebiotics, Others), By Application (Carp, Rainbow Trout, Salmon, Crustaceans, Tilapia, Others), By Region And Companies - Industry Segment Outlook, Market Assessment, Competition Scenario, Trends, And Forecast 2023-2032
-
15930
-
May 2023
-
177
-


-
This report was compiled by Shreyas Rokade Shreyas Rokade is a seasoned Research Analyst with CMFE, bringing extensive expertise in market research and consulting, with a strong background in Chemical Engineering. Correspondence Team Lead-CMFE Linkedin | Detailed Market research Methodology Our methodology involves a mix of primary research, including interviews with leading mental health experts, and secondary research from reputable medical journals and databases. View Detailed Methodology Page
-
Quick Navigation
Report Overview
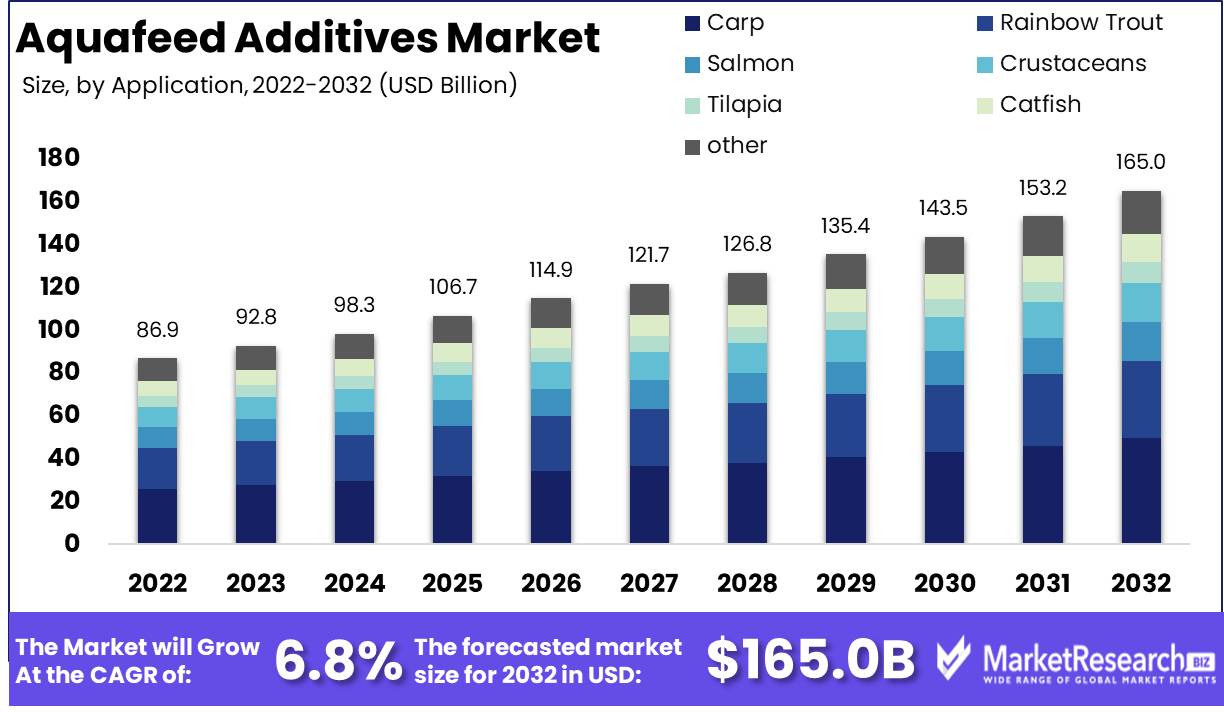
Aquafeed Additives Market size is expected to be worth around USD 165.0 Bn by 2032 from USD 86.9 Bn in 2022, growing at a CAGR of 6.8% during the forecast period from 2023 to 2032.
The Aquafeed Additives market involves the production and distribution of feed for aquatic animals, such as fish and shrimp. In recent years, this market has experienced significant growth and has become an important player in the global food industry. Aquafeed is a specialized type of feed that is designed to meet the specific nutritional needs of aquatic animals. This market has become increasingly important in recent years as the demand for seafood has grown around the world. The global Aquafeed Additives Market is expected to continue growing in the coming years, driven by increasing demand for protein-rich food, especially from developing countries.
The Aquafeed Additives market is important because it helps to ensure the growth and survival of aquatic animals in captivity. Aquaculture is an important part of the global food industry, and quality aquafeed is a critical component of this sector. Moreover, aquafeed is an important source of essential nutrients for consumers around the world who are looking for alternative sources of protein.
There have been several notable innovations in the Aquafeed Additives market in recent years. Manufacturers have been experimenting with new ingredients, such as single-cell proteins, to create more sustainable feeds that require fewer resources to produce. There have also been advances in the use of probiotics and other feed additives that can improve animal health and reduce the environmental impact of aquaculture operations.
Several different industries are investing in the Aquafeed Additives market. Agriculture and aquaculture companies are obvious investors, but so too are food and beverage companies that recognize the benefits of aquaculture as a source of sustainable protein. Investors in the technology sector are also interested in the Aquafeed Additives Market, particularly as companies develop new solutions for more sustainable and efficient feed production.
Driving factors
Seafood and Aquaculture Developments
Due to the rising demand for seafood and the expansion of aquaculture production, the Aquafeed Additives Market is expected to experience accelerated growth. Technology advancements have improved feed quality and nutrition, resulting in improved health and growth outcomes for aquatic animals. Government initiatives that promote aquaculture and the aquafeed industry contribute to the expansion of the market. While Krabbe disease treatment is significant in healthcare, it doesn't directly impact the Aquafeed Additives Market.
Escalating Consumer Awareness and Demand
Increasing consumer awareness and demand for organic and sustainable aquaculture products drive the Aquafeed Additives Market. To lessen the environmental impact of aquaculture operations, producers are investigating sustainable and eco-friendly solutions. Fishmeal's limited availability and high price have increased the demand for fishmeal substitutes. Functional and specialized aquafeed products that provide particular health benefits to aquatic animals are also gaining popularity.
Technological Innovations and Cost-Effective Methods
Technological advances are transforming the aquafeed industry, resulting in more cost-effective and productive procedures. Due to their reduced cost and environmental benefits, plant-based proteins are increasingly used in aquafeed. Increasing investment by market leaders indicates the potential for market expansion.
Changes in Regulations and Emerging Technologies
The Aquafeed Additives Market is anticipated to be impacted by changes in regulations as regulatory bodies scrutinize aquafeed production for ecological concerns. Emerging technologies like biotechnology and genomics have the potential to improve aquafeed quality.
Restraining Factors
Variations in the Cost of Raw Materials
Businesses engaged in aquaculture require inputs such as feed, fertilizers, and antibiotics. Unstable prices for basic materials can have a significant effect on production costs, which can percolate down to the end-user. This effect is felt more strongly in developing nations with limited access to stabilization resources. The prices of basic materials are affected by weather conditions, government policies, crop rotations, and other variables.
Environmental Impact of Aquaculture
Aquaculture is the controlled cultivation of fish and other aquatic organisms. Despite its importance in satisfying the rising demand for seafood, aquaculture has an impact on the environment. Some of the known environmental impacts of aquaculture include extensive land use, water contamination, and habitat devastation. These effects can lead to the depletion of resources such as water, have an effect on wildlife populations, and degrade water quality. These factors impact not only the welfare of aquatic ecosystems but also commercial interests. In the Aquafeed Additives market, Single Cell Oil is becoming a game-changer, providing a high-quality and eco-friendly ingredient.
Disease Outbreak Danger
Similar to other animal production systems, aquaculture is susceptible to disease outbreaks. Disease epidemics can rapidly spread throughout an aquaculture facility, decimating the entire crop and causing production losses. Multiple factors, such as overcrowding, poor water quality, and inadequate nutrition, can contribute to these outbreaks. The industry is becoming more conscious of the need for preventative measures such as biosecurity, stringent hygiene standards, and disease-resistant animal varieties.
Strict Governmental Requirements
Certain aquafeed constituents are subject to stringent government regulations that must be followed by aquaculture enterprises. The purpose of these regulations is to protect consumer health and ensure sustainable production methods. As the industry expands globally, it is necessary to harmonize the various national regulations. Streamlining regulations to ensure sustainability will make aquaculture a more viable and sustainable industry.
Limited supply of particular raw materials
Aquaculture enterprises frequently rely on a small number of essential raw materials, such as fishmeal and fish oil, to formulate their diet. Fishmeal and fish oil have a substantial effect on the quality of fish feed, as well as the growth and health of fish. However, these resources are not always readily accessible, resulting in a substantial loss of profits.
Ingredient Analysis
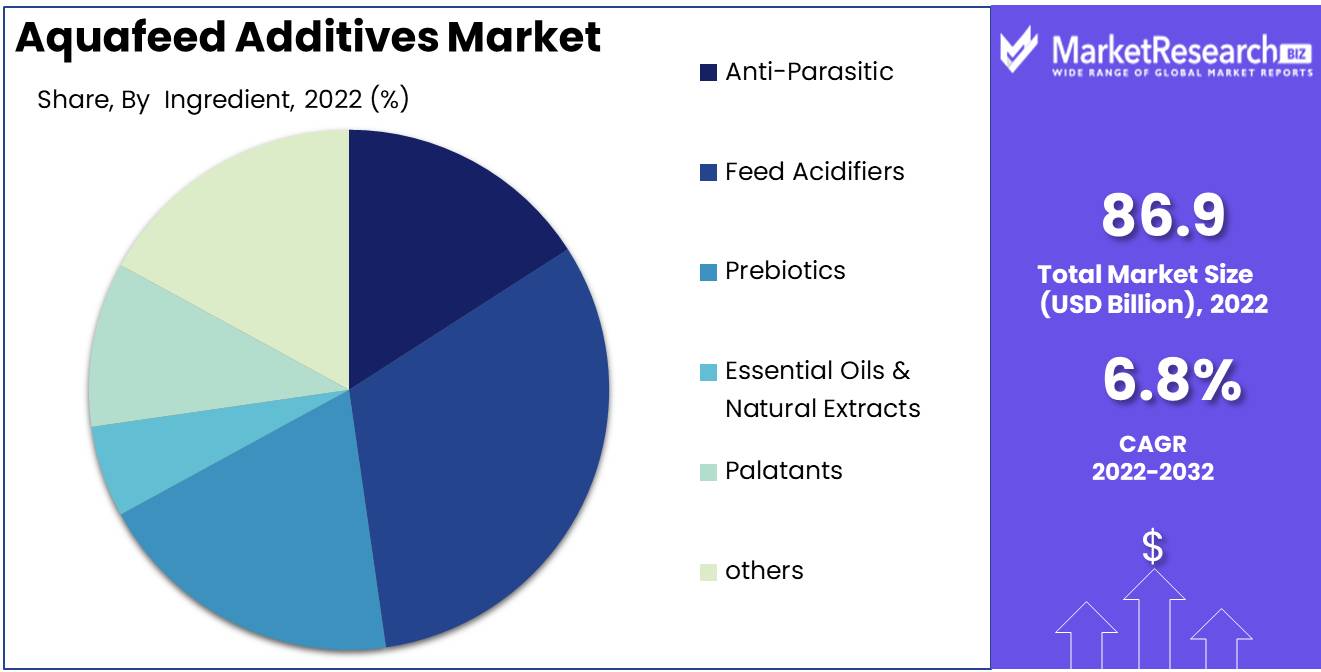
The Aquafeed Additives Market has been dominated by the feed acidifiers segment over the last few years. The increasing demand for aquaculture products has led to the development and implementation of various innovative technologies and methods that ensure the healthy growth of aquatic animals. The feed acidifiers segment has emerged as one of the most popular ingredients in the Aquafeed Additives Market due to its ability to improve the digestive functions of aquatic animals.
Consumers are becoming increasingly aware of the benefits of feed acidifiers in aquaculture production. The demand for high-quality seafood is on the rise, and consumers are willing to pay a premium for products that are sustainably produced and free from harmful additives. The use of feed acidifiers in aquafeed enables farmers to produce high-quality seafood that meets the expectations of consumers.
Application Analysis
The carp segment dominates the Aquafeed Additives Market due to its high nutritional value and excellent taste. Carp is one of the most commonly farmed fish, and its production has witnessed significant growth over the last few years. The economic development in emerging economies has been a significant driver of the adoption of the carp segment in the Aquafeed Additives Market.
Consumers are increasingly demanding high-quality seafood, including carp, which has resulted in the development of sustainable aquaculture practices. The carp segment in the Aquafeed Additives Market is expected to witness significant growth due to the growing demand for sustainable and healthy aquaculture practices.
Key Market Segments
By Ingredient
-
- Anti-Parasitic
- Feed Acidifiers
- Prebiotics
- Essential Oils & Natural Extracts
- Palatants
- Hydrolysates
- Yeast Extracts
- Others
By Application
- Carp
- Rainbow Trout
- Salmon
- Crustaceans
- Tilapia
- Catfish
- Sea Bass
- Grouper
- Others
Growth Opportunity
Products from Sustainable and Organic Aquaculture
Due to the rising demand for sustainable and organic aquaculture products, the Aquafeed Additives Market is experiencing substantial expansion. Demand for high-quality and eco-friendly aquafeed is increasing as consumers become more environmentally conscious and seek out products that are manufactured using sustainable methods.
Increasing consumer consciousness and demand
Awareness among consumers and demand for plant-based protein in aquaculture are propelling the expansion of the Aquafeed Additives Market. Plant-based proteins are emerging as a cost-effective and environmentally favorable alternative to traditional fishmeal for use in fish feed.
Increasing Interest in Functional and Specialty
The market is experiencing an increase in demand for specialty and functional aquafeed products. Increasingly, aquaculturists are searching for feed options that provide nutrients and minerals tailored to the specific nutritional needs of various fish species. This demand for specialized aquafeed products contributes to the expansion of the market.
Technological Progresses
Aquafeed production is becoming increasingly efficient and economical due to technological advances. Improved feed production technologies are increasing the nutritional value and purity of aquafeed while decreasing production costs, resulting in increased profitability for fish producers.
Expanding Business and Enhanced Investment
This rapid expansion of the aquaculture industry is driving increased investment in the Aquafeed Additives Market. To satisfy the growing demand for aquaculture products and enhance the overall efficiency and sustainability of their operations, fish farmers are investing in advanced feed technologies and scientific research.
Latest Trends
Industry-Changing Tendencies
The Aquafeed Additives Market is experiencing significant growth, driven by key trends such as the increasing popularity of plant-based protein, the rising demand for functional and specialty products, technological advancements in production, the increasing use of alternative protein sources, and the increasing investments in sustainable and eco-friendly products.
Plant-Based Protein in Aquafeed
As consumers become more aware of the environmental impact of animal consumption, they are adopting plant-based diets. This trend is also reflected in the demand for plant-based protein sources in the Aquafeed Additives Market. Algae, soybeans, peas, and other proteins derived from legumes are progressively being utilized in aquafeed to lessen the reliance on fish meal and fish oil. Additionally, plant-based protein-based products are acquiring popularity as eco-friendly and sustainable alternatives to conventional feed.
Functional and Specialty Aquafeed
Aquafeed manufacturers are emphasizing the delivery of specialized and functional products. These products are formulated to satisfy the specific dietary and nutritional needs of various fish and crustacean species and to boost their growth and productivity. Additionally, producers are concentrating on innovative formulations that can aid in preventing disease outbreaks and enhancing the overall health of farmed fish.
Improve Quality and Productivity
Technological advancements are revolutionizing the aquafeed industry, making production more efficient and enhancing the quality of final products. Automation, robotics, and artificial intelligence are utilized to enhance production processes, decrease waste, and maximize inputs. Aquafeed producers are also concentrating on the development of new processing technologies that can enhance nutrient retention, product quality, and retail life.
Alternative Protein Sources
Alternative protein sources, such as invertebrates and microalgae, are increasingly used in aquafeed as a result of the quest for sustainable protein sources. Mealworms, black soldier flies, and crickets are protein-rich insects that can be raised sustainably on organic debris. Microalgae are also being investigated as a potential protein source for aquafeed, as they can be produced with minimal resources such as sunlight and water. These alternative sources are acquiring popularity as eco-friendly, sustainable, and cost-effective alternatives to conventional ingredients.
Eco-Friendly and Sustainable Products
There is a developing interest in the creation of eco-friendly and sustainable aquafeed products. Producers are investigating the use of novel constituents, such as seaweed and algae, which can provide nutritional benefits and support sustainable production methods. In addition, there is a growing interest in developing aquafeed products devoid of antibiotics, hormones, and other detrimental additives. Increasingly, consumers who look to make more informed and sustainable purchasing decisions are requesting such products.
Regional Analysis
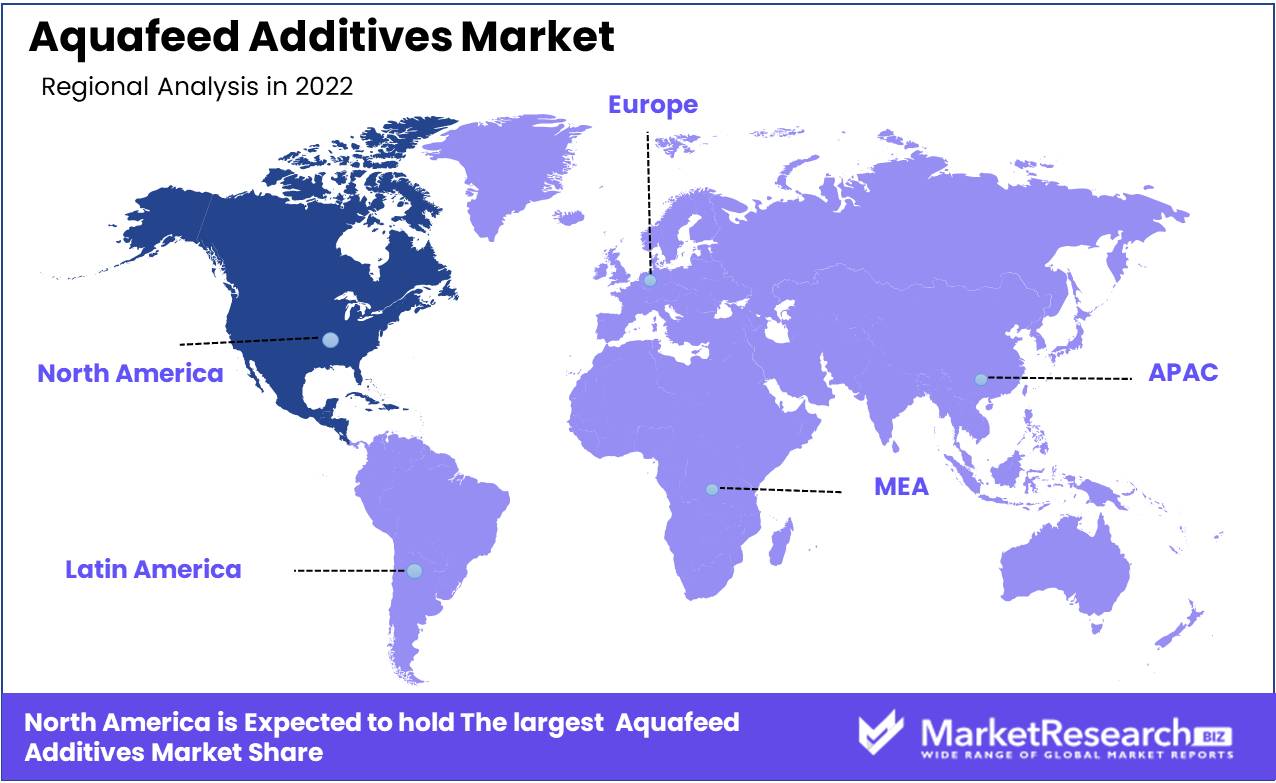
North America has witnessed a significant increase in demand for sustainable and organic aquaculture products. This trend is fueled by a growing awareness of the environmental impact of commercial fisheries and the health benefits of ingesting responsibly raised fish.
This product's demand is not restricted to a few niche markets. The demand for sustainable and organic aquaculture products has increased throughout North America, from restaurants to supermarkets to individual consumers. Specifically, newer generations have a growing preference for products that are ethically and sustainably sourced.
The ability of sustainable aquaculture to create local employment and foster economic growth is a further advantage. Aquaculture facilities necessitate labor and auxiliary services, thereby establishing employment opportunities for nearby communities. Sustainable aquaculture can contribute to the economic development of North America by promoting responsible fish husbandry practices.
Although sustainable aquaculture has existed for many years, there is a growing demand for organic fish products. Organic fish aquaculture employs organic nutrients and forgoes synthetic chemicals and antibiotics. The result is an even healthier and more environmentally friendly product.
Key Regions and Countries
North America
- US
- Canada
- Mexico
Western Europe
- Germany
- France
- The UK
- Spain
- Italy
- Portugal
- Ireland
- Austria
- Switzerland
- Benelux
- Nordic
- Rest of Western Europe
Eastern Europe
- Russia
- Poland
- The Czech Republic
- Greece
- Rest of Eastern Europe
APAC
- China
- Japan
- South Korea
- India
- Australia & New Zealand
- Indonesia
- Malaysia
- Philippines
- Singapore
- Thailand
- Vietnam
- Rest of APAC
Latin America
- Brazil
- Colombia
- Chile
- Argentina
- Costa Rica
- Rest of Latin America
Middle East & Africa
- Algeria
- Egypt
- Israel
- Kuwait
- Nigeria
- Saudi Arabia
- South Africa
- Turkey
- United Arab Emirates
- Rest of MEA
Key Players Analysis
The Aquafeed Additives Market is propelled by the rising demand for seafood, the expanding aquaculture industry, and technological advances in aquafeed production. Aquafeed is an integral part of aquaculture and is essential for the health and development of aquatic animals. Through mergers and acquisitions, partnerships, collaborations, and product innovations, the major participants in the Aquafeed Additives Market are seeking to increase their market share.
Cargill Inc., Archer Daniels Midland Company, Avanti Feeds Limited, Aller Aqua A/S, Nutreco NV, Cermaq ASA, Ridley Corporation Limited, Biomin Holding GmbH, Marubeni Nisshin Feed Co., Ltd., and BioMar Group are notable Aquafeed Additives Market participants. These businesses continually invest in R&D to enhance the nutritional value and quality of their products.
The Asia-Pacific region dominates the Aquafeed Additives Market as a result of the rising demand for seafood, the expansion of the aquaculture industry, and the favorable initiatives of the government. China is the largest Aquafeed Additives Market in the region, propelled primarily by the rising demand for fish and shrimp cultivation. The market in North America and Europe is expanding due to the rising awareness of aquaculture's benefits and the growing demand for seafood.
Top Key Players in Aquafeed Additives Market
- Nutriad-Adisseo
- Olmix Group
- Lallemand Inc.
- Kemin Industries Inc.
- Biorigin
- Nouryon
- DuPont de Nemours Inc.
- Delacon Biotechnik GmbH
- Camlin Fine Sciences Ltd.
- Phileo by Lesaffre
- Diana Group
- Alltech
Recent Development
In January 2022, Cargill introduced sustainable aquafeed products. Algae and insect meal make these goods more eco-friendly than typical feed sources.
In October 2021, DSM bought Norwegian aquafeed producer Marine Bioproducts AS. DSM can now provide more aquafeed products and increase its market position. DSM is recognized for its sustainable and creative solutions, thus this purchase could accelerate industry advancement.
In September 2021, BioMar announced a new sustainable aquafeed manufacturing plant in Tasmania, Australia. This plant will expand eco-friendly aquafeed choices in 2024.
In August 2021, Skretting and HydroSea, a Norwegian technology business, developed marine-based fish feed products. Aquaculture feed will be more nutritional and sustainable using this strategy.
In July 2021, ADM expanded its aquafeed production in China. ADM's extruded aquafeed output will rise 30% to fulfill regional demand for sustainable feed.
In June 2021, Thai Union Group, a worldwide seafood corporation, and Future Feed, an Australian startup, developed insect-based aquafeed products. Aquaculture should benefit from this relationship.
In April 2021, French food processing equipment manufacturer Clextral launched an aquafeed extrusion plant. This extrusion system makes high-quality aquafeed from a variety of materials, expanding sustainable feed alternatives.
Report Scope:
Report Features Description Market Value (2022) USD 86.9 Bn Forecast Revenue (2032) USD 165.0 Bn CAGR (2023-2032) 6.8% Base Year for Estimation 2022 Historic Period 2016-2022 Forecast Period 2023-2032 Report Coverage Revenue Forecast, Market Dynamics, COVID-19 Impact, Competitive Landscape, Recent Developments Segments Covered By Ingredient (Anti-Parasitic, Feed Acidifiers, Prebiotics, Essential Oils & Natural Extracts, Palatants, Others)
By Application (Carp, Rainbow Trout, Salmon, Crustaceans, Tilapia, Catfish, Sea Bass, Grouper, Others)Regional Analysis North America – The US, Canada, & Mexico; Western Europe – Germany, France, The UK, Spain, Italy, Portugal, Ireland, Austria, Switzerland, Benelux, Nordic, & Rest of Western Europe; Eastern Europe – Russia, Poland, The Czech Republic, Greece, & Rest of Eastern Europe; APAC – China, Japan, South Korea, India, Australia & New Zealand, Indonesia, Malaysia, Philippines, Singapore, Thailand, Vietnam, & Rest of APAC; Latin America – Brazil, Colombia, Chile, Argentina, Costa Rica, & Rest of Latin America; Middle East & Africa – Algeria, Egypt, Israel, Kuwait, Nigeria, Saudi Arabia, South Africa, Turkey, United Arab Emirates, & Rest of MEA Competitive Landscape Nutriad-Adisseo, Olmix Group, Lallemand Inc., Kemin Industries Inc., Biorigin, Nouryon, DuPont de Nemours Inc., Delacon Biotechnik GmbH, Camlin Fine Sciences Ltd., Phileo by Lesaffre, Diana Group, Alltech Customization Scope Customization for segments, region/country-level will be provided. Moreover, additional customization can be done based on the requirements. Purchase Options We have three licenses to opt for: Single User License, Multi-User License (Up to 5 Users), Corporate Use License (Unlimited User and Printable PDF) -
-
- 1. Executive Summary
- 1.1. Definition
- 1.2. Taxonomy
- 1.3. Research Scope
- 1.4. Key Analysis
- 1.5. Key Findings by Major Segments
- 1.6. Top strategies by Major Players
- 2. Global Aquafeed Market Overview
- 2.1. Aquafeed Market Dynamics
- 2.1.1. Drivers
- 2.1.2. Opportunities
- 2.1.3. Restraints
- 2.1.4. Challenges
- 2.2. Macro-economic Factors
- 2.3. Regulatory Framework
- 2.4. Market Investment Feasibility Index
- 2.5. PEST Analysis
- 2.6. PORTER’S Five Force Analysis
- 2.7. Drivers & Restraints Impact Analysis
- 2.8. Industry Chain Analysis
- 2.9. Cost Structure Analysis
- 2.10. Marketing Strategy
- 2.11. Russia-Ukraine War Impact Analysis
- 2.12. Opportunity Map Analysis
- 2.13. Market Competition Scenario Analysis
- 2.14. Product Life Cycle Analysis
- 2.15. Opportunity Orbits
- 2.16. Manufacturer Intensity Map
- 2.17. Major Companies sales by Value & Volume
- 2.1. Aquafeed Market Dynamics
- 3. Global Aquafeed Market Analysis, Opportunity and Forecast, 2016-2032
- 3.1. Global Aquafeed Market Analysis, 2016-2021
- 3.2. Global Aquafeed Market Opportunity and Forecast, 2023-2032
- 3.3. Global Aquafeed Market Analysis, Opportunity and Forecast, By By Ingredient, 2016-2032
- 3.3.1. Global Aquafeed Market Analysis by By Ingredient: Introduction
- 3.3.2. Market Size Absolute $ Opportunity Analysis and Forecast, By By Ingredient, 2016-2032
- 3.3.3. Anti-Parasitic
- 3.3.4. Feed Acidifiers
- 3.3.5. Prebiotics
- 3.3.6. Essential Oils & Natural Extracts
- 3.3.7. Palatants
- 3.3.8. Others
- 3.4. Global Aquafeed Market Analysis, Opportunity and Forecast, By By Application, 2016-2032
- 3.4.1. Global Aquafeed Market Analysis by By Application: Introduction
- 3.4.2. Market Size Absolute $ Opportunity Analysis and Forecast, By By Application, 2016-2032
- 3.4.3. Carp
- 3.4.4. Rainbow Trout
- 3.4.5. Salmon
- 3.4.6. Crustaceans
- 3.4.7. Tilapia
- 3.4.8. Catfish
- 3.4.9. Sea Bass
- 3.4.10. Grouper
- 3.4.11. Others
- 4. North America Aquafeed Market Analysis, Opportunity and Forecast, 2016-2032
- 4.1. North America Aquafeed Market Analysis, 2016-2021
- 4.2. North America Aquafeed Market Opportunity and Forecast, 2023-2032
- 4.3. North America Aquafeed Market Analysis, Opportunity and Forecast, By By Ingredient, 2016-2032
- 4.3.1. North America Aquafeed Market Analysis by By Ingredient: Introduction
- 4.3.2. Market Size Absolute $ Opportunity Analysis and Forecast, By By Ingredient, 2016-2032
- 4.3.3. Anti-Parasitic
- 4.3.4. Feed Acidifiers
- 4.3.5. Prebiotics
- 4.3.6. Essential Oils & Natural Extracts
- 4.3.7. Palatants
- 4.3.8. Others
- 4.4. North America Aquafeed Market Analysis, Opportunity and Forecast, By By Application, 2016-2032
- 4.4.1. North America Aquafeed Market Analysis by By Application: Introduction
- 4.4.2. Market Size Absolute $ Opportunity Analysis and Forecast, By By Application, 2016-2032
- 4.4.3. Carp
- 4.4.4. Rainbow Trout
- 4.4.5. Salmon
- 4.4.6. Crustaceans
- 4.4.7. Tilapia
- 4.4.8. Catfish
- 4.4.9. Sea Bass
- 4.4.10. Grouper
- 4.4.11. Others
- 4.5. North America Aquafeed Market Analysis, Opportunity and Forecast, By Country , 2016-2032
- 4.5.1. North America Aquafeed Market Analysis by Country : Introduction
- 4.5.2. Market Size Absolute $ Opportunity Analysis and Forecast, Country , 2016-2032
- 4.5.2.1. The US
- 4.5.2.2. Canada
- 4.5.2.3. Mexico
- 5. Western Europe Aquafeed Market Analysis, Opportunity and Forecast, 2016-2032
- 5.1. Western Europe Aquafeed Market Analysis, 2016-2021
- 5.2. Western Europe Aquafeed Market Opportunity and Forecast, 2023-2032
- 5.3. Western Europe Aquafeed Market Analysis, Opportunity and Forecast, By By Ingredient, 2016-2032
- 5.3.1. Western Europe Aquafeed Market Analysis by By Ingredient: Introduction
- 5.3.2. Market Size Absolute $ Opportunity Analysis and Forecast, By By Ingredient, 2016-2032
- 5.3.3. Anti-Parasitic
- 5.3.4. Feed Acidifiers
- 5.3.5. Prebiotics
- 5.3.6. Essential Oils & Natural Extracts
- 5.3.7. Palatants
- 5.3.8. Others
- 5.4. Western Europe Aquafeed Market Analysis, Opportunity and Forecast, By By Application, 2016-2032
- 5.4.1. Western Europe Aquafeed Market Analysis by By Application: Introduction
- 5.4.2. Market Size Absolute $ Opportunity Analysis and Forecast, By By Application, 2016-2032
- 5.4.3. Carp
- 5.4.4. Rainbow Trout
- 5.4.5. Salmon
- 5.4.6. Crustaceans
- 5.4.7. Tilapia
- 5.4.8. Catfish
- 5.4.9. Sea Bass
- 5.4.10. Grouper
- 5.4.11. Others
- 5.5. Western Europe Aquafeed Market Analysis, Opportunity and Forecast, By Country , 2016-2032
- 5.5.1. Western Europe Aquafeed Market Analysis by Country : Introduction
- 5.5.2. Market Size Absolute $ Opportunity Analysis and Forecast, Country , 2016-2032
- 5.5.2.1. Germany
- 5.5.2.2. France
- 5.5.2.3. The UK
- 5.5.2.4. Spain
- 5.5.2.5. Italy
- 5.5.2.6. Portugal
- 5.5.2.7. Ireland
- 5.5.2.8. Austria
- 5.5.2.9. Switzerland
- 5.5.2.10. Benelux
- 5.5.2.11. Nordic
- 5.5.2.12. Rest of Western Europe
- 6. Eastern Europe Aquafeed Market Analysis, Opportunity and Forecast, 2016-2032
- 6.1. Eastern Europe Aquafeed Market Analysis, 2016-2021
- 6.2. Eastern Europe Aquafeed Market Opportunity and Forecast, 2023-2032
- 6.3. Eastern Europe Aquafeed Market Analysis, Opportunity and Forecast, By By Ingredient, 2016-2032
- 6.3.1. Eastern Europe Aquafeed Market Analysis by By Ingredient: Introduction
- 6.3.2. Market Size Absolute $ Opportunity Analysis and Forecast, By By Ingredient, 2016-2032
- 6.3.3. Anti-Parasitic
- 6.3.4. Feed Acidifiers
- 6.3.5. Prebiotics
- 6.3.6. Essential Oils & Natural Extracts
- 6.3.7. Palatants
- 6.3.8. Others
- 6.4. Eastern Europe Aquafeed Market Analysis, Opportunity and Forecast, By By Application, 2016-2032
- 6.4.1. Eastern Europe Aquafeed Market Analysis by By Application: Introduction
- 6.4.2. Market Size Absolute $ Opportunity Analysis and Forecast, By By Application, 2016-2032
- 6.4.3. Carp
- 6.4.4. Rainbow Trout
- 6.4.5. Salmon
- 6.4.6. Crustaceans
- 6.4.7. Tilapia
- 6.4.8. Catfish
- 6.4.9. Sea Bass
- 6.4.10. Grouper
- 6.4.11. Others
- 6.5. Eastern Europe Aquafeed Market Analysis, Opportunity and Forecast, By Country , 2016-2032
- 6.5.1. Eastern Europe Aquafeed Market Analysis by Country : Introduction
- 6.5.2. Market Size Absolute $ Opportunity Analysis and Forecast, Country , 2016-2032
- 6.5.2.1. Russia
- 6.5.2.2. Poland
- 6.5.2.3. The Czech Republic
- 6.5.2.4. Greece
- 6.5.2.5. Rest of Eastern Europe
- 7. APAC Aquafeed Market Analysis, Opportunity and Forecast, 2016-2032
- 7.1. APAC Aquafeed Market Analysis, 2016-2021
- 7.2. APAC Aquafeed Market Opportunity and Forecast, 2023-2032
- 7.3. APAC Aquafeed Market Analysis, Opportunity and Forecast, By By Ingredient, 2016-2032
- 7.3.1. APAC Aquafeed Market Analysis by By Ingredient: Introduction
- 7.3.2. Market Size Absolute $ Opportunity Analysis and Forecast, By By Ingredient, 2016-2032
- 7.3.3. Anti-Parasitic
- 7.3.4. Feed Acidifiers
- 7.3.5. Prebiotics
- 7.3.6. Essential Oils & Natural Extracts
- 7.3.7. Palatants
- 7.3.8. Others
- 7.4. APAC Aquafeed Market Analysis, Opportunity and Forecast, By By Application, 2016-2032
- 7.4.1. APAC Aquafeed Market Analysis by By Application: Introduction
- 7.4.2. Market Size Absolute $ Opportunity Analysis and Forecast, By By Application, 2016-2032
- 7.4.3. Carp
- 7.4.4. Rainbow Trout
- 7.4.5. Salmon
- 7.4.6. Crustaceans
- 7.4.7. Tilapia
- 7.4.8. Catfish
- 7.4.9. Sea Bass
- 7.4.10. Grouper
- 7.4.11. Others
- 7.5. APAC Aquafeed Market Analysis, Opportunity and Forecast, By Country , 2016-2032
- 7.5.1. APAC Aquafeed Market Analysis by Country : Introduction
- 7.5.2. Market Size Absolute $ Opportunity Analysis and Forecast, Country , 2016-2032
- 7.5.2.1. China
- 7.5.2.2. Japan
- 7.5.2.3. South Korea
- 7.5.2.4. India
- 7.5.2.5. Australia & New Zeland
- 7.5.2.6. Indonesia
- 7.5.2.7. Malaysia
- 7.5.2.8. Philippines
- 7.5.2.9. Singapore
- 7.5.2.10. Thailand
- 7.5.2.11. Vietnam
- 7.5.2.12. Rest of APAC
- 8. Latin America Aquafeed Market Analysis, Opportunity and Forecast, 2016-2032
- 8.1. Latin America Aquafeed Market Analysis, 2016-2021
- 8.2. Latin America Aquafeed Market Opportunity and Forecast, 2023-2032
- 8.3. Latin America Aquafeed Market Analysis, Opportunity and Forecast, By By Ingredient, 2016-2032
- 8.3.1. Latin America Aquafeed Market Analysis by By Ingredient: Introduction
- 8.3.2. Market Size Absolute $ Opportunity Analysis and Forecast, By By Ingredient, 2016-2032
- 8.3.3. Anti-Parasitic
- 8.3.4. Feed Acidifiers
- 8.3.5. Prebiotics
- 8.3.6. Essential Oils & Natural Extracts
- 8.3.7. Palatants
- 8.3.8. Others
- 8.4. Latin America Aquafeed Market Analysis, Opportunity and Forecast, By By Application, 2016-2032
- 8.4.1. Latin America Aquafeed Market Analysis by By Application: Introduction
- 8.4.2. Market Size Absolute $ Opportunity Analysis and Forecast, By By Application, 2016-2032
- 8.4.3. Carp
- 8.4.4. Rainbow Trout
- 8.4.5. Salmon
- 8.4.6. Crustaceans
- 8.4.7. Tilapia
- 8.4.8. Catfish
- 8.4.9. Sea Bass
- 8.4.10. Grouper
- 8.4.11. Others
- 8.5. Latin America Aquafeed Market Analysis, Opportunity and Forecast, By Country , 2016-2032
- 8.5.1. Latin America Aquafeed Market Analysis by Country : Introduction
- 8.5.2. Market Size Absolute $ Opportunity Analysis and Forecast, Country , 2016-2032
- 8.5.2.1. Brazil
- 8.5.2.2. Colombia
- 8.5.2.3. Chile
- 8.5.2.4. Argentina
- 8.5.2.5. Costa Rica
- 8.5.2.6. Rest of Latin America
- 9. Middle East & Africa Aquafeed Market Analysis, Opportunity and Forecast, 2016-2032
- 9.1. Middle East & Africa Aquafeed Market Analysis, 2016-2021
- 9.2. Middle East & Africa Aquafeed Market Opportunity and Forecast, 2023-2032
- 9.3. Middle East & Africa Aquafeed Market Analysis, Opportunity and Forecast, By By Ingredient, 2016-2032
- 9.3.1. Middle East & Africa Aquafeed Market Analysis by By Ingredient: Introduction
- 9.3.2. Market Size Absolute $ Opportunity Analysis and Forecast, By By Ingredient, 2016-2032
- 9.3.3. Anti-Parasitic
- 9.3.4. Feed Acidifiers
- 9.3.5. Prebiotics
- 9.3.6. Essential Oils & Natural Extracts
- 9.3.7. Palatants
- 9.3.8. Others
- 9.4. Middle East & Africa Aquafeed Market Analysis, Opportunity and Forecast, By By Application, 2016-2032
- 9.4.1. Middle East & Africa Aquafeed Market Analysis by By Application: Introduction
- 9.4.2. Market Size Absolute $ Opportunity Analysis and Forecast, By By Application, 2016-2032
- 9.4.3. Carp
- 9.4.4. Rainbow Trout
- 9.4.5. Salmon
- 9.4.6. Crustaceans
- 9.4.7. Tilapia
- 9.4.8. Catfish
- 9.4.9. Sea Bass
- 9.4.10. Grouper
- 9.4.11. Others
- 9.5. Middle East & Africa Aquafeed Market Analysis, Opportunity and Forecast, By Country , 2016-2032
- 9.5.1. Middle East & Africa Aquafeed Market Analysis by Country : Introduction
- 9.5.2. Market Size Absolute $ Opportunity Analysis and Forecast, Country , 2016-2032
- 9.5.2.1. Algeria
- 9.5.2.2. Egypt
- 9.5.2.3. Israel
- 9.5.2.4. Kuwait
- 9.5.2.5. Nigeria
- 9.5.2.6. Saudi Arabia
- 9.5.2.7. South Africa
- 9.5.2.8. Turkey
- 9.5.2.9. The UAE
- 9.5.2.10. Rest of MEA
- 10. Global Aquafeed Market Analysis, Opportunity and Forecast, By Region , 2016-2032
- 10.1. Global Aquafeed Market Analysis by Region : Introduction
- 10.2. Market Size Absolute $ Opportunity Analysis and Forecast, By Region , 2016-2032
- 10.2.1. North America
- 10.2.2. Western Europe
- 10.2.3. Eastern Europe
- 10.2.4. APAC
- 10.2.5. Latin America
- 10.2.6. Middle East & Africa
- 11. Global Aquafeed Market Competitive Landscape, Market Share Analysis, and Company Profiles
- 11.1. Market Share Analysis
- 11.2. Company Profiles
- 11.3. Nutriad-Adisseo
- 11.3.1. Company Overview
- 11.3.2. Financial Highlights
- 11.3.3. Product Portfolio
- 11.3.4. SWOT Analysis
- 11.3.5. Key Strategies and Developments
- 11.4. Olmix Group
- 11.4.1. Company Overview
- 11.4.2. Financial Highlights
- 11.4.3. Product Portfolio
- 11.4.4. SWOT Analysis
- 11.4.5. Key Strategies and Developments
- 11.5. Lallemand Inc.
- 11.5.1. Company Overview
- 11.5.2. Financial Highlights
- 11.5.3. Product Portfolio
- 11.5.4. SWOT Analysis
- 11.5.5. Key Strategies and Developments
- 11.6. Kemin Industries Inc.
- 11.6.1. Company Overview
- 11.6.2. Financial Highlights
- 11.6.3. Product Portfolio
- 11.6.4. SWOT Analysis
- 11.6.5. Key Strategies and Developments
- 11.7. Biorigin
- 11.7.1. Company Overview
- 11.7.2. Financial Highlights
- 11.7.3. Product Portfolio
- 11.7.4. SWOT Analysis
- 11.7.5. Key Strategies and Developments
- 11.8. Nouryon
- 11.8.1. Company Overview
- 11.8.2. Financial Highlights
- 11.8.3. Product Portfolio
- 11.8.4. SWOT Analysis
- 11.8.5. Key Strategies and Developments
- 11.9. DuPont de Nemours Inc.
- 11.9.1. Company Overview
- 11.9.2. Financial Highlights
- 11.9.3. Product Portfolio
- 11.9.4. SWOT Analysis
- 11.9.5. Key Strategies and Developments
- 11.10. Delacon Biotechnik GmbH
- 11.10.1. Company Overview
- 11.10.2. Financial Highlights
- 11.10.3. Product Portfolio
- 11.10.4. SWOT Analysis
- 11.10.5. Key Strategies and Developments
- 11.11. Camlin Fine Sciences Ltd.
- 11.11.1. Company Overview
- 11.11.2. Financial Highlights
- 11.11.3. Product Portfolio
- 11.11.4. SWOT Analysis
- 11.11.5. Key Strategies and Developments
- 11.12. Phileo by Lesaffre
- 11.12.1. Company Overview
- 11.12.2. Financial Highlights
- 11.12.3. Product Portfolio
- 11.12.4. SWOT Analysis
- 11.12.5. Key Strategies and Developments
- 11.13. Diana Group
- 11.13.1. Company Overview
- 11.13.2. Financial Highlights
- 11.13.3. Product Portfolio
- 11.13.4. SWOT Analysis
- 11.13.5. Key Strategies and Developments
- 11.14. Alltech
- 11.14.1. Company Overview
- 11.14.2. Financial Highlights
- 11.14.3. Product Portfolio
- 11.14.4. SWOT Analysis
- 11.14.5. Key Strategies and Developments
- 12. Assumptions and Acronyms
- 13. Research Methodology
- 14. Contact
- List of Figures
- Figure 1: Global Aquafeed Market Revenue (US$ Mn) Market Share by By Ingredient in 2022
- Figure 2: Global Aquafeed Market Attractiveness Analysis by By Ingredient, 2016-2032
- Figure 3: Global Aquafeed Market Revenue (US$ Mn) Market Share by By Applicationin 2022
- Figure 4: Global Aquafeed Market Attractiveness Analysis by By Application, 2016-2032
- Figure 5: Global Aquafeed Market Revenue (US$ Mn) Market Share by Region in 2022
- Figure 6: Global Aquafeed Market Attractiveness Analysis by Region, 2016-2032
- Figure 7: Global Aquafeed Market Revenue (US$ Mn) (2016-2032)
- Figure 8: Global Aquafeed Market Revenue (US$ Mn) Comparison by Region (2016-2032)
- Figure 9: Global Aquafeed Market Revenue (US$ Mn) Comparison by By Ingredient (2016-2032)
- Figure 10: Global Aquafeed Market Revenue (US$ Mn) Comparison by By Application (2016-2032)
- Figure 11: Global Aquafeed Market Y-o-Y Growth Rate Comparison by Region (2016-2032)
- Figure 12: Global Aquafeed Market Y-o-Y Growth Rate Comparison by By Ingredient (2016-2032)
- Figure 13: Global Aquafeed Market Y-o-Y Growth Rate Comparison by By Application (2016-2032)
- Figure 14: Global Aquafeed Market Share Comparison by Region (2016-2032)
- Figure 15: Global Aquafeed Market Share Comparison by By Ingredient (2016-2032)
- Figure 16: Global Aquafeed Market Share Comparison by By Application (2016-2032)
- Figure 17: North America Aquafeed Market Revenue (US$ Mn) Market Share by By Ingredientin 2022
- Figure 18: North America Aquafeed Market Attractiveness Analysis by By Ingredient, 2016-2032
- Figure 19: North America Aquafeed Market Revenue (US$ Mn) Market Share by By Applicationin 2022
- Figure 20: North America Aquafeed Market Attractiveness Analysis by By Application, 2016-2032
- Figure 21: North America Aquafeed Market Revenue (US$ Mn) Market Share by Country in 2022
- Figure 22: North America Aquafeed Market Attractiveness Analysis by Country, 2016-2032
- Figure 23: North America Aquafeed Market Revenue (US$ Mn) (2016-2032)
- Figure 24: North America Aquafeed Market Revenue (US$ Mn) Comparison by Country (2016-2032)
- Figure 25: North America Aquafeed Market Revenue (US$ Mn) Comparison by By Ingredient (2016-2032)
- Figure 26: North America Aquafeed Market Revenue (US$ Mn) Comparison by By Application (2016-2032)
- Figure 27: North America Aquafeed Market Y-o-Y Growth Rate Comparison by Country (2016-2032)
- Figure 28: North America Aquafeed Market Y-o-Y Growth Rate Comparison by By Ingredient (2016-2032)
- Figure 29: North America Aquafeed Market Y-o-Y Growth Rate Comparison by By Application (2016-2032)
- Figure 30: North America Aquafeed Market Share Comparison by Country (2016-2032)
- Figure 31: North America Aquafeed Market Share Comparison by By Ingredient (2016-2032)
- Figure 32: North America Aquafeed Market Share Comparison by By Application (2016-2032)
- Figure 33: Western Europe Aquafeed Market Revenue (US$ Mn) Market Share by By Ingredientin 2022
- Figure 34: Western Europe Aquafeed Market Attractiveness Analysis by By Ingredient, 2016-2032
- Figure 35: Western Europe Aquafeed Market Revenue (US$ Mn) Market Share by By Applicationin 2022
- Figure 36: Western Europe Aquafeed Market Attractiveness Analysis by By Application, 2016-2032
- Figure 37: Western Europe Aquafeed Market Revenue (US$ Mn) Market Share by Country in 2022
- Figure 38: Western Europe Aquafeed Market Attractiveness Analysis by Country, 2016-2032
- Figure 39: Western Europe Aquafeed Market Revenue (US$ Mn) (2016-2032)
- Figure 40: Western Europe Aquafeed Market Revenue (US$ Mn) Comparison by Country (2016-2032)
- Figure 41: Western Europe Aquafeed Market Revenue (US$ Mn) Comparison by By Ingredient (2016-2032)
- Figure 42: Western Europe Aquafeed Market Revenue (US$ Mn) Comparison by By Application (2016-2032)
- Figure 43: Western Europe Aquafeed Market Y-o-Y Growth Rate Comparison by Country (2016-2032)
- Figure 44: Western Europe Aquafeed Market Y-o-Y Growth Rate Comparison by By Ingredient (2016-2032)
- Figure 45: Western Europe Aquafeed Market Y-o-Y Growth Rate Comparison by By Application (2016-2032)
- Figure 46: Western Europe Aquafeed Market Share Comparison by Country (2016-2032)
- Figure 47: Western Europe Aquafeed Market Share Comparison by By Ingredient (2016-2032)
- Figure 48: Western Europe Aquafeed Market Share Comparison by By Application (2016-2032)
- Figure 49: Eastern Europe Aquafeed Market Revenue (US$ Mn) Market Share by By Ingredientin 2022
- Figure 50: Eastern Europe Aquafeed Market Attractiveness Analysis by By Ingredient, 2016-2032
- Figure 51: Eastern Europe Aquafeed Market Revenue (US$ Mn) Market Share by By Applicationin 2022
- Figure 52: Eastern Europe Aquafeed Market Attractiveness Analysis by By Application, 2016-2032
- Figure 53: Eastern Europe Aquafeed Market Revenue (US$ Mn) Market Share by Country in 2022
- Figure 54: Eastern Europe Aquafeed Market Attractiveness Analysis by Country, 2016-2032
- Figure 55: Eastern Europe Aquafeed Market Revenue (US$ Mn) (2016-2032)
- Figure 56: Eastern Europe Aquafeed Market Revenue (US$ Mn) Comparison by Country (2016-2032)
- Figure 57: Eastern Europe Aquafeed Market Revenue (US$ Mn) Comparison by By Ingredient (2016-2032)
- Figure 58: Eastern Europe Aquafeed Market Revenue (US$ Mn) Comparison by By Application (2016-2032)
- Figure 59: Eastern Europe Aquafeed Market Y-o-Y Growth Rate Comparison by Country (2016-2032)
- Figure 60: Eastern Europe Aquafeed Market Y-o-Y Growth Rate Comparison by By Ingredient (2016-2032)
- Figure 61: Eastern Europe Aquafeed Market Y-o-Y Growth Rate Comparison by By Application (2016-2032)
- Figure 62: Eastern Europe Aquafeed Market Share Comparison by Country (2016-2032)
- Figure 63: Eastern Europe Aquafeed Market Share Comparison by By Ingredient (2016-2032)
- Figure 64: Eastern Europe Aquafeed Market Share Comparison by By Application (2016-2032)
- Figure 65: APAC Aquafeed Market Revenue (US$ Mn) Market Share by By Ingredientin 2022
- Figure 66: APAC Aquafeed Market Attractiveness Analysis by By Ingredient, 2016-2032
- Figure 67: APAC Aquafeed Market Revenue (US$ Mn) Market Share by By Applicationin 2022
- Figure 68: APAC Aquafeed Market Attractiveness Analysis by By Application, 2016-2032
- Figure 69: APAC Aquafeed Market Revenue (US$ Mn) Market Share by Country in 2022
- Figure 70: APAC Aquafeed Market Attractiveness Analysis by Country, 2016-2032
- Figure 71: APAC Aquafeed Market Revenue (US$ Mn) (2016-2032)
- Figure 72: APAC Aquafeed Market Revenue (US$ Mn) Comparison by Country (2016-2032)
- Figure 73: APAC Aquafeed Market Revenue (US$ Mn) Comparison by By Ingredient (2016-2032)
- Figure 74: APAC Aquafeed Market Revenue (US$ Mn) Comparison by By Application (2016-2032)
- Figure 75: APAC Aquafeed Market Y-o-Y Growth Rate Comparison by Country (2016-2032)
- Figure 76: APAC Aquafeed Market Y-o-Y Growth Rate Comparison by By Ingredient (2016-2032)
- Figure 77: APAC Aquafeed Market Y-o-Y Growth Rate Comparison by By Application (2016-2032)
- Figure 78: APAC Aquafeed Market Share Comparison by Country (2016-2032)
- Figure 79: APAC Aquafeed Market Share Comparison by By Ingredient (2016-2032)
- Figure 80: APAC Aquafeed Market Share Comparison by By Application (2016-2032)
- Figure 81: Latin America Aquafeed Market Revenue (US$ Mn) Market Share by By Ingredientin 2022
- Figure 82: Latin America Aquafeed Market Attractiveness Analysis by By Ingredient, 2016-2032
- Figure 83: Latin America Aquafeed Market Revenue (US$ Mn) Market Share by By Applicationin 2022
- Figure 84: Latin America Aquafeed Market Attractiveness Analysis by By Application, 2016-2032
- Figure 85: Latin America Aquafeed Market Revenue (US$ Mn) Market Share by Country in 2022
- Figure 86: Latin America Aquafeed Market Attractiveness Analysis by Country, 2016-2032
- Figure 87: Latin America Aquafeed Market Revenue (US$ Mn) (2016-2032)
- Figure 88: Latin America Aquafeed Market Revenue (US$ Mn) Comparison by Country (2016-2032)
- Figure 89: Latin America Aquafeed Market Revenue (US$ Mn) Comparison by By Ingredient (2016-2032)
- Figure 90: Latin America Aquafeed Market Revenue (US$ Mn) Comparison by By Application (2016-2032)
- Figure 91: Latin America Aquafeed Market Y-o-Y Growth Rate Comparison by Country (2016-2032)
- Figure 92: Latin America Aquafeed Market Y-o-Y Growth Rate Comparison by By Ingredient (2016-2032)
- Figure 93: Latin America Aquafeed Market Y-o-Y Growth Rate Comparison by By Application (2016-2032)
- Figure 94: Latin America Aquafeed Market Share Comparison by Country (2016-2032)
- Figure 95: Latin America Aquafeed Market Share Comparison by By Ingredient (2016-2032)
- Figure 96: Latin America Aquafeed Market Share Comparison by By Application (2016-2032)
- Figure 97: Middle East & Africa Aquafeed Market Revenue (US$ Mn) Market Share by By Ingredientin 2022
- Figure 98: Middle East & Africa Aquafeed Market Attractiveness Analysis by By Ingredient, 2016-2032
- Figure 99: Middle East & Africa Aquafeed Market Revenue (US$ Mn) Market Share by By Applicationin 2022
- Figure 100: Middle East & Africa Aquafeed Market Attractiveness Analysis by By Application, 2016-2032
- Figure 101: Middle East & Africa Aquafeed Market Revenue (US$ Mn) Market Share by Country in 2022
- Figure 102: Middle East & Africa Aquafeed Market Attractiveness Analysis by Country, 2016-2032
- Figure 103: Middle East & Africa Aquafeed Market Revenue (US$ Mn) (2016-2032)
- Figure 104: Middle East & Africa Aquafeed Market Revenue (US$ Mn) Comparison by Country (2016-2032)
- Figure 105: Middle East & Africa Aquafeed Market Revenue (US$ Mn) Comparison by By Ingredient (2016-2032)
- Figure 106: Middle East & Africa Aquafeed Market Revenue (US$ Mn) Comparison by By Application (2016-2032)
- Figure 107: Middle East & Africa Aquafeed Market Y-o-Y Growth Rate Comparison by Country (2016-2032)
- Figure 108: Middle East & Africa Aquafeed Market Y-o-Y Growth Rate Comparison by By Ingredient (2016-2032)
- Figure 109: Middle East & Africa Aquafeed Market Y-o-Y Growth Rate Comparison by By Application (2016-2032)
- Figure 110: Middle East & Africa Aquafeed Market Share Comparison by Country (2016-2032)
- Figure 111: Middle East & Africa Aquafeed Market Share Comparison by By Ingredient (2016-2032)
- Figure 112: Middle East & Africa Aquafeed Market Share Comparison by By Application (2016-2032)
- List of Tables
- Table 1: Global Aquafeed Market Comparison by By Ingredient (2016-2032)
- Table 2: Global Aquafeed Market Comparison by By Application (2016-2032)
- Table 3: Global Aquafeed Market Revenue (US$ Mn) Comparison by Region (2016-2032)
- Table 4: Global Aquafeed Market Revenue (US$ Mn) (2016-2032)
- Table 5: Global Aquafeed Market Revenue (US$ Mn) Comparison by Region (2016-2032)
- Table 6: Global Aquafeed Market Revenue (US$ Mn) Comparison by By Ingredient (2016-2032)
- Table 7: Global Aquafeed Market Revenue (US$ Mn) Comparison by By Application (2016-2032)
- Table 8: Global Aquafeed Market Y-o-Y Growth Rate Comparison by Region (2016-2032)
- Table 9: Global Aquafeed Market Y-o-Y Growth Rate Comparison by By Ingredient (2016-2032)
- Table 10: Global Aquafeed Market Y-o-Y Growth Rate Comparison by By Application (2016-2032)
- Table 11: Global Aquafeed Market Share Comparison by Region (2016-2032)
- Table 12: Global Aquafeed Market Share Comparison by By Ingredient (2016-2032)
- Table 13: Global Aquafeed Market Share Comparison by By Application (2016-2032)
- Table 14: North America Aquafeed Market Comparison by By Application (2016-2032)
- Table 15: North America Aquafeed Market Revenue (US$ Mn) Comparison by Country (2016-2032)
- Table 16: North America Aquafeed Market Revenue (US$ Mn) (2016-2032)
- Table 17: North America Aquafeed Market Revenue (US$ Mn) Comparison by Country (2016-2032)
- Table 18: North America Aquafeed Market Revenue (US$ Mn) Comparison by By Ingredient (2016-2032)
- Table 19: North America Aquafeed Market Revenue (US$ Mn) Comparison by By Application (2016-2032)
- Table 20: North America Aquafeed Market Y-o-Y Growth Rate Comparison by Country (2016-2032)
- Table 21: North America Aquafeed Market Y-o-Y Growth Rate Comparison by By Ingredient (2016-2032)
- Table 22: North America Aquafeed Market Y-o-Y Growth Rate Comparison by By Application (2016-2032)
- Table 23: North America Aquafeed Market Share Comparison by Country (2016-2032)
- Table 24: North America Aquafeed Market Share Comparison by By Ingredient (2016-2032)
- Table 25: North America Aquafeed Market Share Comparison by By Application (2016-2032)
- Table 26: Western Europe Aquafeed Market Comparison by By Ingredient (2016-2032)
- Table 27: Western Europe Aquafeed Market Comparison by By Application (2016-2032)
- Table 28: Western Europe Aquafeed Market Revenue (US$ Mn) Comparison by Country (2016-2032)
- Table 29: Western Europe Aquafeed Market Revenue (US$ Mn) (2016-2032)
- Table 30: Western Europe Aquafeed Market Revenue (US$ Mn) Comparison by Country (2016-2032)
- Table 31: Western Europe Aquafeed Market Revenue (US$ Mn) Comparison by By Ingredient (2016-2032)
- Table 32: Western Europe Aquafeed Market Revenue (US$ Mn) Comparison by By Application (2016-2032)
- Table 33: Western Europe Aquafeed Market Y-o-Y Growth Rate Comparison by Country (2016-2032)
- Table 34: Western Europe Aquafeed Market Y-o-Y Growth Rate Comparison by By Ingredient (2016-2032)
- Table 35: Western Europe Aquafeed Market Y-o-Y Growth Rate Comparison by By Application (2016-2032)
- Table 36: Western Europe Aquafeed Market Share Comparison by Country (2016-2032)
- Table 37: Western Europe Aquafeed Market Share Comparison by By Ingredient (2016-2032)
- Table 38: Western Europe Aquafeed Market Share Comparison by By Application (2016-2032)
- Table 39: Eastern Europe Aquafeed Market Comparison by By Ingredient (2016-2032)
- Table 40: Eastern Europe Aquafeed Market Comparison by By Application (2016-2032)
- Table 41: Eastern Europe Aquafeed Market Revenue (US$ Mn) Comparison by Country (2016-2032)
- Table 42: Eastern Europe Aquafeed Market Revenue (US$ Mn) (2016-2032)
- Table 43: Eastern Europe Aquafeed Market Revenue (US$ Mn) Comparison by Country (2016-2032)
- Table 44: Eastern Europe Aquafeed Market Revenue (US$ Mn) Comparison by By Ingredient (2016-2032)
- Table 45: Eastern Europe Aquafeed Market Revenue (US$ Mn) Comparison by By Application (2016-2032)
- Table 46: Eastern Europe Aquafeed Market Y-o-Y Growth Rate Comparison by Country (2016-2032)
- Table 47: Eastern Europe Aquafeed Market Y-o-Y Growth Rate Comparison by By Ingredient (2016-2032)
- Table 48: Eastern Europe Aquafeed Market Y-o-Y Growth Rate Comparison by By Application (2016-2032)
- Table 49: Eastern Europe Aquafeed Market Share Comparison by Country (2016-2032)
- Table 50: Eastern Europe Aquafeed Market Share Comparison by By Ingredient (2016-2032)
- Table 51: Eastern Europe Aquafeed Market Share Comparison by By Application (2016-2032)
- Table 52: APAC Aquafeed Market Comparison by By Ingredient (2016-2032)
- Table 53: APAC Aquafeed Market Comparison by By Application (2016-2032)
- Table 54: APAC Aquafeed Market Revenue (US$ Mn) Comparison by Country (2016-2032)
- Table 55: APAC Aquafeed Market Revenue (US$ Mn) (2016-2032)
- Table 56: APAC Aquafeed Market Revenue (US$ Mn) Comparison by Country (2016-2032)
- Table 57: APAC Aquafeed Market Revenue (US$ Mn) Comparison by By Ingredient (2016-2032)
- Table 58: APAC Aquafeed Market Revenue (US$ Mn) Comparison by By Application (2016-2032)
- Table 59: APAC Aquafeed Market Y-o-Y Growth Rate Comparison by Country (2016-2032)
- Table 60: APAC Aquafeed Market Y-o-Y Growth Rate Comparison by By Ingredient (2016-2032)
- Table 61: APAC Aquafeed Market Y-o-Y Growth Rate Comparison by By Application (2016-2032)
- Table 62: APAC Aquafeed Market Share Comparison by Country (2016-2032)
- Table 63: APAC Aquafeed Market Share Comparison by By Ingredient (2016-2032)
- Table 64: APAC Aquafeed Market Share Comparison by By Application (2016-2032)
- Table 65: Latin America Aquafeed Market Comparison by By Ingredient (2016-2032)
- Table 66: Latin America Aquafeed Market Comparison by By Application (2016-2032)
- Table 67: Latin America Aquafeed Market Revenue (US$ Mn) Comparison by Country (2016-2032)
- Table 68: Latin America Aquafeed Market Revenue (US$ Mn) (2016-2032)
- Table 69: Latin America Aquafeed Market Revenue (US$ Mn) Comparison by Country (2016-2032)
- Table 70: Latin America Aquafeed Market Revenue (US$ Mn) Comparison by By Ingredient (2016-2032)
- Table 71: Latin America Aquafeed Market Revenue (US$ Mn) Comparison by By Application (2016-2032)
- Table 72: Latin America Aquafeed Market Y-o-Y Growth Rate Comparison by Country (2016-2032)
- Table 73: Latin America Aquafeed Market Y-o-Y Growth Rate Comparison by By Ingredient (2016-2032)
- Table 74: Latin America Aquafeed Market Y-o-Y Growth Rate Comparison by By Application (2016-2032)
- Table 75: Latin America Aquafeed Market Share Comparison by Country (2016-2032)
- Table 76: Latin America Aquafeed Market Share Comparison by By Ingredient (2016-2032)
- Table 77: Latin America Aquafeed Market Share Comparison by By Application (2016-2032)
- Table 78: Middle East & Africa Aquafeed Market Comparison by By Ingredient (2016-2032)
- Table 79: Middle East & Africa Aquafeed Market Comparison by By Application (2016-2032)
- Table 80: Middle East & Africa Aquafeed Market Revenue (US$ Mn) Comparison by Country (2016-2032)
- Table 81: Middle East & Africa Aquafeed Market Revenue (US$ Mn) (2016-2032)
- Table 82: Middle East & Africa Aquafeed Market Revenue (US$ Mn) Comparison by Country (2016-2032)
- Table 83: Middle East & Africa Aquafeed Market Revenue (US$ Mn) Comparison by By Ingredient (2016-2032)
- Table 84: Middle East & Africa Aquafeed Market Revenue (US$ Mn) Comparison by By Application (2016-2032)
- Table 85: Middle East & Africa Aquafeed Market Y-o-Y Growth Rate Comparison by Country (2016-2032)
- Table 86: Middle East & Africa Aquafeed Market Y-o-Y Growth Rate Comparison by By Ingredient (2016-2032)
- Table 87: Middle East & Africa Aquafeed Market Y-o-Y Growth Rate Comparison by By Application (2016-2032)
- Table 88: Middle East & Africa Aquafeed Market Share Comparison by Country (2016-2032)
- Table 89: Middle East & Africa Aquafeed Market Share Comparison by By Ingredient (2016-2032)
- Table 90: Middle East & Africa Aquafeed Market Share Comparison by By Application (2016-2032)
- 1. Executive Summary
-
- Nutriad-Adisseo
- Olmix Group
- Lallemand Inc.
- Kemin Industries Inc.
- Biorigin
- Nouryon
- DuPont de Nemours Inc.
- Delacon Biotechnik GmbH
- Camlin Fine Sciences Ltd.
- Phileo by Lesaffre
- Diana Group
- Alltech
Our Clients


View Our Licence Options
