
Aniline Market By Technology(Vapour-Phase Process, Liquid-Phase Process), By Application(Methylene Diphenyl Diisocyanate (MDI) Production, Rubber-processing Chemicals), By End-use Industry(Building & Construction, Rubber Products, Consumer Goods), By Region And Companies - Industry Segment Outlook, Market Assessment, Competition Scenario, Trends, And Forecast 2023-2032
-
10777
-
Nov 2023
-
150
-


-
This report was compiled by Shreyas Rokade Shreyas Rokade is a seasoned Research Analyst with CMFE, bringing extensive expertise in market research and consulting, with a strong background in Chemical Engineering. Correspondence Team Lead-CMFE Linkedin | Detailed Market research Methodology Our methodology involves a mix of primary research, including interviews with leading mental health experts, and secondary research from reputable medical journals and databases. View Detailed Methodology Page
-
Quick Navigation
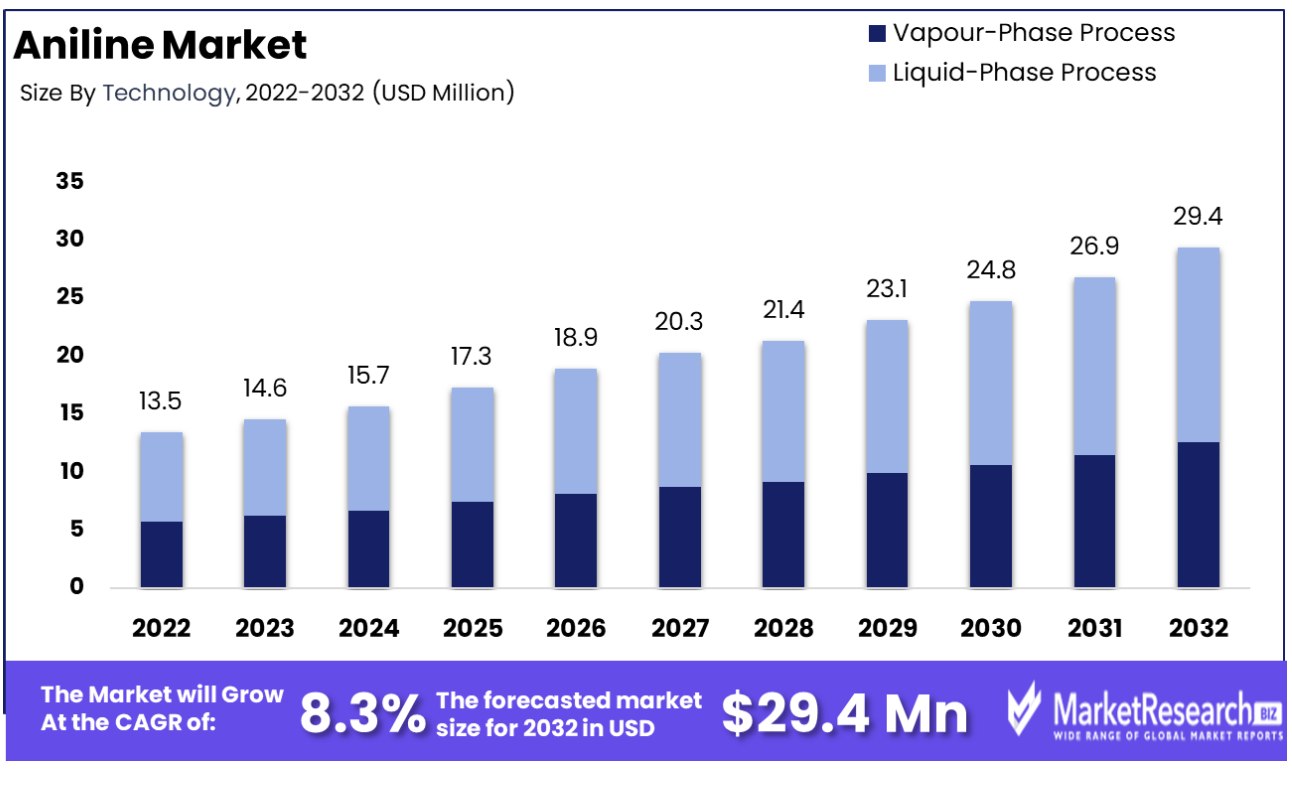
Aniline market size reached 13.5 Billion in 2022. It is projected to reach 29.67 Billion by 2032, displaying a significant CAGR of 8.3% during the forecast period of 2023 to 2032. The increasing requirement for rubber products, predominantly in the tire manufacturing sector, and the rising environmental issues are among the main driving factors for the market expansion.
Moreover, the push towards sustainable and renewable sources of rubber, such as synthetic rubber emphasizes the importance of chemical factors, including aniline. This helps to line up well with environmental issues and sustainability ingenuity, making Aniline a preferred option for modern rubber manufacturing methods.
For example, aniline is a highly reactive chemical which allows it to actively participate in chemical reactions for rubber synthesis. As in the production of neoprene, a type of synthetic rubber used in several applications like wetsuits and gaskets, aniline plays a significant role in it. Aniline serves as an important building rock, contributing to the creation of neoprene’s structure, allowing it with good resistance towards oil, chemical, and heat temperatures.
According to the U.S. Energy Information Administration (EIA), it is observed that a significant portion of the energy consumed in the average American household (approximately 51%) is devoted to heating and cooling spaces annually. The intensity of this energy consumption is shaped by various factors, including the home's geographical setting, its dimensions and architectural design, and the specific types of heating or cooling equipment and fuels utilized.
The integration of rigid polyurethane foam, renowned for its superior insulation properties, emerges as a viable solution for stabilizing indoor temperatures and diminishing sound levels. This application is poised to have a favorable impact on the expansion of the aniline market, given that rigid polyurethane foam represents a primary application segment for aniline. Methylene diphenyl diisocyanate (MDI), a critical component in the production of polyurethane foams, relies heavily on aniline as a raw material, underscoring aniline's significance in the polymer industry.
Aniline-based compounds work as precursors for generating light-emitting diodes (LEDs), liquid crystal displays (LCDs), and other electronic products. With consumer electronics becoming more advanced and pervasive, the requirement for specific materials, such as aniline will likely see a significant trend in the coming future.
Rapid urbanization globally is driving the demand for aniline, especially in developing regions where the construction and automotive sectors are booming. Innovations and advancements in aniline manufacturing processes, focusing on efficiency and environmental compliance, are pivotal for meeting the growing global demand.
Aniline derivatives are used as effective laminating agents in various industrial processes, contributing to the manufacturing of layered composite materials. Aniline is instrumental in pharmaceuticals, contributing to the synthesis of various medicines, and highlighting its versatility beyond industrial applications. The aniline market's growth is closely tied to its suppliers, with a concentration in regions rich in chemical manufacturing expertise and raw material availability.
Aniline Market Dynamics
The Surge in MDI Utilization Accelerates Aniline Consumption
The aniline market is experiencing substantial growth, primarily fueled by the rising demand for Methylene Diphenyl Diisocyanate (MDI) in various industries, including coatings, adhesives & sealants, and elastomers. The versatility and superior properties of MDI-based products, such as thermal insulation and energy efficiency, drive their adoption.
The increasing construction activities worldwide and the need for energy-efficient solutions have elevated the demand for MDI, subsequently propelling the aniline market forward. The trend is further bolstered by the push for green buildings and energy-efficient appliances, where MDI plays a critical role.
Green Chemistry Innovations and Bio-based Alternatives Propel Aniline Industry Towards Sustainable Future
Aniline, primarily used in the manufacture of polyurethane and other industrial chemicals, is subject to stringent regulatory oversight to minimize ecological impact. Modern production methodologies are increasingly adopting green chemistry principles, aiming to reduce harmful emissions and enhance energy efficiency.
The global market size of USD 11.5 Billion for synthetic and bio-based aniline is poised for substantial growth, driven by increasing eco-consciousness and demand for sustainable chemical alternatives.
Additionally, the industry is progressively exploring bio-based aniline sources, offering a more sustainable alternative to traditional petroleum-derived aniline. These advancements reflect a growing commitment to environmental stewardship, aligning aniline production with global sustainability objectives and adhering to evolving environmental standards and practices.
Polyurethane Proliferation Propels Aniline Prospects
Aniline's market growth is integrally linked to the burgeoning demand for polyurethane foams, which are ubiquitous in furniture, bedding, automotive interiors, and insulation materials. The versatility of polyurethane, ranging from rigid to flexible foams, makes it a material of choice across various applications. As urbanization and income levels rise, especially in developing regions, there is a concomitant increase in the construction of commercial and residential buildings as well as automotive production, both major consumers of rigid polyurethane foams.
Aniline's Integration in Gasoline Development Ignites Market Demand
Aniline is gaining momentum as a solvent and an anti-knock ingredient in the formulation of reformat gasoline. The compound's efficacy in enhancing the octane rating of fuels makes it valuable in the fuel additives market. As environmental regulations become more stringent, there is a shift towards cleaner-burning gasoline formulations, which often incorporate aniline as an anti-knock agent to meet the required standards.
Customization in the Motorcycle Industry Offers Growth Opportunities for Aniline Market
The bespoke demand for aniline within the motorcycle industry is opening new avenues for market expansion. Customized colors and finishes are increasingly popular in motorcycle manufacturing, with aniline serving as a critical input for creating durable and vibrant hues.
This trend aligns with the broader personalization wave sweeping through various consumer segments. With the global motorcycle market projected to expand, reaching a market size of USD 129.3 billion by 2028, the spillover effect on aniline demand is poised to be substantial, offering lucrative prospects for producers who can cater to this niche yet growing demand segment.
Aniline as a Dye in Fashion Offers Market Expansion Potential
The escalating utilization of aniline as a coloring agent in apparel, especially jeans, signals a market expansion opportunity. The global denim market, expected to reach USD 64.1 billion by 2025, heavily relies on aniline-based dyes for creating iconic indigo and other specialty colors.
As fashion trends evolve and consumer demand for sustainable yet vibrant clothing increases, airline manufacturers are presented with a chance to penetrate deeper into this market. The adoption of aniline dyes aligns with the industry’s pivot towards eco-friendly solutions, as newer aniline formulations boast reduced environmental impact while delivering the desired aesthetic appeal.
Toxicity of Aniline Restrains Market Growth
Exposure to aniline is known to cause severe health hazards to humans, including methemoglobinemia and other disorders, which leads to stringent regulatory controls.
High Volatility in Raw Material Prices Restrains Market Growth
The high volatility of these prices, influenced by unpredictable changes in crude oil markets and supply chain inconsistencies, can lead to instability in aniline production costs. This volatility complicates forecasting and financial planning for producers, who may pass increased costs onto consumers or reduce production during periods of higher raw material costs.
Aniline Market Segmentation Analysis
Technology Insights
The vapor-phase process dominates the technology segment for aniline production, primarily due to its cost-effectiveness and efficiency in large-scale operations. It is favored for its high yields and purity of the final product.
The liquid-phase process, while less dominant, serves niche applications where specific product qualities are desired or where production scale does not justify the vapor-phase investment. It continues to have relevance for specialized aniline production and in regions where the technological transfer of vapor-phase processes is not feasible.
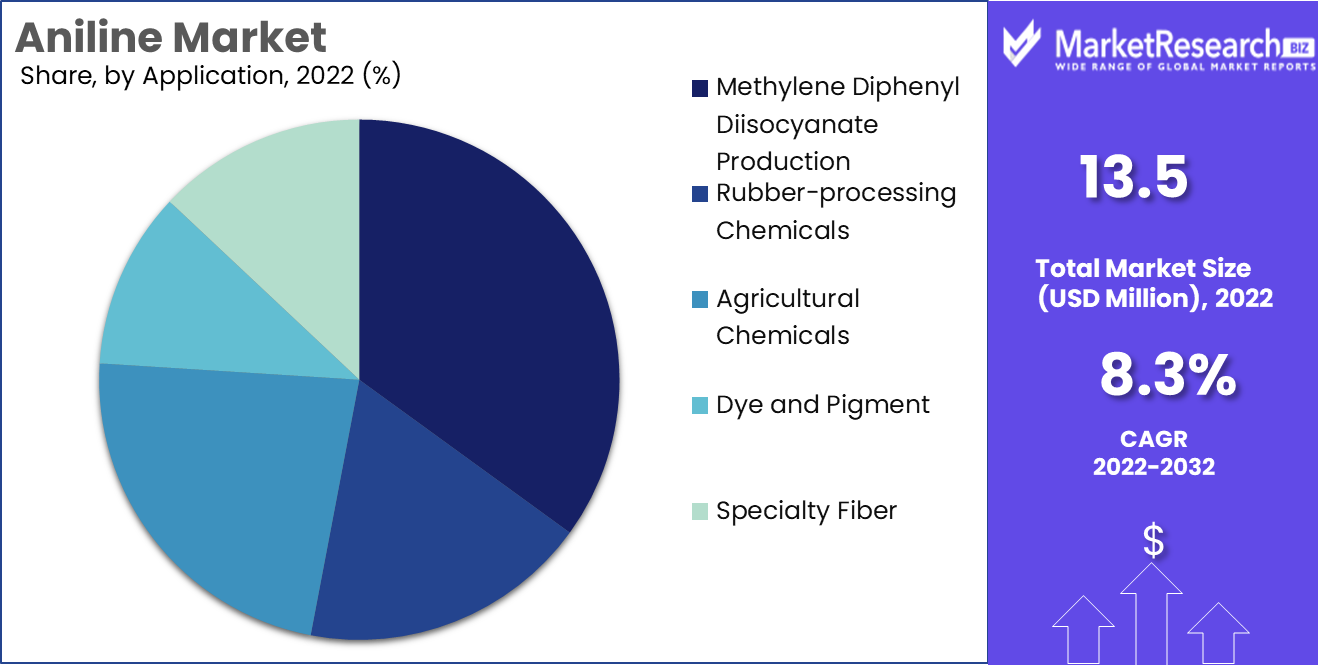
Application Insights
The dominance is attributed to MDI's critical role in producing polyurethane foams, which are integral in various industries. The construction boom and the increasing demand for insulating foams drive the need for MDI, with energy efficiency regulations further bolstering growth.
The remaining applications—rubber-processing chemicals, agricultural chemicals, pigments and dyes manufacturing, and specialty fibers—are essential for the diversification of the aniline market. While these segments represent a smaller share, their steady growth is driven by the expansion of the global rubber industry, advancements in agricultural productivity, the fashion industry's demand for new pigments and dyes, and the development of specialty fibers for technical applications.
End-use Insights
The building and construction industry stands as the preeminent end-use segment for aniline, mainly through the consumption of MDI-based polyurethane products. The increasing stringency of energy regulations promotes insulation applications, leading to significant market demand. Urbanization and infrastructure development are critical drivers for this segment's expansion.
Other important end-use segments include rubber products, consumer goods, automotive, packaging, and agriculture. Each sector utilizes aniline-derived products to enhance material properties like durability and thermal insulation. The automotive industry's recovery and growth, evolving consumer goods markets, and technological innovations in packaging and agricultural products contribute cumulatively to the broader aniline market landscape.Aniline Industry Segments
By Technology
- Vapour-Phase Process
- Liquid-Phase Process
By Application
- Methylene Diphenyl Diisocyanate (MDI) Production
- Rubber-processing Chemicals
- Agricultural Chemicals
- Dye and Pigment
- Specialty Fiber
By End-use Industry
- Building & Construction
- Rubber Products
- Consumer Goods
- Automotive
- Packaging
- Agriculture
Aniline Market Regional Analysis
Asia-Pacific Dominates with 54% Market Share in Aniline Industry
Asia-Pacific's commanding 54% share in the aniline market is primarily influenced by its robust manufacturing base, particularly in countries like China and India. This region benefits from an abundance of raw materials, which significantly reduces import dependency and operational costs. Additionally, favorable government policies promoting industrial growth, coupled with lower labor costs, have catalyzed the expansion of chemical industries. Moreover, the presence of key players like Sinopec Corp., BASF Corporation, and Wanhua Chemical Group in this region enhances its market stature, ensuring a steady supply chain and innovation in aniline production technologies.
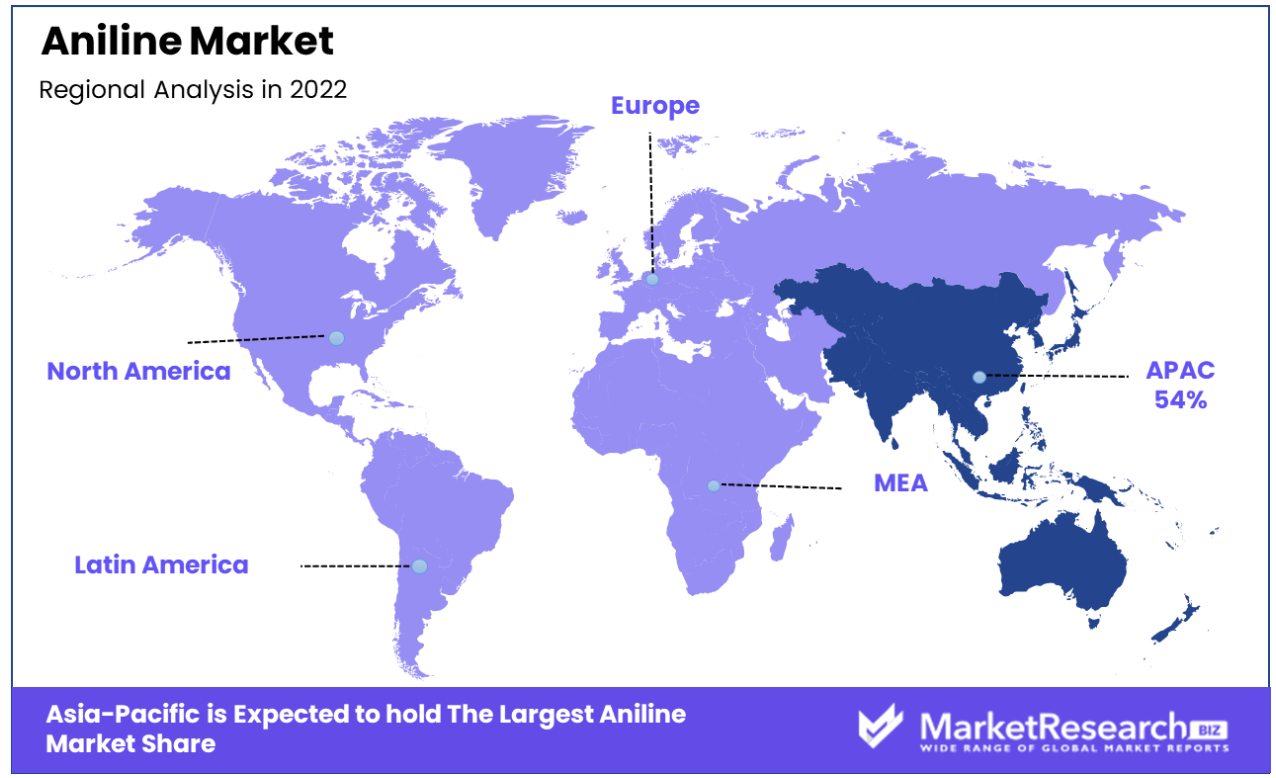
Europe holds a significant share of the aniline market, driven by its advanced manufacturing capabilities and stringent environmental regulations. The region's focus on sustainable practices has led to the development of eco-friendly aniline production methods. Europe's diverse industrial base, encompassing automotive, pharmaceutical, and aerospace sectors, necessitates a steady supply of aniline, underpinning its market position. Companies like Bayer AG and LANXESS play a pivotal role in the European aniline market, contributing to its innovative and compliant industry practices.
North America, This region's market share is bolstered by its advanced chemical industry, high technological adoption, and stringent safety regulations. The presence of major corporations like Dow Chemical Company and Huntsman Corporation underscores the region's commitment to innovation in chemical manufacturing. North America's stringent regulatory landscape ensures that aniline production aligns with environmental and health standards, thereby maintaining market integrity and consumer trust.
Aniline Industry by Region
North America
- The US
- Canada
Europe
- Germany
- France
- The UK
- Spain
- Italy
- Russia
- Netherlands
- Rest of Europe
Asia-Pacific
- China
- Japan
- South Korea
- India
- New Zealand
- Singapore
- Thailand
- Vietnam
- Rest of Asia Pacific
Latin America
- Brazil
- Mexico
- Rest of Latin America
Middle East & Africa
- South Africa
- Saudi Arabia
- UAE
- Rest of the Middle East & Africa
Aniline Market Key Player Analysis
The mentioned companies range from large multinational corporations to specialized chemical manufacturers. They play pivotal roles in shaping market trends through their innovative production techniques, expansive product portfolios, and strategic market positioning.
The prominent players include Sinopec from Asia-Pacific and BASF Corporation from Europe, exemplifying the diversity and global reach of this sector. Sinopec Corp., a Chinese giant, is renowned for its expansive production capabilities and market influence in Asia, while Germany's BASF Corporation stands as a beacon of innovation and sustainability in the European chemical industry. These companies, among others, are instrumental in shaping the global aniline market dynamics through their regional dominance and global strategies.
Aniline Industry Key Players
- BASF Corporation
- Sinopec Corp.
- Huntsman International LLC
- Mitsubishi Chemical Corporation
- Covestro AG
- Jilin Connell Chemical Industry Co. Ltd
- Wanhua Chemical Group Co. Ltd
- Shandong Jinling Chemical Co., Ltd
- Yantai Wanhua Polyurethane Co Ltd, DuPont
- Mitsubishi Chemical Corporation
- Sumitomo Chemical
- Arrow Chemical Group
- EMCO Dyestuff
- GNFC
- Narmada Chematur Petrochemicals Limited
- Tosoh Corporation
- Volzhsky Orgsintez JSC
- Ei Dupont De Nemours
Recent Development
- In 2022, a team of researchers from the University of California, Berkeley developed a new method for producing aniline from biomass. The method uses a catalytic process to convert sugars from biomass into aniline in high yields.
- In January 2022, Maire Tecnimont's subsidiary, Tecnimont, secured a €250 million EPC contract from Covestro to build a new aniline plant in Antwerp, Belgium. The project will boost aniline production at Covestro's Antwerp site, focusing on high-tech polymer materials and sustainable solutions. Completion is expected by 2024, featuring cutting-edge technologies for safety and energy efficiency.
- In 2022, A team of researchers at the Chinese Academy of Sciences discovered how to use lithium hydride to facilitate the hydrogenolysis of anilines to arenes. This work provides a new strategy for C-N bond activation and may help the design and development of new materials or catalysts for HDN as well as other important chemical transformations.
Report Scope
Report Features Description Market Value (2022) USD 13.5 Billion Forecast Revenue (2032) USD 29.4 Billion CAGR (2023-2032) 8.3% Base Year for Estimation 2022 Historic Period 2016-2022 Forecast Period 2023-2032 Report Coverage Revenue Forecast, Market Dynamics, COVID-19 Impact, Competitive Landscape, Recent Developments Segments Covered By Technology(Vapour-Phase Process, Liquid-Phase Process), By Application(Methylene Diphenyl Diisocyanate (MDI) Production, Rubber-processing Chemicals, Agricultural Chemicals, Dye and Pigment, Specialty Fiber), By End-use Industry(Building & Construction, Rubber Products, Consumer Goods, Automotive, Packaging, Agriculture) Regional Analysis North America - The US, Canada, Europe - Germany, France, The UK, Spain, Italy, Russia, Netherlands, Rest of Europe, Asia-Pacific - China, Japan, South Korea, India, New Zealand, Singapore, Thailand, Vietnam, Rest of Asia Pacific, Latin America - Brazil, Mexico, Rest of Latin America, Middle East & Africa - South Africa, Saudi Arabia, UAE, Rest of Middle East & Africa Competitive Landscape BASF Corporation, Sinopec Corp., Huntsman International LLC, Mitsubishi Chemical Corporation, Covestro AG, Jilin Connell Chemical Industry Co. Ltd, Wanhua Chemical Group Co. Ltd, Shandong Jinling Chemical Co., Ltd, Yantai Wanhua Polyurethane Co Ltd, DuPont, Mitsubishi Chemical Corporation, Sumitomo Chemical, Arrow Chemical Group, EMCO Dyestuff, GNFC, Narmada Chematur Petrochemicals Limited, Tosoh Corporation, Volzhsky Orgsintez JSC, Ei Dupont De Nemours Customization Scope Customization for segments, region/country-level will be provided. Moreover, additional customization can be done based on the requirements. Purchase Options We have three licenses to opt for Single User License, Multi-User License (Up to 5 Users), Corporate Use License (Unlimited User and Printable PDF) -
- 1. Executive Summary
- 1.1. Definition
- 1.2. Taxonomy
- 1.3. Research Scope
- 1.4. Key Analysis
- 1.5. Key Findings by Major Segments
- 1.6. Top strategies by Major Players
- 2. Global Aniline Market Overview
- 2.1. Aniline Market Dynamics
- 2.1.1. Drivers
- 2.1.2. Opportunities
- 2.1.3. Restraints
- 2.1.4. Challenges
- 2.2. Macro-economic Factors
- 2.3. Regulatory Framework
- 2.4. Market Investment Feasibility Index
- 2.5. PEST Analysis
- 2.6. PORTER’S Five Force Analysis
- 2.7. Drivers & Restraints Impact Analysis
- 2.8. Industry Chain Analysis
- 2.9. Cost Structure Analysis
- 2.10. Marketing Strategy
- 2.11. Russia-Ukraine War Impact Analysis
- 2.12. Opportunity Map Analysis
- 2.13. Market Competition Scenario Analysis
- 2.14. Product Life Cycle Analysis
- 2.15. Opportunity Orbits
- 2.16. Manufacturer Intensity Map
- 2.17. Major Companies sales by Value & Volume
- 2.1. Aniline Market Dynamics
- 3. Global Aniline Market Analysis, Opportunity and Forecast, 2016-2032
- 3.1. Global Aniline Market Analysis, 2016-2021
- 3.2. Global Aniline Market Opportunity and Forecast, 2023-2032
- 3.3. Global Aniline Market Analysis, Opportunity and Forecast, By Technology, 2016-2032
- 3.3.1. Global Aniline Market Analysis by Technology: Introduction
- 3.3.2. Market Size Absolute $ Opportunity Analysis and Forecast, By Technology, 2016-2032
- 3.3.3. Vapour-Phase Process
- 3.3.4. Liquid-Phase Process
- 3.4. Global Aniline Market Analysis, Opportunity and Forecast, By Application, 2016-2032
- 3.4.1. Global Aniline Market Analysis by Application: Introduction
- 3.4.2. Market Size Absolute $ Opportunity Analysis and Forecast, By Application, 2016-2032
- 3.4.3. Methylene Diphenyl Diisocyanate (MDI) Production
- 3.4.4. Rubber-processing Chemicals
- 3.4.5. Agricultural Chemicals
- 3.4.6. Dye and Pigment
- 3.4.7. Specialty Fiber
- 3.5. Global Aniline Market Analysis, Opportunity and Forecast, By End-use Industry, 2016-2032
- 3.5.1. Global Aniline Market Analysis by End-use Industry: Introduction
- 3.5.2. Market Size Absolute $ Opportunity Analysis and Forecast, By End-use Industry, 2016-2032
- 3.5.3. Building & Construction
- 3.5.4. Rubber Products
- 3.5.5. Consumer Goods
- 3.5.6. Automotive
- 3.5.7. Packaging
- 3.5.8. Agriculture
- 4. North America Aniline Market Analysis, Opportunity and Forecast, 2016-2032
- 4.1. North America Aniline Market Analysis, 2016-2021
- 4.2. North America Aniline Market Opportunity and Forecast, 2023-2032
- 4.3. North America Aniline Market Analysis, Opportunity and Forecast, By Technology, 2016-2032
- 4.3.1. North America Aniline Market Analysis by Technology: Introduction
- 4.3.2. Market Size Absolute $ Opportunity Analysis and Forecast, By Technology, 2016-2032
- 4.3.3. Vapour-Phase Process
- 4.3.4. Liquid-Phase Process
- 4.4. North America Aniline Market Analysis, Opportunity and Forecast, By Application, 2016-2032
- 4.4.1. North America Aniline Market Analysis by Application: Introduction
- 4.4.2. Market Size Absolute $ Opportunity Analysis and Forecast, By Application, 2016-2032
- 4.4.3. Methylene Diphenyl Diisocyanate (MDI) Production
- 4.4.4. Rubber-processing Chemicals
- 4.4.5. Agricultural Chemicals
- 4.4.6. Dye and Pigment
- 4.4.7. Specialty Fiber
- 4.5. North America Aniline Market Analysis, Opportunity and Forecast, By End-use Industry, 2016-2032
- 4.5.1. North America Aniline Market Analysis by End-use Industry: Introduction
- 4.5.2. Market Size Absolute $ Opportunity Analysis and Forecast, By End-use Industry, 2016-2032
- 4.5.3. Building & Construction
- 4.5.4. Rubber Products
- 4.5.5. Consumer Goods
- 4.5.6. Automotive
- 4.5.7. Packaging
- 4.5.8. Agriculture
- 4.6. North America Aniline Market Analysis, Opportunity and Forecast, By Country , 2016-2032
- 4.6.1. North America Aniline Market Analysis by Country : Introduction
- 4.6.2. Market Size Absolute $ Opportunity Analysis and Forecast, Country , 2016-2032
- 4.6.2.1. The US
- 4.6.2.2. Canada
- 4.6.2.3. Mexico
- 5. Western Europe Aniline Market Analysis, Opportunity and Forecast, 2016-2032
- 5.1. Western Europe Aniline Market Analysis, 2016-2021
- 5.2. Western Europe Aniline Market Opportunity and Forecast, 2023-2032
- 5.3. Western Europe Aniline Market Analysis, Opportunity and Forecast, By Technology, 2016-2032
- 5.3.1. Western Europe Aniline Market Analysis by Technology: Introduction
- 5.3.2. Market Size Absolute $ Opportunity Analysis and Forecast, By Technology, 2016-2032
- 5.3.3. Vapour-Phase Process
- 5.3.4. Liquid-Phase Process
- 5.4. Western Europe Aniline Market Analysis, Opportunity and Forecast, By Application, 2016-2032
- 5.4.1. Western Europe Aniline Market Analysis by Application: Introduction
- 5.4.2. Market Size Absolute $ Opportunity Analysis and Forecast, By Application, 2016-2032
- 5.4.3. Methylene Diphenyl Diisocyanate (MDI) Production
- 5.4.4. Rubber-processing Chemicals
- 5.4.5. Agricultural Chemicals
- 5.4.6. Dye and Pigment
- 5.4.7. Specialty Fiber
- 5.5. Western Europe Aniline Market Analysis, Opportunity and Forecast, By End-use Industry, 2016-2032
- 5.5.1. Western Europe Aniline Market Analysis by End-use Industry: Introduction
- 5.5.2. Market Size Absolute $ Opportunity Analysis and Forecast, By End-use Industry, 2016-2032
- 5.5.3. Building & Construction
- 5.5.4. Rubber Products
- 5.5.5. Consumer Goods
- 5.5.6. Automotive
- 5.5.7. Packaging
- 5.5.8. Agriculture
- 5.6. Western Europe Aniline Market Analysis, Opportunity and Forecast, By Country , 2016-2032
- 5.6.1. Western Europe Aniline Market Analysis by Country : Introduction
- 5.6.2. Market Size Absolute $ Opportunity Analysis and Forecast, Country , 2016-2032
- 5.6.2.1. Germany
- 5.6.2.2. France
- 5.6.2.3. The UK
- 5.6.2.4. Spain
- 5.6.2.5. Italy
- 5.6.2.6. Portugal
- 5.6.2.7. Ireland
- 5.6.2.8. Austria
- 5.6.2.9. Switzerland
- 5.6.2.10. Benelux
- 5.6.2.11. Nordic
- 5.6.2.12. Rest of Western Europe
- 6. Eastern Europe Aniline Market Analysis, Opportunity and Forecast, 2016-2032
- 6.1. Eastern Europe Aniline Market Analysis, 2016-2021
- 6.2. Eastern Europe Aniline Market Opportunity and Forecast, 2023-2032
- 6.3. Eastern Europe Aniline Market Analysis, Opportunity and Forecast, By Technology, 2016-2032
- 6.3.1. Eastern Europe Aniline Market Analysis by Technology: Introduction
- 6.3.2. Market Size Absolute $ Opportunity Analysis and Forecast, By Technology, 2016-2032
- 6.3.3. Vapour-Phase Process
- 6.3.4. Liquid-Phase Process
- 6.4. Eastern Europe Aniline Market Analysis, Opportunity and Forecast, By Application, 2016-2032
- 6.4.1. Eastern Europe Aniline Market Analysis by Application: Introduction
- 6.4.2. Market Size Absolute $ Opportunity Analysis and Forecast, By Application, 2016-2032
- 6.4.3. Methylene Diphenyl Diisocyanate (MDI) Production
- 6.4.4. Rubber-processing Chemicals
- 6.4.5. Agricultural Chemicals
- 6.4.6. Dye and Pigment
- 6.4.7. Specialty Fiber
- 6.5. Eastern Europe Aniline Market Analysis, Opportunity and Forecast, By End-use Industry, 2016-2032
- 6.5.1. Eastern Europe Aniline Market Analysis by End-use Industry: Introduction
- 6.5.2. Market Size Absolute $ Opportunity Analysis and Forecast, By End-use Industry, 2016-2032
- 6.5.3. Building & Construction
- 6.5.4. Rubber Products
- 6.5.5. Consumer Goods
- 6.5.6. Automotive
- 6.5.7. Packaging
- 6.5.8. Agriculture
- 6.6. Eastern Europe Aniline Market Analysis, Opportunity and Forecast, By Country , 2016-2032
- 6.6.1. Eastern Europe Aniline Market Analysis by Country : Introduction
- 6.6.2. Market Size Absolute $ Opportunity Analysis and Forecast, Country , 2016-2032
- 6.6.2.1. Russia
- 6.6.2.2. Poland
- 6.6.2.3. The Czech Republic
- 6.6.2.4. Greece
- 6.6.2.5. Rest of Eastern Europe
- 7. APAC Aniline Market Analysis, Opportunity and Forecast, 2016-2032
- 7.1. APAC Aniline Market Analysis, 2016-2021
- 7.2. APAC Aniline Market Opportunity and Forecast, 2023-2032
- 7.3. APAC Aniline Market Analysis, Opportunity and Forecast, By Technology, 2016-2032
- 7.3.1. APAC Aniline Market Analysis by Technology: Introduction
- 7.3.2. Market Size Absolute $ Opportunity Analysis and Forecast, By Technology, 2016-2032
- 7.3.3. Vapour-Phase Process
- 7.3.4. Liquid-Phase Process
- 7.4. APAC Aniline Market Analysis, Opportunity and Forecast, By Application, 2016-2032
- 7.4.1. APAC Aniline Market Analysis by Application: Introduction
- 7.4.2. Market Size Absolute $ Opportunity Analysis and Forecast, By Application, 2016-2032
- 7.4.3. Methylene Diphenyl Diisocyanate (MDI) Production
- 7.4.4. Rubber-processing Chemicals
- 7.4.5. Agricultural Chemicals
- 7.4.6. Dye and Pigment
- 7.4.7. Specialty Fiber
- 7.5. APAC Aniline Market Analysis, Opportunity and Forecast, By End-use Industry, 2016-2032
- 7.5.1. APAC Aniline Market Analysis by End-use Industry: Introduction
- 7.5.2. Market Size Absolute $ Opportunity Analysis and Forecast, By End-use Industry, 2016-2032
- 7.5.3. Building & Construction
- 7.5.4. Rubber Products
- 7.5.5. Consumer Goods
- 7.5.6. Automotive
- 7.5.7. Packaging
- 7.5.8. Agriculture
- 7.6. APAC Aniline Market Analysis, Opportunity and Forecast, By Country , 2016-2032
- 7.6.1. APAC Aniline Market Analysis by Country : Introduction
- 7.6.2. Market Size Absolute $ Opportunity Analysis and Forecast, Country , 2016-2032
- 7.6.2.1. China
- 7.6.2.2. Japan
- 7.6.2.3. South Korea
- 7.6.2.4. India
- 7.6.2.5. Australia & New Zeland
- 7.6.2.6. Indonesia
- 7.6.2.7. Malaysia
- 7.6.2.8. Philippines
- 7.6.2.9. Singapore
- 7.6.2.10. Thailand
- 7.6.2.11. Vietnam
- 7.6.2.12. Rest of APAC
- 8. Latin America Aniline Market Analysis, Opportunity and Forecast, 2016-2032
- 8.1. Latin America Aniline Market Analysis, 2016-2021
- 8.2. Latin America Aniline Market Opportunity and Forecast, 2023-2032
- 8.3. Latin America Aniline Market Analysis, Opportunity and Forecast, By Technology, 2016-2032
- 8.3.1. Latin America Aniline Market Analysis by Technology: Introduction
- 8.3.2. Market Size Absolute $ Opportunity Analysis and Forecast, By Technology, 2016-2032
- 8.3.3. Vapour-Phase Process
- 8.3.4. Liquid-Phase Process
- 8.4. Latin America Aniline Market Analysis, Opportunity and Forecast, By Application, 2016-2032
- 8.4.1. Latin America Aniline Market Analysis by Application: Introduction
- 8.4.2. Market Size Absolute $ Opportunity Analysis and Forecast, By Application, 2016-2032
- 8.4.3. Methylene Diphenyl Diisocyanate (MDI) Production
- 8.4.4. Rubber-processing Chemicals
- 8.4.5. Agricultural Chemicals
- 8.4.6. Dye and Pigment
- 8.4.7. Specialty Fiber
- 8.5. Latin America Aniline Market Analysis, Opportunity and Forecast, By End-use Industry, 2016-2032
- 8.5.1. Latin America Aniline Market Analysis by End-use Industry: Introduction
- 8.5.2. Market Size Absolute $ Opportunity Analysis and Forecast, By End-use Industry, 2016-2032
- 8.5.3. Building & Construction
- 8.5.4. Rubber Products
- 8.5.5. Consumer Goods
- 8.5.6. Automotive
- 8.5.7. Packaging
- 8.5.8. Agriculture
- 8.6. Latin America Aniline Market Analysis, Opportunity and Forecast, By Country , 2016-2032
- 8.6.1. Latin America Aniline Market Analysis by Country : Introduction
- 8.6.2. Market Size Absolute $ Opportunity Analysis and Forecast, Country , 2016-2032
- 8.6.2.1. Brazil
- 8.6.2.2. Colombia
- 8.6.2.3. Chile
- 8.6.2.4. Argentina
- 8.6.2.5. Costa Rica
- 8.6.2.6. Rest of Latin America
- 9. Middle East & Africa Aniline Market Analysis, Opportunity and Forecast, 2016-2032
- 9.1. Middle East & Africa Aniline Market Analysis, 2016-2021
- 9.2. Middle East & Africa Aniline Market Opportunity and Forecast, 2023-2032
- 9.3. Middle East & Africa Aniline Market Analysis, Opportunity and Forecast, By Technology, 2016-2032
- 9.3.1. Middle East & Africa Aniline Market Analysis by Technology: Introduction
- 9.3.2. Market Size Absolute $ Opportunity Analysis and Forecast, By Technology, 2016-2032
- 9.3.3. Vapour-Phase Process
- 9.3.4. Liquid-Phase Process
- 9.4. Middle East & Africa Aniline Market Analysis, Opportunity and Forecast, By Application, 2016-2032
- 9.4.1. Middle East & Africa Aniline Market Analysis by Application: Introduction
- 9.4.2. Market Size Absolute $ Opportunity Analysis and Forecast, By Application, 2016-2032
- 9.4.3. Methylene Diphenyl Diisocyanate (MDI) Production
- 9.4.4. Rubber-processing Chemicals
- 9.4.5. Agricultural Chemicals
- 9.4.6. Dye and Pigment
- 9.4.7. Specialty Fiber
- 9.5. Middle East & Africa Aniline Market Analysis, Opportunity and Forecast, By End-use Industry, 2016-2032
- 9.5.1. Middle East & Africa Aniline Market Analysis by End-use Industry: Introduction
- 9.5.2. Market Size Absolute $ Opportunity Analysis and Forecast, By End-use Industry, 2016-2032
- 9.5.3. Building & Construction
- 9.5.4. Rubber Products
- 9.5.5. Consumer Goods
- 9.5.6. Automotive
- 9.5.7. Packaging
- 9.5.8. Agriculture
- 9.6. Middle East & Africa Aniline Market Analysis, Opportunity and Forecast, By Country , 2016-2032
- 9.6.1. Middle East & Africa Aniline Market Analysis by Country : Introduction
- 9.6.2. Market Size Absolute $ Opportunity Analysis and Forecast, Country , 2016-2032
- 9.6.2.1. Algeria
- 9.6.2.2. Egypt
- 9.6.2.3. Israel
- 9.6.2.4. Kuwait
- 9.6.2.5. Nigeria
- 9.6.2.6. Saudi Arabia
- 9.6.2.7. South Africa
- 9.6.2.8. Turkey
- 9.6.2.9. The UAE
- 9.6.2.10. Rest of MEA
- 10. Global Aniline Market Analysis, Opportunity and Forecast, By Region , 2016-2032
- 10.1. Global Aniline Market Analysis by Region : Introduction
- 10.2. Market Size Absolute $ Opportunity Analysis and Forecast, By Region , 2016-2032
- 10.2.1. North America
- 10.2.2. Western Europe
- 10.2.3. Eastern Europe
- 10.2.4. APAC
- 10.2.5. Latin America
- 10.2.6. Middle East & Africa
- 11. Global Aniline Market Competitive Landscape, Market Share Analysis, and Company Profiles
- 11.1. Market Share Analysis
- 11.2. Company Profiles
- 11.3. BASF SE
- 11.3.1. Company Overview
- 11.3.2. Financial Highlights
- 11.3.3. Product Portfolio
- 11.3.4. SWOT Analysis
- 11.3.5. Key Strategies and Developments
- 11.4. Huntsman Corporation LLC
- 11.4.1. Company Overview
- 11.4.2. Financial Highlights
- 11.4.3. Product Portfolio
- 11.4.4. SWOT Analysis
- 11.4.5. Key Strategies and Developments
- 11.5. Mitsui Chemical
- 11.5.1. Company Overview
- 11.5.2. Financial Highlights
- 11.5.3. Product Portfolio
- 11.5.4. SWOT Analysis
- 11.5.5. Key Strategies and Developments
-
- 11.6.1. Company Overview
- 11.6.2. Financial Highlights
- 11.6.3. Product Portfolio
- 11.6.4. SWOT Analysis
- 11.6.5. Key Strategies and Developments
- 11.7. Covestro AG
- 11.7.1. Company Overview
- 11.7.2. Financial Highlights
- 11.7.3. Product Portfolio
- 11.7.4. SWOT Analysis
- 11.7.5. Key Strategies and Developments
- 11.8. Jilin Connell Chemical Industry Co., Ltd.
- 11.8.1. Company Overview
- 11.8.2. Financial Highlights
- 11.8.3. Product Portfolio
- 11.8.4. SWOT Analysis
- 11.8.5. Key Strategies and Developments
- 11.9. Wanhua Chemical Group Co. Ltd
- 11.9.1. Company Overview
- 11.9.2. Financial Highlights
- 11.9.3. Product Portfolio
- 11.9.4. SWOT Analysis
- 11.9.5. Key Strategies and Developments
- 11.10. Sinopec Nanjing Chemical Industries Co., Ltd
- 11.10.1. Company Overview
- 11.10.2. Financial Highlights
- 11.10.3. Product Portfolio
- 11.10.4. SWOT Analysis
- 11.10.5. Key Strategies and Developments
- 11.11.1. Company Overview
- 11.11.2. Financial Highlights
- 11.11.3. Product Portfolio
- 11.11.4. SWOT Analysis
- 11.11.5. Key Strategies and Developments
- 11.12. Yantai Wanhua Polyurethane Co Ltd
- 11.12.1. Company Overview
- 11.12.2. Financial Highlights
- 11.12.3. Product Portfolio
- 11.12.4. SWOT Analysis
- 11.12.5. Key Strategies and Developments
- 11.13.1. Company Overview
- 11.13.2. Financial Highlights
- 11.13.3. Product Portfolio
- 11.13.4. SWOT Analysis
- 11.13.5. Key Strategies and Developments
- 11.14. DuPont
- 11.14.1. Company Overview
- 11.14.2. Financial Highlights
- 11.14.3. Product Portfolio
- 11.14.4. SWOT Analysis
- 11.14.5. Key Strategies and Developments
- 11.15. Mitsubishi Chemicals
- 11.15.1. Company Overview
- 11.15.2. Financial Highlights
- 11.15.3. Product Portfolio
- 11.15.4. SWOT Analysis
- 11.15.5. Key Strategies and Developments
- 11.16. Hindustan Organics Chemicals Limited
- 11.16.1. Company Overview
- 11.16.2. Financial Highlights
- 11.16.3. Product Portfolio
- 11.16.4. SWOT Analysis
- 11.16.5. Key Strategies and Developments
- 11.17. Sumitomo Chemical
- 11.17.1. Company Overview
- 11.17.2. Financial Highlights
- 11.17.3. Product Portfolio
- 11.17.4. SWOT Analysis
- 11.17.5. Key Strategies and Developments
- 11.18. Arrow Chemical Group
- 11.18.1. Company Overview
- 11.18.2. Financial Highlights
- 11.18.3. Product Portfolio
- 11.18.4. SWOT Analysis
- 11.18.5. Key Strategies and Developments
- 11.19. EMCO Dyestuff
- 11.19.1. Company Overview
- 11.19.2. Financial Highlights
- 11.19.3. Product Portfolio
- 11.19.4. SWOT Analysis
- 11.19.5. Key Strategies and Developments
- 11.20. GNFC
- 11.20.1. Company Overview
- 11.20.2. Financial Highlights
- 11.20.3. Product Portfolio
- 11.20.4. SWOT Analysis
- 11.20.5. Key Strategies and Developments
- 11.21. Tosoh Corporation
- 11.21.1. Company Overview
- 11.21.2. Financial Highlights
- 11.21.3. Product Portfolio
- 11.21.4. SWOT Analysis
- 11.21.5. Key Strategies and Developments
- 11.22. Hindustan Organic Chemicals
- 11.22.1. Company Overview
- 11.22.2. Financial Highlights
- 11.22.3. Product Portfolio
- 11.22.4. SWOT Analysis
- 11.22.5. Key Strategies and Developments
- 12. Assumptions and Acronyms
- 13. Research Methodology
- 14. Contact
"
- List of Figures
- "
- Figure 1: Global Aniline Market Revenue (US$ Mn) Market Share by Technology in 2022
- Figure 2: Global Aniline Market Market Attractiveness Analysis by Technology, 2016-2032
- Figure 3: Global Aniline Market Revenue (US$ Mn) Market Share by Applicationin 2022
- Figure 4: Global Aniline Market Market Attractiveness Analysis by Application, 2016-2032
- Figure 5: Global Aniline Market Revenue (US$ Mn) Market Share by End-use Industryin 2022
- Figure 6: Global Aniline Market Market Attractiveness Analysis by End-use Industry, 2016-2032
- Figure 7: Global Aniline Market Revenue (US$ Mn) Market Share by Region in 2022
- Figure 8: Global Aniline Market Market Attractiveness Analysis by Region, 2016-2032
- Figure 9: Global Aniline Market Market Revenue (US$ Mn) (2016-2032)
- Figure 10: Global Aniline Market Market Revenue (US$ Mn) Comparison by Region (2016-2032)
- Figure 11: Global Aniline Market Market Revenue (US$ Mn) Comparison by Technology (2016-2032)
- Figure 12: Global Aniline Market Market Revenue (US$ Mn) Comparison by Application (2016-2032)
- Figure 13: Global Aniline Market Market Revenue (US$ Mn) Comparison by End-use Industry (2016-2032)
- Figure 14: Global Aniline Market Market Y-o-Y Growth Rate Comparison by Region (2016-2032)
- Figure 15: Global Aniline Market Market Y-o-Y Growth Rate Comparison by Technology (2016-2032)
- Figure 16: Global Aniline Market Market Y-o-Y Growth Rate Comparison by Application (2016-2032)
- Figure 17: Global Aniline Market Market Y-o-Y Growth Rate Comparison by End-use Industry (2016-2032)
- Figure 18: Global Aniline Market Market Share Comparison by Region (2016-2032)
- Figure 19: Global Aniline Market Market Share Comparison by Technology (2016-2032)
- Figure 20: Global Aniline Market Market Share Comparison by Application (2016-2032)
- Figure 21: Global Aniline Market Market Share Comparison by End-use Industry (2016-2032)
- Figure 22: North America Aniline Market Revenue (US$ Mn) Market Share by Technologyin 2022
- Figure 23: North America Aniline Market Market Attractiveness Analysis by Technology, 2016-2032
- Figure 24: North America Aniline Market Revenue (US$ Mn) Market Share by Applicationin 2022
- Figure 25: North America Aniline Market Market Attractiveness Analysis by Application, 2016-2032
- Figure 26: North America Aniline Market Revenue (US$ Mn) Market Share by End-use Industryin 2022
- Figure 27: North America Aniline Market Market Attractiveness Analysis by End-use Industry, 2016-2032
- Figure 28: North America Aniline Market Revenue (US$ Mn) Market Share by Country in 2022
- Figure 29: North America Aniline Market Market Attractiveness Analysis by Country, 2016-2032
- Figure 30: North America Aniline Market Market Revenue (US$ Mn) (2016-2032)
- Figure 31: North America Aniline Market Market Revenue (US$ Mn) Comparison by Country (2016-2032)
- Figure 32: North America Aniline Market Market Revenue (US$ Mn) Comparison by Technology (2016-2032)
- Figure 33: North America Aniline Market Market Revenue (US$ Mn) Comparison by Application (2016-2032)
- Figure 34: North America Aniline Market Market Revenue (US$ Mn) Comparison by End-use Industry (2016-2032)
- Figure 35: North America Aniline Market Market Y-o-Y Growth Rate Comparison by Country (2016-2032)
- Figure 36: North America Aniline Market Market Y-o-Y Growth Rate Comparison by Technology (2016-2032)
- Figure 37: North America Aniline Market Market Y-o-Y Growth Rate Comparison by Application (2016-2032)
- Figure 38: North America Aniline Market Market Y-o-Y Growth Rate Comparison by End-use Industry (2016-2032)
- Figure 39: North America Aniline Market Market Share Comparison by Country (2016-2032)
- Figure 40: North America Aniline Market Market Share Comparison by Technology (2016-2032)
- Figure 41: North America Aniline Market Market Share Comparison by Application (2016-2032)
- Figure 42: North America Aniline Market Market Share Comparison by End-use Industry (2016-2032)
- Figure 43: Western Europe Aniline Market Revenue (US$ Mn) Market Share by Technologyin 2022
- Figure 44: Western Europe Aniline Market Market Attractiveness Analysis by Technology, 2016-2032
- Figure 45: Western Europe Aniline Market Revenue (US$ Mn) Market Share by Applicationin 2022
- Figure 46: Western Europe Aniline Market Market Attractiveness Analysis by Application, 2016-2032
- Figure 47: Western Europe Aniline Market Revenue (US$ Mn) Market Share by End-use Industryin 2022
- Figure 48: Western Europe Aniline Market Market Attractiveness Analysis by End-use Industry, 2016-2032
- Figure 49: Western Europe Aniline Market Revenue (US$ Mn) Market Share by Country in 2022
- Figure 50: Western Europe Aniline Market Market Attractiveness Analysis by Country, 2016-2032
- Figure 51: Western Europe Aniline Market Market Revenue (US$ Mn) (2016-2032)
- Figure 52: Western Europe Aniline Market Market Revenue (US$ Mn) Comparison by Country (2016-2032)
- Figure 53: Western Europe Aniline Market Market Revenue (US$ Mn) Comparison by Technology (2016-2032)
- Figure 54: Western Europe Aniline Market Market Revenue (US$ Mn) Comparison by Application (2016-2032)
- Figure 55: Western Europe Aniline Market Market Revenue (US$ Mn) Comparison by End-use Industry (2016-2032)
- Figure 56: Western Europe Aniline Market Market Y-o-Y Growth Rate Comparison by Country (2016-2032)
- Figure 57: Western Europe Aniline Market Market Y-o-Y Growth Rate Comparison by Technology (2016-2032)
- Figure 58: Western Europe Aniline Market Market Y-o-Y Growth Rate Comparison by Application (2016-2032)
- Figure 59: Western Europe Aniline Market Market Y-o-Y Growth Rate Comparison by End-use Industry (2016-2032)
- Figure 60: Western Europe Aniline Market Market Share Comparison by Country (2016-2032)
- Figure 61: Western Europe Aniline Market Market Share Comparison by Technology (2016-2032)
- Figure 62: Western Europe Aniline Market Market Share Comparison by Application (2016-2032)
- Figure 63: Western Europe Aniline Market Market Share Comparison by End-use Industry (2016-2032)
- Figure 64: Eastern Europe Aniline Market Revenue (US$ Mn) Market Share by Technologyin 2022
- Figure 65: Eastern Europe Aniline Market Market Attractiveness Analysis by Technology, 2016-2032
- Figure 66: Eastern Europe Aniline Market Revenue (US$ Mn) Market Share by Applicationin 2022
- Figure 67: Eastern Europe Aniline Market Market Attractiveness Analysis by Application, 2016-2032
- Figure 68: Eastern Europe Aniline Market Revenue (US$ Mn) Market Share by End-use Industryin 2022
- Figure 69: Eastern Europe Aniline Market Market Attractiveness Analysis by End-use Industry, 2016-2032
- Figure 70: Eastern Europe Aniline Market Revenue (US$ Mn) Market Share by Country in 2022
- Figure 71: Eastern Europe Aniline Market Market Attractiveness Analysis by Country, 2016-2032
- Figure 72: Eastern Europe Aniline Market Market Revenue (US$ Mn) (2016-2032)
- Figure 73: Eastern Europe Aniline Market Market Revenue (US$ Mn) Comparison by Country (2016-2032)
- Figure 74: Eastern Europe Aniline Market Market Revenue (US$ Mn) Comparison by Technology (2016-2032)
- Figure 75: Eastern Europe Aniline Market Market Revenue (US$ Mn) Comparison by Application (2016-2032)
- Figure 76: Eastern Europe Aniline Market Market Revenue (US$ Mn) Comparison by End-use Industry (2016-2032)
- Figure 77: Eastern Europe Aniline Market Market Y-o-Y Growth Rate Comparison by Country (2016-2032)
- Figure 78: Eastern Europe Aniline Market Market Y-o-Y Growth Rate Comparison by Technology (2016-2032)
- Figure 79: Eastern Europe Aniline Market Market Y-o-Y Growth Rate Comparison by Application (2016-2032)
- Figure 80: Eastern Europe Aniline Market Market Y-o-Y Growth Rate Comparison by End-use Industry (2016-2032)
- Figure 81: Eastern Europe Aniline Market Market Share Comparison by Country (2016-2032)
- Figure 82: Eastern Europe Aniline Market Market Share Comparison by Technology (2016-2032)
- Figure 83: Eastern Europe Aniline Market Market Share Comparison by Application (2016-2032)
- Figure 84: Eastern Europe Aniline Market Market Share Comparison by End-use Industry (2016-2032)
- Figure 85: APAC Aniline Market Revenue (US$ Mn) Market Share by Technologyin 2022
- Figure 86: APAC Aniline Market Market Attractiveness Analysis by Technology, 2016-2032
- Figure 87: APAC Aniline Market Revenue (US$ Mn) Market Share by Applicationin 2022
- Figure 88: APAC Aniline Market Market Attractiveness Analysis by Application, 2016-2032
- Figure 89: APAC Aniline Market Revenue (US$ Mn) Market Share by End-use Industryin 2022
- Figure 90: APAC Aniline Market Market Attractiveness Analysis by End-use Industry, 2016-2032
- Figure 91: APAC Aniline Market Revenue (US$ Mn) Market Share by Country in 2022
- Figure 92: APAC Aniline Market Market Attractiveness Analysis by Country, 2016-2032
- Figure 93: APAC Aniline Market Market Revenue (US$ Mn) (2016-2032)
- Figure 94: APAC Aniline Market Market Revenue (US$ Mn) Comparison by Country (2016-2032)
- Figure 95: APAC Aniline Market Market Revenue (US$ Mn) Comparison by Technology (2016-2032)
- Figure 96: APAC Aniline Market Market Revenue (US$ Mn) Comparison by Application (2016-2032)
- Figure 97: APAC Aniline Market Market Revenue (US$ Mn) Comparison by End-use Industry (2016-2032)
- Figure 98: APAC Aniline Market Market Y-o-Y Growth Rate Comparison by Country (2016-2032)
- Figure 99: APAC Aniline Market Market Y-o-Y Growth Rate Comparison by Technology (2016-2032)
- Figure 100: APAC Aniline Market Market Y-o-Y Growth Rate Comparison by Application (2016-2032)
- Figure 101: APAC Aniline Market Market Y-o-Y Growth Rate Comparison by End-use Industry (2016-2032)
- Figure 102: APAC Aniline Market Market Share Comparison by Country (2016-2032)
- Figure 103: APAC Aniline Market Market Share Comparison by Technology (2016-2032)
- Figure 104: APAC Aniline Market Market Share Comparison by Application (2016-2032)
- Figure 105: APAC Aniline Market Market Share Comparison by End-use Industry (2016-2032)
- Figure 106: Latin America Aniline Market Revenue (US$ Mn) Market Share by Technologyin 2022
- Figure 107: Latin America Aniline Market Market Attractiveness Analysis by Technology, 2016-2032
- Figure 108: Latin America Aniline Market Revenue (US$ Mn) Market Share by Applicationin 2022
- Figure 109: Latin America Aniline Market Market Attractiveness Analysis by Application, 2016-2032
- Figure 110: Latin America Aniline Market Revenue (US$ Mn) Market Share by End-use Industryin 2022
- Figure 111: Latin America Aniline Market Market Attractiveness Analysis by End-use Industry, 2016-2032
- Figure 112: Latin America Aniline Market Revenue (US$ Mn) Market Share by Country in 2022
- Figure 113: Latin America Aniline Market Market Attractiveness Analysis by Country, 2016-2032
- Figure 114: Latin America Aniline Market Market Revenue (US$ Mn) (2016-2032)
- Figure 115: Latin America Aniline Market Market Revenue (US$ Mn) Comparison by Country (2016-2032)
- Figure 116: Latin America Aniline Market Market Revenue (US$ Mn) Comparison by Technology (2016-2032)
- Figure 117: Latin America Aniline Market Market Revenue (US$ Mn) Comparison by Application (2016-2032)
- Figure 118: Latin America Aniline Market Market Revenue (US$ Mn) Comparison by End-use Industry (2016-2032)
- Figure 119: Latin America Aniline Market Market Y-o-Y Growth Rate Comparison by Country (2016-2032)
- Figure 120: Latin America Aniline Market Market Y-o-Y Growth Rate Comparison by Technology (2016-2032)
- Figure 121: Latin America Aniline Market Market Y-o-Y Growth Rate Comparison by Application (2016-2032)
- Figure 122: Latin America Aniline Market Market Y-o-Y Growth Rate Comparison by End-use Industry (2016-2032)
- Figure 123: Latin America Aniline Market Market Share Comparison by Country (2016-2032)
- Figure 124: Latin America Aniline Market Market Share Comparison by Technology (2016-2032)
- Figure 125: Latin America Aniline Market Market Share Comparison by Application (2016-2032)
- Figure 126: Latin America Aniline Market Market Share Comparison by End-use Industry (2016-2032)
- Figure 127: Middle East & Africa Aniline Market Revenue (US$ Mn) Market Share by Technologyin 2022
- Figure 128: Middle East & Africa Aniline Market Market Attractiveness Analysis by Technology, 2016-2032
- Figure 129: Middle East & Africa Aniline Market Revenue (US$ Mn) Market Share by Applicationin 2022
- Figure 130: Middle East & Africa Aniline Market Market Attractiveness Analysis by Application, 2016-2032
- Figure 131: Middle East & Africa Aniline Market Revenue (US$ Mn) Market Share by End-use Industryin 2022
- Figure 132: Middle East & Africa Aniline Market Market Attractiveness Analysis by End-use Industry, 2016-2032
- Figure 133: Middle East & Africa Aniline Market Revenue (US$ Mn) Market Share by Country in 2022
- Figure 134: Middle East & Africa Aniline Market Market Attractiveness Analysis by Country, 2016-2032
- Figure 135: Middle East & Africa Aniline Market Market Revenue (US$ Mn) (2016-2032)
- Figure 136: Middle East & Africa Aniline Market Market Revenue (US$ Mn) Comparison by Country (2016-2032)
- Figure 137: Middle East & Africa Aniline Market Market Revenue (US$ Mn) Comparison by Technology (2016-2032)
- Figure 138: Middle East & Africa Aniline Market Market Revenue (US$ Mn) Comparison by Application (2016-2032)
- Figure 139: Middle East & Africa Aniline Market Market Revenue (US$ Mn) Comparison by End-use Industry (2016-2032)
- Figure 140: Middle East & Africa Aniline Market Market Y-o-Y Growth Rate Comparison by Country (2016-2032)
- Figure 141: Middle East & Africa Aniline Market Market Y-o-Y Growth Rate Comparison by Technology (2016-2032)
- Figure 142: Middle East & Africa Aniline Market Market Y-o-Y Growth Rate Comparison by Application (2016-2032)
- Figure 143: Middle East & Africa Aniline Market Market Y-o-Y Growth Rate Comparison by End-use Industry (2016-2032)
- Figure 144: Middle East & Africa Aniline Market Market Share Comparison by Country (2016-2032)
- Figure 145: Middle East & Africa Aniline Market Market Share Comparison by Technology (2016-2032)
- Figure 146: Middle East & Africa Aniline Market Market Share Comparison by Application (2016-2032)
- Figure 147: Middle East & Africa Aniline Market Market Share Comparison by End-use Industry (2016-2032)
"
- List of Tables
- "
- Table 1: Global Aniline Market Market Comparison by Technology (2016-2032)
- Table 2: Global Aniline Market Market Comparison by Application (2016-2032)
- Table 3: Global Aniline Market Market Comparison by End-use Industry (2016-2032)
- Table 4: Global Aniline Market Revenue (US$ Mn) Comparison by Region (2016-2032)
- Table 5: Global Aniline Market Market Revenue (US$ Mn) (2016-2032)
- Table 6: Global Aniline Market Market Revenue (US$ Mn) Comparison by Region (2016-2032)
- Table 7: Global Aniline Market Market Revenue (US$ Mn) Comparison by Technology (2016-2032)
- Table 8: Global Aniline Market Market Revenue (US$ Mn) Comparison by Application (2016-2032)
- Table 9: Global Aniline Market Market Revenue (US$ Mn) Comparison by End-use Industry (2016-2032)
- Table 10: Global Aniline Market Market Y-o-Y Growth Rate Comparison by Region (2016-2032)
- Table 11: Global Aniline Market Market Y-o-Y Growth Rate Comparison by Technology (2016-2032)
- Table 12: Global Aniline Market Market Y-o-Y Growth Rate Comparison by Application (2016-2032)
- Table 13: Global Aniline Market Market Y-o-Y Growth Rate Comparison by End-use Industry (2016-2032)
- Table 14: Global Aniline Market Market Share Comparison by Region (2016-2032)
- Table 15: Global Aniline Market Market Share Comparison by Technology (2016-2032)
- Table 16: Global Aniline Market Market Share Comparison by Application (2016-2032)
- Table 17: Global Aniline Market Market Share Comparison by End-use Industry (2016-2032)
- Table 18: North America Aniline Market Market Comparison by Application (2016-2032)
- Table 19: North America Aniline Market Market Comparison by End-use Industry (2016-2032)
- Table 20: North America Aniline Market Revenue (US$ Mn) Comparison by Country (2016-2032)
- Table 21: North America Aniline Market Market Revenue (US$ Mn) (2016-2032)
- Table 22: North America Aniline Market Market Revenue (US$ Mn) Comparison by Country (2016-2032)
- Table 23: North America Aniline Market Market Revenue (US$ Mn) Comparison by Technology (2016-2032)
- Table 24: North America Aniline Market Market Revenue (US$ Mn) Comparison by Application (2016-2032)
- Table 25: North America Aniline Market Market Revenue (US$ Mn) Comparison by End-use Industry (2016-2032)
- Table 26: North America Aniline Market Market Y-o-Y Growth Rate Comparison by Country (2016-2032)
- Table 27: North America Aniline Market Market Y-o-Y Growth Rate Comparison by Technology (2016-2032)
- Table 28: North America Aniline Market Market Y-o-Y Growth Rate Comparison by Application (2016-2032)
- Table 29: North America Aniline Market Market Y-o-Y Growth Rate Comparison by End-use Industry (2016-2032)
- Table 30: North America Aniline Market Market Share Comparison by Country (2016-2032)
- Table 31: North America Aniline Market Market Share Comparison by Technology (2016-2032)
- Table 32: North America Aniline Market Market Share Comparison by Application (2016-2032)
- Table 33: North America Aniline Market Market Share Comparison by End-use Industry (2016-2032)
- Table 34: Western Europe Aniline Market Market Comparison by Technology (2016-2032)
- Table 35: Western Europe Aniline Market Market Comparison by Application (2016-2032)
- Table 36: Western Europe Aniline Market Market Comparison by End-use Industry (2016-2032)
- Table 37: Western Europe Aniline Market Revenue (US$ Mn) Comparison by Country (2016-2032)
- Table 38: Western Europe Aniline Market Market Revenue (US$ Mn) (2016-2032)
- Table 39: Western Europe Aniline Market Market Revenue (US$ Mn) Comparison by Country (2016-2032)
- Table 40: Western Europe Aniline Market Market Revenue (US$ Mn) Comparison by Technology (2016-2032)
- Table 41: Western Europe Aniline Market Market Revenue (US$ Mn) Comparison by Application (2016-2032)
- Table 42: Western Europe Aniline Market Market Revenue (US$ Mn) Comparison by End-use Industry (2016-2032)
- Table 43: Western Europe Aniline Market Market Y-o-Y Growth Rate Comparison by Country (2016-2032)
- Table 44: Western Europe Aniline Market Market Y-o-Y Growth Rate Comparison by Technology (2016-2032)
- Table 45: Western Europe Aniline Market Market Y-o-Y Growth Rate Comparison by Application (2016-2032)
- Table 46: Western Europe Aniline Market Market Y-o-Y Growth Rate Comparison by End-use Industry (2016-2032)
- Table 47: Western Europe Aniline Market Market Share Comparison by Country (2016-2032)
- Table 48: Western Europe Aniline Market Market Share Comparison by Technology (2016-2032)
- Table 49: Western Europe Aniline Market Market Share Comparison by Application (2016-2032)
- Table 50: Western Europe Aniline Market Market Share Comparison by End-use Industry (2016-2032)
- Table 51: Eastern Europe Aniline Market Market Comparison by Technology (2016-2032)
- Table 52: Eastern Europe Aniline Market Market Comparison by Application (2016-2032)
- Table 53: Eastern Europe Aniline Market Market Comparison by End-use Industry (2016-2032)
- Table 54: Eastern Europe Aniline Market Revenue (US$ Mn) Comparison by Country (2016-2032)
- Table 55: Eastern Europe Aniline Market Market Revenue (US$ Mn) (2016-2032)
- Table 56: Eastern Europe Aniline Market Market Revenue (US$ Mn) Comparison by Country (2016-2032)
- Table 57: Eastern Europe Aniline Market Market Revenue (US$ Mn) Comparison by Technology (2016-2032)
- Table 58: Eastern Europe Aniline Market Market Revenue (US$ Mn) Comparison by Application (2016-2032)
- Table 59: Eastern Europe Aniline Market Market Revenue (US$ Mn) Comparison by End-use Industry (2016-2032)
- Table 60: Eastern Europe Aniline Market Market Y-o-Y Growth Rate Comparison by Country (2016-2032)
- Table 61: Eastern Europe Aniline Market Market Y-o-Y Growth Rate Comparison by Technology (2016-2032)
- Table 62: Eastern Europe Aniline Market Market Y-o-Y Growth Rate Comparison by Application (2016-2032)
- Table 63: Eastern Europe Aniline Market Market Y-o-Y Growth Rate Comparison by End-use Industry (2016-2032)
- Table 64: Eastern Europe Aniline Market Market Share Comparison by Country (2016-2032)
- Table 65: Eastern Europe Aniline Market Market Share Comparison by Technology (2016-2032)
- Table 66: Eastern Europe Aniline Market Market Share Comparison by Application (2016-2032)
- Table 67: Eastern Europe Aniline Market Market Share Comparison by End-use Industry (2016-2032)
- Table 68: APAC Aniline Market Market Comparison by Technology (2016-2032)
- Table 69: APAC Aniline Market Market Comparison by Application (2016-2032)
- Table 70: APAC Aniline Market Market Comparison by End-use Industry (2016-2032)
- Table 71: APAC Aniline Market Revenue (US$ Mn) Comparison by Country (2016-2032)
- Table 72: APAC Aniline Market Market Revenue (US$ Mn) (2016-2032)
- Table 73: APAC Aniline Market Market Revenue (US$ Mn) Comparison by Country (2016-2032)
- Table 74: APAC Aniline Market Market Revenue (US$ Mn) Comparison by Technology (2016-2032)
- Table 75: APAC Aniline Market Market Revenue (US$ Mn) Comparison by Application (2016-2032)
- Table 76: APAC Aniline Market Market Revenue (US$ Mn) Comparison by End-use Industry (2016-2032)
- Table 77: APAC Aniline Market Market Y-o-Y Growth Rate Comparison by Country (2016-2032)
- Table 78: APAC Aniline Market Market Y-o-Y Growth Rate Comparison by Technology (2016-2032)
- Table 79: APAC Aniline Market Market Y-o-Y Growth Rate Comparison by Application (2016-2032)
- Table 80: APAC Aniline Market Market Y-o-Y Growth Rate Comparison by End-use Industry (2016-2032)
- Table 81: APAC Aniline Market Market Share Comparison by Country (2016-2032)
- Table 82: APAC Aniline Market Market Share Comparison by Technology (2016-2032)
- Table 83: APAC Aniline Market Market Share Comparison by Application (2016-2032)
- Table 84: APAC Aniline Market Market Share Comparison by End-use Industry (2016-2032)
- Table 85: Latin America Aniline Market Market Comparison by Technology (2016-2032)
- Table 86: Latin America Aniline Market Market Comparison by Application (2016-2032)
- Table 87: Latin America Aniline Market Market Comparison by End-use Industry (2016-2032)
- Table 88: Latin America Aniline Market Revenue (US$ Mn) Comparison by Country (2016-2032)
- Table 89: Latin America Aniline Market Market Revenue (US$ Mn) (2016-2032)
- Table 90: Latin America Aniline Market Market Revenue (US$ Mn) Comparison by Country (2016-2032)
- Table 91: Latin America Aniline Market Market Revenue (US$ Mn) Comparison by Technology (2016-2032)
- Table 92: Latin America Aniline Market Market Revenue (US$ Mn) Comparison by Application (2016-2032)
- Table 93: Latin America Aniline Market Market Revenue (US$ Mn) Comparison by End-use Industry (2016-2032)
- Table 94: Latin America Aniline Market Market Y-o-Y Growth Rate Comparison by Country (2016-2032)
- Table 95: Latin America Aniline Market Market Y-o-Y Growth Rate Comparison by Technology (2016-2032)
- Table 96: Latin America Aniline Market Market Y-o-Y Growth Rate Comparison by Application (2016-2032)
- Table 97: Latin America Aniline Market Market Y-o-Y Growth Rate Comparison by End-use Industry (2016-2032)
- Table 98: Latin America Aniline Market Market Share Comparison by Country (2016-2032)
- Table 99: Latin America Aniline Market Market Share Comparison by Technology (2016-2032)
- Table 100: Latin America Aniline Market Market Share Comparison by Application (2016-2032)
- Table 101: Latin America Aniline Market Market Share Comparison by End-use Industry (2016-2032)
- Table 102: Middle East & Africa Aniline Market Market Comparison by Technology (2016-2032)
- Table 103: Middle East & Africa Aniline Market Market Comparison by Application (2016-2032)
- Table 104: Middle East & Africa Aniline Market Market Comparison by End-use Industry (2016-2032)
- Table 105: Middle East & Africa Aniline Market Revenue (US$ Mn) Comparison by Country (2016-2032)
- Table 106: Middle East & Africa Aniline Market Market Revenue (US$ Mn) (2016-2032)
- Table 107: Middle East & Africa Aniline Market Market Revenue (US$ Mn) Comparison by Country (2016-2032)
- Table 108: Middle East & Africa Aniline Market Market Revenue (US$ Mn) Comparison by Technology (2016-2032)
- Table 109: Middle East & Africa Aniline Market Market Revenue (US$ Mn) Comparison by Application (2016-2032)
- Table 110: Middle East & Africa Aniline Market Market Revenue (US$ Mn) Comparison by End-use Industry (2016-2032)
- Table 111: Middle East & Africa Aniline Market Market Y-o-Y Growth Rate Comparison by Country (2016-2032)
- Table 112: Middle East & Africa Aniline Market Market Y-o-Y Growth Rate Comparison by Technology (2016-2032)
- Table 113: Middle East & Africa Aniline Market Market Y-o-Y Growth Rate Comparison by Application (2016-2032)
- Table 114: Middle East & Africa Aniline Market Market Y-o-Y Growth Rate Comparison by End-use Industry (2016-2032)
- Table 115: Middle East & Africa Aniline Market Market Share Comparison by Country (2016-2032)
- Table 116: Middle East & Africa Aniline Market Market Share Comparison by Technology (2016-2032)
- Table 117: Middle East & Africa Aniline Market Market Share Comparison by Application (2016-2032)
- Table 118: Middle East & Africa Aniline Market Market Share Comparison by End-use Industry (2016-2032)
- 1. Executive Summary
-
- BASF Corporation
- Sinopec Corp.
- Huntsman International LLC
- Mitsubishi Chemical Corporation
- Covestro AG
- Jilin Connell Chemical Industry Co. Ltd
- Wanhua Chemical Group Co. Ltd
- Shandong Jinling Chemical Co., Ltd
- Yantai Wanhua Polyurethane Co Ltd, DuPont
- Mitsubishi Chemical Corporation
- Sumitomo Chemical
- Arrow Chemical Group
- EMCO Dyestuff
- GNFC
- Narmada Chematur Petrochemicals Limited
- Tosoh Corporation
- Volzhsky Orgsintez JSC
- Ei Dupont De Nemours
Our Clients


View Our Licence Options
