
Anemia Treatment Market Report By Type (Iron Deficiency Anemia, Sickle Cell Anemia, Aplastic Anemia, Pernicious Anemia, Hemolytic Anemia, Others), By Therapy Type (Oral Iron Therapy, Parenteral Iron Therapy, Red Blood Cell Transfusion, Erythropoiesis-Stimulating Agents [ESAs], Vitamin B12 and Folic Acid Supplements, Others), By End User (Hospitals, Clinics, Home Healthcare, Others), By Region and Companies - Industry Segment Outlook, Market Assessment, Competition Scenario, Trends and Forecast 2024-2033
-
48347
-
July 2024
-
325
-


-
This report was compiled by Trishita Deb Trishita Deb is an experienced market research and consulting professional with over 7 years of expertise across healthcare, consumer goods, and materials, contributing to over 400 healthcare-related reports. Correspondence Team Lead- Healthcare Linkedin | Detailed Market research Methodology Our methodology involves a mix of primary research, including interviews with leading mental health experts, and secondary research from reputable medical journals and databases. View Detailed Methodology Page
-
Quick Navigation
Report Overview
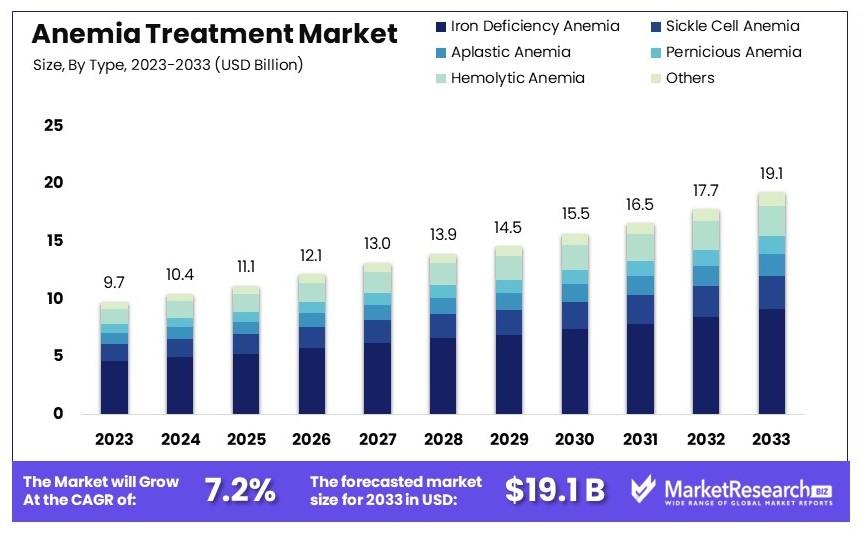
The Global Anemia Treatment Market size is expected to be worth around USD 19.1 Billion by 2033, from USD 9.7 Billion in 2023, growing at a CAGR of 7.2% during the forecast period from 2024 to 2033.
The Anemia Treatment Market refers to the sector involved in the development, production, and distribution of therapies for treating anemia—a condition characterized by a lack of healthy red blood cells.
This market includes pharmaceuticals like iron supplements, vitamin B12 injections, and synthetic erythropoietin products, as well as advanced biotechnological treatments. Growth drivers include an aging global population and increased prevalence of chronic diseases that may cause anemia. The market caters to healthcare providers and patients, offering solutions that range from preventive to advanced therapeutic options.
The anemia treatment market is positioned at a critical juncture, driven by a convergence of demographic prevalence, advanced therapeutic developments, and targeted investments. Globally, anemia affects nearly 2 billion individuals, with a higher incidence observed among women (31.2%) and men (17.5%) predominantly in regions such as sub-Saharan Africa and South Asia. This widespread prevalence underpins a robust demand for effective treatment solutions.
In the United States alone, anemia-related complications result in approximately 890,000 emergency department visits and 5,633 deaths annually, signaling significant healthcare burden. These figures underscore the urgent need for enhanced diagnostic and treatment protocols. The American Gastroenterological Association's guidelines recommend non-invasive tests for common underlying conditions like Helicobacter pylori and celiac disease, alongside iron supplementation, highlighting the shift towards more integrated and patient-centric care approaches in managing iron deficiency anemia (IDA).
Moreover, the market is witnessing substantial investments in research and development, particularly in innovative technologies such as CRISPR/Cas12a gene-editing for sickle cell disease treatment. These advancements indicate a trend towards more precise and potentially curative therapies, reflecting a shift from traditional symptomatic treatment to disease modification and management.
The strategic focus of both private and public sectors on developing accessible and effective anemia treatments is particularly notable in high-prevalence regions. This investment is expected to catalyze the next wave of growth in the anemia treatment market, supported by an evolving regulatory landscape and increasing awareness of the condition's impact.
The anemia treatment market exhibits strong growth prospects, fueled by a combination of rising global demand, innovative treatment breakthroughs, and strategic health investments. These elements collectively foster a promising environment for the expansion of therapeutic solutions and improved patient outcomes in the foreseeable future.
Key Takeaways
- Market Value: The Anemia Treatment Market was valued at USD 9.7 billion in 2023 and is expected to reach USD 19.1 billion by 2033, with a CAGR of 7.2%.
- Type Analysis: Iron Deficiency Anemia dominates with 48%, due to its high prevalence.
- Therapy Type Analysis: Oral Iron Therapy leads with 35%, owing to its ease of use.
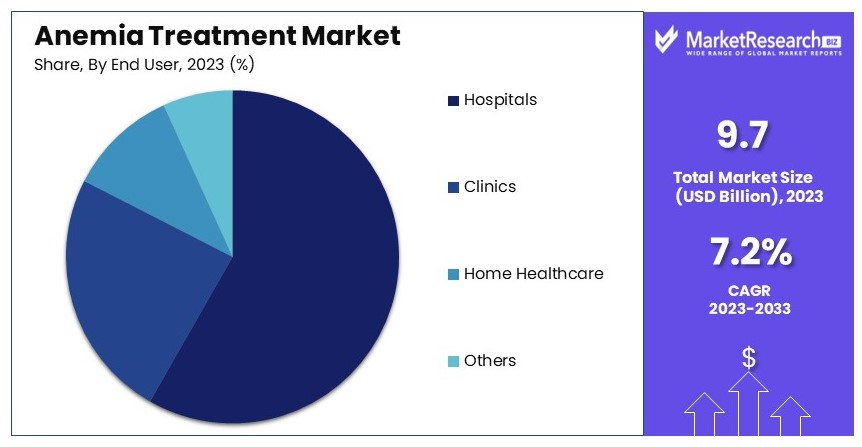
- End User Analysis: Hospitals dominate with 60%, reflecting their role in anemia management.
- Dominant Region: North America leads with ~40%, attributed to advanced healthcare infrastructure.
- Analyst Viewpoint: The market is moderately saturated with strong competition, anticipated to grow with new therapeutic advancements.
- Growth Opportunities: Key players can focus on developing advanced anemia therapies and expanding in emerging markets.
Driving Factors
Rising Prevalence of Anemia Drives Market Growth
The anemia treatment market is primarily driven by the increasing occurrence of anemia worldwide, especially in developing regions. Nutritional deficiencies, chronic illnesses, and inherited conditions are major contributors to the widespread incidence of this condition.
The World Health Organization reports that over 1.6 billion individuals globally suffer from anemia, highlighting its status as a significant health issue. The high prevalence directly stimulates the demand for effective anemia treatments, as the need to manage and mitigate the impacts of anemia grows in parallel with its rising occurrence.
Growing Awareness and Screening Programs Drive Market Growth
Enhanced public awareness and the implementation of widespread screening programs significantly contribute to the growth of the anemia treatment market. Various global health initiatives aim to boost early detection and appropriate management of anemia, focusing on vulnerable groups like pregnant women and young children.
For instance, India's Anemia Mukt Bharat strategy is a pivotal example, aiming to curtail anemia prevalence with strategies such as iron supplementation and promoting nutritional awareness. These efforts facilitate early intervention, thereby increasing the demand for treatment solutions and supporting market expansion.
Advancements in Diagnostic Technologies Drive Market Growth
The development of sophisticated diagnostic tools has revolutionized the anemia treatment market. Innovations in technology, such as automated hematology analyzers and molecular diagnostics, enhance the accuracy and timeliness of anemia detection.
Notably, the advent of point-of-care testing devices has made it possible to conduct quick and efficient anemia screenings in even the most remote locations. These technological advancements not only improve patient outcomes by enabling timely and precise disease management but also bolster the demand for advanced treatment options, thereby driving market growth.
Restraining Factors
Limited Access to Healthcare Resources Restrains Anemia Treatment Market Growth
Limited access to healthcare resources is a major barrier in the anemia treatment market. In many developing and underdeveloped regions, there is a lack of skilled healthcare professionals, diagnostic facilities, and appropriate treatment options. This limitation disproportionately affects vulnerable populations, making it difficult to manage anemia effectively.
Without proper diagnosis and treatment, the prevalence of anemia remains high, hindering market growth. For instance, rural areas often lack the necessary healthcare infrastructure, leading to untreated cases of anemia. This gap in healthcare access prevents the widespread adoption of anemia treatments, thereby restraining market growth.
High Treatment Costs Restrain Anemia Treatment Market Growth
High treatment costs are another significant factor restraining the anemia treatment market. Advanced therapies, such as erythropoiesis-stimulating agents (ESAs) and targeted therapies, can be expensive. These costs can be a significant barrier, especially in resource-constrained settings. The financial burden on patients, women's health and healthcare systems limits the adoption of these treatments.
For example, in low-income regions, patients may not afford advanced treatments, relying instead on cheaper, less effective alternatives. This economic barrier restricts the overall market growth, as the high cost of effective treatments limits their accessibility to a broader population.
Type Analysis
Iron Deficiency Anemia dominates with 48% due to its high prevalence globally.
The anemia treatment market is categorized by different types of anemia, with iron deficiency anemia holding the dominant position. This is primarily due to the widespread prevalence of iron deficiency among the global population, exacerbated by poor diets, and women's health issues such as heavy menstrual periods or pregnancy-related complications. Iron deficiency anemia is easily diagnosed and treated, which contributes to its large market share.
Sickle cell anemia, although less common globally, is significant in regions such as Africa and among African American populations in the United States, where genetic predisposition makes it a major public health concern. Treatment advancements and improved screening programs are crucial for this sub-segment's growth.
Aplastic anemia, pernicious anemia, and hemolytic anemia are less common but important market segments. Each requires specific diagnostic and treatment approaches, which include immunosuppressants for aplastic anemia and vitamin B12 for pernicious anemia. These treatments are more complex and expensive, affecting their market dynamics.
The "others" category in this segment includes rare types of anemia, which often require specialized treatment regimens. This sub-segment is vital for the growth of the overall market as it addresses the needs of a small patient population with highly specific treatment requirements.
Therapy Type Analysis
Oral Iron Therapy dominates with 35% due to its ease of use and effectiveness in treating iron deficiency anemia.
In the anemia treatment market, therapy types are diverse, with oral iron therapy leading due to its straightforward, non-invasive nature and effectiveness in treating the most common type of anemia—iron deficiency. It's the first line of treatment due to its cost-effectiveness and patient compliance rate.
Parenteral iron therapy is used when oral iron is not suitable due to medical conditions like inflammatory bowel disease or chronic kidney disease. This therapy type is critical for patients who need rapid improvement in iron levels.
Red Blood Cell Transfusion is essential for severe cases and during surgeries or childbirth where significant blood loss occurs. Its role in acute care settings underscores its importance in the therapeutic landscape.
Erythropoiesis-Stimulating Agents (ESAs) are used primarily in chronic kidney disease patients to aid in red blood cell production. This therapy type has seen a shift in usage patterns due to evolving guidelines focusing on safety profiles and efficacy.
Vitamin B12 and Folic Acid Supplements are used to treat pernicious anemia and other conditions where these deficiencies are prevalent. They play a critical role in managing these specific sub-types of anemia.
The "others" category includes newer and less common treatments, which are significant for patients with specific needs not addressed by more common therapies. This segment allows the market to cater to niche but crucial medical requirements.
End User Analysis
Hospitals dominate with 60% due to their comprehensive care facilities for anemia treatment.
End users of anemia treatments include hospitals, clinics, home healthcare, and others, with hospitals holding the largest share. Hospitals are often the primary choice for pathology, diagnosing and treating anemia due to the availability of advanced medical technology and specialists. This makes them essential for effective anemia management, especially in severe cases requiring multidisciplinary approaches.
Clinics serve as an important access point for patients requiring ongoing management of chronic anemia conditions like sickle cell anemia or iron deficiency anemia. Their role is growing as healthcare systems focus on decentralizing care to make treatments more accessible.
Home healthcare is expanding, especially for the elderly or those in remote areas, allowing for routine management of chronic anemia without frequent hospital visits. This segment’s growth is supported by the development of oral and injectable treatments that can be administered at home.
The "others" category includes long-term care facilities and community health centers, which play a critical role in supporting patients with less common types of anemia and those who need ongoing support. This segment's expansion is crucial for reaching underserved populations and ensuring comprehensive care coverage.
Key Market Segments
Type
- Iron Deficiency Anemia
- Sickle Cell Anemia
- Aplastic Anemia
- Pernicious Anemia
- Hemolytic Anemia
- Others
Therapy Type
- Oral Iron Therapy
- Parenteral Iron Therapy
- Red Blood Cell Transfusion
- Erythropoiesis-Stimulating Agents (ESAs)
- Vitamin B12 and Folic Acid Supplements
- Others
End User
- Hospitals
- Clinics
- Home Healthcare
- Others
Growth Opportunities
Development of Novel Therapies Offers Growth Opportunity
The development of novel therapies in the anemia treatment market presents substantial growth opportunities. Research and development are focused on innovative approaches such as gene therapies, targeted protein therapies, and stem cell-based treatments.
These advanced therapies target specific underlying causes of anemia and address unmet medical needs. By offering new and effective treatment options, these novel therapies can improve patient outcomes and attract investments. The introduction of these innovative treatments can revolutionize anemia management and significantly drive market growth.
Personalized and Targeted Treatments Offer Growth Opportunity
Advancements in genomics and molecular diagnostics are driving the trend towards personalized and targeted treatments for anemia. Tailoring therapies to individual patient characteristics, such as genetic profiles or specific disease subtypes, can enhance treatment effectiveness.
Personalized treatments can lead to better patient outcomes, reduced side effects, and increased patient satisfaction. As healthcare providers increasingly adopt personalized medicine, the demand for customized anemia treatments will rise, providing significant growth opportunities for the market.
Trending Factors
Expansion in Emerging Markets Are Trending Factors
Emerging markets in Asia and Latin America present significant growth opportunities for the anemia treatment market. Increasing healthcare spending, improving access to medical treatments, and rising awareness about anemia are key drivers in these regions.
Governments and healthcare organizations are investing in healthcare infrastructure and education, leading to higher diagnosis and treatment rates. As these markets continue to develop, the demand for effective anemia treatments is expected to grow, making these regions crucial for market expansion.
Adoption of Biosimilars Are Trending Factors
The adoption of biosimilars in the anemia treatment market is a trending factor with significant potential. Biosimilars are more affordable versions of established biologic therapies, such as erythropoiesis-stimulating agents (ESAs).
They increase access to treatment for a larger patient population. While regulatory challenges and concerns about biosimilar development and approval processes exist, their adoption can reduce healthcare costs and enhance treatment availability. As biosimilars gain acceptance, they are expected to play a crucial role in market growth by making anemia treatments more accessible and affordable.
Regional Analysis
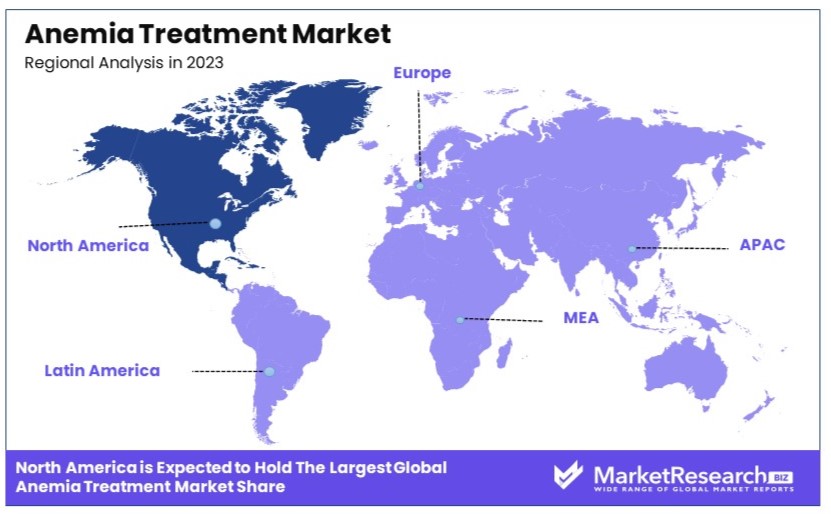
North America Dominates with 40% Market Share in the Anemia Treatment Market
North America’s 40% share in the global anemia treatment market is primarily driven by its advanced healthcare infrastructure and high prevalence of chronic diseases such as kidney disease and diabetes, which often lead to anemia. Additionally, the region boasts strong pharmaceutical research and development capabilities, leading to frequent innovations in anemia treatments. High healthcare spending and supportive insurance policies also contribute to widespread access to treatments, enhancing the region’s market dominance.
The anemia treatment market in North America is influenced by a high degree of awareness about anemia symptoms and consequences, leading to early diagnosis and treatment. The region's robust regulatory environment supports quick adoption of new therapies, which is crucial for market growth. Furthermore, collaborations between public health bodies and pharmaceutical companies to improve treatment outcomes are a key dynamic boosting the industry's performance.
Regional Market Shares and Dynamics:
Europe: Europe holds approximately 30% of the anemia treatment market. The market is supported by a strong healthcare system and active government initiatives to combat anemia, particularly in aging populations. The region’s focus on innovative biotechnological research is expected to maintain its significant market share.
Asia Pacific: With about 20% of the market, Asia Pacific is rapidly growing due to increasing healthcare access and rising awareness about anemia. Economic development and healthcare infrastructure improvements, alongside a growing middle class, are key drivers for this region’s market expansion.
Middle East & Africa: This region accounts for around 5% of the market. Growth is driven by gradual improvements in healthcare systems and rising health awareness. Efforts to address malnutrition, a common cause of anemia, are also contributing to market growth in these areas.
Latin America: Latin America holds roughly 5% of the global market. Factors such as improving healthcare facilities and government initiatives aimed at public health are fostering growth. However, the region faces challenges like economic variability which could affect market expansion.
Key Regions and Countries
- North America
- The US
- Canada
- Mexico
- Western Europe
- Germany
- France
- The UK
- Spain
- Italy
- Portugal
- Ireland
- Austria
- Switzerland
- Benelux
- Nordic
- Rest of Western Europe
- Eastern Europe
- Russia
- Poland
- The Czech Republic
- Greece
- Rest of Eastern Europe
- APAC
- China
- Japan
- South Korea
- India
- Australia & New Zealand
- Indonesia
- Malaysia
- Philippines
- Singapore
- Thailand
- Vietnam
- Rest of APAC
- Latin America
- Brazil
- Colombia
- Chile
- Argentina
- Costa Rica
- Rest of Latin America
- Middle East & Africa
- Algeria
- Egypt
- Israel
- Kuwait
- Nigeria
- Saudi Arabia
- South Africa
- Turkey
- United Arab Emirates
- Rest of MEA
Key Players Analysis
The Anemia Treatment Market is dominated by several key players who impact the market significantly. Amgen Inc. and Pfizer Inc. are leaders due to their extensive research and development capabilities. They offer a wide range of anemia treatments and have strong global distribution networks.
GlaxoSmithKline plc and Novartis AG are notable for their innovative therapies and strong market presence. They focus on developing advanced treatments and expanding their product portfolios through strategic acquisitions.
Hoffmann-La Roche Ltd and Johnson & Johnson have a significant impact due to their robust product pipelines and strong brand recognition. Their strategies include investing in clinical trials and expanding their reach in emerging markets.
Sanofi S.A. and Vifor Pharma specialize in iron deficiency treatments and have a strong market influence. Their focus on patient-centric approaches and collaboration with healthcare providers enhances their strategic positioning.
Daiichi Sankyo Company, Limited and Bayer AG are known for their research-driven approaches and extensive market reach. They invest heavily in new treatment developments and have strong relationships with healthcare professionals.
Akebia Therapeutics, Rockwell Medical, Inc., and FibroGen, Inc. are emerging players focusing on innovative therapies and addressing unmet needs in the market. Pieris Pharmaceuticals and Biocon Limited are also influential due to their focus on biosimilars and affordable treatment options.
The market is characterized by a mix of established pharmaceutical giants and innovative biotech firms, each contributing to the advancement of anemia treatments through research, development, and strategic collaborations.
Market Key Players
- Amgen Inc.
- Pfizer Inc.
- GlaxoSmithKline plc
- Novartis AG
- Hoffmann-La Roche Ltd
- Johnson & Johnson
- Sanofi S.A.
- Vifor Pharma
- Daiichi Sankyo Company, Limited
- Bayer AG
- Akebia Therapeutics
- Rockwell Medical, Inc.
- FibroGen, Inc.
- Pieris Pharmaceuticals
- Biocon Limited
Recent Developments
- 2024: Akebia Therapeutics has been actively involved in the development of vadadustat, a HIF-PHI for the treatment of anemia in CKD. The drug is currently in late-stage clinical trials, showing promising results in managing anemia in CKD patients.
- 2024: The treatment of anemia in CKD patients has evolved significantly. Current standards involve a hierarchical approach using iron supplements, ESAs, and the newer hypoxia-inducible factor-prolyl hydroxylase inhibitors (HIF-PHIs) to manage anemia effectively and improve patient outcomes.
Report Scope
Report Features Description Market Value (2023) USD 9.7 Billion Forecast Revenue (2033) USD 19.1 Billion CAGR (2024-2033) 7.2% Base Year for Estimation 2023 Historic Period 2018-2023 Forecast Period 2024-2033 Report Coverage Revenue Forecast, Market Dynamics, Competitive Landscape, Recent Developments Segments Covered By Type (Iron Deficiency Anemia, Sickle Cell Anemia, Aplastic Anemia, Pernicious Anemia, Hemolytic Anemia, Others), By Therapy Type (Oral Iron Therapy, Parenteral Iron Therapy, Red Blood Cell Transfusion, Erythropoiesis-Stimulating Agents [ESAs], Vitamin B12 and Folic Acid Supplements, Others), By End User (Hospitals, Clinics, Home Healthcare, Others) Regional Analysis North America - The US, Canada, & Mexico; Western Europe - Germany, France, The UK, Spain, Italy, Portugal, Ireland, Austria, Switzerland, Benelux, Nordic, & Rest of Western Europe; Eastern Europe - Russia, Poland, The Czech Republic, Greece, & Rest of Eastern Europe; APAC - China, Japan, South Korea, India, Australia & New Zealand, Indonesia, Malaysia, Philippines, Singapore, Thailand, Vietnam, & Rest of APAC; Latin America - Brazil, Colombia, Chile, Argentina, Costa Rica, & Rest of Latin America; Middle East & Africa - Algeria, Egypt, Israel, Kuwait, Nigeria, Saudi Arabia, South Africa, Turkey, United Arab Emirates, & Rest of MEA Competitive Landscape Amgen Inc., Pfizer Inc., GlaxoSmithKline plc, Novartis AG, Hoffmann-La Roche Ltd, Johnson & Johnson, Sanofi S.A., Vifor Pharma, Daiichi Sankyo Company, Limited, Bayer AG, Akebia Therapeutics, Rockwell Medical, Inc., FibroGen, Inc., Pieris Pharmaceuticals, Biocon Limited Customization Scope Customization for segments, region/country-level will be provided. Moreover, additional customization can be done based on the requirements. Purchase Options We have three licenses to opt for: Single User License, Multi-User License (Up to 5 Users), Corporate Use License (Unlimited User and Printable PDF) -
- 1. Executive Summary
- 1.1. Definition
- 1.2. Taxonomy
- 1.3. Research Scope
- 1.4. Key Analysis
- 1.5. Key Findings by Major Segments
- 1.6. Top strategies by Major Players
- 2. Global Anemia Treatment Market Overview
- 2.1. Anemia Treatment Market Dynamics
- 2.1.1. Drivers
- 2.1.2. Opportunities
- 2.1.3. Restraints
- 2.1.4. Challenges
- 2.2. Macro-economic Factors
- 2.3. Regulatory Framework
- 2.4. Market Investment Feasibility Index
- 2.5. PEST Analysis
- 2.6. PORTER’S Five Force Analysis
- 2.7. Drivers & Restraints Impact Analysis
- 2.8. Industry Chain Analysis
- 2.9. Cost Structure Analysis
- 2.10. Marketing Strategy
- 2.11. Russia-Ukraine War Impact Analysis
- 2.12. Opportunity Map Analysis
- 2.13. Market Competition Scenario Analysis
- 2.14. Product Life Cycle Analysis
- 2.15. Opportunity Orbits
- 2.16. Manufacturer Intensity Map
- 2.17. Major Companies sales by Value & Volume
- 2.1. Anemia Treatment Market Dynamics
- 3. Global Anemia Treatment Market Analysis, Opportunity and Forecast, 2016-2032
- 3.1. Global Anemia Treatment Market Analysis, 2016-2021
- 3.2. Global Anemia Treatment Market Opportunity and Forecast, 2023-2032
- 3.3. Global Anemia Treatment Market Analysis, Opportunity and Forecast, By Type, 2016-2032
- 3.3.1. Global Anemia Treatment Market Analysis by Type: Introduction
- 3.3.2. Market Size Absolute $ Opportunity Analysis and Forecast, By Type, 2016-2032
- 3.3.3. Iron Deficiency Anemia
- 3.3.4. Sickle Cell Anemia
- 3.3.5. Aplastic Anemia
- 3.3.6. Pernicious Anemia
- 3.3.7. Hemolytic Anemia
- 3.3.8. Others
- 3.4. Global Anemia Treatment Market Analysis, Opportunity and Forecast, By Therapy Type, 2016-2032
- 3.4.1. Global Anemia Treatment Market Analysis by Therapy Type: Introduction
- 3.4.2. Market Size Absolute $ Opportunity Analysis and Forecast, By Therapy Type, 2016-2032
- 3.4.3. Oral Iron Therapy
- 3.4.4. Parenteral Iron Therapy
- 3.4.5. Red Blood Cell Transfusion
- 3.4.6. Erythropoiesis-Stimulating Agents (ESAs)
- 3.4.7. Vitamin B12 and Folic Acid Supplements
- 3.4.8. Others
- 3.5. Global Anemia Treatment Market Analysis, Opportunity and Forecast, By End User, 2016-2032
- 3.5.1. Global Anemia Treatment Market Analysis by End User: Introduction
- 3.5.2. Market Size Absolute $ Opportunity Analysis and Forecast, By End User, 2016-2032
- 3.5.3. Hospitals
- 3.5.4. Clinics
- 3.5.5. Home Healthcare
- 3.5.6. Others
- 4. North America Anemia Treatment Market Analysis, Opportunity and Forecast, 2016-2032
- 4.1. North America Anemia Treatment Market Analysis, 2016-2021
- 4.2. North America Anemia Treatment Market Opportunity and Forecast, 2023-2032
- 4.3. North America Anemia Treatment Market Analysis, Opportunity and Forecast, By Type, 2016-2032
- 4.3.1. North America Anemia Treatment Market Analysis by Type: Introduction
- 4.3.2. Market Size Absolute $ Opportunity Analysis and Forecast, By Type, 2016-2032
- 4.3.3. Iron Deficiency Anemia
- 4.3.4. Sickle Cell Anemia
- 4.3.5. Aplastic Anemia
- 4.3.6. Pernicious Anemia
- 4.3.7. Hemolytic Anemia
- 4.3.8. Others
- 4.4. North America Anemia Treatment Market Analysis, Opportunity and Forecast, By Therapy Type, 2016-2032
- 4.4.1. North America Anemia Treatment Market Analysis by Therapy Type: Introduction
- 4.4.2. Market Size Absolute $ Opportunity Analysis and Forecast, By Therapy Type, 2016-2032
- 4.4.3. Oral Iron Therapy
- 4.4.4. Parenteral Iron Therapy
- 4.4.5. Red Blood Cell Transfusion
- 4.4.6. Erythropoiesis-Stimulating Agents (ESAs)
- 4.4.7. Vitamin B12 and Folic Acid Supplements
- 4.4.8. Others
- 4.5. North America Anemia Treatment Market Analysis, Opportunity and Forecast, By End User, 2016-2032
- 4.5.1. North America Anemia Treatment Market Analysis by End User: Introduction
- 4.5.2. Market Size Absolute $ Opportunity Analysis and Forecast, By End User, 2016-2032
- 4.5.3. Hospitals
- 4.5.4. Clinics
- 4.5.5. Home Healthcare
- 4.5.6. Others
- 4.6. North America Anemia Treatment Market Analysis, Opportunity and Forecast, By Country , 2016-2032
- 4.6.1. North America Anemia Treatment Market Analysis by Country : Introduction
- 4.6.2. Market Size Absolute $ Opportunity Analysis and Forecast, Country , 2016-2032
- 4.6.2.1. The US
- 4.6.2.2. Canada
- 4.6.2.3. Mexico
- 5. Western Europe Anemia Treatment Market Analysis, Opportunity and Forecast, 2016-2032
- 5.1. Western Europe Anemia Treatment Market Analysis, 2016-2021
- 5.2. Western Europe Anemia Treatment Market Opportunity and Forecast, 2023-2032
- 5.3. Western Europe Anemia Treatment Market Analysis, Opportunity and Forecast, By Type, 2016-2032
- 5.3.1. Western Europe Anemia Treatment Market Analysis by Type: Introduction
- 5.3.2. Market Size Absolute $ Opportunity Analysis and Forecast, By Type, 2016-2032
- 5.3.3. Iron Deficiency Anemia
- 5.3.4. Sickle Cell Anemia
- 5.3.5. Aplastic Anemia
- 5.3.6. Pernicious Anemia
- 5.3.7. Hemolytic Anemia
- 5.3.8. Others
- 5.4. Western Europe Anemia Treatment Market Analysis, Opportunity and Forecast, By Therapy Type, 2016-2032
- 5.4.1. Western Europe Anemia Treatment Market Analysis by Therapy Type: Introduction
- 5.4.2. Market Size Absolute $ Opportunity Analysis and Forecast, By Therapy Type, 2016-2032
- 5.4.3. Oral Iron Therapy
- 5.4.4. Parenteral Iron Therapy
- 5.4.5. Red Blood Cell Transfusion
- 5.4.6. Erythropoiesis-Stimulating Agents (ESAs)
- 5.4.7. Vitamin B12 and Folic Acid Supplements
- 5.4.8. Others
- 5.5. Western Europe Anemia Treatment Market Analysis, Opportunity and Forecast, By End User, 2016-2032
- 5.5.1. Western Europe Anemia Treatment Market Analysis by End User: Introduction
- 5.5.2. Market Size Absolute $ Opportunity Analysis and Forecast, By End User, 2016-2032
- 5.5.3. Hospitals
- 5.5.4. Clinics
- 5.5.5. Home Healthcare
- 5.5.6. Others
- 5.6. Western Europe Anemia Treatment Market Analysis, Opportunity and Forecast, By Country , 2016-2032
- 5.6.1. Western Europe Anemia Treatment Market Analysis by Country : Introduction
- 5.6.2. Market Size Absolute $ Opportunity Analysis and Forecast, Country , 2016-2032
- 5.6.2.1. Germany
- 5.6.2.2. France
- 5.6.2.3. The UK
- 5.6.2.4. Spain
- 5.6.2.5. Italy
- 5.6.2.6. Portugal
- 5.6.2.7. Ireland
- 5.6.2.8. Austria
- 5.6.2.9. Switzerland
- 5.6.2.10. Benelux
- 5.6.2.11. Nordic
- 5.6.2.12. Rest of Western Europe
- 6. Eastern Europe Anemia Treatment Market Analysis, Opportunity and Forecast, 2016-2032
- 6.1. Eastern Europe Anemia Treatment Market Analysis, 2016-2021
- 6.2. Eastern Europe Anemia Treatment Market Opportunity and Forecast, 2023-2032
- 6.3. Eastern Europe Anemia Treatment Market Analysis, Opportunity and Forecast, By Type, 2016-2032
- 6.3.1. Eastern Europe Anemia Treatment Market Analysis by Type: Introduction
- 6.3.2. Market Size Absolute $ Opportunity Analysis and Forecast, By Type, 2016-2032
- 6.3.3. Iron Deficiency Anemia
- 6.3.4. Sickle Cell Anemia
- 6.3.5. Aplastic Anemia
- 6.3.6. Pernicious Anemia
- 6.3.7. Hemolytic Anemia
- 6.3.8. Others
- 6.4. Eastern Europe Anemia Treatment Market Analysis, Opportunity and Forecast, By Therapy Type, 2016-2032
- 6.4.1. Eastern Europe Anemia Treatment Market Analysis by Therapy Type: Introduction
- 6.4.2. Market Size Absolute $ Opportunity Analysis and Forecast, By Therapy Type, 2016-2032
- 6.4.3. Oral Iron Therapy
- 6.4.4. Parenteral Iron Therapy
- 6.4.5. Red Blood Cell Transfusion
- 6.4.6. Erythropoiesis-Stimulating Agents (ESAs)
- 6.4.7. Vitamin B12 and Folic Acid Supplements
- 6.4.8. Others
- 6.5. Eastern Europe Anemia Treatment Market Analysis, Opportunity and Forecast, By End User, 2016-2032
- 6.5.1. Eastern Europe Anemia Treatment Market Analysis by End User: Introduction
- 6.5.2. Market Size Absolute $ Opportunity Analysis and Forecast, By End User, 2016-2032
- 6.5.3. Hospitals
- 6.5.4. Clinics
- 6.5.5. Home Healthcare
- 6.5.6. Others
- 6.6. Eastern Europe Anemia Treatment Market Analysis, Opportunity and Forecast, By Country , 2016-2032
- 6.6.1. Eastern Europe Anemia Treatment Market Analysis by Country : Introduction
- 6.6.2. Market Size Absolute $ Opportunity Analysis and Forecast, Country , 2016-2032
- 6.6.2.1. Russia
- 6.6.2.2. Poland
- 6.6.2.3. The Czech Republic
- 6.6.2.4. Greece
- 6.6.2.5. Rest of Eastern Europe
- 7. APAC Anemia Treatment Market Analysis, Opportunity and Forecast, 2016-2032
- 7.1. APAC Anemia Treatment Market Analysis, 2016-2021
- 7.2. APAC Anemia Treatment Market Opportunity and Forecast, 2023-2032
- 7.3. APAC Anemia Treatment Market Analysis, Opportunity and Forecast, By Type, 2016-2032
- 7.3.1. APAC Anemia Treatment Market Analysis by Type: Introduction
- 7.3.2. Market Size Absolute $ Opportunity Analysis and Forecast, By Type, 2016-2032
- 7.3.3. Iron Deficiency Anemia
- 7.3.4. Sickle Cell Anemia
- 7.3.5. Aplastic Anemia
- 7.3.6. Pernicious Anemia
- 7.3.7. Hemolytic Anemia
- 7.3.8. Others
- 7.4. APAC Anemia Treatment Market Analysis, Opportunity and Forecast, By Therapy Type, 2016-2032
- 7.4.1. APAC Anemia Treatment Market Analysis by Therapy Type: Introduction
- 7.4.2. Market Size Absolute $ Opportunity Analysis and Forecast, By Therapy Type, 2016-2032
- 7.4.3. Oral Iron Therapy
- 7.4.4. Parenteral Iron Therapy
- 7.4.5. Red Blood Cell Transfusion
- 7.4.6. Erythropoiesis-Stimulating Agents (ESAs)
- 7.4.7. Vitamin B12 and Folic Acid Supplements
- 7.4.8. Others
- 7.5. APAC Anemia Treatment Market Analysis, Opportunity and Forecast, By End User, 2016-2032
- 7.5.1. APAC Anemia Treatment Market Analysis by End User: Introduction
- 7.5.2. Market Size Absolute $ Opportunity Analysis and Forecast, By End User, 2016-2032
- 7.5.3. Hospitals
- 7.5.4. Clinics
- 7.5.5. Home Healthcare
- 7.5.6. Others
- 7.6. APAC Anemia Treatment Market Analysis, Opportunity and Forecast, By Country , 2016-2032
- 7.6.1. APAC Anemia Treatment Market Analysis by Country : Introduction
- 7.6.2. Market Size Absolute $ Opportunity Analysis and Forecast, Country , 2016-2032
- 7.6.2.1. China
- 7.6.2.2. Japan
- 7.6.2.3. South Korea
- 7.6.2.4. India
- 7.6.2.5. Australia & New Zeland
- 7.6.2.6. Indonesia
- 7.6.2.7. Malaysia
- 7.6.2.8. Philippines
- 7.6.2.9. Singapore
- 7.6.2.10. Thailand
- 7.6.2.11. Vietnam
- 7.6.2.12. Rest of APAC
- 8. Latin America Anemia Treatment Market Analysis, Opportunity and Forecast, 2016-2032
- 8.1. Latin America Anemia Treatment Market Analysis, 2016-2021
- 8.2. Latin America Anemia Treatment Market Opportunity and Forecast, 2023-2032
- 8.3. Latin America Anemia Treatment Market Analysis, Opportunity and Forecast, By Type, 2016-2032
- 8.3.1. Latin America Anemia Treatment Market Analysis by Type: Introduction
- 8.3.2. Market Size Absolute $ Opportunity Analysis and Forecast, By Type, 2016-2032
- 8.3.3. Iron Deficiency Anemia
- 8.3.4. Sickle Cell Anemia
- 8.3.5. Aplastic Anemia
- 8.3.6. Pernicious Anemia
- 8.3.7. Hemolytic Anemia
- 8.3.8. Others
- 8.4. Latin America Anemia Treatment Market Analysis, Opportunity and Forecast, By Therapy Type, 2016-2032
- 8.4.1. Latin America Anemia Treatment Market Analysis by Therapy Type: Introduction
- 8.4.2. Market Size Absolute $ Opportunity Analysis and Forecast, By Therapy Type, 2016-2032
- 8.4.3. Oral Iron Therapy
- 8.4.4. Parenteral Iron Therapy
- 8.4.5. Red Blood Cell Transfusion
- 8.4.6. Erythropoiesis-Stimulating Agents (ESAs)
- 8.4.7. Vitamin B12 and Folic Acid Supplements
- 8.4.8. Others
- 8.5. Latin America Anemia Treatment Market Analysis, Opportunity and Forecast, By End User, 2016-2032
- 8.5.1. Latin America Anemia Treatment Market Analysis by End User: Introduction
- 8.5.2. Market Size Absolute $ Opportunity Analysis and Forecast, By End User, 2016-2032
- 8.5.3. Hospitals
- 8.5.4. Clinics
- 8.5.5. Home Healthcare
- 8.5.6. Others
- 8.6. Latin America Anemia Treatment Market Analysis, Opportunity and Forecast, By Country , 2016-2032
- 8.6.1. Latin America Anemia Treatment Market Analysis by Country : Introduction
- 8.6.2. Market Size Absolute $ Opportunity Analysis and Forecast, Country , 2016-2032
- 8.6.2.1. Brazil
- 8.6.2.2. Colombia
- 8.6.2.3. Chile
- 8.6.2.4. Argentina
- 8.6.2.5. Costa Rica
- 8.6.2.6. Rest of Latin America
- 9. Middle East & Africa Anemia Treatment Market Analysis, Opportunity and Forecast, 2016-2032
- 9.1. Middle East & Africa Anemia Treatment Market Analysis, 2016-2021
- 9.2. Middle East & Africa Anemia Treatment Market Opportunity and Forecast, 2023-2032
- 9.3. Middle East & Africa Anemia Treatment Market Analysis, Opportunity and Forecast, By Type, 2016-2032
- 9.3.1. Middle East & Africa Anemia Treatment Market Analysis by Type: Introduction
- 9.3.2. Market Size Absolute $ Opportunity Analysis and Forecast, By Type, 2016-2032
- 9.3.3. Iron Deficiency Anemia
- 9.3.4. Sickle Cell Anemia
- 9.3.5. Aplastic Anemia
- 9.3.6. Pernicious Anemia
- 9.3.7. Hemolytic Anemia
- 9.3.8. Others
- 9.4. Middle East & Africa Anemia Treatment Market Analysis, Opportunity and Forecast, By Therapy Type, 2016-2032
- 9.4.1. Middle East & Africa Anemia Treatment Market Analysis by Therapy Type: Introduction
- 9.4.2. Market Size Absolute $ Opportunity Analysis and Forecast, By Therapy Type, 2016-2032
- 9.4.3. Oral Iron Therapy
- 9.4.4. Parenteral Iron Therapy
- 9.4.5. Red Blood Cell Transfusion
- 9.4.6. Erythropoiesis-Stimulating Agents (ESAs)
- 9.4.7. Vitamin B12 and Folic Acid Supplements
- 9.4.8. Others
- 9.5. Middle East & Africa Anemia Treatment Market Analysis, Opportunity and Forecast, By End User, 2016-2032
- 9.5.1. Middle East & Africa Anemia Treatment Market Analysis by End User: Introduction
- 9.5.2. Market Size Absolute $ Opportunity Analysis and Forecast, By End User, 2016-2032
- 9.5.3. Hospitals
- 9.5.4. Clinics
- 9.5.5. Home Healthcare
- 9.5.6. Others
- 9.6. Middle East & Africa Anemia Treatment Market Analysis, Opportunity and Forecast, By Country , 2016-2032
- 9.6.1. Middle East & Africa Anemia Treatment Market Analysis by Country : Introduction
- 9.6.2. Market Size Absolute $ Opportunity Analysis and Forecast, Country , 2016-2032
- 9.6.2.1. Algeria
- 9.6.2.2. Egypt
- 9.6.2.3. Israel
- 9.6.2.4. Kuwait
- 9.6.2.5. Nigeria
- 9.6.2.6. Saudi Arabia
- 9.6.2.7. South Africa
- 9.6.2.8. Turkey
- 9.6.2.9. The UAE
- 9.6.2.10. Rest of MEA
- 10. Global Anemia Treatment Market Analysis, Opportunity and Forecast, By Region , 2016-2032
- 10.1. Global Anemia Treatment Market Analysis by Region : Introduction
- 10.2. Market Size Absolute $ Opportunity Analysis and Forecast, By Region , 2016-2032
- 10.2.1. North America
- 10.2.2. Western Europe
- 10.2.3. Eastern Europe
- 10.2.4. APAC
- 10.2.5. Latin America
- 10.2.6. Middle East & Africa
- 11. Global Anemia Treatment Market Competitive Landscape, Market Share Analysis, and Company Profiles
- 11.1. Market Share Analysis
- 11.2. Company Profiles
- 11.3. Amgen Inc.
- 11.3.1. Company Overview
- 11.3.2. Financial Highlights
- 11.3.3. Product Portfolio
- 11.3.4. SWOT Analysis
- 11.3.5. Key Strategies and Developments
- 11.4. Pfizer Inc.
- 11.4.1. Company Overview
- 11.4.2. Financial Highlights
- 11.4.3. Product Portfolio
- 11.4.4. SWOT Analysis
- 11.4.5. Key Strategies and Developments
- 11.5. GlaxoSmithKline plc
- 11.5.1. Company Overview
- 11.5.2. Financial Highlights
- 11.5.3. Product Portfolio
- 11.5.4. SWOT Analysis
- 11.5.5. Key Strategies and Developments
- 11.6. Novartis AG
- 11.6.1. Company Overview
- 11.6.2. Financial Highlights
- 11.6.3. Product Portfolio
- 11.6.4. SWOT Analysis
- 11.6.5. Key Strategies and Developments
- 11.7. Hoffmann-La Roche Ltd
- 11.7.1. Company Overview
- 11.7.2. Financial Highlights
- 11.7.3. Product Portfolio
- 11.7.4. SWOT Analysis
- 11.7.5. Key Strategies and Developments
- 11.8. Johnson & Johnson
- 11.8.1. Company Overview
- 11.8.2. Financial Highlights
- 11.8.3. Product Portfolio
- 11.8.4. SWOT Analysis
- 11.8.5. Key Strategies and Developments
- 11.9. Sanofi S.A.
- 11.9.1. Company Overview
- 11.9.2. Financial Highlights
- 11.9.3. Product Portfolio
- 11.9.4. SWOT Analysis
- 11.9.5. Key Strategies and Developments
- 11.10. Vifor Pharma
- 11.10.1. Company Overview
- 11.10.2. Financial Highlights
- 11.10.3. Product Portfolio
- 11.10.4. SWOT Analysis
- 11.10.5. Key Strategies and Developments
- 11.11. Daiichi Sankyo Company, Limited
- 11.11.1. Company Overview
- 11.11.2. Financial Highlights
- 11.11.3. Product Portfolio
- 11.11.4. SWOT Analysis
- 11.11.5. Key Strategies and Developments
- 11.12. Bayer AG
- 11.12.1. Company Overview
- 11.12.2. Financial Highlights
- 11.12.3. Product Portfolio
- 11.12.4. SWOT Analysis
- 11.12.5. Key Strategies and Developments
- 11.13.1. Company Overview
- 11.13.2. Financial Highlights
- 11.13.3. Product Portfolio
- 11.13.4. SWOT Analysis
- 11.13.5. Key Strategies and Developments
- 11.14. Akebia Therapeutics
- 11.14.1. Company Overview
- 11.14.2. Financial Highlights
- 11.14.3. Product Portfolio
- 11.14.4. SWOT Analysis
- 11.14.5. Key Strategies and Developments
- 11.15. FibroGen, Inc.
- 11.15.1. Company Overview
- 11.15.2. Financial Highlights
- 11.15.3. Product Portfolio
- 11.15.4. SWOT Analysis
- 11.15.5. Key Strategies and Developments
- 11.16. Pieris Pharmaceuticals
- 11.16.1. Company Overview
- 11.16.2. Financial Highlights
- 11.16.3. Product Portfolio
- 11.16.4. SWOT Analysis
- 11.16.5. Key Strategies and Developments
- 11.17. Biocon Limited
- 11.17.1. Company Overview
- 11.17.2. Financial Highlights
- 11.17.3. Product Portfolio
- 11.17.4. SWOT Analysis
- 11.17.5. Key Strategies and Developments
- 12. Assumptions and Acronyms
- 13. Research Methodology
- 14. Contact
"
- List of Figures
- "
- Figure 1: Global Anemia Treatment Market Revenue (US$ Mn) Market Share by Type in 2022
- Figure 2: Global Anemia Treatment Market Attractiveness Analysis by Type, 2016-2032
- Figure 3: Global Anemia Treatment Market Revenue (US$ Mn) Market Share by Therapy Typein 2022
- Figure 4: Global Anemia Treatment Market Attractiveness Analysis by Therapy Type, 2016-2032
- Figure 5: Global Anemia Treatment Market Revenue (US$ Mn) Market Share by End Userin 2022
- Figure 6: Global Anemia Treatment Market Attractiveness Analysis by End User, 2016-2032
- Figure 7: Global Anemia Treatment Market Revenue (US$ Mn) Market Share by Region in 2022
- Figure 8: Global Anemia Treatment Market Attractiveness Analysis by Region, 2016-2032
- Figure 9: Global Anemia Treatment Market Revenue (US$ Mn) (2016-2032)
- Figure 10: Global Anemia Treatment Market Revenue (US$ Mn) Comparison by Region (2016-2032)
- Figure 11: Global Anemia Treatment Market Revenue (US$ Mn) Comparison by Type (2016-2032)
- Figure 12: Global Anemia Treatment Market Revenue (US$ Mn) Comparison by Therapy Type (2016-2032)
- Figure 13: Global Anemia Treatment Market Revenue (US$ Mn) Comparison by End User (2016-2032)
- Figure 14: Global Anemia Treatment Market Y-o-Y Growth Rate Comparison by Region (2016-2032)
- Figure 15: Global Anemia Treatment Market Y-o-Y Growth Rate Comparison by Type (2016-2032)
- Figure 16: Global Anemia Treatment Market Y-o-Y Growth Rate Comparison by Therapy Type (2016-2032)
- Figure 17: Global Anemia Treatment Market Y-o-Y Growth Rate Comparison by End User (2016-2032)
- Figure 18: Global Anemia Treatment Market Share Comparison by Region (2016-2032)
- Figure 19: Global Anemia Treatment Market Share Comparison by Type (2016-2032)
- Figure 20: Global Anemia Treatment Market Share Comparison by Therapy Type (2016-2032)
- Figure 21: Global Anemia Treatment Market Share Comparison by End User (2016-2032)
- Figure 22: North America Anemia Treatment Market Revenue (US$ Mn) Market Share by Typein 2022
- Figure 23: North America Anemia Treatment Market Attractiveness Analysis by Type, 2016-2032
- Figure 24: North America Anemia Treatment Market Revenue (US$ Mn) Market Share by Therapy Typein 2022
- Figure 25: North America Anemia Treatment Market Attractiveness Analysis by Therapy Type, 2016-2032
- Figure 26: North America Anemia Treatment Market Revenue (US$ Mn) Market Share by End Userin 2022
- Figure 27: North America Anemia Treatment Market Attractiveness Analysis by End User, 2016-2032
- Figure 28: North America Anemia Treatment Market Revenue (US$ Mn) Market Share by Country in 2022
- Figure 29: North America Anemia Treatment Market Attractiveness Analysis by Country, 2016-2032
- Figure 30: North America Anemia Treatment Market Revenue (US$ Mn) (2016-2032)
- Figure 31: North America Anemia Treatment Market Revenue (US$ Mn) Comparison by Country (2016-2032)
- Figure 32: North America Anemia Treatment Market Revenue (US$ Mn) Comparison by Type (2016-2032)
- Figure 33: North America Anemia Treatment Market Revenue (US$ Mn) Comparison by Therapy Type (2016-2032)
- Figure 34: North America Anemia Treatment Market Revenue (US$ Mn) Comparison by End User (2016-2032)
- Figure 35: North America Anemia Treatment Market Y-o-Y Growth Rate Comparison by Country (2016-2032)
- Figure 36: North America Anemia Treatment Market Y-o-Y Growth Rate Comparison by Type (2016-2032)
- Figure 37: North America Anemia Treatment Market Y-o-Y Growth Rate Comparison by Therapy Type (2016-2032)
- Figure 38: North America Anemia Treatment Market Y-o-Y Growth Rate Comparison by End User (2016-2032)
- Figure 39: North America Anemia Treatment Market Share Comparison by Country (2016-2032)
- Figure 40: North America Anemia Treatment Market Share Comparison by Type (2016-2032)
- Figure 41: North America Anemia Treatment Market Share Comparison by Therapy Type (2016-2032)
- Figure 42: North America Anemia Treatment Market Share Comparison by End User (2016-2032)
- Figure 43: Western Europe Anemia Treatment Market Revenue (US$ Mn) Market Share by Typein 2022
- Figure 44: Western Europe Anemia Treatment Market Attractiveness Analysis by Type, 2016-2032
- Figure 45: Western Europe Anemia Treatment Market Revenue (US$ Mn) Market Share by Therapy Typein 2022
- Figure 46: Western Europe Anemia Treatment Market Attractiveness Analysis by Therapy Type, 2016-2032
- Figure 47: Western Europe Anemia Treatment Market Revenue (US$ Mn) Market Share by End Userin 2022
- Figure 48: Western Europe Anemia Treatment Market Attractiveness Analysis by End User, 2016-2032
- Figure 49: Western Europe Anemia Treatment Market Revenue (US$ Mn) Market Share by Country in 2022
- Figure 50: Western Europe Anemia Treatment Market Attractiveness Analysis by Country, 2016-2032
- Figure 51: Western Europe Anemia Treatment Market Revenue (US$ Mn) (2016-2032)
- Figure 52: Western Europe Anemia Treatment Market Revenue (US$ Mn) Comparison by Country (2016-2032)
- Figure 53: Western Europe Anemia Treatment Market Revenue (US$ Mn) Comparison by Type (2016-2032)
- Figure 54: Western Europe Anemia Treatment Market Revenue (US$ Mn) Comparison by Therapy Type (2016-2032)
- Figure 55: Western Europe Anemia Treatment Market Revenue (US$ Mn) Comparison by End User (2016-2032)
- Figure 56: Western Europe Anemia Treatment Market Y-o-Y Growth Rate Comparison by Country (2016-2032)
- Figure 57: Western Europe Anemia Treatment Market Y-o-Y Growth Rate Comparison by Type (2016-2032)
- Figure 58: Western Europe Anemia Treatment Market Y-o-Y Growth Rate Comparison by Therapy Type (2016-2032)
- Figure 59: Western Europe Anemia Treatment Market Y-o-Y Growth Rate Comparison by End User (2016-2032)
- Figure 60: Western Europe Anemia Treatment Market Share Comparison by Country (2016-2032)
- Figure 61: Western Europe Anemia Treatment Market Share Comparison by Type (2016-2032)
- Figure 62: Western Europe Anemia Treatment Market Share Comparison by Therapy Type (2016-2032)
- Figure 63: Western Europe Anemia Treatment Market Share Comparison by End User (2016-2032)
- Figure 64: Eastern Europe Anemia Treatment Market Revenue (US$ Mn) Market Share by Typein 2022
- Figure 65: Eastern Europe Anemia Treatment Market Attractiveness Analysis by Type, 2016-2032
- Figure 66: Eastern Europe Anemia Treatment Market Revenue (US$ Mn) Market Share by Therapy Typein 2022
- Figure 67: Eastern Europe Anemia Treatment Market Attractiveness Analysis by Therapy Type, 2016-2032
- Figure 68: Eastern Europe Anemia Treatment Market Revenue (US$ Mn) Market Share by End Userin 2022
- Figure 69: Eastern Europe Anemia Treatment Market Attractiveness Analysis by End User, 2016-2032
- Figure 70: Eastern Europe Anemia Treatment Market Revenue (US$ Mn) Market Share by Country in 2022
- Figure 71: Eastern Europe Anemia Treatment Market Attractiveness Analysis by Country, 2016-2032
- Figure 72: Eastern Europe Anemia Treatment Market Revenue (US$ Mn) (2016-2032)
- Figure 73: Eastern Europe Anemia Treatment Market Revenue (US$ Mn) Comparison by Country (2016-2032)
- Figure 74: Eastern Europe Anemia Treatment Market Revenue (US$ Mn) Comparison by Type (2016-2032)
- Figure 75: Eastern Europe Anemia Treatment Market Revenue (US$ Mn) Comparison by Therapy Type (2016-2032)
- Figure 76: Eastern Europe Anemia Treatment Market Revenue (US$ Mn) Comparison by End User (2016-2032)
- Figure 77: Eastern Europe Anemia Treatment Market Y-o-Y Growth Rate Comparison by Country (2016-2032)
- Figure 78: Eastern Europe Anemia Treatment Market Y-o-Y Growth Rate Comparison by Type (2016-2032)
- Figure 79: Eastern Europe Anemia Treatment Market Y-o-Y Growth Rate Comparison by Therapy Type (2016-2032)
- Figure 80: Eastern Europe Anemia Treatment Market Y-o-Y Growth Rate Comparison by End User (2016-2032)
- Figure 81: Eastern Europe Anemia Treatment Market Share Comparison by Country (2016-2032)
- Figure 82: Eastern Europe Anemia Treatment Market Share Comparison by Type (2016-2032)
- Figure 83: Eastern Europe Anemia Treatment Market Share Comparison by Therapy Type (2016-2032)
- Figure 84: Eastern Europe Anemia Treatment Market Share Comparison by End User (2016-2032)
- Figure 85: APAC Anemia Treatment Market Revenue (US$ Mn) Market Share by Typein 2022
- Figure 86: APAC Anemia Treatment Market Attractiveness Analysis by Type, 2016-2032
- Figure 87: APAC Anemia Treatment Market Revenue (US$ Mn) Market Share by Therapy Typein 2022
- Figure 88: APAC Anemia Treatment Market Attractiveness Analysis by Therapy Type, 2016-2032
- Figure 89: APAC Anemia Treatment Market Revenue (US$ Mn) Market Share by End Userin 2022
- Figure 90: APAC Anemia Treatment Market Attractiveness Analysis by End User, 2016-2032
- Figure 91: APAC Anemia Treatment Market Revenue (US$ Mn) Market Share by Country in 2022
- Figure 92: APAC Anemia Treatment Market Attractiveness Analysis by Country, 2016-2032
- Figure 93: APAC Anemia Treatment Market Revenue (US$ Mn) (2016-2032)
- Figure 94: APAC Anemia Treatment Market Revenue (US$ Mn) Comparison by Country (2016-2032)
- Figure 95: APAC Anemia Treatment Market Revenue (US$ Mn) Comparison by Type (2016-2032)
- Figure 96: APAC Anemia Treatment Market Revenue (US$ Mn) Comparison by Therapy Type (2016-2032)
- Figure 97: APAC Anemia Treatment Market Revenue (US$ Mn) Comparison by End User (2016-2032)
- Figure 98: APAC Anemia Treatment Market Y-o-Y Growth Rate Comparison by Country (2016-2032)
- Figure 99: APAC Anemia Treatment Market Y-o-Y Growth Rate Comparison by Type (2016-2032)
- Figure 100: APAC Anemia Treatment Market Y-o-Y Growth Rate Comparison by Therapy Type (2016-2032)
- Figure 101: APAC Anemia Treatment Market Y-o-Y Growth Rate Comparison by End User (2016-2032)
- Figure 102: APAC Anemia Treatment Market Share Comparison by Country (2016-2032)
- Figure 103: APAC Anemia Treatment Market Share Comparison by Type (2016-2032)
- Figure 104: APAC Anemia Treatment Market Share Comparison by Therapy Type (2016-2032)
- Figure 105: APAC Anemia Treatment Market Share Comparison by End User (2016-2032)
- Figure 106: Latin America Anemia Treatment Market Revenue (US$ Mn) Market Share by Typein 2022
- Figure 107: Latin America Anemia Treatment Market Attractiveness Analysis by Type, 2016-2032
- Figure 108: Latin America Anemia Treatment Market Revenue (US$ Mn) Market Share by Therapy Typein 2022
- Figure 109: Latin America Anemia Treatment Market Attractiveness Analysis by Therapy Type, 2016-2032
- Figure 110: Latin America Anemia Treatment Market Revenue (US$ Mn) Market Share by End Userin 2022
- Figure 111: Latin America Anemia Treatment Market Attractiveness Analysis by End User, 2016-2032
- Figure 112: Latin America Anemia Treatment Market Revenue (US$ Mn) Market Share by Country in 2022
- Figure 113: Latin America Anemia Treatment Market Attractiveness Analysis by Country, 2016-2032
- Figure 114: Latin America Anemia Treatment Market Revenue (US$ Mn) (2016-2032)
- Figure 115: Latin America Anemia Treatment Market Revenue (US$ Mn) Comparison by Country (2016-2032)
- Figure 116: Latin America Anemia Treatment Market Revenue (US$ Mn) Comparison by Type (2016-2032)
- Figure 117: Latin America Anemia Treatment Market Revenue (US$ Mn) Comparison by Therapy Type (2016-2032)
- Figure 118: Latin America Anemia Treatment Market Revenue (US$ Mn) Comparison by End User (2016-2032)
- Figure 119: Latin America Anemia Treatment Market Y-o-Y Growth Rate Comparison by Country (2016-2032)
- Figure 120: Latin America Anemia Treatment Market Y-o-Y Growth Rate Comparison by Type (2016-2032)
- Figure 121: Latin America Anemia Treatment Market Y-o-Y Growth Rate Comparison by Therapy Type (2016-2032)
- Figure 122: Latin America Anemia Treatment Market Y-o-Y Growth Rate Comparison by End User (2016-2032)
- Figure 123: Latin America Anemia Treatment Market Share Comparison by Country (2016-2032)
- Figure 124: Latin America Anemia Treatment Market Share Comparison by Type (2016-2032)
- Figure 125: Latin America Anemia Treatment Market Share Comparison by Therapy Type (2016-2032)
- Figure 126: Latin America Anemia Treatment Market Share Comparison by End User (2016-2032)
- Figure 127: Middle East & Africa Anemia Treatment Market Revenue (US$ Mn) Market Share by Typein 2022
- Figure 128: Middle East & Africa Anemia Treatment Market Attractiveness Analysis by Type, 2016-2032
- Figure 129: Middle East & Africa Anemia Treatment Market Revenue (US$ Mn) Market Share by Therapy Typein 2022
- Figure 130: Middle East & Africa Anemia Treatment Market Attractiveness Analysis by Therapy Type, 2016-2032
- Figure 131: Middle East & Africa Anemia Treatment Market Revenue (US$ Mn) Market Share by End Userin 2022
- Figure 132: Middle East & Africa Anemia Treatment Market Attractiveness Analysis by End User, 2016-2032
- Figure 133: Middle East & Africa Anemia Treatment Market Revenue (US$ Mn) Market Share by Country in 2022
- Figure 134: Middle East & Africa Anemia Treatment Market Attractiveness Analysis by Country, 2016-2032
- Figure 135: Middle East & Africa Anemia Treatment Market Revenue (US$ Mn) (2016-2032)
- Figure 136: Middle East & Africa Anemia Treatment Market Revenue (US$ Mn) Comparison by Country (2016-2032)
- Figure 137: Middle East & Africa Anemia Treatment Market Revenue (US$ Mn) Comparison by Type (2016-2032)
- Figure 138: Middle East & Africa Anemia Treatment Market Revenue (US$ Mn) Comparison by Therapy Type (2016-2032)
- Figure 139: Middle East & Africa Anemia Treatment Market Revenue (US$ Mn) Comparison by End User (2016-2032)
- Figure 140: Middle East & Africa Anemia Treatment Market Y-o-Y Growth Rate Comparison by Country (2016-2032)
- Figure 141: Middle East & Africa Anemia Treatment Market Y-o-Y Growth Rate Comparison by Type (2016-2032)
- Figure 142: Middle East & Africa Anemia Treatment Market Y-o-Y Growth Rate Comparison by Therapy Type (2016-2032)
- Figure 143: Middle East & Africa Anemia Treatment Market Y-o-Y Growth Rate Comparison by End User (2016-2032)
- Figure 144: Middle East & Africa Anemia Treatment Market Share Comparison by Country (2016-2032)
- Figure 145: Middle East & Africa Anemia Treatment Market Share Comparison by Type (2016-2032)
- Figure 146: Middle East & Africa Anemia Treatment Market Share Comparison by Therapy Type (2016-2032)
- Figure 147: Middle East & Africa Anemia Treatment Market Share Comparison by End User (2016-2032)
"
- List of Tables
- "
- Table 1: Global Anemia Treatment Market Comparison by Type (2016-2032)
- Table 2: Global Anemia Treatment Market Comparison by Therapy Type (2016-2032)
- Table 3: Global Anemia Treatment Market Comparison by End User (2016-2032)
- Table 4: Global Anemia Treatment Market Revenue (US$ Mn) Comparison by Region (2016-2032)
- Table 5: Global Anemia Treatment Market Revenue (US$ Mn) (2016-2032)
- Table 6: Global Anemia Treatment Market Revenue (US$ Mn) Comparison by Region (2016-2032)
- Table 7: Global Anemia Treatment Market Revenue (US$ Mn) Comparison by Type (2016-2032)
- Table 8: Global Anemia Treatment Market Revenue (US$ Mn) Comparison by Therapy Type (2016-2032)
- Table 9: Global Anemia Treatment Market Revenue (US$ Mn) Comparison by End User (2016-2032)
- Table 10: Global Anemia Treatment Market Y-o-Y Growth Rate Comparison by Region (2016-2032)
- Table 11: Global Anemia Treatment Market Y-o-Y Growth Rate Comparison by Type (2016-2032)
- Table 12: Global Anemia Treatment Market Y-o-Y Growth Rate Comparison by Therapy Type (2016-2032)
- Table 13: Global Anemia Treatment Market Y-o-Y Growth Rate Comparison by End User (2016-2032)
- Table 14: Global Anemia Treatment Market Share Comparison by Region (2016-2032)
- Table 15: Global Anemia Treatment Market Share Comparison by Type (2016-2032)
- Table 16: Global Anemia Treatment Market Share Comparison by Therapy Type (2016-2032)
- Table 17: Global Anemia Treatment Market Share Comparison by End User (2016-2032)
- Table 18: North America Anemia Treatment Market Comparison by Therapy Type (2016-2032)
- Table 19: North America Anemia Treatment Market Comparison by End User (2016-2032)
- Table 20: North America Anemia Treatment Market Revenue (US$ Mn) Comparison by Country (2016-2032)
- Table 21: North America Anemia Treatment Market Revenue (US$ Mn) (2016-2032)
- Table 22: North America Anemia Treatment Market Revenue (US$ Mn) Comparison by Country (2016-2032)
- Table 23: North America Anemia Treatment Market Revenue (US$ Mn) Comparison by Type (2016-2032)
- Table 24: North America Anemia Treatment Market Revenue (US$ Mn) Comparison by Therapy Type (2016-2032)
- Table 25: North America Anemia Treatment Market Revenue (US$ Mn) Comparison by End User (2016-2032)
- Table 26: North America Anemia Treatment Market Y-o-Y Growth Rate Comparison by Country (2016-2032)
- Table 27: North America Anemia Treatment Market Y-o-Y Growth Rate Comparison by Type (2016-2032)
- Table 28: North America Anemia Treatment Market Y-o-Y Growth Rate Comparison by Therapy Type (2016-2032)
- Table 29: North America Anemia Treatment Market Y-o-Y Growth Rate Comparison by End User (2016-2032)
- Table 30: North America Anemia Treatment Market Share Comparison by Country (2016-2032)
- Table 31: North America Anemia Treatment Market Share Comparison by Type (2016-2032)
- Table 32: North America Anemia Treatment Market Share Comparison by Therapy Type (2016-2032)
- Table 33: North America Anemia Treatment Market Share Comparison by End User (2016-2032)
- Table 34: Western Europe Anemia Treatment Market Comparison by Type (2016-2032)
- Table 35: Western Europe Anemia Treatment Market Comparison by Therapy Type (2016-2032)
- Table 36: Western Europe Anemia Treatment Market Comparison by End User (2016-2032)
- Table 37: Western Europe Anemia Treatment Market Revenue (US$ Mn) Comparison by Country (2016-2032)
- Table 38: Western Europe Anemia Treatment Market Revenue (US$ Mn) (2016-2032)
- Table 39: Western Europe Anemia Treatment Market Revenue (US$ Mn) Comparison by Country (2016-2032)
- Table 40: Western Europe Anemia Treatment Market Revenue (US$ Mn) Comparison by Type (2016-2032)
- Table 41: Western Europe Anemia Treatment Market Revenue (US$ Mn) Comparison by Therapy Type (2016-2032)
- Table 42: Western Europe Anemia Treatment Market Revenue (US$ Mn) Comparison by End User (2016-2032)
- Table 43: Western Europe Anemia Treatment Market Y-o-Y Growth Rate Comparison by Country (2016-2032)
- Table 44: Western Europe Anemia Treatment Market Y-o-Y Growth Rate Comparison by Type (2016-2032)
- Table 45: Western Europe Anemia Treatment Market Y-o-Y Growth Rate Comparison by Therapy Type (2016-2032)
- Table 46: Western Europe Anemia Treatment Market Y-o-Y Growth Rate Comparison by End User (2016-2032)
- Table 47: Western Europe Anemia Treatment Market Share Comparison by Country (2016-2032)
- Table 48: Western Europe Anemia Treatment Market Share Comparison by Type (2016-2032)
- Table 49: Western Europe Anemia Treatment Market Share Comparison by Therapy Type (2016-2032)
- Table 50: Western Europe Anemia Treatment Market Share Comparison by End User (2016-2032)
- Table 51: Eastern Europe Anemia Treatment Market Comparison by Type (2016-2032)
- Table 52: Eastern Europe Anemia Treatment Market Comparison by Therapy Type (2016-2032)
- Table 53: Eastern Europe Anemia Treatment Market Comparison by End User (2016-2032)
- Table 54: Eastern Europe Anemia Treatment Market Revenue (US$ Mn) Comparison by Country (2016-2032)
- Table 55: Eastern Europe Anemia Treatment Market Revenue (US$ Mn) (2016-2032)
- Table 56: Eastern Europe Anemia Treatment Market Revenue (US$ Mn) Comparison by Country (2016-2032)
- Table 57: Eastern Europe Anemia Treatment Market Revenue (US$ Mn) Comparison by Type (2016-2032)
- Table 58: Eastern Europe Anemia Treatment Market Revenue (US$ Mn) Comparison by Therapy Type (2016-2032)
- Table 59: Eastern Europe Anemia Treatment Market Revenue (US$ Mn) Comparison by End User (2016-2032)
- Table 60: Eastern Europe Anemia Treatment Market Y-o-Y Growth Rate Comparison by Country (2016-2032)
- Table 61: Eastern Europe Anemia Treatment Market Y-o-Y Growth Rate Comparison by Type (2016-2032)
- Table 62: Eastern Europe Anemia Treatment Market Y-o-Y Growth Rate Comparison by Therapy Type (2016-2032)
- Table 63: Eastern Europe Anemia Treatment Market Y-o-Y Growth Rate Comparison by End User (2016-2032)
- Table 64: Eastern Europe Anemia Treatment Market Share Comparison by Country (2016-2032)
- Table 65: Eastern Europe Anemia Treatment Market Share Comparison by Type (2016-2032)
- Table 66: Eastern Europe Anemia Treatment Market Share Comparison by Therapy Type (2016-2032)
- Table 67: Eastern Europe Anemia Treatment Market Share Comparison by End User (2016-2032)
- Table 68: APAC Anemia Treatment Market Comparison by Type (2016-2032)
- Table 69: APAC Anemia Treatment Market Comparison by Therapy Type (2016-2032)
- Table 70: APAC Anemia Treatment Market Comparison by End User (2016-2032)
- Table 71: APAC Anemia Treatment Market Revenue (US$ Mn) Comparison by Country (2016-2032)
- Table 72: APAC Anemia Treatment Market Revenue (US$ Mn) (2016-2032)
- Table 73: APAC Anemia Treatment Market Revenue (US$ Mn) Comparison by Country (2016-2032)
- Table 74: APAC Anemia Treatment Market Revenue (US$ Mn) Comparison by Type (2016-2032)
- Table 75: APAC Anemia Treatment Market Revenue (US$ Mn) Comparison by Therapy Type (2016-2032)
- Table 76: APAC Anemia Treatment Market Revenue (US$ Mn) Comparison by End User (2016-2032)
- Table 77: APAC Anemia Treatment Market Y-o-Y Growth Rate Comparison by Country (2016-2032)
- Table 78: APAC Anemia Treatment Market Y-o-Y Growth Rate Comparison by Type (2016-2032)
- Table 79: APAC Anemia Treatment Market Y-o-Y Growth Rate Comparison by Therapy Type (2016-2032)
- Table 80: APAC Anemia Treatment Market Y-o-Y Growth Rate Comparison by End User (2016-2032)
- Table 81: APAC Anemia Treatment Market Share Comparison by Country (2016-2032)
- Table 82: APAC Anemia Treatment Market Share Comparison by Type (2016-2032)
- Table 83: APAC Anemia Treatment Market Share Comparison by Therapy Type (2016-2032)
- Table 84: APAC Anemia Treatment Market Share Comparison by End User (2016-2032)
- Table 85: Latin America Anemia Treatment Market Comparison by Type (2016-2032)
- Table 86: Latin America Anemia Treatment Market Comparison by Therapy Type (2016-2032)
- Table 87: Latin America Anemia Treatment Market Comparison by End User (2016-2032)
- Table 88: Latin America Anemia Treatment Market Revenue (US$ Mn) Comparison by Country (2016-2032)
- Table 89: Latin America Anemia Treatment Market Revenue (US$ Mn) (2016-2032)
- Table 90: Latin America Anemia Treatment Market Revenue (US$ Mn) Comparison by Country (2016-2032)
- Table 91: Latin America Anemia Treatment Market Revenue (US$ Mn) Comparison by Type (2016-2032)
- Table 92: Latin America Anemia Treatment Market Revenue (US$ Mn) Comparison by Therapy Type (2016-2032)
- Table 93: Latin America Anemia Treatment Market Revenue (US$ Mn) Comparison by End User (2016-2032)
- Table 94: Latin America Anemia Treatment Market Y-o-Y Growth Rate Comparison by Country (2016-2032)
- Table 95: Latin America Anemia Treatment Market Y-o-Y Growth Rate Comparison by Type (2016-2032)
- Table 96: Latin America Anemia Treatment Market Y-o-Y Growth Rate Comparison by Therapy Type (2016-2032)
- Table 97: Latin America Anemia Treatment Market Y-o-Y Growth Rate Comparison by End User (2016-2032)
- Table 98: Latin America Anemia Treatment Market Share Comparison by Country (2016-2032)
- Table 99: Latin America Anemia Treatment Market Share Comparison by Type (2016-2032)
- Table 100: Latin America Anemia Treatment Market Share Comparison by Therapy Type (2016-2032)
- Table 101: Latin America Anemia Treatment Market Share Comparison by End User (2016-2032)
- Table 102: Middle East & Africa Anemia Treatment Market Comparison by Type (2016-2032)
- Table 103: Middle East & Africa Anemia Treatment Market Comparison by Therapy Type (2016-2032)
- Table 104: Middle East & Africa Anemia Treatment Market Comparison by End User (2016-2032)
- Table 105: Middle East & Africa Anemia Treatment Market Revenue (US$ Mn) Comparison by Country (2016-2032)
- Table 106: Middle East & Africa Anemia Treatment Market Revenue (US$ Mn) (2016-2032)
- Table 107: Middle East & Africa Anemia Treatment Market Revenue (US$ Mn) Comparison by Country (2016-2032)
- Table 108: Middle East & Africa Anemia Treatment Market Revenue (US$ Mn) Comparison by Type (2016-2032)
- Table 109: Middle East & Africa Anemia Treatment Market Revenue (US$ Mn) Comparison by Therapy Type (2016-2032)
- Table 110: Middle East & Africa Anemia Treatment Market Revenue (US$ Mn) Comparison by End User (2016-2032)
- Table 111: Middle East & Africa Anemia Treatment Market Y-o-Y Growth Rate Comparison by Country (2016-2032)
- Table 112: Middle East & Africa Anemia Treatment Market Y-o-Y Growth Rate Comparison by Type (2016-2032)
- Table 113: Middle East & Africa Anemia Treatment Market Y-o-Y Growth Rate Comparison by Therapy Type (2016-2032)
- Table 114: Middle East & Africa Anemia Treatment Market Y-o-Y Growth Rate Comparison by End User (2016-2032)
- Table 115: Middle East & Africa Anemia Treatment Market Share Comparison by Country (2016-2032)
- Table 116: Middle East & Africa Anemia Treatment Market Share Comparison by Type (2016-2032)
- Table 117: Middle East & Africa Anemia Treatment Market Share Comparison by Therapy Type (2016-2032)
- Table 118: Middle East & Africa Anemia Treatment Market Share Comparison by End User (2016-2032)
- 1. Executive Summary
-
- Amgen Inc.
- Pfizer Inc.
- GlaxoSmithKline plc
- Novartis AG
- Hoffmann-La Roche Ltd
- Johnson & Johnson
- Sanofi S.A.
- Vifor Pharma
- Daiichi Sankyo Company, Limited
- Bayer AG
- Akebia Therapeutics
- Rockwell Medical, Inc.
- FibroGen, Inc.
- Pieris Pharmaceuticals
- Biocon Limited
Our Clients


View Our Licence Options
