
American Football Gear Market Report By Product Type (Helmets, Shoulder Pads, Gloves, Protective Clothing, Footwear, Other Accessories), By Material Type (Synthetic, Leather, Hybrid), By Distribution Channel (Online Retail, Offline Retail [Sporting Goods Stores, Department Stores, Others]), By End User (Professional, Amateur), By Region and Companies - Industry Segment Outlook, Market Assessment, Competition Scenario, Trends and Forecast 2024-2033
-
15203
-
July 2024
-
325
-


-
This report was compiled by Research Team Research team of over 50 passionate professionals leverages advanced research methodologies and analytical expertise to deliver insightful, data-driven market intelligence that empowers businesses across diverse industries to make strategic, well-informed Correspondence Research Team Linkedin | Detailed Market research Methodology Our methodology involves a mix of primary research, including interviews with leading mental health experts, and secondary research from reputable medical journals and databases. View Detailed Methodology Page
-
Quick Navigation
Report Overview
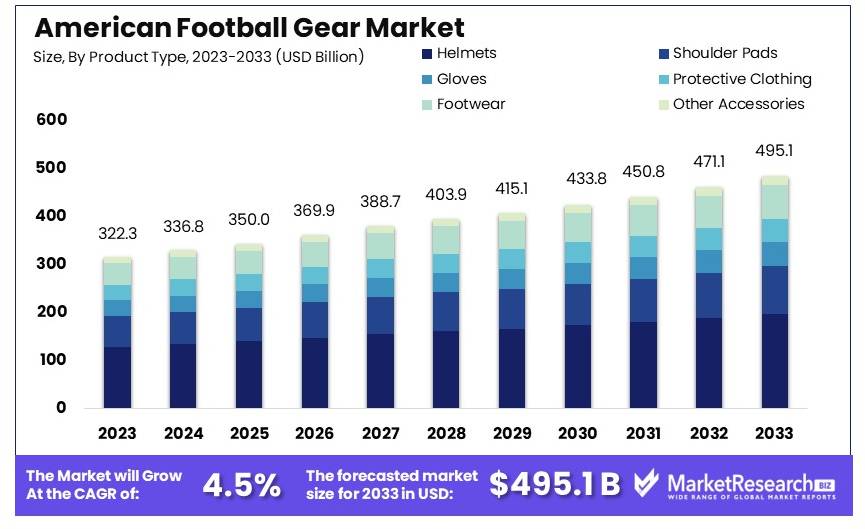
The Global American Football Gear Market size is expected to be worth around USD 495.1 Billion by 2033, from USD 322.3 Billion in 2023, growing at a CAGR of 4.5% during the forecast period from 2024 to 2033.
The American football gear market includes equipment used by players for safety and performance. This market covers helmets, shoulder pads, gloves, and footwear. It is essential for protecting players and enhancing their game. The market targets professional leagues, college teams, and amateur players.
Key drivers of this market are the increasing popularity of football and rising awareness of player safety. Technological advancements in materials and design are also fueling growth. Companies are focusing on developing lightweight, durable, and high-performance gear. Major brands in this market are investing in research to improve safety features and comfort.
The American football gear market is witnessing robust growth, driven by the sport's increasing popularity and rising viewership. The NFL reported an average viewership of 17.9 million for regular-season games, marking a 7% increase from the previous year. This surge in viewership reflects a growing fan base, which in turn boosts demand for football gear.
CBS's average of 19.3 million viewers, the highest since 1998, further underscores the sport's expanding reach. High viewership translates into greater visibility for the sport, encouraging both amateur and professional players to invest in high-quality gear. This trend is reinforced by the Super Bowl LVIII, which reached approximately 210 million viewers in the United States, highlighting the massive audience engagement.
The market for American football gear includes helmets, pads, gloves, footwear, and apparel. Safety concerns and the emphasis on player protection drive the demand for technologically advanced and high-quality gear. Innovations in materials and design enhance performance and safety, appealing to both professional athletes and recreational players.
The rising participation in youth and amateur leagues also fuels market growth. Schools, colleges, and community programs increasingly adopt stringent safety standards, further increasing the demand for reliable and durable equipment. Additionally, the influence of high-profile players and endorsements significantly impacts consumer preferences and purchasing decisions.
The American football gear market is poised for sustained growth. This is driven by increasing viewership, heightened safety awareness, and technological advancements. The expanding fan base and rising participation at all levels present significant opportunities for manufacturers and stakeholders in the industry.
Key Takeaways
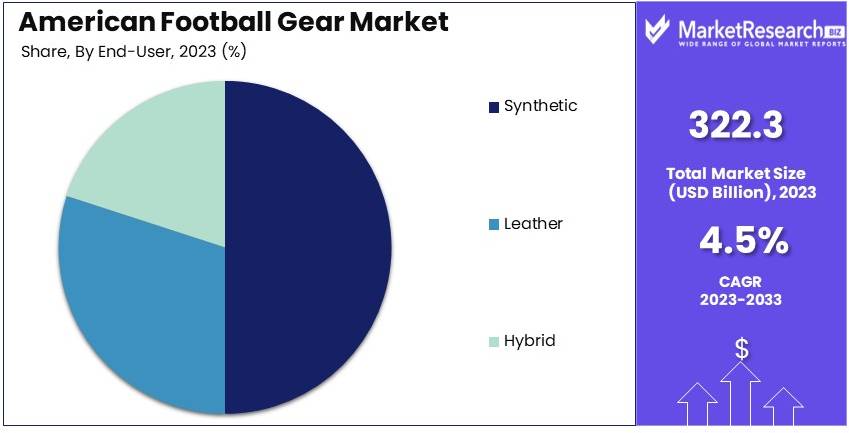
- Market Value: The American Football Gear Market was valued at USD 322.3 billion in 2023, and is expected to reach USD 495.1 billion by 2033, with a CAGR of 4.5%.
- Product Type Analysis: Helmets dominated with 40%; critical for player safety.
- Material Type Analysis: Synthetic materials led with 50%; important for durability and performance.
- Distribution Channel Analysis: Offline Retail dominated with 60%; indicating strong consumer preference for in-store purchases.
- End User Analysis: Amateur Players held 55%; highlighting broad base participation in the sport.
- Dominant Region: North America led with 87%; home to major football leagues and extensive fan base.
- High Growth Region: Europe, driven by increasing popularity of American football.
- Analyst Viewpoint: Market growth is driven by innovation in safety gear and rising participation at amateur levels.
Driving Factors
Increasing Participation in Football at All Levels Drives Market Growth
The growing popularity of American football, especially among youth and high school athletes, significantly boosts the football gear market. As more individuals participate, the demand for essential protective gear such as helmets, shoulder pads, and other equipment rises. The National Federation of State High School Associations (NFHS) reported over 1 million high school football participants in the United States during the 2021-2022 season. This substantial engagement at various levels necessitates more gear to ensure player safety and compliance with sports regulations. The influx of young athletes into football programs also fuels the market for beginner and intermediate gear, providing a steady customer base for manufacturers.
The increased participation at youth levels influences the development of tailored products that meet the specific needs of younger players. Gear designed for these groups often prioritizes safety, comfort, and affordability. This demand encourages manufacturers to innovate and improve the quality of their products, thus fostering market growth. Moreover, the social and cultural importance of football in the United States sustains interest in the sport, thereby continually driving the need for football gear.
Emphasis on Player Safety and Injury Prevention Drives Market Growth
Heightened awareness of the risks associated with concussions and other injuries in football has intensified the focus on player safety, thereby driving the demand for advanced football gear. Companies like Riddell and Xenith are leading the market with innovative helmet designs incorporating specialized foams and shock-absorption systems. These advancements aim to reduce the impact of collisions and enhance overall player protection. This focus on safety not only attracts more players to the sport, reassuring them and their families about the reduced risks but also encourages current players to upgrade their gear more frequently.
As research highlights the long-term effects of football-related injuries, regulatory bodies and sports organizations mandate the use of safer equipment. This regulatory push further propels the market, compelling schools, clubs, and professional teams to invest in the latest protective gear. The continuous improvement and adoption of safety technologies in football gear ensure sustained market growth by aligning with broader trends in health and safety.
Product Innovation and Technological Advancements Drive Market Growth
Continuous innovation in materials, design, and manufacturing processes has resulted in more advanced and high-performance football gear, propelling market growth. Companies are heavily investing in research and development to create lighter, more durable, and more breathable equipment. The introduction of carbon fiber and composite materials in helmet construction, for instance, significantly improves strength while reducing weight. These innovations make the gear more comfortable and effective for players, enhancing their performance and safety.
Technological advancements also lead to the development of smart gear, such as helmets with sensors that monitor impact forces and provide real-time data on player health. This intersection of sports protection equipment and technology attracts tech-savvy consumers and teams looking for data-driven approaches to improve player safety and performance. The continuous stream of innovative products keeps the market dynamic and growing, as players and teams seek to gain a competitive edge through the latest gear.
Restraining Factors
Declining Participation in Youth Football Restrains Market Growth
Concerns about the long-term health impacts of concussions and head injuries have led many parents to discourage their children from playing youth football. This trend has caused a notable decline in participation, which could limit the growth of the football gear market.
A study by the Sports & Fitness Industry Association reported that participation in boys' tackle football among ages 6-18 declined by nearly 20% between 2008 and 2018. Fewer players mean lower demand for football gear, affecting sales and market expansion. Additionally, schools and local leagues may reduce their investment in football programs due to declining interest, further constraining market growth.
High Cost of Equipment Restrains Market Growth
The high cost of football gear, especially helmets and shoulder pads, can act as a barrier for many individuals and organizations. Quality gear is essential for safety but comes at a significant expense, which can be prohibitive for economically disadvantaged areas or families with limited budgets.
This financial constraint limits the market's potential, as fewer people can afford to purchase the necessary equipment. Moreover, schools and smaller football programs may struggle to equip their players adequately, reducing overall demand for football gear and stifling market growth.
Product Type Analysis
Helmets dominate with 40% due to safety concerns and technological advancements.
The American football gear market is segmented by product type into helmets, shoulder pads, gloves, protective clothing, footwear, and other accessories. Helmets hold the dominant position within this segment, accounting for approximately 40% of the market share. This dominance is primarily driven by the increasing emphasis on player safety and the technological advancements in helmet design. Companies such as Riddell and Xenith are at the forefront, developing helmets with enhanced shock absorption and impact resistance. These innovations are crucial in addressing the growing concerns about concussions and head injuries in football.
The importance of helmets in protecting players from serious injuries has led to stringent regulations and standards, further boosting their demand. Helmets are mandatory at all levels of play, from youth leagues to professional teams, ensuring a steady market for these products. Additionally, the high replacement rate of helmets, due to wear and tear and evolving safety standards, contributes to their significant market share.
Shoulder pads are another vital segment, playing a crucial role in protecting players from upper body injuries. While not as dominant as helmets, shoulder pads are essential for player safety and are a mandatory piece of equipment. The demand for advanced shoulder pads that offer better protection while maintaining flexibility and comfort is on the rise. This segment is expected to grow steadily as manufacturers continue to innovate with materials and designs.
Gloves, protective clothing, and footwear also contribute to the market, though they hold smaller shares compared to helmets and shoulder pads. Gloves enhance grip and handling of the ball, protective clothing provides additional layers of safety, and specialized footwear ensures better performance on the field. These products are essential for players but are often secondary in terms of market dominance.
Other accessories, such as mouthguards, wrist guards, and thigh pads, play supportive roles in the overall safety and performance of players. While their market share is relatively smaller, these accessories are integral to comprehensive protective gear solutions, ensuring that players are well-equipped to handle the physical demands of the sport.
Material Type Analysis
Synthetic materials dominate with 50% due to durability and cost-effectiveness.
The American football gear market is segmented by material type into synthetic, leather, and hybrid materials. Synthetic materials dominate this segment, accounting for approximately 50% of the market share. The preference for synthetic materials is driven by their durability, cost-effectiveness, and ability to be engineered for specific performance characteristics. Synthetic materials are widely used in helmets, shoulder pads, gloves, and footwear, offering a balance of strength, flexibility, and lightweight properties.
The advancements in synthetic materials, such as high-density polyethylene and advanced foams, have significantly enhanced the safety and performance of football gear. These materials are designed to absorb and dissipate impact energy, reducing the risk of injuries. Additionally, synthetic materials are often more affordable than leather, making them a popular choice among manufacturers and consumers alike.
Leather, while traditionally used in sports equipment, holds a smaller market share compared to synthetic materials. Leather is valued for its durability and comfort, particularly in gloves and protective clothing. However, its higher cost and maintenance requirements limit its widespread use in modern football gear. Leather products are often favored by professional players who seek the premium feel and performance attributes that leather provides.
Hybrid materials, combining synthetic and natural components, offer a middle ground between the two. These materials aim to leverage the strengths of both synthetic and leather materials, providing enhanced performance and comfort. Hybrid materials are gaining traction in the market, particularly in high-end gear designed for professional players. The integration of innovative materials and technology in hybrid gear is expected to drive growth in this segment.
Distribution Channel Analysis
Offline retail dominates with 60% due to personalized service and immediate product availability.
The American football gear market is segmented by distribution channel into online retail and offline retail, which includes sporting goods stores, department stores, and others. Offline retail channels dominate this segment, accounting for approximately 60% of the market share. The dominance of offline retail is attributed to the personalized service and immediate product availability they offer. Consumers often prefer to physically try on gear to ensure proper fit and comfort, making offline stores a popular choice.
Sporting goods stores are a significant part of the offline retail segment, providing a wide range of football gear and specialized services. These stores offer expert advice, fitting services, and the opportunity to test equipment, which enhances the buying experience. The trust and convenience associated with these stores contribute to their dominant market position.
Department stores also play a role in the offline retail segment, though their focus is broader than just sporting goods. These stores provide a convenient shopping experience, often combining football gear with other athletic and casual wear. While they hold a smaller share compared to sporting goods stores, department stores are accessible to a wide customer base, supporting market growth.
Online retail is growing rapidly, driven by the increasing penetration of e-commerce and the convenience it offers. Consumers can browse a wide range of products, compare prices, and read reviews from the comfort of their homes. Major e-commerce platforms and specialized sports equipment websites are expanding their offerings, making it easier for consumers to find and purchase football gear. Despite this growth, the tactile nature of football gear purchasing keeps offline retail in a leading position.
End User Analysis
Amateur segment dominates with 55% due to the large number of youth and recreational players.
The American football gear market is segmented by end user into professional and amateur players. The amateur segment dominates this market, accounting for approximately 55% of the market share. This dominance is due to the large number of youth, high school, and recreational players who require football gear. The participation in amateur football programs across the United States drives significant demand for protective equipment, ensuring steady market growth.
Amateur players include those participating in school teams, local leagues, and recreational clubs. These players often need to purchase their own gear or rely on team-provided equipment, creating a large and consistent demand. The growth in youth football programs, despite concerns about safety, continues to support the amateur segment. Schools and community programs invest in football gear to encourage participation and ensure player safety, further boosting market demand.
The professional segment, while smaller in comparison, plays a crucial role in driving innovation and setting standards for football gear. Professional players require high-performance equipment that meets stringent safety and performance criteria. The demands of professional football push manufacturers to develop advanced gear, which eventually trickles down to the amateur market. Professional teams and leagues also have higher budgets, allowing for the purchase of premium gear and frequent updates.
Both segments interact to support overall market growth. Innovations and trends from the professional level often influence the amateur market, leading to widespread adoption of advanced gear. The professional segment's emphasis on safety and performance drives continuous improvement in product design and materials, benefiting players at all levels.
Key Market Segments
By Product Type
- Helmets
- Shoulder Pads
- Gloves
- Protective Clothing
- Footwear
- Other Accessories
By Material Type
- Synthetic
- Leather
- Hybrid
By Distribution Channel
- Online Retail
- Offline Retail
- Sporting Goods Stores
- Department Stores
- Others
By End User
- Professional
- Amateur
Growth Opportunities
Expansion into International Markets Offers Growth Opportunity
While American football is predominantly popular in the United States, there is a significant opportunity for growth in international markets. Countries like Mexico, Japan, and Germany are seeing a rising interest in the sport. This global expansion presents a chance for equipment manufacturers to explore new markets and expand their customer base.
For instance, the NFL has increased its international games and partnerships, boosting the sport's visibility worldwide. As interest grows, so does the demand for football gear, providing a lucrative opportunity for manufacturers to sell helmets, pads, and other equipment abroad.
E-commerce and Direct-to-Consumer Sales Offer Growth Opportunity
The rise of e-commerce and direct-to-consumer sales channels presents a substantial growth opportunity for football gear manufacturers. Online platforms enable companies to reach a broader audience, streamline distribution, and offer personalized products. This trend has been accelerated by the COVID-19 pandemic, which has driven more consumers to shop online.
According to recent data, online sports equipment sales have surged, making it easier for consumers to purchase football gear directly from manufacturers. This shift not only expands market reach but also allows companies to offer customized gear, enhancing customer satisfaction and loyalty.
Trending Factors
Customization and Personalization Are Trending Factors
Consumers increasingly seek personalized and customized products, including football gear. Companies are offering customization options for helmets, uniforms, and other equipment, allowing players to express their individuality and team spirit. This trend aligns with the growing desire for unique and personalized experiences.
For example, manufacturers now offer custom helmet designs and personalized jerseys, which appeal to both individual players and teams. This customization trend is bolstered by advancements in technology, making it easier and more cost-effective to produce bespoke gear. As a result, the demand for personalized football equipment is on the rise, driving market growth.
Sustainability and Eco-friendly Materials Are Trending Factors
There is a growing trend towards sustainability in the sports industry, with consumers and organizations seeking eco-friendly and sustainable products. Football gear manufacturers are exploring the use of recycled or renewable materials, as well as implementing more sustainable manufacturing processes, to meet this demand.
This shift is driven by increasing environmental awareness and the desire to reduce the carbon footprint of sports activities. Companies that adopt sustainable practices are likely to attract environmentally conscious consumers and gain a competitive edge in the market. The use of eco-friendly materials not only supports environmental goals but also appeals to a new generation of consumers who prioritize sustainability.
Regional Analysis
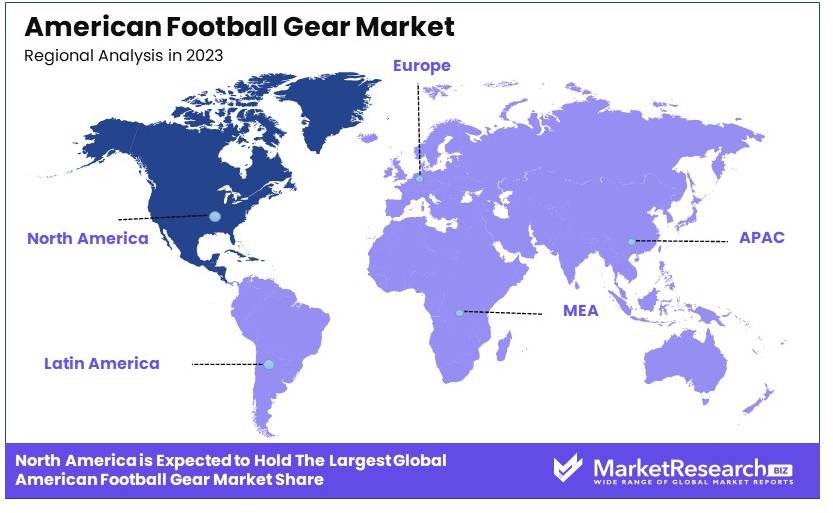
North America Dominates with 87% Market Share in the American Football Gear Market
North America's commanding 87% share in the American Football Gear market can primarily be attributed to the region's deep-rooted American football culture, with the NFL being a major influencer. High levels of participation in youth, high school, and collegiate football contribute significantly. The substantial investment in sports infrastructure and the presence of leading gear manufacturers who continually innovate and market aggressively also play critical roles in sustaining this dominance.
The dynamics of the American Football Gear market in North America are shaped by consumer preferences for high-quality, durable gear, and the increasing awareness regarding player safety. The market benefits from the established retail and online distribution channels that effectively cater to a large consumer base. Additionally, the regular introduction of new technologies and materials by local manufacturers enhances performance and comfort, further solidifying the region's lead in the market.
Given the ongoing growth of American football at all levels in North America, the region is expected to maintain a significant influence on the market. Innovations in gear, driven by safety and performance standards, will likely foster market expansion. However, emerging markets could reduce North America's global share slightly as American football gains popularity worldwide and markets like Europe and Asia Pacific start to catch up.
Regional Breakdown:
- Europe: With a market share of 5%, Europe is slowly expanding its presence in the American football gear market. The growth is fueled by increasing interest in American football, with countries like the UK and Germany developing leagues and broadcasting NFL games.
- Asia Pacific: Holding approximately 3% of the market, Asia Pacific shows potential for rapid growth due to rising interest in new sports and increasing disposable incomes, particularly in countries like Japan and Australia.
- Middle East & Africa: This region commands a modest 2% share, hindered by limited exposure to American football. However, initiatives to introduce the sport and engage youth could foster gradual market growth.
- Latin America: Despite having just 3% of the market, Latin America has a growing fan base, influenced by media coverage and targeted marketing campaigns. As the sport gains followers, the demand for football gear is expected to increase.
Key Regions and Countries
- North America
- The US
- Canada
- Mexico
- Western Europe
- Germany
- France
- The UK
- Spain
- Italy
- Portugal
- Ireland
- Austria
- Switzerland
- Benelux
- Nordic
- Rest of Western Europe
- Eastern Europe
- Russia
- Poland
- The Czech Republic
- Greece
- Rest of Eastern Europe
- APAC
- China
- Japan
- South Korea
- India
- Australia & New Zealand
- Indonesia
- Malaysia
- Philippines
- Singapore
- Thailand
- Vietnam
- Rest of APAC
- Latin America
- Brazil
- Colombia
- Chile
- Argentina
- Costa Rica
- Rest of Latin America
- Middle East & Africa
- Algeria
- Egypt
- Israel
- Kuwait
- Nigeria
- Saudi Arabia
- South Africa
- Turkey
- United Arab Emirates
- Rest of MEA
Key Players Analysis
The American Football Gear Market includes key players like Riddell, Schutt Sports, and others. These companies play a significant role in shaping market trends and consumer preferences.
Riddell and Schutt Sports lead the market with their high-quality helmets and protective gear. Their strong brand presence and innovative products position them strategically in the market.
Xenith, LLC and Adams USA focus on advanced protective technologies. Their commitment to player safety and continuous innovation enhances their market influence.
Under Armour, Inc. and Nike, Inc. offer a wide range of football apparel and gear. Their strong market presence and brand loyalty boost their influence.
Adidas AG and Douglas Pads provide high-performance gear and protective equipment. Their focus on quality and durability strengthens their market standing.
Champro Sports and Cutters Gloves offer specialized football equipment. Their innovative designs and competitive pricing impact market trends.
Shock Doctor, Inc. and VICIS, Inc. focus on advanced protective gear, emphasizing player safety. Their technological advancements and strategic positioning enhance their market influence.
Battle Sports Science and XTECH Protective Equipment provide cutting-edge protective gear. Their continuous product development and focus on safety boost their market presence.
McDavid, Inc. offers a variety of protective and performance-enhancing gear. Its commitment to quality and innovation strengthens its market standing.
In summary, these companies drive the American Football Gear Market through innovation, strategic positioning, and market influence. Their advanced technologies and strong brand presence shape the market landscape.
Market Key Players
- Riddell
- Gilbert International
- Schutt Sports
- Xenith, LLC
- Adams USA
- Under Armour, Inc.
- Nike, Inc.
- Adidas AG
- Douglas Pads
- Champro Sports
- Cutters Gloves
- Shock Doctor, Inc.
- VICIS, Inc.
- Battle Sports Science
- XTECH Protective Equipment
- McDavid, Inc.
Recent Developments
2024 / Riddell and Schutt: Riddell and Schutt have released their latest football helmets for the 2024 season. The new models include enhanced safety features and improved comfort. These helmets are designed to reduce the risk of concussions and provide better overall protection for players.
Nike: Nike has introduced the 2024 lineup of football cleats, including the popular Vapor Edge Pro 360 2 and Alpha Menace Pro 3, which feature advanced traction and stability for better performance on the field. The cleats are available in new colorways and styles.
Report Scope
Report Features Description Market Value (2023) USD 322.3 Billion Forecast Revenue (2033) USD 495.1 Billion CAGR (2024-2033) 4.5% Base Year for Estimation 2023 Historic Period 2018-2023 Forecast Period 2024-2033 Report Coverage Revenue Forecast, Market Dynamics, Competitive Landscape, Recent Developments Segments Covered By Product Type (Helmets, Shoulder Pads, Gloves, Protective Clothing, Footwear, Other Accessories), By Material Type (Synthetic, Leather, Hybrid), By Distribution Channel (Online Retail, Offline Retail [Sporting Goods Stores, Department Stores, Others]), By End User (Professional, Amateur) Regional Analysis North America - The US, Canada, & Mexico; Western Europe - Germany, France, The UK, Spain, Italy, Portugal, Ireland, Austria, Switzerland, Benelux, Nordic, & Rest of Western Europe; Eastern Europe - Russia, Poland, The Czech Republic, Greece, & Rest of Eastern Europe; APAC - China, Japan, South Korea, India, Australia & New Zealand, Indonesia, Malaysia, Philippines, Singapore, Thailand, Vietnam, & Rest of APAC; Latin America - Brazil, Colombia, Chile, Argentina, Costa Rica, & Rest of Latin America; Middle East & Africa - Algeria, Egypt, Israel, Kuwait, Nigeria, Saudi Arabia, South Africa, Turkey, United Arab Emirates, & Rest of MEA Competitive Landscape Riddell, Schutt Sports, Xenith, LLC, Adams USA, Under Armour, Inc., Nike, Inc., Adidas AG, Douglas Pads, Champro Sports, Cutters Gloves, Shock Doctor, Inc., VICIS, Inc., Battle Sports Science, XTECH Protective Equipment, McDavid, Inc. Customization Scope Customization for segments, region/country-level will be provided. Moreover, additional customization can be done based on the requirements. Purchase Options We have three licenses to opt for: Single User License, Multi-User License (Up to 5 Users), Corporate Use License (Unlimited User and Printable PDF) -
- 1. Executive Summary
- 1.1. Definition
- 1.2. Taxonomy
- 1.3. Research Scope
- 1.4. Key Analysis
- 1.5. Key Findings by Major Segments
- 1.6. Top strategies by Major Players
- 2. Global American Football Gear Market Overview
- 2.1. American Football Gear Market Dynamics
- 2.1.1. Drivers
- 2.1.2. Opportunities
- 2.1.3. Restraints
- 2.1.4. Challenges
- 2.2. Macro-economic Factors
- 2.3. Regulatory Framework
- 2.4. Market Investment Feasibility Index
- 2.5. PEST Analysis
- 2.6. PORTER’S Five Force Analysis
- 2.7. Drivers & Restraints Impact Analysis
- 2.8. Industry Chain Analysis
- 2.9. Cost Structure Analysis
- 2.10. Marketing Strategy
- 2.11. Russia-Ukraine War Impact Analysis
- 2.12. Opportunity Map Analysis
- 2.13. Market Competition Scenario Analysis
- 2.14. Product Life Cycle Analysis
- 2.15. Opportunity Orbits
- 2.16. Manufacturer Intensity Map
- 2.17. Major Companies sales by Value & Volume
- 2.1. American Football Gear Market Dynamics
- 3. Global American Football Gear Market Analysis, Opportunity and Forecast, 2016-2033
- 3.1. Global American Football Gear Market Analysis, 2016-2021
- 3.2. Global American Football Gear Market Opportunity and Forecast, 2023-2033
- 3.3. Global American Football Gear Market Analysis, Opportunity and Forecast, By Product Type, 2016-2033
- 3.3.1. Global American Football Gear Market Analysis by Product Type: Introduction
- 3.3.2. Market Size Absolute $ Opportunity Analysis and Forecast, By Product Type, 2016-2033
- 3.3.3. Helmets
- 3.3.4. Shoulder Pads
- 3.3.5. Gloves
- 3.3.6. Protective Clothing
- 3.3.7. Footwear
- 3.3.8. Other Accessories
- 3.4. Global American Football Gear Market Analysis, Opportunity and Forecast, By Material Type, 2016-2033
- 3.4.1. Global American Football Gear Market Analysis by Material Type: Introduction
- 3.4.2. Market Size Absolute $ Opportunity Analysis and Forecast, By Material Type, 2016-2033
- 3.4.3. Synthetic
- 3.4.4. Leather
- 3.4.5. Hybrid
- 3.5. Global American Football Gear Market Analysis, Opportunity and Forecast, By Distribution Channel, 2016-2033
- 3.5.1. Global American Football Gear Market Analysis by Distribution Channel: Introduction
- 3.5.2. Market Size Absolute $ Opportunity Analysis and Forecast, By Distribution Channel, 2016-2033
- 3.5.3. Online Retail
- 3.5.4. Offline Retail
- 3.6. Global American Football Gear Market Analysis, Opportunity and Forecast, By End User, 2016-2033
- 3.6.1. Global American Football Gear Market Analysis by End User: Introduction
- 3.6.2. Market Size Absolute $ Opportunity Analysis and Forecast, By End User, 2016-2033
- 3.6.3. Professional
- 3.6.4. Amateur
- 4. North America American Football Gear Market Analysis, Opportunity and Forecast, 2016-2033
- 4.1. North America American Football Gear Market Analysis, 2016-2021
- 4.2. North America American Football Gear Market Opportunity and Forecast, 2023-2033
- 4.3. North America American Football Gear Market Analysis, Opportunity and Forecast, By Product Type, 2016-2033
- 4.3.1. North America American Football Gear Market Analysis by Product Type: Introduction
- 4.3.2. Market Size Absolute $ Opportunity Analysis and Forecast, By Product Type, 2016-2033
- 4.3.3. Helmets
- 4.3.4. Shoulder Pads
- 4.3.5. Gloves
- 4.3.6. Protective Clothing
- 4.3.7. Footwear
- 4.3.8. Other Accessories
- 4.4. North America American Football Gear Market Analysis, Opportunity and Forecast, By Material Type, 2016-2033
- 4.4.1. North America American Football Gear Market Analysis by Material Type: Introduction
- 4.4.2. Market Size Absolute $ Opportunity Analysis and Forecast, By Material Type, 2016-2033
- 4.4.3. Synthetic
- 4.4.4. Leather
- 4.4.5. Hybrid
- 4.5. North America American Football Gear Market Analysis, Opportunity and Forecast, By Distribution Channel, 2016-2033
- 4.5.1. North America American Football Gear Market Analysis by Distribution Channel: Introduction
- 4.5.2. Market Size Absolute $ Opportunity Analysis and Forecast, By Distribution Channel, 2016-2033
- 4.5.3. Online Retail
- 4.5.4. Offline Retail
- 4.6. North America American Football Gear Market Analysis, Opportunity and Forecast, By End User, 2016-2033
- 4.6.1. North America American Football Gear Market Analysis by End User: Introduction
- 4.6.2. Market Size Absolute $ Opportunity Analysis and Forecast, By End User, 2016-2033
- 4.6.3. Professional
- 4.6.4. Amateur
- 4.7. North America American Football Gear Market Analysis, Opportunity and Forecast, By Country , 2016-2033
- 4.7.1. North America American Football Gear Market Analysis by Country : Introduction
- 4.7.2. Market Size Absolute $ Opportunity Analysis and Forecast, Country , 2016-2033
- 4.7.2.1. The US
- 4.7.2.2. Canada
- 4.7.2.3. Mexico
- 5. Western Europe American Football Gear Market Analysis, Opportunity and Forecast, 2016-2033
- 5.1. Western Europe American Football Gear Market Analysis, 2016-2021
- 5.2. Western Europe American Football Gear Market Opportunity and Forecast, 2023-2033
- 5.3. Western Europe American Football Gear Market Analysis, Opportunity and Forecast, By Product Type, 2016-2033
- 5.3.1. Western Europe American Football Gear Market Analysis by Product Type: Introduction
- 5.3.2. Market Size Absolute $ Opportunity Analysis and Forecast, By Product Type, 2016-2033
- 5.3.3. Helmets
- 5.3.4. Shoulder Pads
- 5.3.5. Gloves
- 5.3.6. Protective Clothing
- 5.3.7. Footwear
- 5.3.8. Other Accessories
- 5.4. Western Europe American Football Gear Market Analysis, Opportunity and Forecast, By Material Type, 2016-2033
- 5.4.1. Western Europe American Football Gear Market Analysis by Material Type: Introduction
- 5.4.2. Market Size Absolute $ Opportunity Analysis and Forecast, By Material Type, 2016-2033
- 5.4.3. Synthetic
- 5.4.4. Leather
- 5.4.5. Hybrid
- 5.5. Western Europe American Football Gear Market Analysis, Opportunity and Forecast, By Distribution Channel, 2016-2033
- 5.5.1. Western Europe American Football Gear Market Analysis by Distribution Channel: Introduction
- 5.5.2. Market Size Absolute $ Opportunity Analysis and Forecast, By Distribution Channel, 2016-2033
- 5.5.3. Online Retail
- 5.5.4. Offline Retail
- 5.6. Western Europe American Football Gear Market Analysis, Opportunity and Forecast, By End User, 2016-2033
- 5.6.1. Western Europe American Football Gear Market Analysis by End User: Introduction
- 5.6.2. Market Size Absolute $ Opportunity Analysis and Forecast, By End User, 2016-2033
- 5.6.3. Professional
- 5.6.4. Amateur
- 5.7. Western Europe American Football Gear Market Analysis, Opportunity and Forecast, By Country , 2016-2033
- 5.7.1. Western Europe American Football Gear Market Analysis by Country : Introduction
- 5.7.2. Market Size Absolute $ Opportunity Analysis and Forecast, Country , 2016-2033
- 5.7.2.1. Germany
- 5.7.2.2. France
- 5.7.2.3. The UK
- 5.7.2.4. Spain
- 5.7.2.5. Italy
- 5.7.2.6. Portugal
- 5.7.2.7. Ireland
- 5.7.2.8. Austria
- 5.7.2.9. Switzerland
- 5.7.2.10. Benelux
- 5.7.2.11. Nordic
- 5.7.2.12. Rest of Western Europe
- 6. Eastern Europe American Football Gear Market Analysis, Opportunity and Forecast, 2016-2033
- 6.1. Eastern Europe American Football Gear Market Analysis, 2016-2021
- 6.2. Eastern Europe American Football Gear Market Opportunity and Forecast, 2023-2033
- 6.3. Eastern Europe American Football Gear Market Analysis, Opportunity and Forecast, By Product Type, 2016-2033
- 6.3.1. Eastern Europe American Football Gear Market Analysis by Product Type: Introduction
- 6.3.2. Market Size Absolute $ Opportunity Analysis and Forecast, By Product Type, 2016-2033
- 6.3.3. Helmets
- 6.3.4. Shoulder Pads
- 6.3.5. Gloves
- 6.3.6. Protective Clothing
- 6.3.7. Footwear
- 6.3.8. Other Accessories
- 6.4. Eastern Europe American Football Gear Market Analysis, Opportunity and Forecast, By Material Type, 2016-2033
- 6.4.1. Eastern Europe American Football Gear Market Analysis by Material Type: Introduction
- 6.4.2. Market Size Absolute $ Opportunity Analysis and Forecast, By Material Type, 2016-2033
- 6.4.3. Synthetic
- 6.4.4. Leather
- 6.4.5. Hybrid
- 6.5. Eastern Europe American Football Gear Market Analysis, Opportunity and Forecast, By Distribution Channel, 2016-2033
- 6.5.1. Eastern Europe American Football Gear Market Analysis by Distribution Channel: Introduction
- 6.5.2. Market Size Absolute $ Opportunity Analysis and Forecast, By Distribution Channel, 2016-2033
- 6.5.3. Online Retail
- 6.5.4. Offline Retail
- 6.6. Eastern Europe American Football Gear Market Analysis, Opportunity and Forecast, By End User, 2016-2033
- 6.6.1. Eastern Europe American Football Gear Market Analysis by End User: Introduction
- 6.6.2. Market Size Absolute $ Opportunity Analysis and Forecast, By End User, 2016-2033
- 6.6.3. Professional
- 6.6.4. Amateur
- 6.7. Eastern Europe American Football Gear Market Analysis, Opportunity and Forecast, By Country , 2016-2033
- 6.7.1. Eastern Europe American Football Gear Market Analysis by Country : Introduction
- 6.7.2. Market Size Absolute $ Opportunity Analysis and Forecast, Country , 2016-2033
- 6.7.2.1. Russia
- 6.7.2.2. Poland
- 6.7.2.3. The Czech Republic
- 6.7.2.4. Greece
- 6.7.2.5. Rest of Eastern Europe
- 7. APAC American Football Gear Market Analysis, Opportunity and Forecast, 2016-2033
- 7.1. APAC American Football Gear Market Analysis, 2016-2021
- 7.2. APAC American Football Gear Market Opportunity and Forecast, 2023-2033
- 7.3. APAC American Football Gear Market Analysis, Opportunity and Forecast, By Product Type, 2016-2033
- 7.3.1. APAC American Football Gear Market Analysis by Product Type: Introduction
- 7.3.2. Market Size Absolute $ Opportunity Analysis and Forecast, By Product Type, 2016-2033
- 7.3.3. Helmets
- 7.3.4. Shoulder Pads
- 7.3.5. Gloves
- 7.3.6. Protective Clothing
- 7.3.7. Footwear
- 7.3.8. Other Accessories
- 7.4. APAC American Football Gear Market Analysis, Opportunity and Forecast, By Material Type, 2016-2033
- 7.4.1. APAC American Football Gear Market Analysis by Material Type: Introduction
- 7.4.2. Market Size Absolute $ Opportunity Analysis and Forecast, By Material Type, 2016-2033
- 7.4.3. Synthetic
- 7.4.4. Leather
- 7.4.5. Hybrid
- 7.5. APAC American Football Gear Market Analysis, Opportunity and Forecast, By Distribution Channel, 2016-2033
- 7.5.1. APAC American Football Gear Market Analysis by Distribution Channel: Introduction
- 7.5.2. Market Size Absolute $ Opportunity Analysis and Forecast, By Distribution Channel, 2016-2033
- 7.5.3. Online Retail
- 7.5.4. Offline Retail
- 7.6. APAC American Football Gear Market Analysis, Opportunity and Forecast, By End User, 2016-2033
- 7.6.1. APAC American Football Gear Market Analysis by End User: Introduction
- 7.6.2. Market Size Absolute $ Opportunity Analysis and Forecast, By End User, 2016-2033
- 7.6.3. Professional
- 7.6.4. Amateur
- 7.7. APAC American Football Gear Market Analysis, Opportunity and Forecast, By Country , 2016-2033
- 7.7.1. APAC American Football Gear Market Analysis by Country : Introduction
- 7.7.2. Market Size Absolute $ Opportunity Analysis and Forecast, Country , 2016-2033
- 7.7.2.1. China
- 7.7.2.2. Japan
- 7.7.2.3. South Korea
- 7.7.2.4. India
- 7.7.2.5. Australia & New Zeland
- 7.7.2.6. Indonesia
- 7.7.2.7. Malaysia
- 7.7.2.8. Philippines
- 7.7.2.9. Singapore
- 7.7.2.10. Thailand
- 7.7.2.11. Vietnam
- 7.7.2.12. Rest of APAC
- 8. Latin America American Football Gear Market Analysis, Opportunity and Forecast, 2016-2033
- 8.1. Latin America American Football Gear Market Analysis, 2016-2021
- 8.2. Latin America American Football Gear Market Opportunity and Forecast, 2023-2033
- 8.3. Latin America American Football Gear Market Analysis, Opportunity and Forecast, By Product Type, 2016-2033
- 8.3.1. Latin America American Football Gear Market Analysis by Product Type: Introduction
- 8.3.2. Market Size Absolute $ Opportunity Analysis and Forecast, By Product Type, 2016-2033
- 8.3.3. Helmets
- 8.3.4. Shoulder Pads
- 8.3.5. Gloves
- 8.3.6. Protective Clothing
- 8.3.7. Footwear
- 8.3.8. Other Accessories
- 8.4. Latin America American Football Gear Market Analysis, Opportunity and Forecast, By Material Type, 2016-2033
- 8.4.1. Latin America American Football Gear Market Analysis by Material Type: Introduction
- 8.4.2. Market Size Absolute $ Opportunity Analysis and Forecast, By Material Type, 2016-2033
- 8.4.3. Synthetic
- 8.4.4. Leather
- 8.4.5. Hybrid
- 8.5. Latin America American Football Gear Market Analysis, Opportunity and Forecast, By Distribution Channel, 2016-2033
- 8.5.1. Latin America American Football Gear Market Analysis by Distribution Channel: Introduction
- 8.5.2. Market Size Absolute $ Opportunity Analysis and Forecast, By Distribution Channel, 2016-2033
- 8.5.3. Online Retail
- 8.5.4. Offline Retail
- 8.6. Latin America American Football Gear Market Analysis, Opportunity and Forecast, By End User, 2016-2033
- 8.6.1. Latin America American Football Gear Market Analysis by End User: Introduction
- 8.6.2. Market Size Absolute $ Opportunity Analysis and Forecast, By End User, 2016-2033
- 8.6.3. Professional
- 8.6.4. Amateur
- 8.7. Latin America American Football Gear Market Analysis, Opportunity and Forecast, By Country , 2016-2033
- 8.7.1. Latin America American Football Gear Market Analysis by Country : Introduction
- 8.7.2. Market Size Absolute $ Opportunity Analysis and Forecast, Country , 2016-2033
- 8.7.2.1. Brazil
- 8.7.2.2. Colombia
- 8.7.2.3. Chile
- 8.7.2.4. Argentina
- 8.7.2.5. Costa Rica
- 8.7.2.6. Rest of Latin America
- 9. Middle East & Africa American Football Gear Market Analysis, Opportunity and Forecast, 2016-2033
- 9.1. Middle East & Africa American Football Gear Market Analysis, 2016-2021
- 9.2. Middle East & Africa American Football Gear Market Opportunity and Forecast, 2023-2033
- 9.3. Middle East & Africa American Football Gear Market Analysis, Opportunity and Forecast, By Product Type, 2016-2033
- 9.3.1. Middle East & Africa American Football Gear Market Analysis by Product Type: Introduction
- 9.3.2. Market Size Absolute $ Opportunity Analysis and Forecast, By Product Type, 2016-2033
- 9.3.3. Helmets
- 9.3.4. Shoulder Pads
- 9.3.5. Gloves
- 9.3.6. Protective Clothing
- 9.3.7. Footwear
- 9.3.8. Other Accessories
- 9.4. Middle East & Africa American Football Gear Market Analysis, Opportunity and Forecast, By Material Type, 2016-2033
- 9.4.1. Middle East & Africa American Football Gear Market Analysis by Material Type: Introduction
- 9.4.2. Market Size Absolute $ Opportunity Analysis and Forecast, By Material Type, 2016-2033
- 9.4.3. Synthetic
- 9.4.4. Leather
- 9.4.5. Hybrid
- 9.5. Middle East & Africa American Football Gear Market Analysis, Opportunity and Forecast, By Distribution Channel, 2016-2033
- 9.5.1. Middle East & Africa American Football Gear Market Analysis by Distribution Channel: Introduction
- 9.5.2. Market Size Absolute $ Opportunity Analysis and Forecast, By Distribution Channel, 2016-2033
- 9.5.3. Online Retail
- 9.5.4. Offline Retail
- 9.6. Middle East & Africa American Football Gear Market Analysis, Opportunity and Forecast, By End User, 2016-2033
- 9.6.1. Middle East & Africa American Football Gear Market Analysis by End User: Introduction
- 9.6.2. Market Size Absolute $ Opportunity Analysis and Forecast, By End User, 2016-2033
- 9.6.3. Professional
- 9.6.4. Amateur
- 9.7. Middle East & Africa American Football Gear Market Analysis, Opportunity and Forecast, By Country , 2016-2033
- 9.7.1. Middle East & Africa American Football Gear Market Analysis by Country : Introduction
- 9.7.2. Market Size Absolute $ Opportunity Analysis and Forecast, Country , 2016-2033
- 9.7.2.1. Algeria
- 9.7.2.2. Egypt
- 9.7.2.3. Israel
- 9.7.2.4. Kuwait
- 9.7.2.5. Nigeria
- 9.7.2.6. Saudi Arabia
- 9.7.2.7. South Africa
- 9.7.2.8. Turkey
- 9.7.2.9. The UAE
- 9.7.2.10. Rest of MEA
- 10. Global American Football Gear Market Analysis, Opportunity and Forecast, By Region , 2016-2033
- 10.1. Global American Football Gear Market Analysis by Region : Introduction
- 10.2. Market Size Absolute $ Opportunity Analysis and Forecast, By Region , 2016-2033
- 10.2.1. North America
- 10.2.2. Western Europe
- 10.2.3. Eastern Europe
- 10.2.4. APAC
- 10.2.5. Latin America
- 10.2.6. Middle East & Africa
- 11. Global American Football Gear Market Competitive Landscape, Market Share Analysis, and Company Profiles
- 11.1. Market Share Analysis
- 11.2. Company Profiles
- 11.3. Riddell
- 11.3.1. Company Overview
- 11.3.2. Financial Highlights
- 11.3.3. Product Portfolio
- 11.3.4. SWOT Analysis
- 11.3.5. Key Strategies and Developments
- 11.4. Schutt Sports
- 11.4.1. Company Overview
- 11.4.2. Financial Highlights
- 11.4.3. Product Portfolio
- 11.4.4. SWOT Analysis
- 11.4.5. Key Strategies and Developments
- 11.5. Xenith, LLC
- 11.5.1. Company Overview
- 11.5.2. Financial Highlights
- 11.5.3. Product Portfolio
- 11.5.4. SWOT Analysis
- 11.5.5. Key Strategies and Developments
- 11.6. Adams USA
- 11.6.1. Company Overview
- 11.6.2. Financial Highlights
- 11.6.3. Product Portfolio
- 11.6.4. SWOT Analysis
- 11.6.5. Key Strategies and Developments
- 11.7. Under Armour, Inc.
- 11.7.1. Company Overview
- 11.7.2. Financial Highlights
- 11.7.3. Product Portfolio
- 11.7.4. SWOT Analysis
- 11.7.5. Key Strategies and Developments
- 11.8. Nike, Inc.
- 11.8.1. Company Overview
- 11.8.2. Financial Highlights
- 11.8.3. Product Portfolio
- 11.8.4. SWOT Analysis
- 11.8.5. Key Strategies and Developments
- 11.9. Adidas AG
- 11.9.1. Company Overview
- 11.9.2. Financial Highlights
- 11.9.3. Product Portfolio
- 11.9.4. SWOT Analysis
- 11.9.5. Key Strategies and Developments
- 11.10. Douglas Pads
- 11.10.1. Company Overview
- 11.10.2. Financial Highlights
- 11.10.3. Product Portfolio
- 11.10.4. SWOT Analysis
- 11.10.5. Key Strategies and Developments
- 11.11. Champro Sports
- 11.11.1. Company Overview
- 11.11.2. Financial Highlights
- 11.11.3. Product Portfolio
- 11.11.4. SWOT Analysis
- 11.11.5. Key Strategies and Developments
- 11.12. Cutters Gloves
- 11.12.1. Company Overview
- 11.12.2. Financial Highlights
- 11.12.3. Product Portfolio
- 11.12.4. SWOT Analysis
- 11.12.5. Key Strategies and Developments
- 11.13.1. Company Overview
- 11.13.2. Financial Highlights
- 11.13.3. Product Portfolio
- 11.13.4. SWOT Analysis
- 11.13.5. Key Strategies and Developments
- 11.14. Shock Doctor, Inc.
- 11.14.1. Company Overview
- 11.14.2. Financial Highlights
- 11.14.3. Product Portfolio
- 11.14.4. SWOT Analysis
- 11.14.5. Key Strategies and Developments
- 11.15. Battle Sports Science
- 11.15.1. Company Overview
- 11.15.2. Financial Highlights
- 11.15.3. Product Portfolio
- 11.15.4. SWOT Analysis
- 11.15.5. Key Strategies and Developments
- 11.16. XTECH Protective Equipment
- 11.16.1. Company Overview
- 11.16.2. Financial Highlights
- 11.16.3. Product Portfolio
- 11.16.4. SWOT Analysis
- 11.16.5. Key Strategies and Developments
- 11.17. McDavid, Inc.
- 11.17.1. Company Overview
- 11.17.2. Financial Highlights
- 11.17.3. Product Portfolio
- 11.17.4. SWOT Analysis
- 11.17.5. Key Strategies and Developments
- 12. Assumptions and Acronyms
- 13. Research Methodology
- 14. Contact
"
- List of Figures
- "
- Figure 1: Global American Football Gear Market Revenue (US$ Mn) Market Share by Product Type in 2022
- Figure 2: Global American Football Gear Market Attractiveness Analysis by Product Type, 2016-2033
- Figure 3: Global American Football Gear Market Revenue (US$ Mn) Market Share by Material Typein 2022
- Figure 4: Global American Football Gear Market Attractiveness Analysis by Material Type, 2016-2033
- Figure 5: Global American Football Gear Market Revenue (US$ Mn) Market Share by Distribution Channelin 2022
- Figure 6: Global American Football Gear Market Attractiveness Analysis by Distribution Channel, 2016-2033
- Figure 7: Global American Football Gear Market Revenue (US$ Mn) Market Share by End Userin 2022
- Figure 8: Global American Football Gear Market Attractiveness Analysis by End User, 2016-2033
- Figure 9: Global American Football Gear Market Revenue (US$ Mn) Market Share by Region in 2022
- Figure 10: Global American Football Gear Market Attractiveness Analysis by Region, 2016-2033
- Figure 11: Global American Football Gear Market Revenue (US$ Mn) (2016-2033)
- Figure 12: Global American Football Gear Market Revenue (US$ Mn) Comparison by Region (2016-2033)
- Figure 13: Global American Football Gear Market Revenue (US$ Mn) Comparison by Product Type (2016-2033)
- Figure 14: Global American Football Gear Market Revenue (US$ Mn) Comparison by Material Type (2016-2033)
- Figure 15: Global American Football Gear Market Revenue (US$ Mn) Comparison by Distribution Channel (2016-2033)
- Figure 16: Global American Football Gear Market Revenue (US$ Mn) Comparison by End User (2016-2033)
- Figure 17: Global American Football Gear Market Y-o-Y Growth Rate Comparison by Region (2016-2033)
- Figure 18: Global American Football Gear Market Y-o-Y Growth Rate Comparison by Product Type (2016-2033)
- Figure 19: Global American Football Gear Market Y-o-Y Growth Rate Comparison by Material Type (2016-2033)
- Figure 20: Global American Football Gear Market Y-o-Y Growth Rate Comparison by Distribution Channel (2016-2033)
- Figure 21: Global American Football Gear Market Y-o-Y Growth Rate Comparison by End User (2016-2033)
- Figure 22: Global American Football Gear Market Share Comparison by Region (2016-2033)
- Figure 23: Global American Football Gear Market Share Comparison by Product Type (2016-2033)
- Figure 24: Global American Football Gear Market Share Comparison by Material Type (2016-2033)
- Figure 25: Global American Football Gear Market Share Comparison by Distribution Channel (2016-2033)
- Figure 26: Global American Football Gear Market Share Comparison by End User (2016-2033)
- Figure 27: North America American Football Gear Market Revenue (US$ Mn) Market Share by Product Typein 2022
- Figure 28: North America American Football Gear Market Attractiveness Analysis by Product Type, 2016-2033
- Figure 29: North America American Football Gear Market Revenue (US$ Mn) Market Share by Material Typein 2022
- Figure 30: North America American Football Gear Market Attractiveness Analysis by Material Type, 2016-2033
- Figure 31: North America American Football Gear Market Revenue (US$ Mn) Market Share by Distribution Channelin 2022
- Figure 32: North America American Football Gear Market Attractiveness Analysis by Distribution Channel, 2016-2033
- Figure 33: North America American Football Gear Market Revenue (US$ Mn) Market Share by End Userin 2022
- Figure 34: North America American Football Gear Market Attractiveness Analysis by End User, 2016-2033
- Figure 35: North America American Football Gear Market Revenue (US$ Mn) Market Share by Country in 2022
- Figure 36: North America American Football Gear Market Attractiveness Analysis by Country, 2016-2033
- Figure 37: North America American Football Gear Market Revenue (US$ Mn) (2016-2033)
- Figure 38: North America American Football Gear Market Revenue (US$ Mn) Comparison by Country (2016-2033)
- Figure 39: North America American Football Gear Market Revenue (US$ Mn) Comparison by Product Type (2016-2033)
- Figure 40: North America American Football Gear Market Revenue (US$ Mn) Comparison by Material Type (2016-2033)
- Figure 41: North America American Football Gear Market Revenue (US$ Mn) Comparison by Distribution Channel (2016-2033)
- Figure 42: North America American Football Gear Market Revenue (US$ Mn) Comparison by End User (2016-2033)
- Figure 43: North America American Football Gear Market Y-o-Y Growth Rate Comparison by Country (2016-2033)
- Figure 44: North America American Football Gear Market Y-o-Y Growth Rate Comparison by Product Type (2016-2033)
- Figure 45: North America American Football Gear Market Y-o-Y Growth Rate Comparison by Material Type (2016-2033)
- Figure 46: North America American Football Gear Market Y-o-Y Growth Rate Comparison by Distribution Channel (2016-2033)
- Figure 47: North America American Football Gear Market Y-o-Y Growth Rate Comparison by End User (2016-2033)
- Figure 48: North America American Football Gear Market Share Comparison by Country (2016-2033)
- Figure 49: North America American Football Gear Market Share Comparison by Product Type (2016-2033)
- Figure 50: North America American Football Gear Market Share Comparison by Material Type (2016-2033)
- Figure 51: North America American Football Gear Market Share Comparison by Distribution Channel (2016-2033)
- Figure 52: North America American Football Gear Market Share Comparison by End User (2016-2033)
- Figure 53: Western Europe American Football Gear Market Revenue (US$ Mn) Market Share by Product Typein 2022
- Figure 54: Western Europe American Football Gear Market Attractiveness Analysis by Product Type, 2016-2033
- Figure 55: Western Europe American Football Gear Market Revenue (US$ Mn) Market Share by Material Typein 2022
- Figure 56: Western Europe American Football Gear Market Attractiveness Analysis by Material Type, 2016-2033
- Figure 57: Western Europe American Football Gear Market Revenue (US$ Mn) Market Share by Distribution Channelin 2022
- Figure 58: Western Europe American Football Gear Market Attractiveness Analysis by Distribution Channel, 2016-2033
- Figure 59: Western Europe American Football Gear Market Revenue (US$ Mn) Market Share by End Userin 2022
- Figure 60: Western Europe American Football Gear Market Attractiveness Analysis by End User, 2016-2033
- Figure 61: Western Europe American Football Gear Market Revenue (US$ Mn) Market Share by Country in 2022
- Figure 62: Western Europe American Football Gear Market Attractiveness Analysis by Country, 2016-2033
- Figure 63: Western Europe American Football Gear Market Revenue (US$ Mn) (2016-2033)
- Figure 64: Western Europe American Football Gear Market Revenue (US$ Mn) Comparison by Country (2016-2033)
- Figure 65: Western Europe American Football Gear Market Revenue (US$ Mn) Comparison by Product Type (2016-2033)
- Figure 66: Western Europe American Football Gear Market Revenue (US$ Mn) Comparison by Material Type (2016-2033)
- Figure 67: Western Europe American Football Gear Market Revenue (US$ Mn) Comparison by Distribution Channel (2016-2033)
- Figure 68: Western Europe American Football Gear Market Revenue (US$ Mn) Comparison by End User (2016-2033)
- Figure 69: Western Europe American Football Gear Market Y-o-Y Growth Rate Comparison by Country (2016-2033)
- Figure 70: Western Europe American Football Gear Market Y-o-Y Growth Rate Comparison by Product Type (2016-2033)
- Figure 71: Western Europe American Football Gear Market Y-o-Y Growth Rate Comparison by Material Type (2016-2033)
- Figure 72: Western Europe American Football Gear Market Y-o-Y Growth Rate Comparison by Distribution Channel (2016-2033)
- Figure 73: Western Europe American Football Gear Market Y-o-Y Growth Rate Comparison by End User (2016-2033)
- Figure 74: Western Europe American Football Gear Market Share Comparison by Country (2016-2033)
- Figure 75: Western Europe American Football Gear Market Share Comparison by Product Type (2016-2033)
- Figure 76: Western Europe American Football Gear Market Share Comparison by Material Type (2016-2033)
- Figure 77: Western Europe American Football Gear Market Share Comparison by Distribution Channel (2016-2033)
- Figure 78: Western Europe American Football Gear Market Share Comparison by End User (2016-2033)
- Figure 79: Eastern Europe American Football Gear Market Revenue (US$ Mn) Market Share by Product Typein 2022
- Figure 80: Eastern Europe American Football Gear Market Attractiveness Analysis by Product Type, 2016-2033
- Figure 81: Eastern Europe American Football Gear Market Revenue (US$ Mn) Market Share by Material Typein 2022
- Figure 82: Eastern Europe American Football Gear Market Attractiveness Analysis by Material Type, 2016-2033
- Figure 83: Eastern Europe American Football Gear Market Revenue (US$ Mn) Market Share by Distribution Channelin 2022
- Figure 84: Eastern Europe American Football Gear Market Attractiveness Analysis by Distribution Channel, 2016-2033
- Figure 85: Eastern Europe American Football Gear Market Revenue (US$ Mn) Market Share by End Userin 2022
- Figure 86: Eastern Europe American Football Gear Market Attractiveness Analysis by End User, 2016-2033
- Figure 87: Eastern Europe American Football Gear Market Revenue (US$ Mn) Market Share by Country in 2022
- Figure 88: Eastern Europe American Football Gear Market Attractiveness Analysis by Country, 2016-2033
- Figure 89: Eastern Europe American Football Gear Market Revenue (US$ Mn) (2016-2033)
- Figure 90: Eastern Europe American Football Gear Market Revenue (US$ Mn) Comparison by Country (2016-2033)
- Figure 91: Eastern Europe American Football Gear Market Revenue (US$ Mn) Comparison by Product Type (2016-2033)
- Figure 92: Eastern Europe American Football Gear Market Revenue (US$ Mn) Comparison by Material Type (2016-2033)
- Figure 93: Eastern Europe American Football Gear Market Revenue (US$ Mn) Comparison by Distribution Channel (2016-2033)
- Figure 94: Eastern Europe American Football Gear Market Revenue (US$ Mn) Comparison by End User (2016-2033)
- Figure 95: Eastern Europe American Football Gear Market Y-o-Y Growth Rate Comparison by Country (2016-2033)
- Figure 96: Eastern Europe American Football Gear Market Y-o-Y Growth Rate Comparison by Product Type (2016-2033)
- Figure 97: Eastern Europe American Football Gear Market Y-o-Y Growth Rate Comparison by Material Type (2016-2033)
- Figure 98: Eastern Europe American Football Gear Market Y-o-Y Growth Rate Comparison by Distribution Channel (2016-2033)
- Figure 99: Eastern Europe American Football Gear Market Y-o-Y Growth Rate Comparison by End User (2016-2033)
- Figure 100: Eastern Europe American Football Gear Market Share Comparison by Country (2016-2033)
- Figure 101: Eastern Europe American Football Gear Market Share Comparison by Product Type (2016-2033)
- Figure 102: Eastern Europe American Football Gear Market Share Comparison by Material Type (2016-2033)
- Figure 103: Eastern Europe American Football Gear Market Share Comparison by Distribution Channel (2016-2033)
- Figure 104: Eastern Europe American Football Gear Market Share Comparison by End User (2016-2033)
- Figure 105: APAC American Football Gear Market Revenue (US$ Mn) Market Share by Product Typein 2022
- Figure 106: APAC American Football Gear Market Attractiveness Analysis by Product Type, 2016-2033
- Figure 107: APAC American Football Gear Market Revenue (US$ Mn) Market Share by Material Typein 2022
- Figure 108: APAC American Football Gear Market Attractiveness Analysis by Material Type, 2016-2033
- Figure 109: APAC American Football Gear Market Revenue (US$ Mn) Market Share by Distribution Channelin 2022
- Figure 110: APAC American Football Gear Market Attractiveness Analysis by Distribution Channel, 2016-2033
- Figure 111: APAC American Football Gear Market Revenue (US$ Mn) Market Share by End Userin 2022
- Figure 112: APAC American Football Gear Market Attractiveness Analysis by End User, 2016-2033
- Figure 113: APAC American Football Gear Market Revenue (US$ Mn) Market Share by Country in 2022
- Figure 114: APAC American Football Gear Market Attractiveness Analysis by Country, 2016-2033
- Figure 115: APAC American Football Gear Market Revenue (US$ Mn) (2016-2033)
- Figure 116: APAC American Football Gear Market Revenue (US$ Mn) Comparison by Country (2016-2033)
- Figure 117: APAC American Football Gear Market Revenue (US$ Mn) Comparison by Product Type (2016-2033)
- Figure 118: APAC American Football Gear Market Revenue (US$ Mn) Comparison by Material Type (2016-2033)
- Figure 119: APAC American Football Gear Market Revenue (US$ Mn) Comparison by Distribution Channel (2016-2033)
- Figure 120: APAC American Football Gear Market Revenue (US$ Mn) Comparison by End User (2016-2033)
- Figure 121: APAC American Football Gear Market Y-o-Y Growth Rate Comparison by Country (2016-2033)
- Figure 122: APAC American Football Gear Market Y-o-Y Growth Rate Comparison by Product Type (2016-2033)
- Figure 123: APAC American Football Gear Market Y-o-Y Growth Rate Comparison by Material Type (2016-2033)
- Figure 124: APAC American Football Gear Market Y-o-Y Growth Rate Comparison by Distribution Channel (2016-2033)
- Figure 125: APAC American Football Gear Market Y-o-Y Growth Rate Comparison by End User (2016-2033)
- Figure 126: APAC American Football Gear Market Share Comparison by Country (2016-2033)
- Figure 127: APAC American Football Gear Market Share Comparison by Product Type (2016-2033)
- Figure 128: APAC American Football Gear Market Share Comparison by Material Type (2016-2033)
- Figure 129: APAC American Football Gear Market Share Comparison by Distribution Channel (2016-2033)
- Figure 130: APAC American Football Gear Market Share Comparison by End User (2016-2033)
- Figure 131: Latin America American Football Gear Market Revenue (US$ Mn) Market Share by Product Typein 2022
- Figure 132: Latin America American Football Gear Market Attractiveness Analysis by Product Type, 2016-2033
- Figure 133: Latin America American Football Gear Market Revenue (US$ Mn) Market Share by Material Typein 2022
- Figure 134: Latin America American Football Gear Market Attractiveness Analysis by Material Type, 2016-2033
- Figure 135: Latin America American Football Gear Market Revenue (US$ Mn) Market Share by Distribution Channelin 2022
- Figure 136: Latin America American Football Gear Market Attractiveness Analysis by Distribution Channel, 2016-2033
- Figure 137: Latin America American Football Gear Market Revenue (US$ Mn) Market Share by End Userin 2022
- Figure 138: Latin America American Football Gear Market Attractiveness Analysis by End User, 2016-2033
- Figure 139: Latin America American Football Gear Market Revenue (US$ Mn) Market Share by Country in 2022
- Figure 140: Latin America American Football Gear Market Attractiveness Analysis by Country, 2016-2033
- Figure 141: Latin America American Football Gear Market Revenue (US$ Mn) (2016-2033)
- Figure 142: Latin America American Football Gear Market Revenue (US$ Mn) Comparison by Country (2016-2033)
- Figure 143: Latin America American Football Gear Market Revenue (US$ Mn) Comparison by Product Type (2016-2033)
- Figure 144: Latin America American Football Gear Market Revenue (US$ Mn) Comparison by Material Type (2016-2033)
- Figure 145: Latin America American Football Gear Market Revenue (US$ Mn) Comparison by Distribution Channel (2016-2033)
- Figure 146: Latin America American Football Gear Market Revenue (US$ Mn) Comparison by End User (2016-2033)
- Figure 147: Latin America American Football Gear Market Y-o-Y Growth Rate Comparison by Country (2016-2033)
- Figure 148: Latin America American Football Gear Market Y-o-Y Growth Rate Comparison by Product Type (2016-2033)
- Figure 149: Latin America American Football Gear Market Y-o-Y Growth Rate Comparison by Material Type (2016-2033)
- Figure 150: Latin America American Football Gear Market Y-o-Y Growth Rate Comparison by Distribution Channel (2016-2033)
- Figure 151: Latin America American Football Gear Market Y-o-Y Growth Rate Comparison by End User (2016-2033)
- Figure 152: Latin America American Football Gear Market Share Comparison by Country (2016-2033)
- Figure 153: Latin America American Football Gear Market Share Comparison by Product Type (2016-2033)
- Figure 154: Latin America American Football Gear Market Share Comparison by Material Type (2016-2033)
- Figure 155: Latin America American Football Gear Market Share Comparison by Distribution Channel (2016-2033)
- Figure 156: Latin America American Football Gear Market Share Comparison by End User (2016-2033)
- Figure 157: Middle East & Africa American Football Gear Market Revenue (US$ Mn) Market Share by Product Typein 2022
- Figure 158: Middle East & Africa American Football Gear Market Attractiveness Analysis by Product Type, 2016-2033
- Figure 159: Middle East & Africa American Football Gear Market Revenue (US$ Mn) Market Share by Material Typein 2022
- Figure 160: Middle East & Africa American Football Gear Market Attractiveness Analysis by Material Type, 2016-2033
- Figure 161: Middle East & Africa American Football Gear Market Revenue (US$ Mn) Market Share by Distribution Channelin 2022
- Figure 162: Middle East & Africa American Football Gear Market Attractiveness Analysis by Distribution Channel, 2016-2033
- Figure 163: Middle East & Africa American Football Gear Market Revenue (US$ Mn) Market Share by End Userin 2022
- Figure 164: Middle East & Africa American Football Gear Market Attractiveness Analysis by End User, 2016-2033
- Figure 165: Middle East & Africa American Football Gear Market Revenue (US$ Mn) Market Share by Country in 2022
- Figure 166: Middle East & Africa American Football Gear Market Attractiveness Analysis by Country, 2016-2033
- Figure 167: Middle East & Africa American Football Gear Market Revenue (US$ Mn) (2016-2033)
- Figure 168: Middle East & Africa American Football Gear Market Revenue (US$ Mn) Comparison by Country (2016-2033)
- Figure 169: Middle East & Africa American Football Gear Market Revenue (US$ Mn) Comparison by Product Type (2016-2033)
- Figure 170: Middle East & Africa American Football Gear Market Revenue (US$ Mn) Comparison by Material Type (2016-2033)
- Figure 171: Middle East & Africa American Football Gear Market Revenue (US$ Mn) Comparison by Distribution Channel (2016-2033)
- Figure 172: Middle East & Africa American Football Gear Market Revenue (US$ Mn) Comparison by End User (2016-2033)
- Figure 173: Middle East & Africa American Football Gear Market Y-o-Y Growth Rate Comparison by Country (2016-2033)
- Figure 174: Middle East & Africa American Football Gear Market Y-o-Y Growth Rate Comparison by Product Type (2016-2033)
- Figure 175: Middle East & Africa American Football Gear Market Y-o-Y Growth Rate Comparison by Material Type (2016-2033)
- Figure 176: Middle East & Africa American Football Gear Market Y-o-Y Growth Rate Comparison by Distribution Channel (2016-2033)
- Figure 177: Middle East & Africa American Football Gear Market Y-o-Y Growth Rate Comparison by End User (2016-2033)
- Figure 178: Middle East & Africa American Football Gear Market Share Comparison by Country (2016-2033)
- Figure 179: Middle East & Africa American Football Gear Market Share Comparison by Product Type (2016-2033)
- Figure 180: Middle East & Africa American Football Gear Market Share Comparison by Material Type (2016-2033)
- Figure 181: Middle East & Africa American Football Gear Market Share Comparison by Distribution Channel (2016-2033)
- Figure 182: Middle East & Africa American Football Gear Market Share Comparison by End User (2016-2033)
"
- List of Tables
- "
- Table 1: Global American Football Gear Market Comparison by Product Type (2016-2033)
- Table 2: Global American Football Gear Market Comparison by Material Type (2016-2033)
- Table 3: Global American Football Gear Market Comparison by Distribution Channel (2016-2033)
- Table 4: Global American Football Gear Market Comparison by End User (2016-2033)
- Table 5: Global American Football Gear Market Revenue (US$ Mn) Comparison by Region (2016-2033)
- Table 6: Global American Football Gear Market Revenue (US$ Mn) (2016-2033)
- Table 7: Global American Football Gear Market Revenue (US$ Mn) Comparison by Region (2016-2033)
- Table 8: Global American Football Gear Market Revenue (US$ Mn) Comparison by Product Type (2016-2033)
- Table 9: Global American Football Gear Market Revenue (US$ Mn) Comparison by Material Type (2016-2033)
- Table 10: Global American Football Gear Market Revenue (US$ Mn) Comparison by Distribution Channel (2016-2033)
- Table 11: Global American Football Gear Market Revenue (US$ Mn) Comparison by End User (2016-2033)
- Table 12: Global American Football Gear Market Y-o-Y Growth Rate Comparison by Region (2016-2033)
- Table 13: Global American Football Gear Market Y-o-Y Growth Rate Comparison by Product Type (2016-2033)
- Table 14: Global American Football Gear Market Y-o-Y Growth Rate Comparison by Material Type (2016-2033)
- Table 15: Global American Football Gear Market Y-o-Y Growth Rate Comparison by Distribution Channel (2016-2033)
- Table 16: Global American Football Gear Market Y-o-Y Growth Rate Comparison by End User (2016-2033)
- Table 17: Global American Football Gear Market Share Comparison by Region (2016-2033)
- Table 18: Global American Football Gear Market Share Comparison by Product Type (2016-2033)
- Table 19: Global American Football Gear Market Share Comparison by Material Type (2016-2033)
- Table 20: Global American Football Gear Market Share Comparison by Distribution Channel (2016-2033)
- Table 21: Global American Football Gear Market Share Comparison by End User (2016-2033)
- Table 22: North America American Football Gear Market Comparison by Material Type (2016-2033)
- Table 23: North America American Football Gear Market Comparison by Distribution Channel (2016-2033)
- Table 24: North America American Football Gear Market Comparison by End User (2016-2033)
- Table 25: North America American Football Gear Market Revenue (US$ Mn) Comparison by Country (2016-2033)
- Table 26: North America American Football Gear Market Revenue (US$ Mn) (2016-2033)
- Table 27: North America American Football Gear Market Revenue (US$ Mn) Comparison by Country (2016-2033)
- Table 28: North America American Football Gear Market Revenue (US$ Mn) Comparison by Product Type (2016-2033)
- Table 29: North America American Football Gear Market Revenue (US$ Mn) Comparison by Material Type (2016-2033)
- Table 30: North America American Football Gear Market Revenue (US$ Mn) Comparison by Distribution Channel (2016-2033)
- Table 31: North America American Football Gear Market Revenue (US$ Mn) Comparison by End User (2016-2033)
- Table 32: North America American Football Gear Market Y-o-Y Growth Rate Comparison by Country (2016-2033)
- Table 33: North America American Football Gear Market Y-o-Y Growth Rate Comparison by Product Type (2016-2033)
- Table 34: North America American Football Gear Market Y-o-Y Growth Rate Comparison by Material Type (2016-2033)
- Table 35: North America American Football Gear Market Y-o-Y Growth Rate Comparison by Distribution Channel (2016-2033)
- Table 36: North America American Football Gear Market Y-o-Y Growth Rate Comparison by End User (2016-2033)
- Table 37: North America American Football Gear Market Share Comparison by Country (2016-2033)
- Table 38: North America American Football Gear Market Share Comparison by Product Type (2016-2033)
- Table 39: North America American Football Gear Market Share Comparison by Material Type (2016-2033)
- Table 40: North America American Football Gear Market Share Comparison by Distribution Channel (2016-2033)
- Table 41: North America American Football Gear Market Share Comparison by End User (2016-2033)
- Table 42: Western Europe American Football Gear Market Comparison by Product Type (2016-2033)
- Table 43: Western Europe American Football Gear Market Comparison by Material Type (2016-2033)
- Table 44: Western Europe American Football Gear Market Comparison by Distribution Channel (2016-2033)
- Table 45: Western Europe American Football Gear Market Comparison by End User (2016-2033)
- Table 46: Western Europe American Football Gear Market Revenue (US$ Mn) Comparison by Country (2016-2033)
- Table 47: Western Europe American Football Gear Market Revenue (US$ Mn) (2016-2033)
- Table 48: Western Europe American Football Gear Market Revenue (US$ Mn) Comparison by Country (2016-2033)
- Table 49: Western Europe American Football Gear Market Revenue (US$ Mn) Comparison by Product Type (2016-2033)
- Table 50: Western Europe American Football Gear Market Revenue (US$ Mn) Comparison by Material Type (2016-2033)
- Table 51: Western Europe American Football Gear Market Revenue (US$ Mn) Comparison by Distribution Channel (2016-2033)
- Table 52: Western Europe American Football Gear Market Revenue (US$ Mn) Comparison by End User (2016-2033)
- Table 53: Western Europe American Football Gear Market Y-o-Y Growth Rate Comparison by Country (2016-2033)
- Table 54: Western Europe American Football Gear Market Y-o-Y Growth Rate Comparison by Product Type (2016-2033)
- Table 55: Western Europe American Football Gear Market Y-o-Y Growth Rate Comparison by Material Type (2016-2033)
- Table 56: Western Europe American Football Gear Market Y-o-Y Growth Rate Comparison by Distribution Channel (2016-2033)
- Table 57: Western Europe American Football Gear Market Y-o-Y Growth Rate Comparison by End User (2016-2033)
- Table 58: Western Europe American Football Gear Market Share Comparison by Country (2016-2033)
- Table 59: Western Europe American Football Gear Market Share Comparison by Product Type (2016-2033)
- Table 60: Western Europe American Football Gear Market Share Comparison by Material Type (2016-2033)
- Table 61: Western Europe American Football Gear Market Share Comparison by Distribution Channel (2016-2033)
- Table 62: Western Europe American Football Gear Market Share Comparison by End User (2016-2033)
- Table 63: Eastern Europe American Football Gear Market Comparison by Product Type (2016-2033)
- Table 64: Eastern Europe American Football Gear Market Comparison by Material Type (2016-2033)
- Table 65: Eastern Europe American Football Gear Market Comparison by Distribution Channel (2016-2033)
- Table 66: Eastern Europe American Football Gear Market Comparison by End User (2016-2033)
- Table 67: Eastern Europe American Football Gear Market Revenue (US$ Mn) Comparison by Country (2016-2033)
- Table 68: Eastern Europe American Football Gear Market Revenue (US$ Mn) (2016-2033)
- Table 69: Eastern Europe American Football Gear Market Revenue (US$ Mn) Comparison by Country (2016-2033)
- Table 70: Eastern Europe American Football Gear Market Revenue (US$ Mn) Comparison by Product Type (2016-2033)
- Table 71: Eastern Europe American Football Gear Market Revenue (US$ Mn) Comparison by Material Type (2016-2033)
- Table 72: Eastern Europe American Football Gear Market Revenue (US$ Mn) Comparison by Distribution Channel (2016-2033)
- Table 73: Eastern Europe American Football Gear Market Revenue (US$ Mn) Comparison by End User (2016-2033)
- Table 74: Eastern Europe American Football Gear Market Y-o-Y Growth Rate Comparison by Country (2016-2033)
- Table 75: Eastern Europe American Football Gear Market Y-o-Y Growth Rate Comparison by Product Type (2016-2033)
- Table 76: Eastern Europe American Football Gear Market Y-o-Y Growth Rate Comparison by Material Type (2016-2033)
- Table 77: Eastern Europe American Football Gear Market Y-o-Y Growth Rate Comparison by Distribution Channel (2016-2033)
- Table 78: Eastern Europe American Football Gear Market Y-o-Y Growth Rate Comparison by End User (2016-2033)
- Table 79: Eastern Europe American Football Gear Market Share Comparison by Country (2016-2033)
- Table 80: Eastern Europe American Football Gear Market Share Comparison by Product Type (2016-2033)
- Table 81: Eastern Europe American Football Gear Market Share Comparison by Material Type (2016-2033)
- Table 82: Eastern Europe American Football Gear Market Share Comparison by Distribution Channel (2016-2033)
- Table 83: Eastern Europe American Football Gear Market Share Comparison by End User (2016-2033)
- Table 84: APAC American Football Gear Market Comparison by Product Type (2016-2033)
- Table 85: APAC American Football Gear Market Comparison by Material Type (2016-2033)
- Table 86: APAC American Football Gear Market Comparison by Distribution Channel (2016-2033)
- Table 87: APAC American Football Gear Market Comparison by End User (2016-2033)
- Table 88: APAC American Football Gear Market Revenue (US$ Mn) Comparison by Country (2016-2033)
- Table 89: APAC American Football Gear Market Revenue (US$ Mn) (2016-2033)
- Table 90: APAC American Football Gear Market Revenue (US$ Mn) Comparison by Country (2016-2033)
- Table 91: APAC American Football Gear Market Revenue (US$ Mn) Comparison by Product Type (2016-2033)
- Table 92: APAC American Football Gear Market Revenue (US$ Mn) Comparison by Material Type (2016-2033)
- Table 93: APAC American Football Gear Market Revenue (US$ Mn) Comparison by Distribution Channel (2016-2033)
- Table 94: APAC American Football Gear Market Revenue (US$ Mn) Comparison by End User (2016-2033)
- Table 95: APAC American Football Gear Market Y-o-Y Growth Rate Comparison by Country (2016-2033)
- Table 96: APAC American Football Gear Market Y-o-Y Growth Rate Comparison by Product Type (2016-2033)
- Table 97: APAC American Football Gear Market Y-o-Y Growth Rate Comparison by Material Type (2016-2033)
- Table 98: APAC American Football Gear Market Y-o-Y Growth Rate Comparison by Distribution Channel (2016-2033)
- Table 99: APAC American Football Gear Market Y-o-Y Growth Rate Comparison by End User (2016-2033)
- Table 100: APAC American Football Gear Market Share Comparison by Country (2016-2033)
- Table 101: APAC American Football Gear Market Share Comparison by Product Type (2016-2033)
- Table 102: APAC American Football Gear Market Share Comparison by Material Type (2016-2033)
- Table 103: APAC American Football Gear Market Share Comparison by Distribution Channel (2016-2033)
- Table 104: APAC American Football Gear Market Share Comparison by End User (2016-2033)
- Table 105: Latin America American Football Gear Market Comparison by Product Type (2016-2033)
- Table 106: Latin America American Football Gear Market Comparison by Material Type (2016-2033)
- Table 107: Latin America American Football Gear Market Comparison by Distribution Channel (2016-2033)
- Table 108: Latin America American Football Gear Market Comparison by End User (2016-2033)
- Table 109: Latin America American Football Gear Market Revenue (US$ Mn) Comparison by Country (2016-2033)
- Table 110: Latin America American Football Gear Market Revenue (US$ Mn) (2016-2033)
- Table 111: Latin America American Football Gear Market Revenue (US$ Mn) Comparison by Country (2016-2033)
- Table 112: Latin America American Football Gear Market Revenue (US$ Mn) Comparison by Product Type (2016-2033)
- Table 113: Latin America American Football Gear Market Revenue (US$ Mn) Comparison by Material Type (2016-2033)
- Table 114: Latin America American Football Gear Market Revenue (US$ Mn) Comparison by Distribution Channel (2016-2033)
- Table 115: Latin America American Football Gear Market Revenue (US$ Mn) Comparison by End User (2016-2033)
- Table 116: Latin America American Football Gear Market Y-o-Y Growth Rate Comparison by Country (2016-2033)
- Table 117: Latin America American Football Gear Market Y-o-Y Growth Rate Comparison by Product Type (2016-2033)
- Table 118: Latin America American Football Gear Market Y-o-Y Growth Rate Comparison by Material Type (2016-2033)
- Table 119: Latin America American Football Gear Market Y-o-Y Growth Rate Comparison by Distribution Channel (2016-2033)
- Table 120: Latin America American Football Gear Market Y-o-Y Growth Rate Comparison by End User (2016-2033)
- Table 121: Latin America American Football Gear Market Share Comparison by Country (2016-2033)
- Table 122: Latin America American Football Gear Market Share Comparison by Product Type (2016-2033)
- Table 123: Latin America American Football Gear Market Share Comparison by Material Type (2016-2033)
- Table 124: Latin America American Football Gear Market Share Comparison by Distribution Channel (2016-2033)
- Table 125: Latin America American Football Gear Market Share Comparison by End User (2016-2033)
- Table 126: Middle East & Africa American Football Gear Market Comparison by Product Type (2016-2033)
- Table 127: Middle East & Africa American Football Gear Market Comparison by Material Type (2016-2033)
- Table 128: Middle East & Africa American Football Gear Market Comparison by Distribution Channel (2016-2033)
- Table 129: Middle East & Africa American Football Gear Market Comparison by End User (2016-2033)
- Table 130: Middle East & Africa American Football Gear Market Revenue (US$ Mn) Comparison by Country (2016-2033)
- Table 131: Middle East & Africa American Football Gear Market Revenue (US$ Mn) (2016-2033)
- Table 132: Middle East & Africa American Football Gear Market Revenue (US$ Mn) Comparison by Country (2016-2033)
- Table 133: Middle East & Africa American Football Gear Market Revenue (US$ Mn) Comparison by Product Type (2016-2033)
- Table 134: Middle East & Africa American Football Gear Market Revenue (US$ Mn) Comparison by Material Type (2016-2033)
- Table 135: Middle East & Africa American Football Gear Market Revenue (US$ Mn) Comparison by Distribution Channel (2016-2033)
- Table 136: Middle East & Africa American Football Gear Market Revenue (US$ Mn) Comparison by End User (2016-2033)
- Table 137: Middle East & Africa American Football Gear Market Y-o-Y Growth Rate Comparison by Country (2016-2033)
- Table 138: Middle East & Africa American Football Gear Market Y-o-Y Growth Rate Comparison by Product Type (2016-2033)
- Table 139: Middle East & Africa American Football Gear Market Y-o-Y Growth Rate Comparison by Material Type (2016-2033)
- Table 140: Middle East & Africa American Football Gear Market Y-o-Y Growth Rate Comparison by Distribution Channel (2016-2033)
- Table 141: Middle East & Africa American Football Gear Market Y-o-Y Growth Rate Comparison by End User (2016-2033)
- Table 142: Middle East & Africa American Football Gear Market Share Comparison by Country (2016-2033)
- Table 143: Middle East & Africa American Football Gear Market Share Comparison by Product Type (2016-2033)
- Table 144: Middle East & Africa American Football Gear Market Share Comparison by Material Type (2016-2033)
- Table 145: Middle East & Africa American Football Gear Market Share Comparison by Distribution Channel (2016-2033)
- Table 146: Middle East & Africa American Football Gear Market Share Comparison by End User (2016-2033)
- 1. Executive Summary
-
- Riddell
- Gilbert International
- Schutt Sports
- Xenith, LLC
- Adams USA
- Under Armour, Inc.
- Nike, Inc.
- Adidas AG
- Douglas Pads
- Champro Sports
- Cutters Gloves
- Shock Doctor, Inc.
- VICIS, Inc.
- Battle Sports Science
- XTECH Protective Equipment
- McDavid, Inc.
Our Clients


View Our Licence Options
