Agrochemicals Market By Type (fertilizers and pesticides), By crop (cereals and grains, oilseeds and pulses, plantation crops), By vegetables (pesticide, pyrethroids, organophosphates), By fertilizer (phosphatic, and potassic), By Region And Companies - Industry Segment Outlook, Market Assessment, Competition Scenario, Trends, And Forecast 2023-2032
-
24230
-
Oct 2023
-
181
-


-
This report was compiled by Shreyas Rokade Shreyas Rokade is a seasoned Research Analyst with CMFE, bringing extensive expertise in market research and consulting, with a strong background in Chemical Engineering. Correspondence Team Lead-CMFE Linkedin | Detailed Market research Methodology Our methodology involves a mix of primary research, including interviews with leading mental health experts, and secondary research from reputable medical journals and databases. View Detailed Methodology Page
-
Quick Navigation
Report Overview
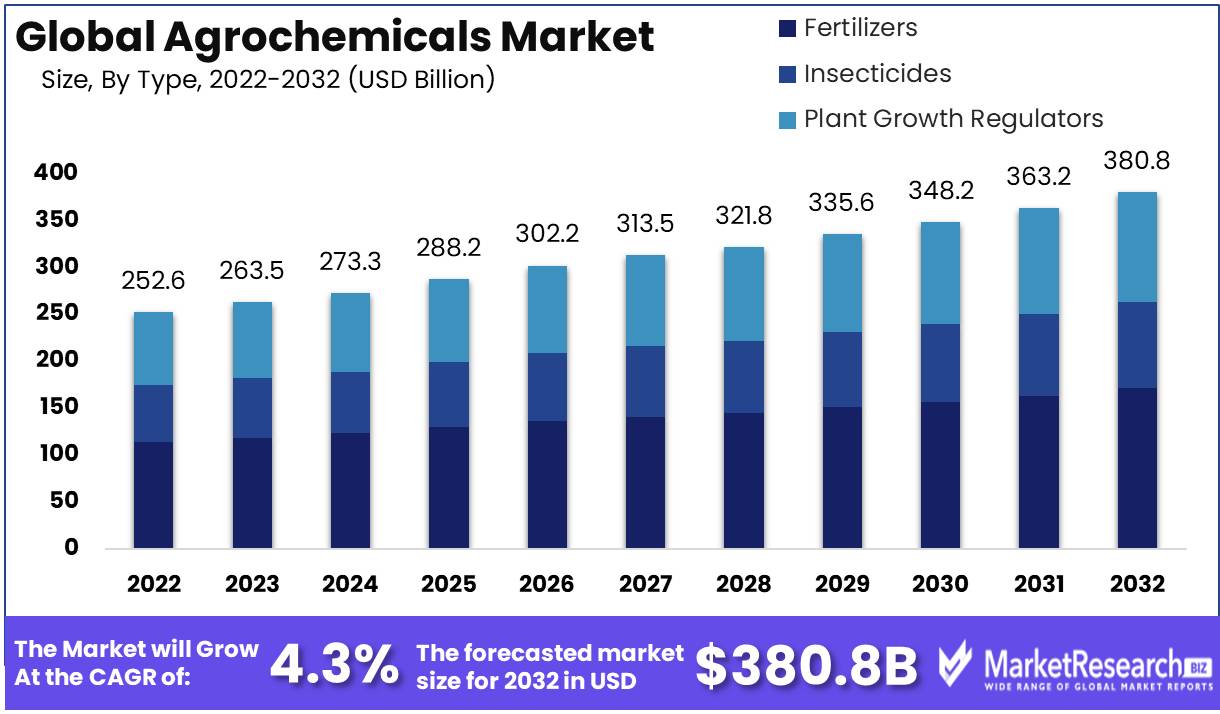
Agrochemicals Market size is expected to be worth around USD 380.8 Bn by 2032 from USD 252.6 Bn in 2022, growing at a CAGR of 4.3% during the forecast period from 2023 to 2032.
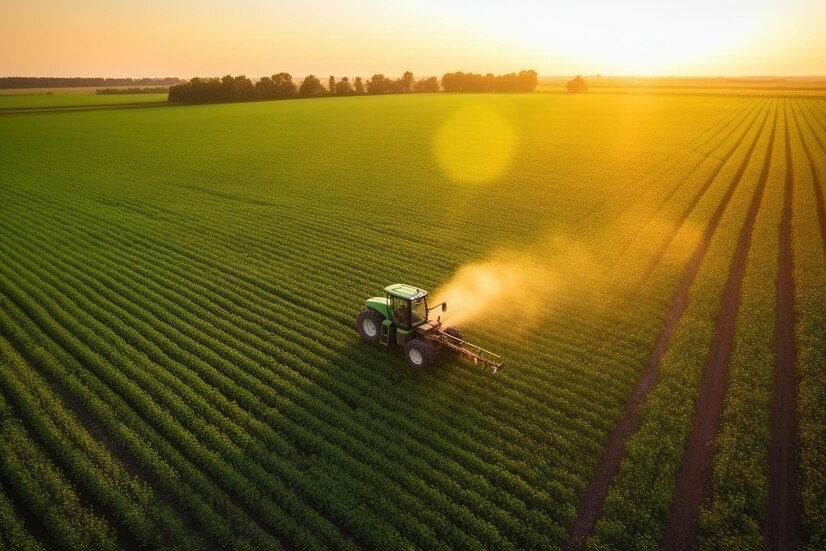
The Agrochemicals Market is currently one of the most rapidly expanding sectors in the globe. Agrochemicals are becoming more and more crucial due to the rising demand for food and the need for agricultural protection. In this blog post, we will provide a comprehensive summary of the Agrochemicals Market. The Agrochemicals Market report provides an analysis of the industry's size, growth rate, and leading market players. Also included in the report is a segmentation analysis by product type, application, and region.
The Agrochemicals Market is the market for the production, distribution, and sale of chemicals used in agriculture. These substances consist of fertilizers, pesticides, herbicides, and fungicides. The objective of the Agrochemicals Market is to provide solutions to the challenges of contemporary agriculture, such as plant diseases, parasites, and vegetation. It is difficult to exaggerate the significance of the Agrochemicals Market. It plays a crucial role in ensuring that there is sufficient sustenance to sustain the world's expanding population.
The Agrochemicals Market has witnessed a number of noteworthy innovations. New, more effective, and less harmful to the environment crop protection chemicals have been developed. In addition, biotechnology has been incorporated into agricultural products, resulting in genetically modified crops with increased resistance to pests and diseases. There are moral concerns regarding the use of agrochemicals. This includes their effects on the environment, human health, and animal welfare.
Companies are expected to provide complete disclosure of the chemicals used in their products, as well as their potential impact on the environment and human safety. In addition, an increasing number of businesses are employing policies that promote the responsible use of agrochemicals, such as the reduction of their use and the implementation of sustainable production practices.
The Agrochemicals Market is undergoing a significant transformation with a growing emphasis on sustainability and responsible practices. In recent years, there has been a heightened focus on arable land, agricultural land, and land management in North America. Companies operating in this sector are now required to be more transparent about the chemicals used in their products and their potential environmental and human safety implications. This shift towards transparency is not only driven by regulatory demands but also by changing consumer preferences and a heightened awareness of environmental concerns.
Furthermore, the technology landscape in the agrochemicals industry is evolving rapidly, with a strong emphasis on developing alternative nitrogen sources and sustainable production practices. This not only presents a business opportunity for companies willing to innovate but also underscores the importance of having a robust business plan that aligns with these changing dynamics.
Driving Factors
Rising Population and Food Demand
The Agrochemicals market is experiencing significant growth due to the increasing global population and the subsequent rise in food demand. As the population grows, the pressure on farmers to enhance their yields and productivity increases, driving the demand for agrochemicals. These chemical solutions play a crucial role in improving crop productivity and enabling farmers to meet the growing food requirements.
Modern Farming with GMOs
The adoption of modern farming techniques, such as precision farming, and the utilization of genetically modified crops are major drivers of the Agrochemicals market. These practices contribute to increased productivity and yield, further augmenting the demand for agrochemicals. Precision farming techniques allow farmers to accurately apply agrochemicals, optimizing their effectiveness and reducing wastage, while genetically modified crops are engineered to withstand pests and diseases, necessitating the use of agrochemicals for enhanced protection.
Government Subsidies and Initiatives
Government initiatives and subsidies aimed at farmers play a significant role in driving the growth of the Agrochemicals market. Governments worldwide provide incentives and support to farmers to encourage them to adopt agrochemicals and modern farming techniques. These initiatives promote increased usage of agrochemicals, foster innovation in the sector, and contribute to market expansion.
Improved Agrochemical Formulations
Technological advancements in agrochemical formulations are propelling market growth by enhancing the effectiveness of these chemical solutions. Continuous research and development efforts lead to the development of new and advanced formulations that improve crop protection and yield. The improved efficacy of agrochemicals drives the demand for these products in the market, as farmers seek more effective solutions for pest and disease management.
Precision and Mechanized farming
The adoption of precision farming techniques and increased farm mechanization positively impact the Agrochemicals market. Precision farming allows farmers to apply agrochemicals accurately, optimizing their usage and reducing waste. The ability to precisely target pests and diseases enhances the efficiency and effectiveness of agrochemicals. Additionally, farm mechanization enables farmers to increase productivity and reduce labor requirements, driving the demand for agrochemicals in mechanized farming systems.
Restraining Factors
Influencing Elements of the Agrochemicals Market
The agrochemicals market is a vital component of the agricultural industry because it provides effective methods for enhancing crop yields and quality. However, there are a number of factors inhibiting the expansion of this market. In this article, we will examine the numerous factors influencing the agrochemicals market and the industry's response to these factors.
Strict Governmental Requirements
Increasing government regulations regarding environmental protection and health hazards is one of the most significant factors influencing the agrochemicals market. Government agencies are instituting stringent guidelines to ensure the safe use of agrochemicals as they have become more aware of the risks associated with their use. This has resulted in increased costs for manufacturers and distributors, who must now comply with a vast array of regulations. This has also resulted in the introduction of new, more stringent regulations targeting particular chemicals, which can impact their market availability.
Impact of Agrochemicals on the Environment
The increasing concern over the environmental impact of agrochemicals is another factor that is bearing on the agrochemicals market. Concerns have been expressed by numerous environmental agencies and advocacy organizations regarding their negative impact on the environment and biodiversity. The excessive use of agrochemicals has resulted in soil and water contamination, which can be detrimental to ecosystems and human health. This has led to increased scrutiny and pressure on manufacturers and farmers to employ environmentally favorable and sustainable practices.
Expensive Agrochemicals
Over the past decade, agricultural inputs have become more expensive, and the agrochemicals market has followed suit. Farmers, particularly small-scale farmers, may not be able to afford the price of inputs due to the high price of agrochemicals. This has led to a decrease in demand for these products and an increase in demand for affordable alternatives. In addition, the high cost of agrochemicals has led to an increase in counterfeit products and the importation of substandard products onto the market, resulting in a decline in output quality and crop yields.
Lack of Skilled Labor in Agriculture
The lack of competent personnel in the agriculture industry is another factor restraining the Agrochemicals Market. Young people are less interested in pursuing careers in agriculture, resulting in a shortage of competent labor. This has increased labor costs for producers and decreased their output. In addition, the rising demand for skilled labor has increased production costs, which impacts the profitability of agrochemicals.
Increasing Acceptance of Organic Farming Methods
The increasing prevalence of organic agricultural practices is a further factor restraining the agrochemicals market. Increasingly, consumers are concerned about the potential health risks associated with the use of agrochemicals in food production. This has increased the demand for organic and natural food products, which contain no synthetic ingredients. This trend has led to a greater emphasis on sustainable agriculture practices, which are less harmful to the environment and do not rely on chemical inputs.
Type Analysis
Agrochemicals Market Segment Dominates Fertilizers Segment. In recent years, the use of agrochemicals has become an essential tool in the agriculture industry, with fertilizers being one of the most widely used varieties. Due to its capacity to increase crop productivity and yield, the fertilizers segment currently dominates the agrochemicals market. Fertilizers supply crops with vital nutrients, such as nitrogen, phosphorus, and potassium, which are essential for plant growth and development. Additional nitrogen has played a crucial role in this dominance.
Fertilizers dominate the agrochemicals industry because of ammonium nitrate and consumer behavior. Fertilizer demand is rising as consumers realize the benefits of fertilizing their crops. Since organic farming uses natural fertilizers to boost crop output, fertilizer consumption has increased. Fertilizers will increase quickest in the agrochemicals sector. Population increase, organic farming, and fertilizer awareness have contributed to this growth. Active ingredient in fertilizers is a significant factor here.
Application Analysis
Agrochemicals Market Segment Dominates Cereals & Grains Segment. Cereals and grains are among the most widely cultivated commodities worldwide; consequently, the cereals and grains segment currently dominates the agrochemicals market. These commodities are used extensively in numerous industries, such as food, animal feed, and biofuels, and serve as the primary source of nutrition for numerous nations. Utilizing agrochemicals, such as pesticides, and herbicides, has become indispensable for the successful cultivation of cereals and grains. The largest share in this dominance belongs to cereals and grains.
Consumer habits and behavior help cereals and grains dominate the agrochemicals business. Agrochemicals are in high demand as cereal and grain consumption rises. Cereal and grain output has increased as consumers choose healthier meals like whole grains. Cereals and grains are predicted to expand the quickest in the agrochemicals industry. Due to population increase, improved eating habits, and the organic agricultural sector, food and animal feed demand is rising. Pesticide product plays a significant role in this context.

Key Market Segments
By Type
- Fertilizers
- Nitrogenous Fertilizer
- Phosphatic Fertilizer
- Potassic Fertilizer
- Pesticides
- Insecticides
- Herbicides
- Fungicides
- Other Pesticides
- Plant Growth Regulators
By Application
- Cereal & Grains
- Oilseeds & Pulses
- Fruits & Vegetables
- Other Applications
Growth Opportunity
Precision Farming Technique Adoption
Due to the increasing adoption of precision agricultural techniques, the complementary mode agrochemicals market is expanding. Precision agriculture enables producers to maximize resource utilization, decrease expenses, and increase crop yields. The increasing demand for agrochemicals that complement precision agricultural techniques, such as targeted fertilization and pest control, is propelling market expansion.
Interest in Organic and Sustainable Farming
The increasing demand for sustainable and organic agricultural practices is driving the expansion of the agrochemicals market and capital income. Consumers are concerned about the environmental impact of conventional agricultural practices and are pursuing alternatives. This has resulted in an increase in the demand for agrochemicals derived from natural sources, such as healthy-growth biopesticides and biofertilizers, which are viewed as safer and more environmentally favorable.
Creation of New and Original Agrochemical Formulations
The development of new and novel agrochemical formulations is a major growth driver in the agrochemicals market. Manufacturers are investing in R&D to create products that are more efficient, environmentally sustainable, and safer for consumers. These developments result in the creation of specialized formulations tailored to specific crops and environmental conditions, allowing for more effective control of pests and diseases, and modes of action.
Emphasis on soil fertility and quality
Improving the fertility and character of the soil is a key focus of the agrochemicals market, thereby propelling its expansion. Agrochemicals play an essential role in enhancing soil health, boosting crop yields, and promoting plant health, and plant growth. They provide options to optimize nutrient availability, improve soil structure, and decrease soil erosion. Through the use of agrochemicals, producers can accomplish sustainable soil management practices and maximize agricultural output.
Demand for Biopesticides and Biofertilizers
The expansion of the agrochemicals market is being driven by the rising demand for biopesticides and biofertilizers. Derived from natural sources, biopesticides and biofertilizers provide effective pest and disease control with minimal environmental impact. They provide sustainable alternatives to conventional chemical-based solutions, in accordance with the growing preference for eco-friendly agricultural practices, commercial contracts, and joint ventures.
Latest Trends
Integrated Pest Management Techniques
Integrated Pest Management (IPM) is one of the key trends in the agrochemicals market. The increasing adoption of IPM techniques is driven by the need for sustainable and environmentally friendly agricultural practices. IPM aims to reduce the use of pesticides and mitigate their environmental impact while maintaining crop yields. It is an ongoing trend that emphasizes the importance of adequate plant nutrients.
Innovative new seed technologies
The development of new and innovative seed technologies is another ongoing trend influencing the agrochemicals market. In recent years, seed technology has advanced swiftly, and novel seedlings that are resistant to pests, diseases, and drought are being developed. These new seedlings enable producers to produce greater yields with fewer resources, resulting in greater profitability. Seed technology is a key driver of change in the industry.
Natural and Biobased Agrochemicals
Natural and bio-based agrochemicals, which include bio fungicides, bio insecticides, bioherbicides, and biostimulants, among others, are gaining popularity in the agrochemicals market. These products are derived from natural, non-synthetic sources and are considered safer for human and environmental health. They are a vital nutrient in the quest for more sustainable agriculture.
Drones and Other Technologies for Precision Agriculture
Changes in the agrochemicals market are also influenced by precision agriculture technologies. Drones and other precision agriculture tools are used to monitor crop health, predict yields, and optimize fertilizer and chemical applications. These precision farming technologies are reducing waste and enhancing efficiency, which will ultimately result in higher yields and greater profitability. Precision agriculture is a future trend shaping the industry.
Sustainable and Eco-Friendly Agriculture
In the agrochemicals market, there is a growing emphasis on sustainable and environmentally favorable agricultural practices. Consumers are increasingly aware of the environmental impact of agricultural practices, and sustainable agriculture is becoming a key trend. This shift in consumer demand is causing an increase in the demand for environmentally favorable products and influencing how producers manage their crops and use agrochemicals. Sustainable agriculture is another key driver of change in the industry.
Regional Analysis
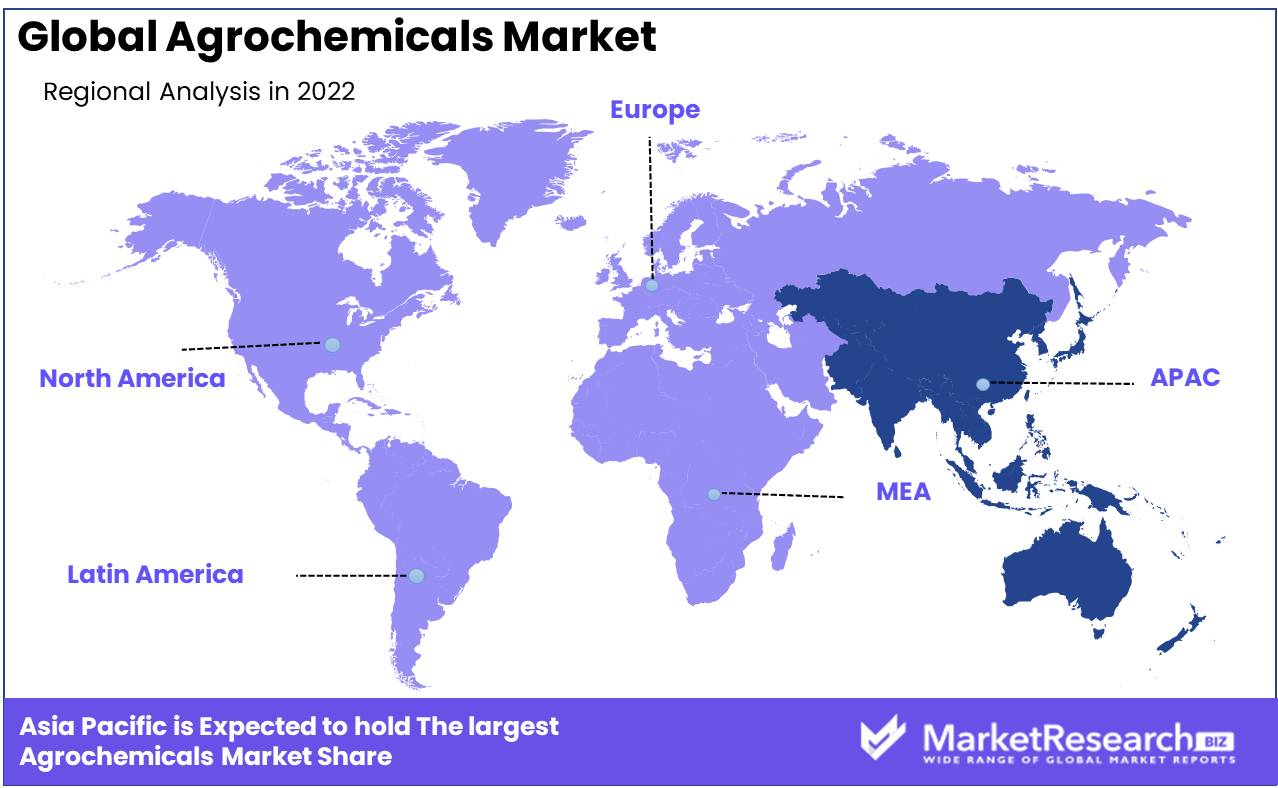
Asia Pacific has become a significant Agrochemicals Market. This expansion is fuelled by the presence of major agrochemical firms, the adoption of modern agricultural techniques, and an increasing emphasis on sustainable agriculture. In this article, we delve deeper into the factors propelling the growth of the Asia Pacific agrochemical market, as well as the repercussions for the industry as a whole.
Adoption of modern agricultural techniques is one of the main growth drivers for the Asia Pacific agrochemical market. Precision agriculture, which involves the use of technology to maximize crop yields while minimizing the use of inputs such as fertilizers and pesticides, is becoming increasingly popular among farmers in the United States and Canada.
Several technological advancements, including GPS systems and drone technology, facilitate precision agriculture in the Asia Pacific region. Farmers can now map their fields with unprecedented accuracy and monitor crop growth in real time. This enables them to make on-the-fly adjustments to their farming practices, ensuring that they use the appropriate quantity of inputs at the appropriate time.
Precision agriculture has been a game-changer for the agricultural industry, allowing producers to increase yields while decreasing expenses. The application of technology has also resulted in the creation of new, more targeted pesticides and fertilizers that can be administered with greater precision and in smaller quantities. This is beneficial for both the environment and the bottom line. Major agrochemical corporations' presence in Asia Pacific has also contributed to the expansion of the agrochemical industry. Companies such as Monsanto, Syngenta, and Dow Chemical have made substantial investments in research and development in the region.
Another crucial factor fueling the expansion of the Asia Pacific agrochemical market is sustainable agriculture. Farmers are under increasing pressure to employ sustainable agricultural practices due to growing concerns about food safety, environmental impact, and climate change. This has resulted in a shift away from conventional agricultural practices, which heavily relied on chemical inputs, and towards more sustainable methods. Utilizing eco-friendly agricultural techniques, such as crop rotation, cover cropping, and integrated pest management, is essential to sustainable agriculture.
Key Regions and Countries
North America
- US
- Canada
- Mexico
Western Europe
- Germany
- France
- The UK
- Spain
- Italy
- Portugal
- Ireland
- Austria
- Switzerland
- Benelux
- Nordic
- Rest of Western Europe
Eastern Europe
- Russia
- Poland
- The Czech Republic
- Greece
- Rest of Eastern Europe
APAC
- China
- Japan
- South Korea
- India
- Australia & New Zealand
- Indonesia
- Malaysia
- Philippines
- Singapore
- Thailand
- Vietnam
- Rest of APAC
Latin America
- Brazil
- Colombia
- Chile
- Argentina
- Costa Rica
- Rest of Latin America
Middle East & Africa
- Algeria
- Egypt
- Israel
- Kuwait
- Nigeria
- Saudi Arabia
- South Africa
- Turkey
- United Arab Emirates
- Rest of MEA
Key Players Analysis
The global agrochemicals market is extremely competitive, with a small number of major players. These entities are involved in the development and production of a vast array of agricultural inputs, including pesticides, herbicides, and fertilizers. In a highly competitive industry, companies with high levels of technological innovation, brand recognition, and robust distribution channels tend to be the most successful.
Syngenta AG is a global leader in the agrochemicals market, providing a comprehensive spectrum of crop protection products to meet the requirements of farmers worldwide. The company's research and development division's commitment to innovation is a key benefit and a major contributor to its success in this market.
BASF SE is another significant participant in the agrochemicals market, offering an extensive selection of premium agricultural inputs. The company is well-known for its commitment to sustainable development and has established its market position by offering a diverse product line and focusing on the consumer.
This placement emphasizes that Bayer AG, DowDuPont Inc., and FMC Corporation are not just participants but also major players in the agrochemicals market, highlighting their significant role in the industry.
Top Key Players in Agrochemicals Market
- Makhteshim Agan Industries Ltd
- Agrium Inc.
- Mosaic Company
- Indian Farmers Fertiliser Cooperative
- Potash Corp. SAS. Inc.
- Nufarm Ltd.
- Sumitomo Chemical
- Dow Agrosciences LLC.
- BASF SE
- Israel Chemicals Ltd.
- K+S AG
- E.I. Du Pont De Nemours & Company
- Sociedad Quimica Y Minera De Chile SA
- Yara International ASA
- Dow Chemical Limited
- Monsanto Company
- Adama
- Bayer AG
Recent Development
In 2021, Syngenta announced one of the most significant developments in the agrochemicals market. The company announced its intention to invest $2 billion over the next five years in sustainable agriculture. This move is anticipated to have a significant impact on the market, as sustainable agriculture gains importance in the modern world.
In 2021, Corteva Agriscience launched a new herbicide dubbed Enlist E3 soybeans, which was another significant development in the agrochemicals market. This product is designed to assist farmers in weed management in their fields and is anticipated to be a market leader in the future years.
In 2020, BASF made a significant acquisition in the agrochemicals market, acquiring a substantial portion of the seed and nonselective herbicide industries. This action is anticipated to strengthen the company's market position and help it remain competitive in the coming years.
In 2020, The Union Cabinet of India also made a significant move by authorizing the formation of a new entity that will concentrate on research and development in the agrochemicals market. This action is anticipated to stimulate innovation and industry expansion.
In 2019, A California couple was finally awarded $2 billion in damages from Monsanto. This decision was a major setback for the company and highlights the mounting concerns regarding the use of certain chemicals in the agrochemicals industry.
Report Scope
Report Features Description Market Value (2022) USD 252.6 Bn Forecast Revenue (2032) USD 380.8 Bn CAGR (2023-2032) 4.3% Base Year for Estimation 2022 Historic Period 2016-2022 Forecast Period 2023-2032 Report Coverage Revenue Forecast, Market Dynamics, COVID-19 Impact, Competitive Landscape, Recent Developments Segments Covered Type, fertilizers and pesticides, crop, cereals and grains, oilseeds and pulses, plantation crops, hydroponics and fruits, vegetables, pesticide, pyrethroids, organophosphates, bio-pesticides and neonicotinoids, fertilizer, phosphatic, nitrogenous and potassic) Regional Analysis North America – The US, Canada, & Mexico; Western Europe – Germany, France, The UK, Spain, Italy, Portugal, Ireland, Austria, Switzerland, Benelux, Nordic, & Rest of Western Europe; Eastern Europe – Russia, Poland, The Czech Republic, Greece, & Rest of Eastern Europe; APAC – China, Japan, South Korea, India, Australia & New Zealand, Indonesia, Malaysia, Philippines, Singapore, Thailand, Vietnam, & Rest of APAC; Latin America – Brazil, Colombia, Chile, Argentina, Costa Rica, & Rest of Latin America; Middle East & Africa – Algeria, Egypt, Israel, Kuwait, Nigeria, Saudi Arabia, South Africa, Turkey, United Arab Emirates, & Rest of MEA Competitive Landscape Makhteshim Agan Industries Ltd, Agrium Inc., Mosaic Company, Indian Farmers Fertiliser Cooperative, Potash Corp. SAS. Inc., Nufarm Ltd., Sumitomo Chemical, Dow Agrosciences LLC., BASF S.E., Israel Chemicals Ltd., K+S AG, E.I. Du Pont De Nemours & Company, Sociedad Quimica Y Minera De Chile SA, Yara International ASA, Dow Chemical Limited, Monsanto Company Customization Scope Customization for segments, region/country-level will be provided. Moreover, additional customization can be done based on the requirements. Purchase Options We have three licenses to opt for: Single User License, Multi-User License (Up to 5 Users), Corporate Use License (Unlimited User and Printable PDF) - Fertilizers
-
- 1. Executive Summary
- 1.1. Definition
- 1.2. Taxonomy
- 1.3. Research Scope
- 1.4. Key Analysis
- 1.5. Key Findings by Major Segments
- 1.6. Top strategies by Major Players
- 2. Global Agrochemicals Market Overview
- 2.1. Agrochemicals Market Dynamics
- 2.1.1. Drivers
- 2.1.2. Opportunities
- 2.1.3. Restraints
- 2.1.4. Challenges
- 2.2. Macro-economic Factors
- 2.3. Regulatory Framework
- 2.4. Market Investment Feasibility Index
- 2.5. PEST Analysis
- 2.6. PORTER’S Five Force Analysis
- 2.7. Drivers & Restraints Impact Analysis
- 2.8. Industry Chain Analysis
- 2.9. Cost Structure Analysis
- 2.10. Marketing Strategy
- 2.11. Russia-Ukraine War Impact Analysis
- 2.12. Opportunity Map Analysis
- 2.13. Market Competition Scenario Analysis
- 2.14. Product Life Cycle Analysis
- 2.15. Opportunity Orbits
- 2.16. Manufacturer Intensity Map
- 2.17. Major Companies sales by Value & Volume
- 2.1. Agrochemicals Market Dynamics
- 3. Global Agrochemicals Market Analysis, Opportunity and Forecast, 2016-2032
- 3.1. Global Agrochemicals Market Analysis, 2016-2021
- 3.2. Global Agrochemicals Market Opportunity and Forecast, 2023-2032
- 3.3. Global Agrochemicals Market Analysis, Opportunity and Forecast, By By Type, 2016-2032
- 3.3.1. Global Agrochemicals Market Analysis by By Type: Introduction
- 3.3.2. Market Size Absolute $ Opportunity Analysis and Forecast, By By Type, 2016-2032
- 3.3.3. fertilizers and pesticides
- 3.4. Global Agrochemicals Market Analysis, Opportunity and Forecast, By By crop, 2016-2032
- 3.4.1. Global Agrochemicals Market Analysis by By crop: Introduction
- 3.4.2. Market Size Absolute $ Opportunity Analysis and Forecast, By By crop, 2016-2032
- 3.4.3. cereals and grains
- 3.4.4. oilseeds and pulses
- 3.4.5. plantation crops
- 3.4.6. hydroponics and fruits
- 3.5. Global Agrochemicals Market Analysis, Opportunity and Forecast, By By vegetables, 2016-2032
- 3.5.1. Global Agrochemicals Market Analysis by By vegetables: Introduction
- 3.5.2. Market Size Absolute $ Opportunity Analysis and Forecast, By By vegetables, 2016-2032
- 3.5.3. pesticide
- 3.5.4. pyrethroids
- 3.5.5. organophosphates
- 3.5.6. bio-pesticides and neonicotinoids
- 3.6. Global Agrochemicals Market Analysis, Opportunity and Forecast, By By fertilizer, 2016-2032
- 3.6.1. Global Agrochemicals Market Analysis by By fertilizer: Introduction
- 3.6.2. Market Size Absolute $ Opportunity Analysis and Forecast, By By fertilizer, 2016-2032
- 3.6.3. phosphatic
- 3.6.4. nitrogenous and potassic
- 4. North America Agrochemicals Market Analysis, Opportunity and Forecast, 2016-2032
- 4.1. North America Agrochemicals Market Analysis, 2016-2021
- 4.2. North America Agrochemicals Market Opportunity and Forecast, 2023-2032
- 4.3. North America Agrochemicals Market Analysis, Opportunity and Forecast, By By Type, 2016-2032
- 4.3.1. North America Agrochemicals Market Analysis by By Type: Introduction
- 4.3.2. Market Size Absolute $ Opportunity Analysis and Forecast, By By Type, 2016-2032
- 4.3.3. fertilizers and pesticides
- 4.4. North America Agrochemicals Market Analysis, Opportunity and Forecast, By By crop, 2016-2032
- 4.4.1. North America Agrochemicals Market Analysis by By crop: Introduction
- 4.4.2. Market Size Absolute $ Opportunity Analysis and Forecast, By By crop, 2016-2032
- 4.4.3. cereals and grains
- 4.4.4. oilseeds and pulses
- 4.4.5. plantation crops
- 4.4.6. hydroponics and fruits
- 4.5. North America Agrochemicals Market Analysis, Opportunity and Forecast, By By vegetables, 2016-2032
- 4.5.1. North America Agrochemicals Market Analysis by By vegetables: Introduction
- 4.5.2. Market Size Absolute $ Opportunity Analysis and Forecast, By By vegetables, 2016-2032
- 4.5.3. pesticide
- 4.5.4. pyrethroids
- 4.5.5. organophosphates
- 4.5.6. bio-pesticides and neonicotinoids
- 4.6. North America Agrochemicals Market Analysis, Opportunity and Forecast, By By fertilizer, 2016-2032
- 4.6.1. North America Agrochemicals Market Analysis by By fertilizer: Introduction
- 4.6.2. Market Size Absolute $ Opportunity Analysis and Forecast, By By fertilizer, 2016-2032
- 4.6.3. phosphatic
- 4.6.4. nitrogenous and potassic
- 4.7. North America Agrochemicals Market Analysis, Opportunity and Forecast, By Country , 2016-2032
- 4.7.1. North America Agrochemicals Market Analysis by Country : Introduction
- 4.7.2. Market Size Absolute $ Opportunity Analysis and Forecast, Country , 2016-2032
- 4.7.2.1. The US
- 4.7.2.2. Canada
- 4.7.2.3. Mexico
- 5. Western Europe Agrochemicals Market Analysis, Opportunity and Forecast, 2016-2032
- 5.1. Western Europe Agrochemicals Market Analysis, 2016-2021
- 5.2. Western Europe Agrochemicals Market Opportunity and Forecast, 2023-2032
- 5.3. Western Europe Agrochemicals Market Analysis, Opportunity and Forecast, By By Type, 2016-2032
- 5.3.1. Western Europe Agrochemicals Market Analysis by By Type: Introduction
- 5.3.2. Market Size Absolute $ Opportunity Analysis and Forecast, By By Type, 2016-2032
- 5.3.3. fertilizers and pesticides
- 5.4. Western Europe Agrochemicals Market Analysis, Opportunity and Forecast, By By crop, 2016-2032
- 5.4.1. Western Europe Agrochemicals Market Analysis by By crop: Introduction
- 5.4.2. Market Size Absolute $ Opportunity Analysis and Forecast, By By crop, 2016-2032
- 5.4.3. cereals and grains
- 5.4.4. oilseeds and pulses
- 5.4.5. plantation crops
- 5.4.6. hydroponics and fruits
- 5.5. Western Europe Agrochemicals Market Analysis, Opportunity and Forecast, By By vegetables, 2016-2032
- 5.5.1. Western Europe Agrochemicals Market Analysis by By vegetables: Introduction
- 5.5.2. Market Size Absolute $ Opportunity Analysis and Forecast, By By vegetables, 2016-2032
- 5.5.3. pesticide
- 5.5.4. pyrethroids
- 5.5.5. organophosphates
- 5.5.6. bio-pesticides and neonicotinoids
- 5.6. Western Europe Agrochemicals Market Analysis, Opportunity and Forecast, By By fertilizer, 2016-2032
- 5.6.1. Western Europe Agrochemicals Market Analysis by By fertilizer: Introduction
- 5.6.2. Market Size Absolute $ Opportunity Analysis and Forecast, By By fertilizer, 2016-2032
- 5.6.3. phosphatic
- 5.6.4. nitrogenous and potassic
- 5.7. Western Europe Agrochemicals Market Analysis, Opportunity and Forecast, By Country , 2016-2032
- 5.7.1. Western Europe Agrochemicals Market Analysis by Country : Introduction
- 5.7.2. Market Size Absolute $ Opportunity Analysis and Forecast, Country , 2016-2032
- 5.7.2.1. Germany
- 5.7.2.2. France
- 5.7.2.3. The UK
- 5.7.2.4. Spain
- 5.7.2.5. Italy
- 5.7.2.6. Portugal
- 5.7.2.7. Ireland
- 5.7.2.8. Austria
- 5.7.2.9. Switzerland
- 5.7.2.10. Benelux
- 5.7.2.11. Nordic
- 5.7.2.12. Rest of Western Europe
- 6. Eastern Europe Agrochemicals Market Analysis, Opportunity and Forecast, 2016-2032
- 6.1. Eastern Europe Agrochemicals Market Analysis, 2016-2021
- 6.2. Eastern Europe Agrochemicals Market Opportunity and Forecast, 2023-2032
- 6.3. Eastern Europe Agrochemicals Market Analysis, Opportunity and Forecast, By By Type, 2016-2032
- 6.3.1. Eastern Europe Agrochemicals Market Analysis by By Type: Introduction
- 6.3.2. Market Size Absolute $ Opportunity Analysis and Forecast, By By Type, 2016-2032
- 6.3.3. fertilizers and pesticides
- 6.4. Eastern Europe Agrochemicals Market Analysis, Opportunity and Forecast, By By crop, 2016-2032
- 6.4.1. Eastern Europe Agrochemicals Market Analysis by By crop: Introduction
- 6.4.2. Market Size Absolute $ Opportunity Analysis and Forecast, By By crop, 2016-2032
- 6.4.3. cereals and grains
- 6.4.4. oilseeds and pulses
- 6.4.5. plantation crops
- 6.4.6. hydroponics and fruits
- 6.5. Eastern Europe Agrochemicals Market Analysis, Opportunity and Forecast, By By vegetables, 2016-2032
- 6.5.1. Eastern Europe Agrochemicals Market Analysis by By vegetables: Introduction
- 6.5.2. Market Size Absolute $ Opportunity Analysis and Forecast, By By vegetables, 2016-2032
- 6.5.3. pesticide
- 6.5.4. pyrethroids
- 6.5.5. organophosphates
- 6.5.6. bio-pesticides and neonicotinoids
- 6.6. Eastern Europe Agrochemicals Market Analysis, Opportunity and Forecast, By By fertilizer, 2016-2032
- 6.6.1. Eastern Europe Agrochemicals Market Analysis by By fertilizer: Introduction
- 6.6.2. Market Size Absolute $ Opportunity Analysis and Forecast, By By fertilizer, 2016-2032
- 6.6.3. phosphatic
- 6.6.4. nitrogenous and potassic
- 6.7. Eastern Europe Agrochemicals Market Analysis, Opportunity and Forecast, By Country , 2016-2032
- 6.7.1. Eastern Europe Agrochemicals Market Analysis by Country : Introduction
- 6.7.2. Market Size Absolute $ Opportunity Analysis and Forecast, Country , 2016-2032
- 6.7.2.1. Russia
- 6.7.2.2. Poland
- 6.7.2.3. The Czech Republic
- 6.7.2.4. Greece
- 6.7.2.5. Rest of Eastern Europe
- 7. APAC Agrochemicals Market Analysis, Opportunity and Forecast, 2016-2032
- 7.1. APAC Agrochemicals Market Analysis, 2016-2021
- 7.2. APAC Agrochemicals Market Opportunity and Forecast, 2023-2032
- 7.3. APAC Agrochemicals Market Analysis, Opportunity and Forecast, By By Type, 2016-2032
- 7.3.1. APAC Agrochemicals Market Analysis by By Type: Introduction
- 7.3.2. Market Size Absolute $ Opportunity Analysis and Forecast, By By Type, 2016-2032
- 7.3.3. fertilizers and pesticides
- 7.4. APAC Agrochemicals Market Analysis, Opportunity and Forecast, By By crop, 2016-2032
- 7.4.1. APAC Agrochemicals Market Analysis by By crop: Introduction
- 7.4.2. Market Size Absolute $ Opportunity Analysis and Forecast, By By crop, 2016-2032
- 7.4.3. cereals and grains
- 7.4.4. oilseeds and pulses
- 7.4.5. plantation crops
- 7.4.6. hydroponics and fruits
- 7.5. APAC Agrochemicals Market Analysis, Opportunity and Forecast, By By vegetables, 2016-2032
- 7.5.1. APAC Agrochemicals Market Analysis by By vegetables: Introduction
- 7.5.2. Market Size Absolute $ Opportunity Analysis and Forecast, By By vegetables, 2016-2032
- 7.5.3. pesticide
- 7.5.4. pyrethroids
- 7.5.5. organophosphates
- 7.5.6. bio-pesticides and neonicotinoids
- 7.6. APAC Agrochemicals Market Analysis, Opportunity and Forecast, By By fertilizer, 2016-2032
- 7.6.1. APAC Agrochemicals Market Analysis by By fertilizer: Introduction
- 7.6.2. Market Size Absolute $ Opportunity Analysis and Forecast, By By fertilizer, 2016-2032
- 7.6.3. phosphatic
- 7.6.4. nitrogenous and potassic
- 7.7. APAC Agrochemicals Market Analysis, Opportunity and Forecast, By Country , 2016-2032
- 7.7.1. APAC Agrochemicals Market Analysis by Country : Introduction
- 7.7.2. Market Size Absolute $ Opportunity Analysis and Forecast, Country , 2016-2032
- 7.7.2.1. China
- 7.7.2.2. Japan
- 7.7.2.3. South Korea
- 7.7.2.4. India
- 7.7.2.5. Australia & New Zeland
- 7.7.2.6. Indonesia
- 7.7.2.7. Malaysia
- 7.7.2.8. Philippines
- 7.7.2.9. Singapore
- 7.7.2.10. Thailand
- 7.7.2.11. Vietnam
- 7.7.2.12. Rest of APAC
- 8. Latin America Agrochemicals Market Analysis, Opportunity and Forecast, 2016-2032
- 8.1. Latin America Agrochemicals Market Analysis, 2016-2021
- 8.2. Latin America Agrochemicals Market Opportunity and Forecast, 2023-2032
- 8.3. Latin America Agrochemicals Market Analysis, Opportunity and Forecast, By By Type, 2016-2032
- 8.3.1. Latin America Agrochemicals Market Analysis by By Type: Introduction
- 8.3.2. Market Size Absolute $ Opportunity Analysis and Forecast, By By Type, 2016-2032
- 8.3.3. fertilizers and pesticides
- 8.4. Latin America Agrochemicals Market Analysis, Opportunity and Forecast, By By crop, 2016-2032
- 8.4.1. Latin America Agrochemicals Market Analysis by By crop: Introduction
- 8.4.2. Market Size Absolute $ Opportunity Analysis and Forecast, By By crop, 2016-2032
- 8.4.3. cereals and grains
- 8.4.4. oilseeds and pulses
- 8.4.5. plantation crops
- 8.4.6. hydroponics and fruits
- 8.5. Latin America Agrochemicals Market Analysis, Opportunity and Forecast, By By vegetables, 2016-2032
- 8.5.1. Latin America Agrochemicals Market Analysis by By vegetables: Introduction
- 8.5.2. Market Size Absolute $ Opportunity Analysis and Forecast, By By vegetables, 2016-2032
- 8.5.3. pesticide
- 8.5.4. pyrethroids
- 8.5.5. organophosphates
- 8.5.6. bio-pesticides and neonicotinoids
- 8.6. Latin America Agrochemicals Market Analysis, Opportunity and Forecast, By By fertilizer, 2016-2032
- 8.6.1. Latin America Agrochemicals Market Analysis by By fertilizer: Introduction
- 8.6.2. Market Size Absolute $ Opportunity Analysis and Forecast, By By fertilizer, 2016-2032
- 8.6.3. phosphatic
- 8.6.4. nitrogenous and potassic
- 8.7. Latin America Agrochemicals Market Analysis, Opportunity and Forecast, By Country , 2016-2032
- 8.7.1. Latin America Agrochemicals Market Analysis by Country : Introduction
- 8.7.2. Market Size Absolute $ Opportunity Analysis and Forecast, Country , 2016-2032
- 8.7.2.1. Brazil
- 8.7.2.2. Colombia
- 8.7.2.3. Chile
- 8.7.2.4. Argentina
- 8.7.2.5. Costa Rica
- 8.7.2.6. Rest of Latin America
- 9. Middle East & Africa Agrochemicals Market Analysis, Opportunity and Forecast, 2016-2032
- 9.1. Middle East & Africa Agrochemicals Market Analysis, 2016-2021
- 9.2. Middle East & Africa Agrochemicals Market Opportunity and Forecast, 2023-2032
- 9.3. Middle East & Africa Agrochemicals Market Analysis, Opportunity and Forecast, By By Type, 2016-2032
- 9.3.1. Middle East & Africa Agrochemicals Market Analysis by By Type: Introduction
- 9.3.2. Market Size Absolute $ Opportunity Analysis and Forecast, By By Type, 2016-2032
- 9.3.3. fertilizers and pesticides
- 9.4. Middle East & Africa Agrochemicals Market Analysis, Opportunity and Forecast, By By crop, 2016-2032
- 9.4.1. Middle East & Africa Agrochemicals Market Analysis by By crop: Introduction
- 9.4.2. Market Size Absolute $ Opportunity Analysis and Forecast, By By crop, 2016-2032
- 9.4.3. cereals and grains
- 9.4.4. oilseeds and pulses
- 9.4.5. plantation crops
- 9.4.6. hydroponics and fruits
- 9.5. Middle East & Africa Agrochemicals Market Analysis, Opportunity and Forecast, By By vegetables, 2016-2032
- 9.5.1. Middle East & Africa Agrochemicals Market Analysis by By vegetables: Introduction
- 9.5.2. Market Size Absolute $ Opportunity Analysis and Forecast, By By vegetables, 2016-2032
- 9.5.3. pesticide
- 9.5.4. pyrethroids
- 9.5.5. organophosphates
- 9.5.6. bio-pesticides and neonicotinoids
- 9.6. Middle East & Africa Agrochemicals Market Analysis, Opportunity and Forecast, By By fertilizer, 2016-2032
- 9.6.1. Middle East & Africa Agrochemicals Market Analysis by By fertilizer: Introduction
- 9.6.2. Market Size Absolute $ Opportunity Analysis and Forecast, By By fertilizer, 2016-2032
- 9.6.3. phosphatic
- 9.6.4. nitrogenous and potassic
- 9.7. Middle East & Africa Agrochemicals Market Analysis, Opportunity and Forecast, By Country , 2016-2032
- 9.7.1. Middle East & Africa Agrochemicals Market Analysis by Country : Introduction
- 9.7.2. Market Size Absolute $ Opportunity Analysis and Forecast, Country , 2016-2032
- 9.7.2.1. Algeria
- 9.7.2.2. Egypt
- 9.7.2.3. Israel
- 9.7.2.4. Kuwait
- 9.7.2.5. Nigeria
- 9.7.2.6. Saudi Arabia
- 9.7.2.7. South Africa
- 9.7.2.8. Turkey
- 9.7.2.9. The UAE
- 9.7.2.10. Rest of MEA
- 10. Global Agrochemicals Market Analysis, Opportunity and Forecast, By Region , 2016-2032
- 10.1. Global Agrochemicals Market Analysis by Region : Introduction
- 10.2. Market Size Absolute $ Opportunity Analysis and Forecast, By Region , 2016-2032
- 10.2.1. North America
- 10.2.2. Western Europe
- 10.2.3. Eastern Europe
- 10.2.4. APAC
- 10.2.5. Latin America
- 10.2.6. Middle East & Africa
- 11. Global Agrochemicals Market Competitive Landscape, Market Share Analysis, and Company Profiles
- 11.1. Market Share Analysis
- 11.2. Company Profiles
- 11.3. Makhteshim Agan Industries Ltd
- 11.3.1. Company Overview
- 11.3.2. Financial Highlights
- 11.3.3. Product Portfolio
- 11.3.4. SWOT Analysis
- 11.3.5. Key Strategies and Developments
- 11.4. Agrium Inc.
- 11.4.1. Company Overview
- 11.4.2. Financial Highlights
- 11.4.3. Product Portfolio
- 11.4.4. SWOT Analysis
- 11.4.5. Key Strategies and Developments
- 11.5. Mosaic Company
- 11.5.1. Company Overview
- 11.5.2. Financial Highlights
- 11.5.3. Product Portfolio
- 11.5.4. SWOT Analysis
- 11.5.5. Key Strategies and Developments
- 11.6. Indian Farmers Fertiliser Cooperative
- 11.6.1. Company Overview
- 11.6.2. Financial Highlights
- 11.6.3. Product Portfolio
- 11.6.4. SWOT Analysis
- 11.6.5. Key Strategies and Developments
- 11.7. Potash Corp. SAS. Inc.
- 11.7.1. Company Overview
- 11.7.2. Financial Highlights
- 11.7.3. Product Portfolio
- 11.7.4. SWOT Analysis
- 11.7.5. Key Strategies and Developments
- 11.8. Nufarm Ltd.
- 11.8.1. Company Overview
- 11.8.2. Financial Highlights
- 11.8.3. Product Portfolio
- 11.8.4. SWOT Analysis
- 11.8.5. Key Strategies and Developments
- 11.9. Sumitomo Chemical
- 11.9.1. Company Overview
- 11.9.2. Financial Highlights
- 11.9.3. Product Portfolio
- 11.9.4. SWOT Analysis
- 11.9.5. Key Strategies and Developments
- 11.10. Dow Agrosciences LLC.
- 11.10.1. Company Overview
- 11.10.2. Financial Highlights
- 11.10.3. Product Portfolio
- 11.10.4. SWOT Analysis
- 11.10.5. Key Strategies and Developments
- 11.11. BASF S.E.
- 11.11.1. Company Overview
- 11.11.2. Financial Highlights
- 11.11.3. Product Portfolio
- 11.11.4. SWOT Analysis
- 11.11.5. Key Strategies and Developments
- 11.12. Israel Chemicals Ltd.
- 11.12.1. Company Overview
- 11.12.2. Financial Highlights
- 11.12.3. Product Portfolio
- 11.12.4. SWOT Analysis
- 11.12.5. Key Strategies and Developments
- 11.13. K+S AG
- 11.13.1. Company Overview
- 11.13.2. Financial Highlights
- 11.13.3. Product Portfolio
- 11.13.4. SWOT Analysis
- 11.13.5. Key Strategies and Developments
- 11.14. E.I. Du Pont De Nemours & Company
- 11.14.1. Company Overview
- 11.14.2. Financial Highlights
- 11.14.3. Product Portfolio
- 11.14.4. SWOT Analysis
- 11.14.5. Key Strategies and Developments
- 11.15. Sociedad Quimica Y Minera De Chile SA
- 11.15.1. Company Overview
- 11.15.2. Financial Highlights
- 11.15.3. Product Portfolio
- 11.15.4. SWOT Analysis
- 11.15.5. Key Strategies and Developments
- 11.16. Yara International ASA
- 11.16.1. Company Overview
- 11.16.2. Financial Highlights
- 11.16.3. Product Portfolio
- 11.16.4. SWOT Analysis
- 11.16.5. Key Strategies and Developments
- 11.17. Dow Chemical Limited
- 11.17.1. Company Overview
- 11.17.2. Financial Highlights
- 11.17.3. Product Portfolio
- 11.17.4. SWOT Analysis
- 11.17.5. Key Strategies and Developments
- 11.18. Monsanto Company
- 11.18.1. Company Overview
- 11.18.2. Financial Highlights
- 11.18.3. Product Portfolio
- 11.18.4. SWOT Analysis
- 11.18.5. Key Strategies and Developments
- 12. Assumptions and Acronyms
- 13. Research Methodology
- 14. Contact
- List of Figures
- Figure 1: Global Agrochemicals Market Revenue (US$ Mn) Market Share by By Type in 2022
- Figure 2: Global Agrochemicals Market Attractiveness Analysis by By Type, 2016-2032
- Figure 3: Global Agrochemicals Market Revenue (US$ Mn) Market Share by By cropin 2022
- Figure 4: Global Agrochemicals Market Attractiveness Analysis by By crop, 2016-2032
- Figure 5: Global Agrochemicals Market Revenue (US$ Mn) Market Share by By vegetablesin 2022
- Figure 6: Global Agrochemicals Market Attractiveness Analysis by By vegetables, 2016-2032
- Figure 7: Global Agrochemicals Market Revenue (US$ Mn) Market Share by By fertilizerin 2022
- Figure 8: Global Agrochemicals Market Attractiveness Analysis by By fertilizer, 2016-2032
- Figure 9: Global Agrochemicals Market Revenue (US$ Mn) Market Share by Region in 2022
- Figure 10: Global Agrochemicals Market Attractiveness Analysis by Region, 2016-2032
- Figure 11: Global Agrochemicals Market Revenue (US$ Mn) (2016-2032)
- Figure 12: Global Agrochemicals Market Revenue (US$ Mn) Comparison by Region (2016-2032)
- Figure 13: Global Agrochemicals Market Revenue (US$ Mn) Comparison by By Type (2016-2032)
- Figure 14: Global Agrochemicals Market Revenue (US$ Mn) Comparison by By crop (2016-2032)
- Figure 15: Global Agrochemicals Market Revenue (US$ Mn) Comparison by By vegetables (2016-2032)
- Figure 16: Global Agrochemicals Market Revenue (US$ Mn) Comparison by By fertilizer (2016-2032)
- Figure 17: Global Agrochemicals Market Y-o-Y Growth Rate Comparison by Region (2016-2032)
- Figure 18: Global Agrochemicals Market Y-o-Y Growth Rate Comparison by By Type (2016-2032)
- Figure 19: Global Agrochemicals Market Y-o-Y Growth Rate Comparison by By crop (2016-2032)
- Figure 20: Global Agrochemicals Market Y-o-Y Growth Rate Comparison by By vegetables (2016-2032)
- Figure 21: Global Agrochemicals Market Y-o-Y Growth Rate Comparison by By fertilizer (2016-2032)
- Figure 22: Global Agrochemicals Market Share Comparison by Region (2016-2032)
- Figure 23: Global Agrochemicals Market Share Comparison by By Type (2016-2032)
- Figure 24: Global Agrochemicals Market Share Comparison by By crop (2016-2032)
- Figure 25: Global Agrochemicals Market Share Comparison by By vegetables (2016-2032)
- Figure 26: Global Agrochemicals Market Share Comparison by By fertilizer (2016-2032)
- Figure 27: North America Agrochemicals Market Revenue (US$ Mn) Market Share by By Typein 2022
- Figure 28: North America Agrochemicals Market Attractiveness Analysis by By Type, 2016-2032
- Figure 29: North America Agrochemicals Market Revenue (US$ Mn) Market Share by By cropin 2022
- Figure 30: North America Agrochemicals Market Attractiveness Analysis by By crop, 2016-2032
- Figure 31: North America Agrochemicals Market Revenue (US$ Mn) Market Share by By vegetablesin 2022
- Figure 32: North America Agrochemicals Market Attractiveness Analysis by By vegetables, 2016-2032
- Figure 33: North America Agrochemicals Market Revenue (US$ Mn) Market Share by By fertilizerin 2022
- Figure 34: North America Agrochemicals Market Attractiveness Analysis by By fertilizer, 2016-2032
- Figure 35: North America Agrochemicals Market Revenue (US$ Mn) Market Share by Country in 2022
- Figure 36: North America Agrochemicals Market Attractiveness Analysis by Country, 2016-2032
- Figure 37: North America Agrochemicals Market Revenue (US$ Mn) (2016-2032)
- Figure 38: North America Agrochemicals Market Revenue (US$ Mn) Comparison by Country (2016-2032)
- Figure 39: North America Agrochemicals Market Revenue (US$ Mn) Comparison by By Type (2016-2032)
- Figure 40: North America Agrochemicals Market Revenue (US$ Mn) Comparison by By crop (2016-2032)
- Figure 41: North America Agrochemicals Market Revenue (US$ Mn) Comparison by By vegetables (2016-2032)
- Figure 42: North America Agrochemicals Market Revenue (US$ Mn) Comparison by By fertilizer (2016-2032)
- Figure 43: North America Agrochemicals Market Y-o-Y Growth Rate Comparison by Country (2016-2032)
- Figure 44: North America Agrochemicals Market Y-o-Y Growth Rate Comparison by By Type (2016-2032)
- Figure 45: North America Agrochemicals Market Y-o-Y Growth Rate Comparison by By crop (2016-2032)
- Figure 46: North America Agrochemicals Market Y-o-Y Growth Rate Comparison by By vegetables (2016-2032)
- Figure 47: North America Agrochemicals Market Y-o-Y Growth Rate Comparison by By fertilizer (2016-2032)
- Figure 48: North America Agrochemicals Market Share Comparison by Country (2016-2032)
- Figure 49: North America Agrochemicals Market Share Comparison by By Type (2016-2032)
- Figure 50: North America Agrochemicals Market Share Comparison by By crop (2016-2032)
- Figure 51: North America Agrochemicals Market Share Comparison by By vegetables (2016-2032)
- Figure 52: North America Agrochemicals Market Share Comparison by By fertilizer (2016-2032)
- Figure 53: Western Europe Agrochemicals Market Revenue (US$ Mn) Market Share by By Typein 2022
- Figure 54: Western Europe Agrochemicals Market Attractiveness Analysis by By Type, 2016-2032
- Figure 55: Western Europe Agrochemicals Market Revenue (US$ Mn) Market Share by By cropin 2022
- Figure 56: Western Europe Agrochemicals Market Attractiveness Analysis by By crop, 2016-2032
- Figure 57: Western Europe Agrochemicals Market Revenue (US$ Mn) Market Share by By vegetablesin 2022
- Figure 58: Western Europe Agrochemicals Market Attractiveness Analysis by By vegetables, 2016-2032
- Figure 59: Western Europe Agrochemicals Market Revenue (US$ Mn) Market Share by By fertilizerin 2022
- Figure 60: Western Europe Agrochemicals Market Attractiveness Analysis by By fertilizer, 2016-2032
- Figure 61: Western Europe Agrochemicals Market Revenue (US$ Mn) Market Share by Country in 2022
- Figure 62: Western Europe Agrochemicals Market Attractiveness Analysis by Country, 2016-2032
- Figure 63: Western Europe Agrochemicals Market Revenue (US$ Mn) (2016-2032)
- Figure 64: Western Europe Agrochemicals Market Revenue (US$ Mn) Comparison by Country (2016-2032)
- Figure 65: Western Europe Agrochemicals Market Revenue (US$ Mn) Comparison by By Type (2016-2032)
- Figure 66: Western Europe Agrochemicals Market Revenue (US$ Mn) Comparison by By crop (2016-2032)
- Figure 67: Western Europe Agrochemicals Market Revenue (US$ Mn) Comparison by By vegetables (2016-2032)
- Figure 68: Western Europe Agrochemicals Market Revenue (US$ Mn) Comparison by By fertilizer (2016-2032)
- Figure 69: Western Europe Agrochemicals Market Y-o-Y Growth Rate Comparison by Country (2016-2032)
- Figure 70: Western Europe Agrochemicals Market Y-o-Y Growth Rate Comparison by By Type (2016-2032)
- Figure 71: Western Europe Agrochemicals Market Y-o-Y Growth Rate Comparison by By crop (2016-2032)
- Figure 72: Western Europe Agrochemicals Market Y-o-Y Growth Rate Comparison by By vegetables (2016-2032)
- Figure 73: Western Europe Agrochemicals Market Y-o-Y Growth Rate Comparison by By fertilizer (2016-2032)
- Figure 74: Western Europe Agrochemicals Market Share Comparison by Country (2016-2032)
- Figure 75: Western Europe Agrochemicals Market Share Comparison by By Type (2016-2032)
- Figure 76: Western Europe Agrochemicals Market Share Comparison by By crop (2016-2032)
- Figure 77: Western Europe Agrochemicals Market Share Comparison by By vegetables (2016-2032)
- Figure 78: Western Europe Agrochemicals Market Share Comparison by By fertilizer (2016-2032)
- Figure 79: Eastern Europe Agrochemicals Market Revenue (US$ Mn) Market Share by By Typein 2022
- Figure 80: Eastern Europe Agrochemicals Market Attractiveness Analysis by By Type, 2016-2032
- Figure 81: Eastern Europe Agrochemicals Market Revenue (US$ Mn) Market Share by By cropin 2022
- Figure 82: Eastern Europe Agrochemicals Market Attractiveness Analysis by By crop, 2016-2032
- Figure 83: Eastern Europe Agrochemicals Market Revenue (US$ Mn) Market Share by By vegetablesin 2022
- Figure 84: Eastern Europe Agrochemicals Market Attractiveness Analysis by By vegetables, 2016-2032
- Figure 85: Eastern Europe Agrochemicals Market Revenue (US$ Mn) Market Share by By fertilizerin 2022
- Figure 86: Eastern Europe Agrochemicals Market Attractiveness Analysis by By fertilizer, 2016-2032
- Figure 87: Eastern Europe Agrochemicals Market Revenue (US$ Mn) Market Share by Country in 2022
- Figure 88: Eastern Europe Agrochemicals Market Attractiveness Analysis by Country, 2016-2032
- Figure 89: Eastern Europe Agrochemicals Market Revenue (US$ Mn) (2016-2032)
- Figure 90: Eastern Europe Agrochemicals Market Revenue (US$ Mn) Comparison by Country (2016-2032)
- Figure 91: Eastern Europe Agrochemicals Market Revenue (US$ Mn) Comparison by By Type (2016-2032)
- Figure 92: Eastern Europe Agrochemicals Market Revenue (US$ Mn) Comparison by By crop (2016-2032)
- Figure 93: Eastern Europe Agrochemicals Market Revenue (US$ Mn) Comparison by By vegetables (2016-2032)
- Figure 94: Eastern Europe Agrochemicals Market Revenue (US$ Mn) Comparison by By fertilizer (2016-2032)
- Figure 95: Eastern Europe Agrochemicals Market Y-o-Y Growth Rate Comparison by Country (2016-2032)
- Figure 96: Eastern Europe Agrochemicals Market Y-o-Y Growth Rate Comparison by By Type (2016-2032)
- Figure 97: Eastern Europe Agrochemicals Market Y-o-Y Growth Rate Comparison by By crop (2016-2032)
- Figure 98: Eastern Europe Agrochemicals Market Y-o-Y Growth Rate Comparison by By vegetables (2016-2032)
- Figure 99: Eastern Europe Agrochemicals Market Y-o-Y Growth Rate Comparison by By fertilizer (2016-2032)
- Figure 100: Eastern Europe Agrochemicals Market Share Comparison by Country (2016-2032)
- Figure 101: Eastern Europe Agrochemicals Market Share Comparison by By Type (2016-2032)
- Figure 102: Eastern Europe Agrochemicals Market Share Comparison by By crop (2016-2032)
- Figure 103: Eastern Europe Agrochemicals Market Share Comparison by By vegetables (2016-2032)
- Figure 104: Eastern Europe Agrochemicals Market Share Comparison by By fertilizer (2016-2032)
- Figure 105: APAC Agrochemicals Market Revenue (US$ Mn) Market Share by By Typein 2022
- Figure 106: APAC Agrochemicals Market Attractiveness Analysis by By Type, 2016-2032
- Figure 107: APAC Agrochemicals Market Revenue (US$ Mn) Market Share by By cropin 2022
- Figure 108: APAC Agrochemicals Market Attractiveness Analysis by By crop, 2016-2032
- Figure 109: APAC Agrochemicals Market Revenue (US$ Mn) Market Share by By vegetablesin 2022
- Figure 110: APAC Agrochemicals Market Attractiveness Analysis by By vegetables, 2016-2032
- Figure 111: APAC Agrochemicals Market Revenue (US$ Mn) Market Share by By fertilizerin 2022
- Figure 112: APAC Agrochemicals Market Attractiveness Analysis by By fertilizer, 2016-2032
- Figure 113: APAC Agrochemicals Market Revenue (US$ Mn) Market Share by Country in 2022
- Figure 114: APAC Agrochemicals Market Attractiveness Analysis by Country, 2016-2032
- Figure 115: APAC Agrochemicals Market Revenue (US$ Mn) (2016-2032)
- Figure 116: APAC Agrochemicals Market Revenue (US$ Mn) Comparison by Country (2016-2032)
- Figure 117: APAC Agrochemicals Market Revenue (US$ Mn) Comparison by By Type (2016-2032)
- Figure 118: APAC Agrochemicals Market Revenue (US$ Mn) Comparison by By crop (2016-2032)
- Figure 119: APAC Agrochemicals Market Revenue (US$ Mn) Comparison by By vegetables (2016-2032)
- Figure 120: APAC Agrochemicals Market Revenue (US$ Mn) Comparison by By fertilizer (2016-2032)
- Figure 121: APAC Agrochemicals Market Y-o-Y Growth Rate Comparison by Country (2016-2032)
- Figure 122: APAC Agrochemicals Market Y-o-Y Growth Rate Comparison by By Type (2016-2032)
- Figure 123: APAC Agrochemicals Market Y-o-Y Growth Rate Comparison by By crop (2016-2032)
- Figure 124: APAC Agrochemicals Market Y-o-Y Growth Rate Comparison by By vegetables (2016-2032)
- Figure 125: APAC Agrochemicals Market Y-o-Y Growth Rate Comparison by By fertilizer (2016-2032)
- Figure 126: APAC Agrochemicals Market Share Comparison by Country (2016-2032)
- Figure 127: APAC Agrochemicals Market Share Comparison by By Type (2016-2032)
- Figure 128: APAC Agrochemicals Market Share Comparison by By crop (2016-2032)
- Figure 129: APAC Agrochemicals Market Share Comparison by By vegetables (2016-2032)
- Figure 130: APAC Agrochemicals Market Share Comparison by By fertilizer (2016-2032)
- Figure 131: Latin America Agrochemicals Market Revenue (US$ Mn) Market Share by By Typein 2022
- Figure 132: Latin America Agrochemicals Market Attractiveness Analysis by By Type, 2016-2032
- Figure 133: Latin America Agrochemicals Market Revenue (US$ Mn) Market Share by By cropin 2022
- Figure 134: Latin America Agrochemicals Market Attractiveness Analysis by By crop, 2016-2032
- Figure 135: Latin America Agrochemicals Market Revenue (US$ Mn) Market Share by By vegetablesin 2022
- Figure 136: Latin America Agrochemicals Market Attractiveness Analysis by By vegetables, 2016-2032
- Figure 137: Latin America Agrochemicals Market Revenue (US$ Mn) Market Share by By fertilizerin 2022
- Figure 138: Latin America Agrochemicals Market Attractiveness Analysis by By fertilizer, 2016-2032
- Figure 139: Latin America Agrochemicals Market Revenue (US$ Mn) Market Share by Country in 2022
- Figure 140: Latin America Agrochemicals Market Attractiveness Analysis by Country, 2016-2032
- Figure 141: Latin America Agrochemicals Market Revenue (US$ Mn) (2016-2032)
- Figure 142: Latin America Agrochemicals Market Revenue (US$ Mn) Comparison by Country (2016-2032)
- Figure 143: Latin America Agrochemicals Market Revenue (US$ Mn) Comparison by By Type (2016-2032)
- Figure 144: Latin America Agrochemicals Market Revenue (US$ Mn) Comparison by By crop (2016-2032)
- Figure 145: Latin America Agrochemicals Market Revenue (US$ Mn) Comparison by By vegetables (2016-2032)
- Figure 146: Latin America Agrochemicals Market Revenue (US$ Mn) Comparison by By fertilizer (2016-2032)
- Figure 147: Latin America Agrochemicals Market Y-o-Y Growth Rate Comparison by Country (2016-2032)
- Figure 148: Latin America Agrochemicals Market Y-o-Y Growth Rate Comparison by By Type (2016-2032)
- Figure 149: Latin America Agrochemicals Market Y-o-Y Growth Rate Comparison by By crop (2016-2032)
- Figure 150: Latin America Agrochemicals Market Y-o-Y Growth Rate Comparison by By vegetables (2016-2032)
- Figure 151: Latin America Agrochemicals Market Y-o-Y Growth Rate Comparison by By fertilizer (2016-2032)
- Figure 152: Latin America Agrochemicals Market Share Comparison by Country (2016-2032)
- Figure 153: Latin America Agrochemicals Market Share Comparison by By Type (2016-2032)
- Figure 154: Latin America Agrochemicals Market Share Comparison by By crop (2016-2032)
- Figure 155: Latin America Agrochemicals Market Share Comparison by By vegetables (2016-2032)
- Figure 156: Latin America Agrochemicals Market Share Comparison by By fertilizer (2016-2032)
- Figure 157: Middle East & Africa Agrochemicals Market Revenue (US$ Mn) Market Share by By Typein 2022
- Figure 158: Middle East & Africa Agrochemicals Market Attractiveness Analysis by By Type, 2016-2032
- Figure 159: Middle East & Africa Agrochemicals Market Revenue (US$ Mn) Market Share by By cropin 2022
- Figure 160: Middle East & Africa Agrochemicals Market Attractiveness Analysis by By crop, 2016-2032
- Figure 161: Middle East & Africa Agrochemicals Market Revenue (US$ Mn) Market Share by By vegetablesin 2022
- Figure 162: Middle East & Africa Agrochemicals Market Attractiveness Analysis by By vegetables, 2016-2032
- Figure 163: Middle East & Africa Agrochemicals Market Revenue (US$ Mn) Market Share by By fertilizerin 2022
- Figure 164: Middle East & Africa Agrochemicals Market Attractiveness Analysis by By fertilizer, 2016-2032
- Figure 165: Middle East & Africa Agrochemicals Market Revenue (US$ Mn) Market Share by Country in 2022
- Figure 166: Middle East & Africa Agrochemicals Market Attractiveness Analysis by Country, 2016-2032
- Figure 167: Middle East & Africa Agrochemicals Market Revenue (US$ Mn) (2016-2032)
- Figure 168: Middle East & Africa Agrochemicals Market Revenue (US$ Mn) Comparison by Country (2016-2032)
- Figure 169: Middle East & Africa Agrochemicals Market Revenue (US$ Mn) Comparison by By Type (2016-2032)
- Figure 170: Middle East & Africa Agrochemicals Market Revenue (US$ Mn) Comparison by By crop (2016-2032)
- Figure 171: Middle East & Africa Agrochemicals Market Revenue (US$ Mn) Comparison by By vegetables (2016-2032)
- Figure 172: Middle East & Africa Agrochemicals Market Revenue (US$ Mn) Comparison by By fertilizer (2016-2032)
- Figure 173: Middle East & Africa Agrochemicals Market Y-o-Y Growth Rate Comparison by Country (2016-2032)
- Figure 174: Middle East & Africa Agrochemicals Market Y-o-Y Growth Rate Comparison by By Type (2016-2032)
- Figure 175: Middle East & Africa Agrochemicals Market Y-o-Y Growth Rate Comparison by By crop (2016-2032)
- Figure 176: Middle East & Africa Agrochemicals Market Y-o-Y Growth Rate Comparison by By vegetables (2016-2032)
- Figure 177: Middle East & Africa Agrochemicals Market Y-o-Y Growth Rate Comparison by By fertilizer (2016-2032)
- Figure 178: Middle East & Africa Agrochemicals Market Share Comparison by Country (2016-2032)
- Figure 179: Middle East & Africa Agrochemicals Market Share Comparison by By Type (2016-2032)
- Figure 180: Middle East & Africa Agrochemicals Market Share Comparison by By crop (2016-2032)
- Figure 181: Middle East & Africa Agrochemicals Market Share Comparison by By vegetables (2016-2032)
- Figure 182: Middle East & Africa Agrochemicals Market Share Comparison by By fertilizer (2016-2032)
- List of Tables
- Table 1: Global Agrochemicals Market Comparison by By Type (2016-2032)
- Table 2: Global Agrochemicals Market Comparison by By crop (2016-2032)
- Table 3: Global Agrochemicals Market Comparison by By vegetables (2016-2032)
- Table 4: Global Agrochemicals Market Comparison by By fertilizer (2016-2032)
- Table 5: Global Agrochemicals Market Revenue (US$ Mn) Comparison by Region (2016-2032)
- Table 6: Global Agrochemicals Market Revenue (US$ Mn) (2016-2032)
- Table 7: Global Agrochemicals Market Revenue (US$ Mn) Comparison by Region (2016-2032)
- Table 8: Global Agrochemicals Market Revenue (US$ Mn) Comparison by By Type (2016-2032)
- Table 9: Global Agrochemicals Market Revenue (US$ Mn) Comparison by By crop (2016-2032)
- Table 10: Global Agrochemicals Market Revenue (US$ Mn) Comparison by By vegetables (2016-2032)
- Table 11: Global Agrochemicals Market Revenue (US$ Mn) Comparison by By fertilizer (2016-2032)
- Table 12: Global Agrochemicals Market Y-o-Y Growth Rate Comparison by Region (2016-2032)
- Table 13: Global Agrochemicals Market Y-o-Y Growth Rate Comparison by By Type (2016-2032)
- Table 14: Global Agrochemicals Market Y-o-Y Growth Rate Comparison by By crop (2016-2032)
- Table 15: Global Agrochemicals Market Y-o-Y Growth Rate Comparison by By vegetables (2016-2032)
- Table 16: Global Agrochemicals Market Y-o-Y Growth Rate Comparison by By fertilizer (2016-2032)
- Table 17: Global Agrochemicals Market Share Comparison by Region (2016-2032)
- Table 18: Global Agrochemicals Market Share Comparison by By Type (2016-2032)
- Table 19: Global Agrochemicals Market Share Comparison by By crop (2016-2032)
- Table 20: Global Agrochemicals Market Share Comparison by By vegetables (2016-2032)
- Table 21: Global Agrochemicals Market Share Comparison by By fertilizer (2016-2032)
- Table 22: North America Agrochemicals Market Comparison by By crop (2016-2032)
- Table 23: North America Agrochemicals Market Comparison by By vegetables (2016-2032)
- Table 24: North America Agrochemicals Market Comparison by By fertilizer (2016-2032)
- Table 25: North America Agrochemicals Market Revenue (US$ Mn) Comparison by Country (2016-2032)
- Table 26: North America Agrochemicals Market Revenue (US$ Mn) (2016-2032)
- Table 27: North America Agrochemicals Market Revenue (US$ Mn) Comparison by Country (2016-2032)
- Table 28: North America Agrochemicals Market Revenue (US$ Mn) Comparison by By Type (2016-2032)
- Table 29: North America Agrochemicals Market Revenue (US$ Mn) Comparison by By crop (2016-2032)
- Table 30: North America Agrochemicals Market Revenue (US$ Mn) Comparison by By vegetables (2016-2032)
- Table 31: North America Agrochemicals Market Revenue (US$ Mn) Comparison by By fertilizer (2016-2032)
- Table 32: North America Agrochemicals Market Y-o-Y Growth Rate Comparison by Country (2016-2032)
- Table 33: North America Agrochemicals Market Y-o-Y Growth Rate Comparison by By Type (2016-2032)
- Table 34: North America Agrochemicals Market Y-o-Y Growth Rate Comparison by By crop (2016-2032)
- Table 35: North America Agrochemicals Market Y-o-Y Growth Rate Comparison by By vegetables (2016-2032)
- Table 36: North America Agrochemicals Market Y-o-Y Growth Rate Comparison by By fertilizer (2016-2032)
- Table 37: North America Agrochemicals Market Share Comparison by Country (2016-2032)
- Table 38: North America Agrochemicals Market Share Comparison by By Type (2016-2032)
- Table 39: North America Agrochemicals Market Share Comparison by By crop (2016-2032)
- Table 40: North America Agrochemicals Market Share Comparison by By vegetables (2016-2032)
- Table 41: North America Agrochemicals Market Share Comparison by By fertilizer (2016-2032)
- Table 42: Western Europe Agrochemicals Market Comparison by By Type (2016-2032)
- Table 43: Western Europe Agrochemicals Market Comparison by By crop (2016-2032)
- Table 44: Western Europe Agrochemicals Market Comparison by By vegetables (2016-2032)
- Table 45: Western Europe Agrochemicals Market Comparison by By fertilizer (2016-2032)
- Table 46: Western Europe Agrochemicals Market Revenue (US$ Mn) Comparison by Country (2016-2032)
- Table 47: Western Europe Agrochemicals Market Revenue (US$ Mn) (2016-2032)
- Table 48: Western Europe Agrochemicals Market Revenue (US$ Mn) Comparison by Country (2016-2032)
- Table 49: Western Europe Agrochemicals Market Revenue (US$ Mn) Comparison by By Type (2016-2032)
- Table 50: Western Europe Agrochemicals Market Revenue (US$ Mn) Comparison by By crop (2016-2032)
- Table 51: Western Europe Agrochemicals Market Revenue (US$ Mn) Comparison by By vegetables (2016-2032)
- Table 52: Western Europe Agrochemicals Market Revenue (US$ Mn) Comparison by By fertilizer (2016-2032)
- Table 53: Western Europe Agrochemicals Market Y-o-Y Growth Rate Comparison by Country (2016-2032)
- Table 54: Western Europe Agrochemicals Market Y-o-Y Growth Rate Comparison by By Type (2016-2032)
- Table 55: Western Europe Agrochemicals Market Y-o-Y Growth Rate Comparison by By crop (2016-2032)
- Table 56: Western Europe Agrochemicals Market Y-o-Y Growth Rate Comparison by By vegetables (2016-2032)
- Table 57: Western Europe Agrochemicals Market Y-o-Y Growth Rate Comparison by By fertilizer (2016-2032)
- Table 58: Western Europe Agrochemicals Market Share Comparison by Country (2016-2032)
- Table 59: Western Europe Agrochemicals Market Share Comparison by By Type (2016-2032)
- Table 60: Western Europe Agrochemicals Market Share Comparison by By crop (2016-2032)
- Table 61: Western Europe Agrochemicals Market Share Comparison by By vegetables (2016-2032)
- Table 62: Western Europe Agrochemicals Market Share Comparison by By fertilizer (2016-2032)
- Table 63: Eastern Europe Agrochemicals Market Comparison by By Type (2016-2032)
- Table 64: Eastern Europe Agrochemicals Market Comparison by By crop (2016-2032)
- Table 65: Eastern Europe Agrochemicals Market Comparison by By vegetables (2016-2032)
- Table 66: Eastern Europe Agrochemicals Market Comparison by By fertilizer (2016-2032)
- Table 67: Eastern Europe Agrochemicals Market Revenue (US$ Mn) Comparison by Country (2016-2032)
- Table 68: Eastern Europe Agrochemicals Market Revenue (US$ Mn) (2016-2032)
- Table 69: Eastern Europe Agrochemicals Market Revenue (US$ Mn) Comparison by Country (2016-2032)
- Table 70: Eastern Europe Agrochemicals Market Revenue (US$ Mn) Comparison by By Type (2016-2032)
- Table 71: Eastern Europe Agrochemicals Market Revenue (US$ Mn) Comparison by By crop (2016-2032)
- Table 72: Eastern Europe Agrochemicals Market Revenue (US$ Mn) Comparison by By vegetables (2016-2032)
- Table 73: Eastern Europe Agrochemicals Market Revenue (US$ Mn) Comparison by By fertilizer (2016-2032)
- Table 74: Eastern Europe Agrochemicals Market Y-o-Y Growth Rate Comparison by Country (2016-2032)
- Table 75: Eastern Europe Agrochemicals Market Y-o-Y Growth Rate Comparison by By Type (2016-2032)
- Table 76: Eastern Europe Agrochemicals Market Y-o-Y Growth Rate Comparison by By crop (2016-2032)
- Table 77: Eastern Europe Agrochemicals Market Y-o-Y Growth Rate Comparison by By vegetables (2016-2032)
- Table 78: Eastern Europe Agrochemicals Market Y-o-Y Growth Rate Comparison by By fertilizer (2016-2032)
- Table 79: Eastern Europe Agrochemicals Market Share Comparison by Country (2016-2032)
- Table 80: Eastern Europe Agrochemicals Market Share Comparison by By Type (2016-2032)
- Table 81: Eastern Europe Agrochemicals Market Share Comparison by By crop (2016-2032)
- Table 82: Eastern Europe Agrochemicals Market Share Comparison by By vegetables (2016-2032)
- Table 83: Eastern Europe Agrochemicals Market Share Comparison by By fertilizer (2016-2032)
- Table 84: APAC Agrochemicals Market Comparison by By Type (2016-2032)
- Table 85: APAC Agrochemicals Market Comparison by By crop (2016-2032)
- Table 86: APAC Agrochemicals Market Comparison by By vegetables (2016-2032)
- Table 87: APAC Agrochemicals Market Comparison by By fertilizer (2016-2032)
- Table 88: APAC Agrochemicals Market Revenue (US$ Mn) Comparison by Country (2016-2032)
- Table 89: APAC Agrochemicals Market Revenue (US$ Mn) (2016-2032)
- Table 90: APAC Agrochemicals Market Revenue (US$ Mn) Comparison by Country (2016-2032)
- Table 91: APAC Agrochemicals Market Revenue (US$ Mn) Comparison by By Type (2016-2032)
- Table 92: APAC Agrochemicals Market Revenue (US$ Mn) Comparison by By crop (2016-2032)
- Table 93: APAC Agrochemicals Market Revenue (US$ Mn) Comparison by By vegetables (2016-2032)
- Table 94: APAC Agrochemicals Market Revenue (US$ Mn) Comparison by By fertilizer (2016-2032)
- Table 95: APAC Agrochemicals Market Y-o-Y Growth Rate Comparison by Country (2016-2032)
- Table 96: APAC Agrochemicals Market Y-o-Y Growth Rate Comparison by By Type (2016-2032)
- Table 97: APAC Agrochemicals Market Y-o-Y Growth Rate Comparison by By crop (2016-2032)
- Table 98: APAC Agrochemicals Market Y-o-Y Growth Rate Comparison by By vegetables (2016-2032)
- Table 99: APAC Agrochemicals Market Y-o-Y Growth Rate Comparison by By fertilizer (2016-2032)
- Table 100: APAC Agrochemicals Market Share Comparison by Country (2016-2032)
- Table 101: APAC Agrochemicals Market Share Comparison by By Type (2016-2032)
- Table 102: APAC Agrochemicals Market Share Comparison by By crop (2016-2032)
- Table 103: APAC Agrochemicals Market Share Comparison by By vegetables (2016-2032)
- Table 104: APAC Agrochemicals Market Share Comparison by By fertilizer (2016-2032)
- Table 105: Latin America Agrochemicals Market Comparison by By Type (2016-2032)
- Table 106: Latin America Agrochemicals Market Comparison by By crop (2016-2032)
- Table 107: Latin America Agrochemicals Market Comparison by By vegetables (2016-2032)
- Table 108: Latin America Agrochemicals Market Comparison by By fertilizer (2016-2032)
- Table 109: Latin America Agrochemicals Market Revenue (US$ Mn) Comparison by Country (2016-2032)
- Table 110: Latin America Agrochemicals Market Revenue (US$ Mn) (2016-2032)
- Table 111: Latin America Agrochemicals Market Revenue (US$ Mn) Comparison by Country (2016-2032)
- Table 112: Latin America Agrochemicals Market Revenue (US$ Mn) Comparison by By Type (2016-2032)
- Table 113: Latin America Agrochemicals Market Revenue (US$ Mn) Comparison by By crop (2016-2032)
- Table 114: Latin America Agrochemicals Market Revenue (US$ Mn) Comparison by By vegetables (2016-2032)
- Table 115: Latin America Agrochemicals Market Revenue (US$ Mn) Comparison by By fertilizer (2016-2032)
- Table 116: Latin America Agrochemicals Market Y-o-Y Growth Rate Comparison by Country (2016-2032)
- Table 117: Latin America Agrochemicals Market Y-o-Y Growth Rate Comparison by By Type (2016-2032)
- Table 118: Latin America Agrochemicals Market Y-o-Y Growth Rate Comparison by By crop (2016-2032)
- Table 119: Latin America Agrochemicals Market Y-o-Y Growth Rate Comparison by By vegetables (2016-2032)
- Table 120: Latin America Agrochemicals Market Y-o-Y Growth Rate Comparison by By fertilizer (2016-2032)
- Table 121: Latin America Agrochemicals Market Share Comparison by Country (2016-2032)
- Table 122: Latin America Agrochemicals Market Share Comparison by By Type (2016-2032)
- Table 123: Latin America Agrochemicals Market Share Comparison by By crop (2016-2032)
- Table 124: Latin America Agrochemicals Market Share Comparison by By vegetables (2016-2032)
- Table 125: Latin America Agrochemicals Market Share Comparison by By fertilizer (2016-2032)
- Table 126: Middle East & Africa Agrochemicals Market Comparison by By Type (2016-2032)
- Table 127: Middle East & Africa Agrochemicals Market Comparison by By crop (2016-2032)
- Table 128: Middle East & Africa Agrochemicals Market Comparison by By vegetables (2016-2032)
- Table 129: Middle East & Africa Agrochemicals Market Comparison by By fertilizer (2016-2032)
- Table 130: Middle East & Africa Agrochemicals Market Revenue (US$ Mn) Comparison by Country (2016-2032)
- Table 131: Middle East & Africa Agrochemicals Market Revenue (US$ Mn) (2016-2032)
- Table 132: Middle East & Africa Agrochemicals Market Revenue (US$ Mn) Comparison by Country (2016-2032)
- Table 133: Middle East & Africa Agrochemicals Market Revenue (US$ Mn) Comparison by By Type (2016-2032)
- Table 134: Middle East & Africa Agrochemicals Market Revenue (US$ Mn) Comparison by By crop (2016-2032)
- Table 135: Middle East & Africa Agrochemicals Market Revenue (US$ Mn) Comparison by By vegetables (2016-2032)
- Table 136: Middle East & Africa Agrochemicals Market Revenue (US$ Mn) Comparison by By fertilizer (2016-2032)
- Table 137: Middle East & Africa Agrochemicals Market Y-o-Y Growth Rate Comparison by Country (2016-2032)
- Table 138: Middle East & Africa Agrochemicals Market Y-o-Y Growth Rate Comparison by By Type (2016-2032)
- Table 139: Middle East & Africa Agrochemicals Market Y-o-Y Growth Rate Comparison by By crop (2016-2032)
- Table 140: Middle East & Africa Agrochemicals Market Y-o-Y Growth Rate Comparison by By vegetables (2016-2032)
- Table 141: Middle East & Africa Agrochemicals Market Y-o-Y Growth Rate Comparison by By fertilizer (2016-2032)
- Table 142: Middle East & Africa Agrochemicals Market Share Comparison by Country (2016-2032)
- Table 143: Middle East & Africa Agrochemicals Market Share Comparison by By Type (2016-2032)
- Table 144: Middle East & Africa Agrochemicals Market Share Comparison by By crop (2016-2032)
- Table 145: Middle East & Africa Agrochemicals Market Share Comparison by By vegetables (2016-2032)
- Table 146: Middle East & Africa Agrochemicals Market Share Comparison by By fertilizer (2016-2032)
- 1. Executive Summary
-
- Makhteshim Agan Industries Ltd
- Agrium Inc.
- Mosaic Company
- Indian Farmers Fertiliser Cooperative
- Potash Corp. SAS. Inc.
- Nufarm Ltd.
- Sumitomo Chemical
- Dow Agrosciences LLC.
- BASF S.E.
- Israel Chemicals Ltd.
- K+S AG
- E.I. Du Pont De Nemours & Company
- Sociedad Quimica Y Minera De Chile SA
- Yara International ASA
- Dow Chemical Limited
- Monsanto Company
Our Clients


View Our Licence Options
