
Agriculture Biotechnology Market By Organism Type (Plants, Animals, Microbes), By Application( Genetic Engineering, Vaccine Development, Transgenic Crops & Animals, and Others ), By Type (Hybrid Seeds, Transgenic Crops, Bio-pesticides, Bio-fertilizers), By Technology (Genetic Engineering, Tissue Culture and Others), By Region And Companies - Industry Segment Outlook, Market Assessment, Competition Scenario, Trends, And Forecast Period 2024-2033
-
51027
-
Sept 2024
-
360
-


-
This report was compiled by Shreyas Rokade Shreyas Rokade is a seasoned Research Analyst with CMFE, bringing extensive expertise in market research and consulting, with a strong background in Chemical Engineering. Correspondence Team Lead-CMFE Linkedin | Detailed Market research Methodology Our methodology involves a mix of primary research, including interviews with leading mental health experts, and secondary research from reputable medical journals and databases. View Detailed Methodology Page
-
Quick Navigation
Report Overview
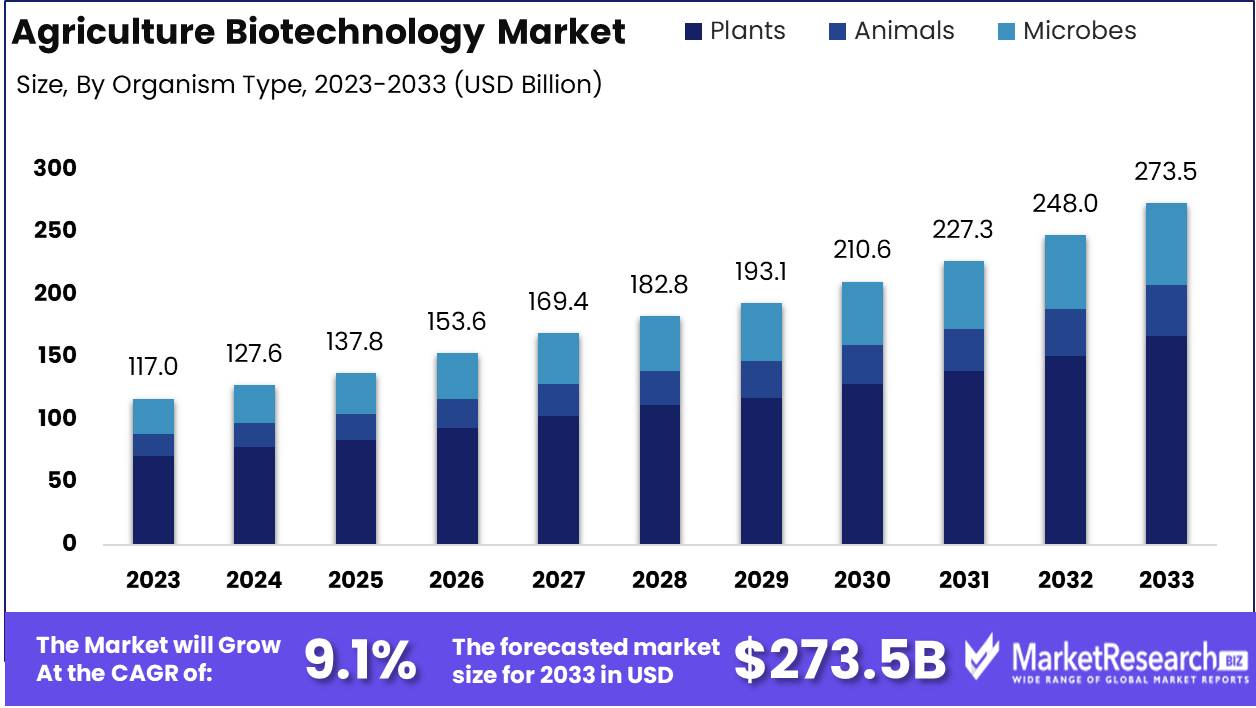
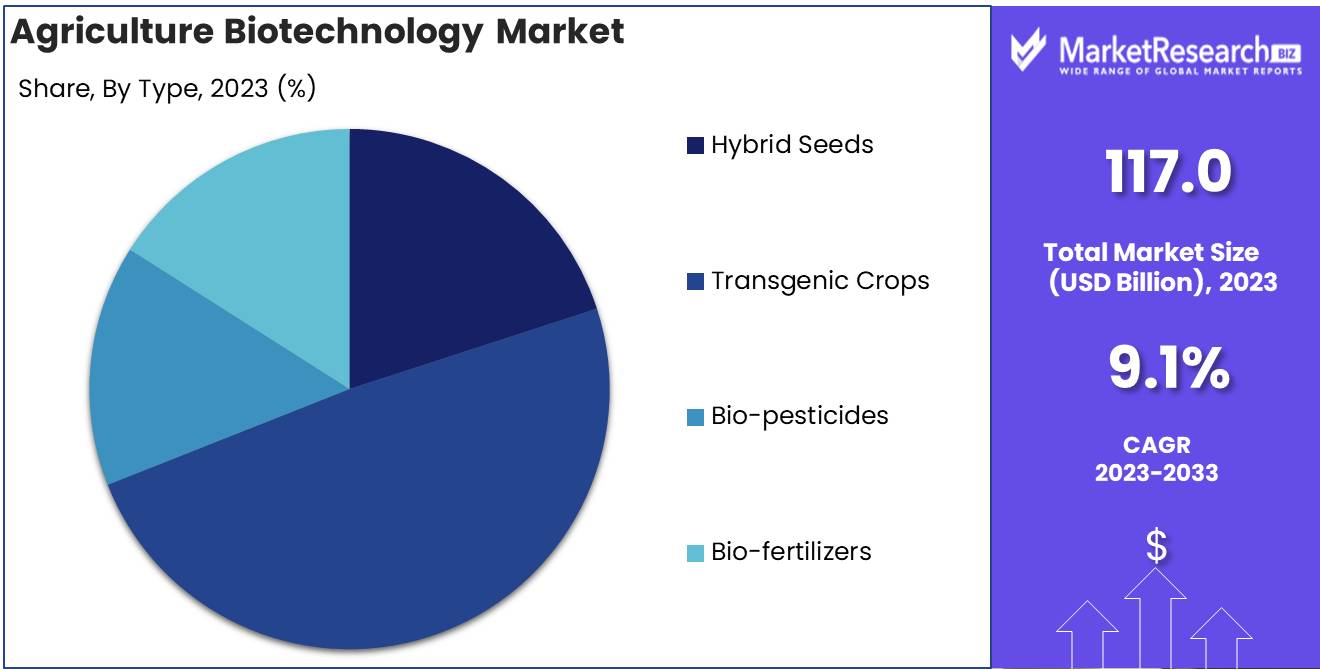
Agriculture Biotechnology Market was valued at USD 117.0 Billion in 2023. It is expected to reach USD 273.5 Billion by 2033, with a CAGR of 9.1% during the forecast period from 2024 to 2033.
The agriculture biotechnology market encompasses technologies and solutions aimed at improving crop production, enhancing plant resistance to pests, diseases, and environmental conditions, and optimizing agricultural sustainability. Key innovations include genetic modification, molecular breeding, and bio-pesticides, which enable higher crop yields, reduced chemical usage, and improved food security. This market plays a crucial role in addressing global challenges such as climate change, population growth, and resource scarcity. With increasing demand for sustainable agricultural practices, biotechnology is poised to transform traditional farming, fostering efficiency, resilience, and environmental stewardship across the agriculture sector.
The agricultural biotechnology market is poised for significant growth, driven by advancements in biotechnological tools, increased adoption of genetically modified (GM) crops, and the integration of cutting-edge technologies like artificial intelligence (AI) in farming practices. Major industry players such as Bayer and Syngenta are expanding their biologics portfolios through R&D, acquisitions, and strategic partnerships, a trend expected to continue as the demand for enhanced crop resilience and nutritional value rises. Moreover, the adoption of GM crops, which has already seen 2.15 billion hectares of biotech crops grown commercially between 1996 and 2016, is accelerating as these crops offer improved resistance to pests, higher yields, and adaptability to changing climates. Emerging technologies such as CRISPR and precision agriculture are becoming essential tools for developing crops that can withstand extreme weather conditions, ensuring food security amidst growing environmental challenges. AI, in particular, is enhancing decision-making processes for farmers by analyzing data to optimize resource use and predict weather patterns, contributing to higher efficiency and crop yields.
Recent innovations underscore the sector’s momentum. In May 2024, Fermbox Bio launched EN3ZYME, a cellulose enzyme cocktail designed to convert agricultural waste into ethanol, offering a cost-effective solution for biofuel production. Similarly, in June 2024, IPL Biologicals, in collaboration with Punjab Agricultural University, introduced Agenor, a bio-fungicide targeting issues faced by paddy farmers. These developments highlight the importance of partnerships and collaboration in addressing specific agricultural challenges. As the industry evolves, the convergence of biotechnology, AI, and collaborative innovation is expected to drive sustainable agricultural practices and meet the growing global demand for food and biofuel.
Key Takeaways
- Market Growth: The Agriculture Biotechnology Market was valued at USD 117.0 billion in 2023 and is projected to reach USD 273.5 billion by 2033, with a CAGR of 9.1% from 2024 to 2033.
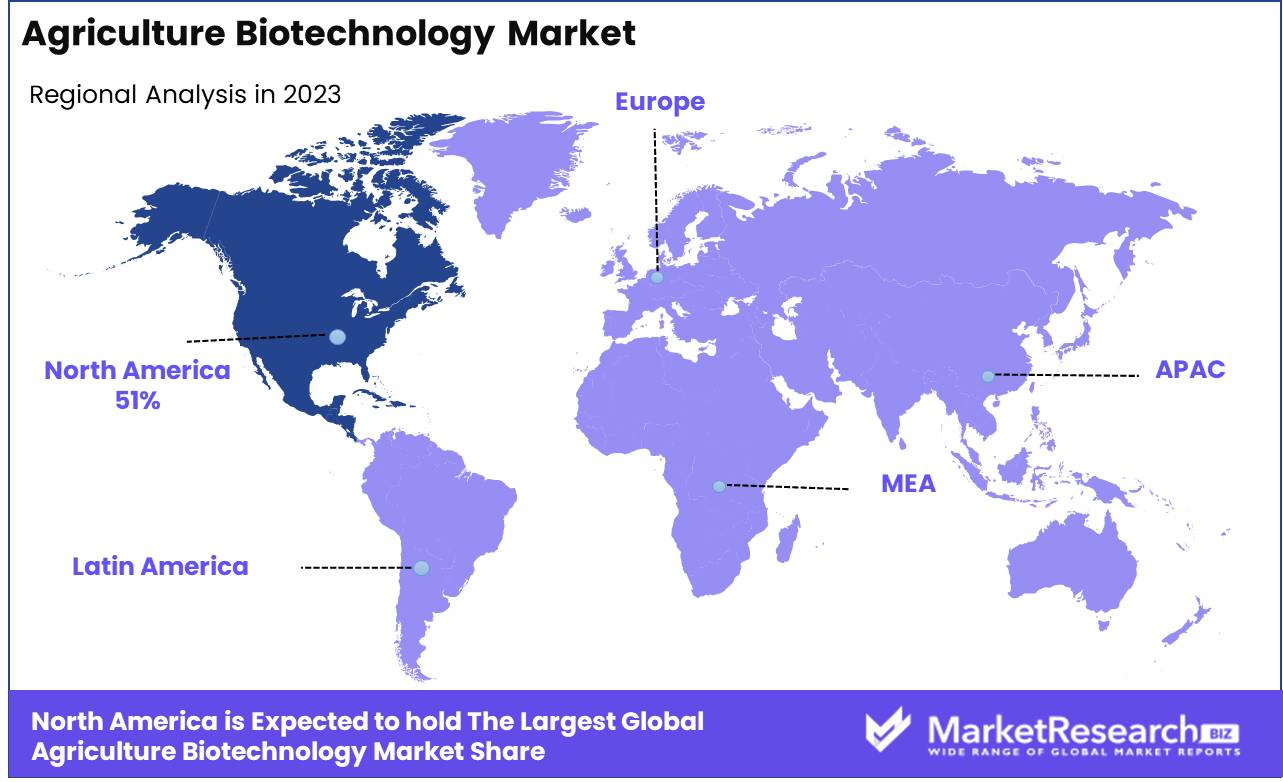
- Regional Dominance: North America dominates the market with a 51% market share, driven by strong investments in biotechnology research and regulatory advancements.
- By Type Analysis: Transgenic crops lead the market with 49% share, primarily due to their enhanced traits like pest resistance and drought tolerance.
- By Organism Type Analysis: Plants hold the dominant position 61% share, driven by widespread adoption of genetically modified crops globally.
- By Technology Analysis: Genetic Engineering dominates with 45% share, due to advancements in gene-editing tools like CRISPR-Cas9.
- By Application Analysis: Transgenic Crops & Animals lead the 56% share, fueled by increased demand for genetically modified crops to enhance yields.
-
Growth Opportunity: Biofuels and renewable energy present significant growth opportunities for the market, with biofuels derived from GM crops playing a critical role in the global shift towards cleaner energy solutions.
- Restraining Factor: Regulatory challenges continue to act as a restraint, slowing market entry and increasing operational costs for biotech innovations.
Driving factors
Advancements in Biotechnology Tools and Techniques
The rapid evolution of biotechnology tools, particularly in genomics, molecular biology, and bioinformatics, is a cornerstone for the accelerated growth of the agricultural biotechnology market. These advanced technologies facilitate precise gene editing methods such as CRISPR-Cas9, as well as synthetic biology approaches that enable the creation of engineered crops with novel traits. For instance, the application of bioinformatics allows for the analysis of vast amounts of genetic data, making it possible to identify specific traits linked to drought resistance or pest tolerance with greater accuracy and speed.
The integration of these tools enhances product development timelines, reduces R&D costs, and fosters innovation, leading to a surge in genetically modified crops that can better withstand climate change and increase yield. Furthermore, the convergence of synthetic biology and agricultural applications promises to push the boundaries of crop development, catering to rising food demands and advancing sustainable agricultural practices.
Improving Crop Resistance and Productivity
Improving crop resistance and productivity through agricultural biotechnology directly addresses the growing global demand for food, driven by population growth and changing climate conditions. Techniques like genetic engineering and marker-assisted selection allow for the development of crops that are resistant to diseases, pests, and environmental stresses such as drought, salinity, and extreme temperatures. These innovations not only reduce crop loss and enhance agricultural yields but also minimize the need for chemical inputs like pesticides, contributing to more sustainable farming practices.
As per recent estimates, crops with enhanced resistance traits have demonstrated yield improvements of 20-30%, with further growth expected as biotechnology adoption widens. This is particularly vital in regions facing heightened environmental challenges, where the resilience of crops could mean the difference between food scarcity and surplus. The development of genetically modified (GM) crops like Bt cotton, which is resistant to specific pests, has already significantly boosted agricultural output, especially in countries such as India and Brazil.
Restraining Factors
Regulatory Challenges: Slowing Market Growth and Increasing Costs for Biotech Innovations
Regulatory challenges present a significant barrier to the expansion of the agricultural biotechnology market. The commercialization of genetically modified organisms (GMOs) faces complex legislative frameworks that vary widely across different regions. These intricate regulations delay the approval of biotech products, impede global market access, and complicate operational strategies for companies looking to scale across borders. For instance, in the European Union (EU), GMO approval processes can take up to six years, compared to just 15-24 months in the United States, significantly slowing market entry for biotech firms.
Further complicating market dynamics, stringent labeling laws in several regions require biotech companies to clearly identify products containing GMOs. These laws, particularly prevalent in Europe, North America, and parts of Asia, raise operational costs and add complexities to distribution channels, creating additional barriers to market entry. For instance, in countries like the U.S., mandatory labeling of GMOs has been estimated to increase costs for food manufacturers by 0.1% to 10%, which in turn can raise prices for consumers and reduce the competitiveness of biotech crops.
Health and Environmental Concerns: Eroding Consumer Trust and Slowing Adoption
Health and environmental concerns continue to cast a shadow over the growth of agricultural biotechnology, primarily due to lingering uncertainty about the long-term effects of genetically modified crops. Despite extensive studies supporting the safety of GMOs, the skepticism among consumers and some regulatory bodies persists. This public hesitance is reflected in regulatory decisions and market behavior, with some regions opting for stringent laws or outright bans on GMOs. For example, a 2020 survey showed that approximately 48% of consumers in Europe were opposed to GMOs, reflecting a deep-rooted cultural and environmental resistance to these products.
One of the prominent concerns is the potential for genetically modified crops to contribute to antibiotic resistance, a critical public health issue. Some GMOs use antibiotic resistance genes as markers in the genetic modification process, leading to fears that their consumption could diminish the effectiveness of antibiotics in humans. Though the risk remains largely theoretical, this perception has led to regulatory scrutiny and consumer reluctance, slowing market penetration in key regions. In countries like Germany and Austria, such concerns have translated into stringent restrictions on GMO usage and importation.
Additionally, environmental concerns regarding biodiversity loss and the unintentional spread of modified genes to wild plant populations create further resistance among environmental groups. As environmental regulations tighten globally, particularly in the wake of climate change awareness, these concerns continue to present obstacles to biotech adoption.
By Organism Type Analysis
Plants Dominated the Agriculture Biotechnology Market in 2023 with a 61% Share
In 2023, Plants held a dominant market position in the By Organism Type segment of the Agriculture Biotechnology Market, capturing more than 61% of the total market share. This dominance is primarily driven by the widespread adoption of genetically modified (GM) crops, which offer enhanced traits such as pest resistance, drought tolerance, and improved nutritional value. The increasing global demand for higher agricultural productivity to meet the food needs of a growing population, alongside the adoption of advanced biotechnological techniques in plant breeding, has significantly contributed to the growth of this segment. Favorable government policies, especially in key agricultural markets, have further accelerated the commercialization of GM crops, solidifying the plants segment's leading position.
Animals represent another important segment within the market, as advancements in biotechnology have enabled the genetic modification of livestock for improved disease resistance, productivity, and reproductive efficiency. While smaller than the plants segment, biotechnology applications in animal agriculture are growing, particularly in areas such as animal vaccine development and breeding for enhanced traits.
The Microbes segment, though smaller, is gaining traction, driven by the increasing utilization of microorganisms for biofertilizers, biopesticides, and soil health enhancement. Microbial biotechnology plays a critical role in sustainable agriculture by reducing the reliance on chemical inputs, improving crop yield, and fostering eco-friendly farming practices. With growing emphasis on sustainable agriculture and soil health, this segment is expected to witness steady growth in the future.
By Application Analysis
Transgenic Crops & Animals Dominated the Agriculture Biotechnology Market in 2023 with a 56% Share
In 2023, Transgenic Crops & Animals held a dominant position in the By Application segment of the Agriculture Biotechnology Market, capturing more than 56% of the total market share. The transgenic crops & animals segment's strong market performance is largely driven by the increasing demand for genetically modified crops with enhanced traits, such as pest resistance and improved yield, alongside the growing use of genetically modified animals for research and agricultural productivity. The adoption of transgenic crops is also fueled by favorable regulatory frameworks in major agricultural markets and rising investments in biotechnology research.
Genetic Engineering remains a pivotal segment, contributing significantly to the market as it underpins most advancements within agricultural biotechnology. Genetic engineering techniques enable the development of crops with improved resistance to environmental stress, herbicides, and diseases, which are crucial for food security in light of global climate challenges. This segment is expected to see sustained growth with ongoing innovation in gene-editing technologies like CRISPR-Cas9.
The Vaccine Development segment represents a growing niche within agricultural biotechnology, where biotechnological advancements are leveraged to create vaccines for livestock and plants. The rise in zoonotic diseases and the need to protect agricultural yields from disease outbreaks have boosted research in this field, providing promising growth opportunities.
Although smaller in comparison, Antibiotic Development continues to be relevant, particularly as concerns over antibiotic resistance in both humans and animals rise. Biotechnology innovations are helping to create new and effective antibiotics for livestock, ensuring the health of farm animals and reducing the reliance on traditional antibiotics.
Flower Culturing represents a specialized application of biotechnology, with a focus on genetic modification to enhance the aesthetic qualities of ornamental plants. While its contribution to overall market value remains limited, the demand for genetically enhanced flowers, such as those with improved color, scent, and longevity, is growing steadily in niche markets.
Nutritional Supplements are an increasingly significant area of focus, as biotechnology is used to develop crops with enhanced nutritional content. Biofortification of crops, for instance, can address micronutrient deficiencies in populations reliant on staple crops, and this segment is poised for further expansion as global health concerns around malnutrition persist.
Finally, Biofuels are emerging as a key growth area within the agricultural biotechnology landscape, driven by the need for sustainable energy sources. Biotechnology advancements have enabled the development of genetically modified crops optimized for biofuel production, positioning this segment for future growth as global energy demands shift towards renewable resources.
By Type Analysis
Transgenic Crops Dominated the Agriculture Biotechnology Market in 2023 with a 49% Share
In 2023, Transgenic Crops held a dominant market position in the By Type segment of the Agriculture Biotechnology Market, capturing more than 49% of the total market share. The growth of this segment is largely driven by the increasing adoption of genetically modified (GM) crops designed to offer enhanced traits such as herbicide tolerance, pest resistance, and improved yield. The rising demand for agricultural productivity, along with the global push to address food security challenges, has led to widespread adoption of transgenic crops in major farming regions, particularly in North and South America. Additionally, regulatory approvals for new transgenic varieties in emerging markets have bolstered growth.
Hybrid Seeds followed closely as an important segment, contributing significantly to market revenue. Hybrid seeds, known for their high yield potential and disease resistance, remain crucial for farmers aiming to increase crop productivity. Although transgenic crops dominate, hybrid seeds maintain a strong market presence, particularly in regions where GM crops are either restricted or where traditional farming practices still prevail.
The Bio-pesticides segment is growing rapidly, as the agricultural sector increasingly shifts towards more sustainable and eco-friendly practices. Bio-pesticides, which are derived from natural materials such as plants, bacteria, and minerals, offer an effective alternative to chemical pesticides. Their rising popularity is driven by increasing consumer preference for organic produce and the need to reduce the environmental impact of farming.
Bio-fertilizers represent another key area of focus within agricultural biotechnology. These biologically derived fertilizers improve soil fertility and crop productivity while minimizing the environmental footprint. With growing concerns over soil degradation and the sustainability of conventional fertilizers, the demand for bio-fertilizers is increasing, positioning this segment for future growth as farmers seek sustainable solutions for soil health management.
By Technology Analysis
Genetic Engineering Dominated the Agriculture Biotechnology Market in 2023 with a 45% Share
In 2023, Genetic Engineering held a dominant market position in the By Technology segment of the Agriculture Biotechnology Market, capturing more than 45% of the total market share. This segment's dominance is primarily driven by the extensive application of genetic engineering techniques in the development of transgenic crops, which exhibit enhanced traits such as pest resistance, drought tolerance, and improved nutritional value. Genetic engineering remains the cornerstone of innovation in agriculture biotechnology, with advancements like CRISPR-Cas9 and other gene-editing tools opening new frontiers for crop and livestock improvement. The technology's ability to address critical agricultural challenges, including climate resilience and food security, has solidified its leading market position.
Tissue Culture follows as a significant contributor, widely used for the mass propagation of disease-free and genetically uniform plants. This technique is critical in enhancing crop production and maintaining genetic diversity, especially for high-value crops such as fruits, vegetables, and ornamental plants. Tissue culture's role in rapid plant multiplication has made it a key component in commercial agriculture.
Embryo Rescue is an essential technology in plant breeding, used primarily to produce viable plants from otherwise incompatible crosses. While its share is smaller than other technologies, it plays a crucial role in developing new hybrid varieties with improved traits, particularly in crops where traditional breeding methods are less effective.
Somatic Hybridization represents another specialized technology used to combine genetic material from different species or varieties to create new hybrids with desired characteristics. While its application is limited compared to genetic engineering or tissue culture, it remains an important tool in plant breeding programs focused on improving disease resistance and stress tolerance.
Molecular Diagnostics is increasingly gaining traction, as it allows for the early detection of plant and animal diseases, enabling farmers to take proactive measures to protect their yields. This technology is critical for ensuring crop and livestock health, particularly in large-scale farming operations where disease outbreaks can have devastating economic impacts.
The Vaccine segment, though smaller, is growing steadily with the rising demand for vaccines in animal agriculture to prevent disease outbreaks and ensure livestock health. Biotechnology has enabled the development of more effective and targeted vaccines, contributing to the productivity and sustainability of animal farming.
Other technologies, including advanced breeding techniques and biotechnological tools, contribute to the overall growth of the market, though their individual shares are smaller compared to the dominant segments.
Key Market Segments
By Organism Type
- Plants
- Animals
- Microbes
By Application
- Genetic Engineering
- Vaccine Development
- Transgenic Crops & Animals
- Antibiotic Development
- Nutritional Supplements
- Flower Culturing
- Biofuels
By Type
- Hybrid Seeds
- Transgenic Crops
- Bio-pesticides
- Bio-fertilizers
By Technology
- Genetic Engineering
- Tissue Culture
- Embryo Rescue
- Somatic Hybridization
- Molecular Diagnostics
- Vaccine
- Others
Growth Opportunity
Biofuels and Renewable Energy
The shift towards renewable energy sources presents a significant growth opportunity for the agriculture biotechnology market. As governments and industries across the globe emphasize sustainability and carbon reduction, biofuels derived from genetically modified crops are emerging as a key solution. Biotechnology can be used to engineer bioenergy crops that have higher biomass yields, are more resilient to environmental stresses, and require fewer inputs. This technology enables more efficient biofuel production, positioning agricultural biotechnology as a critical enabler in the global energy transition. In 2024, we can expect to see increased investment in the development of genetically engineered crops designed specifically for biofuel purposes, catering to the rising demand for alternative energy sources.
Rising Demand for Food Security
With the global population projected to surpass 9 billion by 2050, there is growing pressure to enhance agricultural productivity. Agricultural biotechnology offers the tools to significantly improve food production, enabling crops to better withstand pests, diseases, and climate challenges. Technologies such as genetic engineering and molecular diagnostics will continue to gain traction, helping farmers maximize yields and reduce crop losses. In 2024, the agriculture biotechnology market is poised to play a more prominent role in addressing food security concerns, particularly in regions facing food shortages and agricultural instability. The increasing adoption of transgenic crops, which can improve both productivity and nutritional content, will be a vital solution to feeding the world’s expanding population.
Latest Trends
Advancements in Genetic Engineering Techniques
One of the most transformative trends in agriculture biotechnology for 2024 is the rapid advancement of genetic engineering techniques, particularly the use of CRISPR-Cas9. This gene-editing technology is revolutionizing crop development by enabling precise modifications to plant DNA, allowing scientists to enhance traits such as nutritional content, shelf life, and resistance to pests and diseases. The adoption of CRISPR and similar techniques is expected to accelerate, as regulatory barriers ease and research institutions and biotech companies focus on creating crops tailored to specific regional and environmental needs. These innovations are crucial for addressing global food security, particularly in developing regions where climate change is making traditional farming practices less viable.
Biofuels and Renewable Energy
As the global focus on renewable energy intensifies, biofuels derived from genetically modified (GM) crops are becoming a key growth area in agricultural biotechnology. Crops engineered for higher biomass production and enhanced environmental resilience are proving essential for efficient biofuel production. This trend is driven by increasing government mandates for carbon reduction and corporate commitments to sustainability. In 2024, the agriculture biotechnology market is expected to see significant investments in bioenergy crop development. The potential for genetically modified bioenergy crops to support the global shift towards cleaner energy solutions highlights the critical role that agricultural biotechnology will play in meeting future energy demands while simultaneously supporting sustainable agricultural practices.
Regional Analysis
North America Dominating Region with 51% Market Share
North America leads the global agriculture biotechnology market, capturing 51% of the total market share. This dominance is primarily driven by strong investments in research and development, along with advanced biotechnological applications in agriculture, particularly in the United States and Canada. The US is at the forefront, contributing significantly to innovation and regulatory advancements in genetically modified crops and bio-pesticides. Government initiatives and support for biotech innovations, combined with a robust agricultural sector, further solidify North America’s leadership. Canada also plays a crucial role in the adoption of biotech crops, enhancing its market contribution.Europe is another key region in the agriculture biotechnology market, driven by strong regulatory frameworks and a focus on sustainability. Countries like Germany, France, and the UK are leading adopters of advanced biotech solutions aimed at increasing crop yields and resistance to pests. The region is also witnessing growing interest in precision farming technologies. However, stringent regulations concerning genetically modified organisms (GMOs) have somewhat constrained the market’s full potential. The European market is projected to grow steadily, with countries like Spain and the Netherlands contributing significantly to research and innovation in biotechnology.
The Asia Pacific region is emerging as a significant player in the agriculture biotechnology market, driven by rapid population growth and increased food demand. China and India are leading in the adoption of biotech crops and precision agriculture technologies to address food security concerns. Governments in these countries are increasingly supporting agricultural biotechnology innovations through policies aimed at enhancing crop productivity and sustainability. Other countries, such as Japan, South Korea, and Vietnam, are also contributing to the market growth with research initiatives and increased adoption of genetically modified seeds. The region is expected to witness high growth rates in the coming years.
Latin America, particularly Brazil and Mexico, is another promising market for agriculture biotechnology, owing to its large agricultural sector and favorable climate for biotech crop cultivation. Brazil, as one of the largest producers of soybeans and corn, has seen substantial adoption of genetically modified crops to improve yields and resist pests. Mexico is also playing a growing role in the regional market with government support and investments in biotech innovations aimed at enhancing crop resilience and productivity. The region’s favorable policies toward biotech crops contribute to its strong market presence.
The Middle East & Africa region, although still developing in terms of agriculture biotechnology adoption, shows potential for growth. Countries like Saudi Arabia and South Africa are investing in research and development to address food security issues through the adoption of genetically modified crops. South Africa, in particular, is a key player in the region with strong government support for biotech innovations in agriculture. The United Arab Emirates (UAE) is also making strides in biotechnology to improve agricultural practices in arid environments. Despite the challenges posed by climate and infrastructure, the region is expected to gradually increase its adoption of biotechnology solutions in agriculture.
Key Regions and Countries
North America
- The US
- Canada
- Rest of North America
Europe
- Germany
- France
- The UK
- Spain
- Netherlands
- Russia
- Italy
- Rest of Europe
Asia-Pacific
- China
- Japan
- Singapore
- Thailand
- South Korea
- Vietnam
- India
- New Zealand
- Rest of Asia Pacific
Latin America
- Mexico
- Brazil
- Rest of Latin America
Middle East & Africa
- Saudi Arabia
- South Africa
- UAE
- Rest of Middle East & Africa
Key Players Analysis
The global agriculture biotechnology market in 2024 is characterized by a dynamic competitive landscape, driven by key players at the forefront of innovation, sustainability, and market expansion. Leading companies such as Bayer AG and Corteva are setting the pace with their advanced technological capabilities and strategic investments.
Bayer AG maintains its dominant position through a comprehensive portfolio of genetically modified (GM) seeds, crop protection products, and significant investments in R&D. By emphasizing sustainable farming practices and integrating advanced biotechnology solutions, Bayer continues to shape the future of agriculture, targeting higher crop yields and greater resilience.
Corteva is bolstering its market leadership through a focus on advanced biotech traits, seed technologies, and integrated crop protection. The company's innovation pipeline is geared toward meeting the global demand for enhanced agricultural productivity, driven by its expertise in genetic solutions and precision agriculture.
ADAMA and ChemChina are key players leveraging their extensive global distribution networks and a strong foundation in chemical crop protection. Their integrated approach combines chemical innovation with biotechnological advancements, helping farmers improve crop resilience and productivity. This dual strategy enables them to serve a diverse range of agricultural markets, particularly in regions with intensive farming practices.
As a leader in computational biology, Evogene Ltd. stands out for its focus on genomic solutions that drive precision agriculture and sustainable farming practices. Evogene’s platform leverages advanced data analytics to develop crops with optimized traits, offering a competitive edge in the biotech space by addressing the evolving challenges of modern agriculture.
European players such as KWS SAAT SE & Co. KGaA and Limagrain concentrate on seed technology and genetic crop improvements, with particular emphasis on cereals and vegetables. Their focus on breeding and biotech innovations caters to the growing demand for crop yield improvements and resistance to environmental stresses, positioning them as key contributors to Europe’s agriculture biotechnology sector.
Marrone Bio Innovations and Valent BioSciences LLC are at the forefront of biological solutions, focusing on bio-pesticides and bio-stimulants. As the demand for sustainable and organic farming practices rises, these companies are well-positioned to capture market share by providing environmentally friendly alternatives to traditional chemical inputs.
Asia-based firms such as MITSUI & CO., LTD and Nufarm are expanding their presence in high-growth markets across the Asia-Pacific region. These companies are focusing on advanced biotech solutions to meet the region's increasing demand for sustainable agriculture technologies. Their strategic investments and regional expertise allow them to capitalize on the rising need for crop protection and yield improvement in fast-growing economies.
Performance Plants Inc. is pioneering trait-based technologies aimed at enhancing drought resistance and efficiency in crops. By focusing on traits that improve resource use, such as water and nutrient efficiency, Performance Plants is helping farmers mitigate the effects of climate change, a critical concern for global agriculture.
Market Key Players
- Bayer AG
- ADAMA Ltd
- ChemChina
- Corteva
- Evogene Ltd.
- KWS SAAT SE & Co. KGaA
- Limagrain
- Marrone Bio Innovations
- MITSUI & CO., LTD
- Nufarm
- Performance Plants Inc.
- Valent BioSciences LLC
Recent Developments
- In January 2024, TuBiomics became a key player in developing plant and soil health products. The company focuses on sustainable solutions using natural chemistry-based approaches. This initiative is backed by the Nevada Governor’s Office of Economic Development, showing strong support for sustainable agriculture practices.
- In 2023, BASF announced breakthroughs in CRISPR-Cas9 technology to create crops with better traits. These include improved disease resistance and greater tolerance to drought. This development is aimed at tackling the challenges posed by climate change and ensuring food security.
- In 2023, Corteva introduced a new line of genetically modified soybeans designed to resist specific herbicides. This innovation helps farmers simplify weed management and increase crop yields, contributing to more efficient farming practices.
- In 2023, Monsanto, now part of Bayer, made progress in developing genetically engineered corn that can resist multiple pests and diseases. This advancement is expected to improve crop productivity and boost profitability for farmers.
Report Scope
Report Features Description Market Value (2023) USD 117.0 Bn Forecast Revenue (2033) USD 273.5 Bn CAGR (2024-2032) 29.1 Base Year for Estimation 2023 Historic Period 2016-2023 Forecast Period 2024-2033 Report Coverage Revenue Forecast, Market Dynamics, COVID-19 Impact, Competitive Landscape, Recent Developments Segments Covered By Organism Type (Plants, Animals, Microbes), By Application( Genetic Engineering, Vaccine Development, Transgenic Crops & Animals, Antibiotic Development, Nutritional Supplements, Flower Culturing, Biofuels), By Type (Hybrid Seeds, Transgenic Crops, Bio-pesticides, Bio-fertilizers), By Technology (Genetic Engineering, Tissue Culture, Embryo Rescue, Somatic Hybridization, Molecular Diagnostics, Vaccine, Others)) Regional Analysis North America - The US, Canada, Rest of North America, Europe - Germany, France, The UK, Spain, Italy, Russia, Netherlands, Rest of Europe, Asia-Pacific - China, Japan, South Korea, India, New Zealand, Singapore, Thailand, Vietnam, Rest of Asia Pacific, Latin America - Brazil, Mexico, Rest of Latin America, Middle East & Africa - South Africa, Saudi Arabia, UAE, Rest of Middle East & Africa Competitive Landscape Bayer AG, ADAMA Ltd, ChemChina, Corteva, Evogene Ltd., KWS SAAT SE & Co. KGaA, Limagrain, Marrone Bio Innovations, MITSUI & CO., LTD, Nufarm, Performance Plants Inc., Valent BioSciences LLC Customization Scope Customization for segments, region/country-level will be provided. Moreover, additional customization can be done based on the requirements. Purchase Options We have three licenses to opt for Single User License, Multi-User License (Up to 5 Users), Corporate Use License (Unlimited User and Printable PDF) -
- 1. Executive Summary
- 1.1. Definition
- 1.2. Taxonomy
- 1.3. Research Scope
- 1.4. Key Analysis
- 1.5. Key Findings by Major Segments
- 1.6. Top strategies by Major Players
- 2. Global Agriculture Biotechnology Market Overview
- 2.1. Agriculture Biotechnology Market Dynamics
- 2.1.1. Drivers
- 2.1.2. Opportunities
- 2.1.3. Restraints
- 2.1.4. Challenges
- 2.2. Macro-economic Factors
- 2.3. Regulatory Framework
- 2.4. Market Investment Feasibility Index
- 2.5. PEST Analysis
- 2.6. PORTER’S Five Force Analysis
- 2.7. Drivers & Restraints Impact Analysis
- 2.8. Industry Chain Analysis
- 2.9. Cost Structure Analysis
- 2.10. Marketing Strategy
- 2.11. Russia-Ukraine War Impact Analysis
- 2.12. Opportunity Map Analysis
- 2.13. Market Competition Scenario Analysis
- 2.14. Product Life Cycle Analysis
- 2.15. Opportunity Orbits
- 2.16. Manufacturer Intensity Map
- 2.17. Major Companies sales by Value & Volume
- 2.1. Agriculture Biotechnology Market Dynamics
- 3. Global Agriculture Biotechnology Market Analysis, Opportunity and Forecast, 2016-2032
- 3.1. Global Agriculture Biotechnology Market Analysis, 2016-2021
- 3.2. Global Agriculture Biotechnology Market Opportunity and Forecast, 2023-2032
- 3.3. Global Agriculture Biotechnology Market Analysis, Opportunity and Forecast, By By Organism Type, 2016-2032
- 3.3.1. Global Agriculture Biotechnology Market Analysis by By Organism Type: Introduction
- 3.3.2. Market Size Absolute $ Opportunity Analysis and Forecast, By By Organism Type, 2016-2032
- 3.3.3. Plants
- 3.3.4. Animals
- 3.3.5. Microbes
- 3.4. Global Agriculture Biotechnology Market Analysis, Opportunity and Forecast, By By Application, 2016-2032
- 3.4.1. Global Agriculture Biotechnology Market Analysis by By Application: Introduction
- 3.4.2. Market Size Absolute $ Opportunity Analysis and Forecast, By By Application, 2016-2032
- 3.4.3. Genetic Engineering
- 3.4.4. Vaccine Development
- 3.4.5. Transgenic Crops & Animals
- 3.4.6. Antibiotic Development
- 3.4.7. Nutritional Supplements
- 3.4.8. Flower Culturing
- 3.4.9. Biofuels
- 3.5. Global Agriculture Biotechnology Market Analysis, Opportunity and Forecast, By By Type, 2016-2032
- 3.5.1. Global Agriculture Biotechnology Market Analysis by By Type: Introduction
- 3.5.2. Market Size Absolute $ Opportunity Analysis and Forecast, By By Type, 2016-2032
- 3.5.3. Hybrid Seeds
- 3.5.4. Transgenic Crops
- 3.5.5. Bio-pesticides
- 3.5.6. Bio-fertilizers
- 3.6. Global Agriculture Biotechnology Market Analysis, Opportunity and Forecast, By By Technology, 2016-2032
- 3.6.1. Global Agriculture Biotechnology Market Analysis by By Technology: Introduction
- 3.6.2. Market Size Absolute $ Opportunity Analysis and Forecast, By By Technology, 2016-2032
- 3.6.3. Genetic Engineering
- 3.6.4. Tissue Culture
- 3.6.5. Embryo Rescue
- 3.6.6. Somatic Hybridization
- 3.6.7. Molecular Diagnostics
- 3.6.8. Vaccine
- 3.6.9. Others
- 4. North America Agriculture Biotechnology Market Analysis, Opportunity and Forecast, 2016-2032
- 4.1. North America Agriculture Biotechnology Market Analysis, 2016-2021
- 4.2. North America Agriculture Biotechnology Market Opportunity and Forecast, 2023-2032
- 4.3. North America Agriculture Biotechnology Market Analysis, Opportunity and Forecast, By By Organism Type, 2016-2032
- 4.3.1. North America Agriculture Biotechnology Market Analysis by By Organism Type: Introduction
- 4.3.2. Market Size Absolute $ Opportunity Analysis and Forecast, By By Organism Type, 2016-2032
- 4.3.3. Plants
- 4.3.4. Animals
- 4.3.5. Microbes
- 4.4. North America Agriculture Biotechnology Market Analysis, Opportunity and Forecast, By By Application, 2016-2032
- 4.4.1. North America Agriculture Biotechnology Market Analysis by By Application: Introduction
- 4.4.2. Market Size Absolute $ Opportunity Analysis and Forecast, By By Application, 2016-2032
- 4.4.3. Genetic Engineering
- 4.4.4. Vaccine Development
- 4.4.5. Transgenic Crops & Animals
- 4.4.6. Antibiotic Development
- 4.4.7. Nutritional Supplements
- 4.4.8. Flower Culturing
- 4.4.9. Biofuels
- 4.5. North America Agriculture Biotechnology Market Analysis, Opportunity and Forecast, By By Type, 2016-2032
- 4.5.1. North America Agriculture Biotechnology Market Analysis by By Type: Introduction
- 4.5.2. Market Size Absolute $ Opportunity Analysis and Forecast, By By Type, 2016-2032
- 4.5.3. Hybrid Seeds
- 4.5.4. Transgenic Crops
- 4.5.5. Bio-pesticides
- 4.5.6. Bio-fertilizers
- 4.6. North America Agriculture Biotechnology Market Analysis, Opportunity and Forecast, By By Technology, 2016-2032
- 4.6.1. North America Agriculture Biotechnology Market Analysis by By Technology: Introduction
- 4.6.2. Market Size Absolute $ Opportunity Analysis and Forecast, By By Technology, 2016-2032
- 4.6.3. Genetic Engineering
- 4.6.4. Tissue Culture
- 4.6.5. Embryo Rescue
- 4.6.6. Somatic Hybridization
- 4.6.7. Molecular Diagnostics
- 4.6.8. Vaccine
- 4.6.9. Others
- 4.7. North America Agriculture Biotechnology Market Analysis, Opportunity and Forecast, By Country , 2016-2032
- 4.7.1. North America Agriculture Biotechnology Market Analysis by Country : Introduction
- 4.7.2. Market Size Absolute $ Opportunity Analysis and Forecast, Country , 2016-2032
- 4.7.2.1. The US
- 4.7.2.2. Canada
- 4.7.2.3. Mexico
- 5. Western Europe Agriculture Biotechnology Market Analysis, Opportunity and Forecast, 2016-2032
- 5.1. Western Europe Agriculture Biotechnology Market Analysis, 2016-2021
- 5.2. Western Europe Agriculture Biotechnology Market Opportunity and Forecast, 2023-2032
- 5.3. Western Europe Agriculture Biotechnology Market Analysis, Opportunity and Forecast, By By Organism Type, 2016-2032
- 5.3.1. Western Europe Agriculture Biotechnology Market Analysis by By Organism Type: Introduction
- 5.3.2. Market Size Absolute $ Opportunity Analysis and Forecast, By By Organism Type, 2016-2032
- 5.3.3. Plants
- 5.3.4. Animals
- 5.3.5. Microbes
- 5.4. Western Europe Agriculture Biotechnology Market Analysis, Opportunity and Forecast, By By Application, 2016-2032
- 5.4.1. Western Europe Agriculture Biotechnology Market Analysis by By Application: Introduction
- 5.4.2. Market Size Absolute $ Opportunity Analysis and Forecast, By By Application, 2016-2032
- 5.4.3. Genetic Engineering
- 5.4.4. Vaccine Development
- 5.4.5. Transgenic Crops & Animals
- 5.4.6. Antibiotic Development
- 5.4.7. Nutritional Supplements
- 5.4.8. Flower Culturing
- 5.4.9. Biofuels
- 5.5. Western Europe Agriculture Biotechnology Market Analysis, Opportunity and Forecast, By By Type, 2016-2032
- 5.5.1. Western Europe Agriculture Biotechnology Market Analysis by By Type: Introduction
- 5.5.2. Market Size Absolute $ Opportunity Analysis and Forecast, By By Type, 2016-2032
- 5.5.3. Hybrid Seeds
- 5.5.4. Transgenic Crops
- 5.5.5. Bio-pesticides
- 5.5.6. Bio-fertilizers
- 5.6. Western Europe Agriculture Biotechnology Market Analysis, Opportunity and Forecast, By By Technology, 2016-2032
- 5.6.1. Western Europe Agriculture Biotechnology Market Analysis by By Technology: Introduction
- 5.6.2. Market Size Absolute $ Opportunity Analysis and Forecast, By By Technology, 2016-2032
- 5.6.3. Genetic Engineering
- 5.6.4. Tissue Culture
- 5.6.5. Embryo Rescue
- 5.6.6. Somatic Hybridization
- 5.6.7. Molecular Diagnostics
- 5.6.8. Vaccine
- 5.6.9. Others
- 5.7. Western Europe Agriculture Biotechnology Market Analysis, Opportunity and Forecast, By Country , 2016-2032
- 5.7.1. Western Europe Agriculture Biotechnology Market Analysis by Country : Introduction
- 5.7.2. Market Size Absolute $ Opportunity Analysis and Forecast, Country , 2016-2032
- 5.7.2.1. Germany
- 5.7.2.2. France
- 5.7.2.3. The UK
- 5.7.2.4. Spain
- 5.7.2.5. Italy
- 5.7.2.6. Portugal
- 5.7.2.7. Ireland
- 5.7.2.8. Austria
- 5.7.2.9. Switzerland
- 5.7.2.10. Benelux
- 5.7.2.11. Nordic
- 5.7.2.12. Rest of Western Europe
- 6. Eastern Europe Agriculture Biotechnology Market Analysis, Opportunity and Forecast, 2016-2032
- 6.1. Eastern Europe Agriculture Biotechnology Market Analysis, 2016-2021
- 6.2. Eastern Europe Agriculture Biotechnology Market Opportunity and Forecast, 2023-2032
- 6.3. Eastern Europe Agriculture Biotechnology Market Analysis, Opportunity and Forecast, By By Organism Type, 2016-2032
- 6.3.1. Eastern Europe Agriculture Biotechnology Market Analysis by By Organism Type: Introduction
- 6.3.2. Market Size Absolute $ Opportunity Analysis and Forecast, By By Organism Type, 2016-2032
- 6.3.3. Plants
- 6.3.4. Animals
- 6.3.5. Microbes
- 6.4. Eastern Europe Agriculture Biotechnology Market Analysis, Opportunity and Forecast, By By Application, 2016-2032
- 6.4.1. Eastern Europe Agriculture Biotechnology Market Analysis by By Application: Introduction
- 6.4.2. Market Size Absolute $ Opportunity Analysis and Forecast, By By Application, 2016-2032
- 6.4.3. Genetic Engineering
- 6.4.4. Vaccine Development
- 6.4.5. Transgenic Crops & Animals
- 6.4.6. Antibiotic Development
- 6.4.7. Nutritional Supplements
- 6.4.8. Flower Culturing
- 6.4.9. Biofuels
- 6.5. Eastern Europe Agriculture Biotechnology Market Analysis, Opportunity and Forecast, By By Type, 2016-2032
- 6.5.1. Eastern Europe Agriculture Biotechnology Market Analysis by By Type: Introduction
- 6.5.2. Market Size Absolute $ Opportunity Analysis and Forecast, By By Type, 2016-2032
- 6.5.3. Hybrid Seeds
- 6.5.4. Transgenic Crops
- 6.5.5. Bio-pesticides
- 6.5.6. Bio-fertilizers
- 6.6. Eastern Europe Agriculture Biotechnology Market Analysis, Opportunity and Forecast, By By Technology, 2016-2032
- 6.6.1. Eastern Europe Agriculture Biotechnology Market Analysis by By Technology: Introduction
- 6.6.2. Market Size Absolute $ Opportunity Analysis and Forecast, By By Technology, 2016-2032
- 6.6.3. Genetic Engineering
- 6.6.4. Tissue Culture
- 6.6.5. Embryo Rescue
- 6.6.6. Somatic Hybridization
- 6.6.7. Molecular Diagnostics
- 6.6.8. Vaccine
- 6.6.9. Others
- 6.7. Eastern Europe Agriculture Biotechnology Market Analysis, Opportunity and Forecast, By Country , 2016-2032
- 6.7.1. Eastern Europe Agriculture Biotechnology Market Analysis by Country : Introduction
- 6.7.2. Market Size Absolute $ Opportunity Analysis and Forecast, Country , 2016-2032
- 6.7.2.1. Russia
- 6.7.2.2. Poland
- 6.7.2.3. The Czech Republic
- 6.7.2.4. Greece
- 6.7.2.5. Rest of Eastern Europe
- 7. APAC Agriculture Biotechnology Market Analysis, Opportunity and Forecast, 2016-2032
- 7.1. APAC Agriculture Biotechnology Market Analysis, 2016-2021
- 7.2. APAC Agriculture Biotechnology Market Opportunity and Forecast, 2023-2032
- 7.3. APAC Agriculture Biotechnology Market Analysis, Opportunity and Forecast, By By Organism Type, 2016-2032
- 7.3.1. APAC Agriculture Biotechnology Market Analysis by By Organism Type: Introduction
- 7.3.2. Market Size Absolute $ Opportunity Analysis and Forecast, By By Organism Type, 2016-2032
- 7.3.3. Plants
- 7.3.4. Animals
- 7.3.5. Microbes
- 7.4. APAC Agriculture Biotechnology Market Analysis, Opportunity and Forecast, By By Application, 2016-2032
- 7.4.1. APAC Agriculture Biotechnology Market Analysis by By Application: Introduction
- 7.4.2. Market Size Absolute $ Opportunity Analysis and Forecast, By By Application, 2016-2032
- 7.4.3. Genetic Engineering
- 7.4.4. Vaccine Development
- 7.4.5. Transgenic Crops & Animals
- 7.4.6. Antibiotic Development
- 7.4.7. Nutritional Supplements
- 7.4.8. Flower Culturing
- 7.4.9. Biofuels
- 7.5. APAC Agriculture Biotechnology Market Analysis, Opportunity and Forecast, By By Type, 2016-2032
- 7.5.1. APAC Agriculture Biotechnology Market Analysis by By Type: Introduction
- 7.5.2. Market Size Absolute $ Opportunity Analysis and Forecast, By By Type, 2016-2032
- 7.5.3. Hybrid Seeds
- 7.5.4. Transgenic Crops
- 7.5.5. Bio-pesticides
- 7.5.6. Bio-fertilizers
- 7.6. APAC Agriculture Biotechnology Market Analysis, Opportunity and Forecast, By By Technology, 2016-2032
- 7.6.1. APAC Agriculture Biotechnology Market Analysis by By Technology: Introduction
- 7.6.2. Market Size Absolute $ Opportunity Analysis and Forecast, By By Technology, 2016-2032
- 7.6.3. Genetic Engineering
- 7.6.4. Tissue Culture
- 7.6.5. Embryo Rescue
- 7.6.6. Somatic Hybridization
- 7.6.7. Molecular Diagnostics
- 7.6.8. Vaccine
- 7.6.9. Others
- 7.7. APAC Agriculture Biotechnology Market Analysis, Opportunity and Forecast, By Country , 2016-2032
- 7.7.1. APAC Agriculture Biotechnology Market Analysis by Country : Introduction
- 7.7.2. Market Size Absolute $ Opportunity Analysis and Forecast, Country , 2016-2032
- 7.7.2.1. China
- 7.7.2.2. Japan
- 7.7.2.3. South Korea
- 7.7.2.4. India
- 7.7.2.5. Australia & New Zeland
- 7.7.2.6. Indonesia
- 7.7.2.7. Malaysia
- 7.7.2.8. Philippines
- 7.7.2.9. Singapore
- 7.7.2.10. Thailand
- 7.7.2.11. Vietnam
- 7.7.2.12. Rest of APAC
- 8. Latin America Agriculture Biotechnology Market Analysis, Opportunity and Forecast, 2016-2032
- 8.1. Latin America Agriculture Biotechnology Market Analysis, 2016-2021
- 8.2. Latin America Agriculture Biotechnology Market Opportunity and Forecast, 2023-2032
- 8.3. Latin America Agriculture Biotechnology Market Analysis, Opportunity and Forecast, By By Organism Type, 2016-2032
- 8.3.1. Latin America Agriculture Biotechnology Market Analysis by By Organism Type: Introduction
- 8.3.2. Market Size Absolute $ Opportunity Analysis and Forecast, By By Organism Type, 2016-2032
- 8.3.3. Plants
- 8.3.4. Animals
- 8.3.5. Microbes
- 8.4. Latin America Agriculture Biotechnology Market Analysis, Opportunity and Forecast, By By Application, 2016-2032
- 8.4.1. Latin America Agriculture Biotechnology Market Analysis by By Application: Introduction
- 8.4.2. Market Size Absolute $ Opportunity Analysis and Forecast, By By Application, 2016-2032
- 8.4.3. Genetic Engineering
- 8.4.4. Vaccine Development
- 8.4.5. Transgenic Crops & Animals
- 8.4.6. Antibiotic Development
- 8.4.7. Nutritional Supplements
- 8.4.8. Flower Culturing
- 8.4.9. Biofuels
- 8.5. Latin America Agriculture Biotechnology Market Analysis, Opportunity and Forecast, By By Type, 2016-2032
- 8.5.1. Latin America Agriculture Biotechnology Market Analysis by By Type: Introduction
- 8.5.2. Market Size Absolute $ Opportunity Analysis and Forecast, By By Type, 2016-2032
- 8.5.3. Hybrid Seeds
- 8.5.4. Transgenic Crops
- 8.5.5. Bio-pesticides
- 8.5.6. Bio-fertilizers
- 8.6. Latin America Agriculture Biotechnology Market Analysis, Opportunity and Forecast, By By Technology, 2016-2032
- 8.6.1. Latin America Agriculture Biotechnology Market Analysis by By Technology: Introduction
- 8.6.2. Market Size Absolute $ Opportunity Analysis and Forecast, By By Technology, 2016-2032
- 8.6.3. Genetic Engineering
- 8.6.4. Tissue Culture
- 8.6.5. Embryo Rescue
- 8.6.6. Somatic Hybridization
- 8.6.7. Molecular Diagnostics
- 8.6.8. Vaccine
- 8.6.9. Others
- 8.7. Latin America Agriculture Biotechnology Market Analysis, Opportunity and Forecast, By Country , 2016-2032
- 8.7.1. Latin America Agriculture Biotechnology Market Analysis by Country : Introduction
- 8.7.2. Market Size Absolute $ Opportunity Analysis and Forecast, Country , 2016-2032
- 8.7.2.1. Brazil
- 8.7.2.2. Colombia
- 8.7.2.3. Chile
- 8.7.2.4. Argentina
- 8.7.2.5. Costa Rica
- 8.7.2.6. Rest of Latin America
- 9. Middle East & Africa Agriculture Biotechnology Market Analysis, Opportunity and Forecast, 2016-2032
- 9.1. Middle East & Africa Agriculture Biotechnology Market Analysis, 2016-2021
- 9.2. Middle East & Africa Agriculture Biotechnology Market Opportunity and Forecast, 2023-2032
- 9.3. Middle East & Africa Agriculture Biotechnology Market Analysis, Opportunity and Forecast, By By Organism Type, 2016-2032
- 9.3.1. Middle East & Africa Agriculture Biotechnology Market Analysis by By Organism Type: Introduction
- 9.3.2. Market Size Absolute $ Opportunity Analysis and Forecast, By By Organism Type, 2016-2032
- 9.3.3. Plants
- 9.3.4. Animals
- 9.3.5. Microbes
- 9.4. Middle East & Africa Agriculture Biotechnology Market Analysis, Opportunity and Forecast, By By Application, 2016-2032
- 9.4.1. Middle East & Africa Agriculture Biotechnology Market Analysis by By Application: Introduction
- 9.4.2. Market Size Absolute $ Opportunity Analysis and Forecast, By By Application, 2016-2032
- 9.4.3. Genetic Engineering
- 9.4.4. Vaccine Development
- 9.4.5. Transgenic Crops & Animals
- 9.4.6. Antibiotic Development
- 9.4.7. Nutritional Supplements
- 9.4.8. Flower Culturing
- 9.4.9. Biofuels
- 9.5. Middle East & Africa Agriculture Biotechnology Market Analysis, Opportunity and Forecast, By By Type, 2016-2032
- 9.5.1. Middle East & Africa Agriculture Biotechnology Market Analysis by By Type: Introduction
- 9.5.2. Market Size Absolute $ Opportunity Analysis and Forecast, By By Type, 2016-2032
- 9.5.3. Hybrid Seeds
- 9.5.4. Transgenic Crops
- 9.5.5. Bio-pesticides
- 9.5.6. Bio-fertilizers
- 9.6. Middle East & Africa Agriculture Biotechnology Market Analysis, Opportunity and Forecast, By By Technology, 2016-2032
- 9.6.1. Middle East & Africa Agriculture Biotechnology Market Analysis by By Technology: Introduction
- 9.6.2. Market Size Absolute $ Opportunity Analysis and Forecast, By By Technology, 2016-2032
- 9.6.3. Genetic Engineering
- 9.6.4. Tissue Culture
- 9.6.5. Embryo Rescue
- 9.6.6. Somatic Hybridization
- 9.6.7. Molecular Diagnostics
- 9.6.8. Vaccine
- 9.6.9. Others
- 9.7. Middle East & Africa Agriculture Biotechnology Market Analysis, Opportunity and Forecast, By Country , 2016-2032
- 9.7.1. Middle East & Africa Agriculture Biotechnology Market Analysis by Country : Introduction
- 9.7.2. Market Size Absolute $ Opportunity Analysis and Forecast, Country , 2016-2032
- 9.7.2.1. Algeria
- 9.7.2.2. Egypt
- 9.7.2.3. Israel
- 9.7.2.4. Kuwait
- 9.7.2.5. Nigeria
- 9.7.2.6. Saudi Arabia
- 9.7.2.7. South Africa
- 9.7.2.8. Turkey
- 9.7.2.9. The UAE
- 9.7.2.10. Rest of MEA
- 10. Global Agriculture Biotechnology Market Analysis, Opportunity and Forecast, By Region , 2016-2032
- 10.1. Global Agriculture Biotechnology Market Analysis by Region : Introduction
- 10.2. Market Size Absolute $ Opportunity Analysis and Forecast, By Region , 2016-2032
- 10.2.1. North America
- 10.2.2. Western Europe
- 10.2.3. Eastern Europe
- 10.2.4. APAC
- 10.2.5. Latin America
- 10.2.6. Middle East & Africa
- 11. Global Agriculture Biotechnology Market Competitive Landscape, Market Share Analysis, and Company Profiles
- 11.1. Market Share Analysis
- 11.2. Company Profiles
- 11.3. Bayer AG
- 11.3.1. Company Overview
- 11.3.2. Financial Highlights
- 11.3.3. Product Portfolio
- 11.3.4. SWOT Analysis
- 11.3.5. Key Strategies and Developments
- 11.4. ADAMA Ltd
- 11.4.1. Company Overview
- 11.4.2. Financial Highlights
- 11.4.3. Product Portfolio
- 11.4.4. SWOT Analysis
- 11.4.5. Key Strategies and Developments
- 11.5. ChemChina
- 11.5.1. Company Overview
- 11.5.2. Financial Highlights
- 11.5.3. Product Portfolio
- 11.5.4. SWOT Analysis
- 11.5.5. Key Strategies and Developments
- 11.6. Corteva
- 11.6.1. Company Overview
- 11.6.2. Financial Highlights
- 11.6.3. Product Portfolio
- 11.6.4. SWOT Analysis
- 11.6.5. Key Strategies and Developments
- 11.7. Evogene Ltd.
- 11.7.1. Company Overview
- 11.7.2. Financial Highlights
- 11.7.3. Product Portfolio
- 11.7.4. SWOT Analysis
- 11.7.5. Key Strategies and Developments
- 11.8. KWS SAAT SE & Co. KGaA
- 11.8.1. Company Overview
- 11.8.2. Financial Highlights
- 11.8.3. Product Portfolio
- 11.8.4. SWOT Analysis
- 11.8.5. Key Strategies and Developments
- 11.9. Limagrain
- 11.9.1. Company Overview
- 11.9.2. Financial Highlights
- 11.9.3. Product Portfolio
- 11.9.4. SWOT Analysis
- 11.9.5. Key Strategies and Developments
- 11.10. Marrone Bio Innovations
- 11.10.1. Company Overview
- 11.10.2. Financial Highlights
- 11.10.3. Product Portfolio
- 11.10.4. SWOT Analysis
- 11.10.5. Key Strategies and Developments
- 11.11. MITSUI & CO., LTD
- 11.11.1. Company Overview
- 11.11.2. Financial Highlights
- 11.11.3. Product Portfolio
- 11.11.4. SWOT Analysis
- 11.11.5. Key Strategies and Developments
- 11.12. Nufarm
- 11.12.1. Company Overview
- 11.12.2. Financial Highlights
- 11.12.3. Product Portfolio
- 11.12.4. SWOT Analysis
- 11.12.5. Key Strategies and Developments
- 11.13.1. Company Overview
- 11.13.2. Financial Highlights
- 11.13.3. Product Portfolio
- 11.13.4. SWOT Analysis
- 11.13.5. Key Strategies and Developments
- 11.14. Performance Plants Inc.
- 11.14.1. Company Overview
- 11.14.2. Financial Highlights
- 11.14.3. Product Portfolio
- 11.14.4. SWOT Analysis
- 11.14.5. Key Strategies and Developments
- 12. Assumptions and Acronyms
- 13. Research Methodology
- 14. Contact
- List of Figures
- Figure 1: Global Agriculture Biotechnology Market Revenue (US$ Mn) Market Share by By Organism Type in 2022
- Figure 2: Global Agriculture Biotechnology Market Market Attractiveness Analysis by By Organism Type, 2016-2032
- Figure 3: Global Agriculture Biotechnology Market Revenue (US$ Mn) Market Share by By Applicationin 2022
- Figure 4: Global Agriculture Biotechnology Market Market Attractiveness Analysis by By Application, 2016-2032
- Figure 5: Global Agriculture Biotechnology Market Revenue (US$ Mn) Market Share by By Typein 2022
- Figure 6: Global Agriculture Biotechnology Market Market Attractiveness Analysis by By Type, 2016-2032
- Figure 7: Global Agriculture Biotechnology Market Revenue (US$ Mn) Market Share by By Technologyin 2022
- Figure 8: Global Agriculture Biotechnology Market Market Attractiveness Analysis by By Technology, 2016-2032
- Figure 9: Global Agriculture Biotechnology Market Revenue (US$ Mn) Market Share by Region in 2022
- Figure 10: Global Agriculture Biotechnology Market Market Attractiveness Analysis by Region, 2016-2032
- Figure 11: Global Agriculture Biotechnology Market Market Revenue (US$ Mn) (2016-2032)
- Figure 12: Global Agriculture Biotechnology Market Market Revenue (US$ Mn) Comparison by Region (2016-2032)
- Figure 13: Global Agriculture Biotechnology Market Market Revenue (US$ Mn) Comparison by By Organism Type (2016-2032)
- Figure 14: Global Agriculture Biotechnology Market Market Revenue (US$ Mn) Comparison by By Application (2016-2032)
- Figure 15: Global Agriculture Biotechnology Market Market Revenue (US$ Mn) Comparison by By Type (2016-2032)
- Figure 16: Global Agriculture Biotechnology Market Market Revenue (US$ Mn) Comparison by By Technology (2016-2032)
- Figure 17: Global Agriculture Biotechnology Market Market Y-o-Y Growth Rate Comparison by Region (2016-2032)
- Figure 18: Global Agriculture Biotechnology Market Market Y-o-Y Growth Rate Comparison by By Organism Type (2016-2032)
- Figure 19: Global Agriculture Biotechnology Market Market Y-o-Y Growth Rate Comparison by By Application (2016-2032)
- Figure 20: Global Agriculture Biotechnology Market Market Y-o-Y Growth Rate Comparison by By Type (2016-2032)
- Figure 21: Global Agriculture Biotechnology Market Market Y-o-Y Growth Rate Comparison by By Technology (2016-2032)
- Figure 22: Global Agriculture Biotechnology Market Market Share Comparison by Region (2016-2032)
- Figure 23: Global Agriculture Biotechnology Market Market Share Comparison by By Organism Type (2016-2032)
- Figure 24: Global Agriculture Biotechnology Market Market Share Comparison by By Application (2016-2032)
- Figure 25: Global Agriculture Biotechnology Market Market Share Comparison by By Type (2016-2032)
- Figure 26: Global Agriculture Biotechnology Market Market Share Comparison by By Technology (2016-2032)
- Figure 27: North America Agriculture Biotechnology Market Revenue (US$ Mn) Market Share by By Organism Typein 2022
- Figure 28: North America Agriculture Biotechnology Market Market Attractiveness Analysis by By Organism Type, 2016-2032
- Figure 29: North America Agriculture Biotechnology Market Revenue (US$ Mn) Market Share by By Applicationin 2022
- Figure 30: North America Agriculture Biotechnology Market Market Attractiveness Analysis by By Application, 2016-2032
- Figure 31: North America Agriculture Biotechnology Market Revenue (US$ Mn) Market Share by By Typein 2022
- Figure 32: North America Agriculture Biotechnology Market Market Attractiveness Analysis by By Type, 2016-2032
- Figure 33: North America Agriculture Biotechnology Market Revenue (US$ Mn) Market Share by By Technologyin 2022
- Figure 34: North America Agriculture Biotechnology Market Market Attractiveness Analysis by By Technology, 2016-2032
- Figure 35: North America Agriculture Biotechnology Market Revenue (US$ Mn) Market Share by Country in 2022
- Figure 36: North America Agriculture Biotechnology Market Market Attractiveness Analysis by Country, 2016-2032
- Figure 37: North America Agriculture Biotechnology Market Market Revenue (US$ Mn) (2016-2032)
- Figure 38: North America Agriculture Biotechnology Market Market Revenue (US$ Mn) Comparison by Country (2016-2032)
- Figure 39: North America Agriculture Biotechnology Market Market Revenue (US$ Mn) Comparison by By Organism Type (2016-2032)
- Figure 40: North America Agriculture Biotechnology Market Market Revenue (US$ Mn) Comparison by By Application (2016-2032)
- Figure 41: North America Agriculture Biotechnology Market Market Revenue (US$ Mn) Comparison by By Type (2016-2032)
- Figure 42: North America Agriculture Biotechnology Market Market Revenue (US$ Mn) Comparison by By Technology (2016-2032)
- Figure 43: North America Agriculture Biotechnology Market Market Y-o-Y Growth Rate Comparison by Country (2016-2032)
- Figure 44: North America Agriculture Biotechnology Market Market Y-o-Y Growth Rate Comparison by By Organism Type (2016-2032)
- Figure 45: North America Agriculture Biotechnology Market Market Y-o-Y Growth Rate Comparison by By Application (2016-2032)
- Figure 46: North America Agriculture Biotechnology Market Market Y-o-Y Growth Rate Comparison by By Type (2016-2032)
- Figure 47: North America Agriculture Biotechnology Market Market Y-o-Y Growth Rate Comparison by By Technology (2016-2032)
- Figure 48: North America Agriculture Biotechnology Market Market Share Comparison by Country (2016-2032)
- Figure 49: North America Agriculture Biotechnology Market Market Share Comparison by By Organism Type (2016-2032)
- Figure 50: North America Agriculture Biotechnology Market Market Share Comparison by By Application (2016-2032)
- Figure 51: North America Agriculture Biotechnology Market Market Share Comparison by By Type (2016-2032)
- Figure 52: North America Agriculture Biotechnology Market Market Share Comparison by By Technology (2016-2032)
- Figure 53: Western Europe Agriculture Biotechnology Market Revenue (US$ Mn) Market Share by By Organism Typein 2022
- Figure 54: Western Europe Agriculture Biotechnology Market Market Attractiveness Analysis by By Organism Type, 2016-2032
- Figure 55: Western Europe Agriculture Biotechnology Market Revenue (US$ Mn) Market Share by By Applicationin 2022
- Figure 56: Western Europe Agriculture Biotechnology Market Market Attractiveness Analysis by By Application, 2016-2032
- Figure 57: Western Europe Agriculture Biotechnology Market Revenue (US$ Mn) Market Share by By Typein 2022
- Figure 58: Western Europe Agriculture Biotechnology Market Market Attractiveness Analysis by By Type, 2016-2032
- Figure 59: Western Europe Agriculture Biotechnology Market Revenue (US$ Mn) Market Share by By Technologyin 2022
- Figure 60: Western Europe Agriculture Biotechnology Market Market Attractiveness Analysis by By Technology, 2016-2032
- Figure 61: Western Europe Agriculture Biotechnology Market Revenue (US$ Mn) Market Share by Country in 2022
- Figure 62: Western Europe Agriculture Biotechnology Market Market Attractiveness Analysis by Country, 2016-2032
- Figure 63: Western Europe Agriculture Biotechnology Market Market Revenue (US$ Mn) (2016-2032)
- Figure 64: Western Europe Agriculture Biotechnology Market Market Revenue (US$ Mn) Comparison by Country (2016-2032)
- Figure 65: Western Europe Agriculture Biotechnology Market Market Revenue (US$ Mn) Comparison by By Organism Type (2016-2032)
- Figure 66: Western Europe Agriculture Biotechnology Market Market Revenue (US$ Mn) Comparison by By Application (2016-2032)
- Figure 67: Western Europe Agriculture Biotechnology Market Market Revenue (US$ Mn) Comparison by By Type (2016-2032)
- Figure 68: Western Europe Agriculture Biotechnology Market Market Revenue (US$ Mn) Comparison by By Technology (2016-2032)
- Figure 69: Western Europe Agriculture Biotechnology Market Market Y-o-Y Growth Rate Comparison by Country (2016-2032)
- Figure 70: Western Europe Agriculture Biotechnology Market Market Y-o-Y Growth Rate Comparison by By Organism Type (2016-2032)
- Figure 71: Western Europe Agriculture Biotechnology Market Market Y-o-Y Growth Rate Comparison by By Application (2016-2032)
- Figure 72: Western Europe Agriculture Biotechnology Market Market Y-o-Y Growth Rate Comparison by By Type (2016-2032)
- Figure 73: Western Europe Agriculture Biotechnology Market Market Y-o-Y Growth Rate Comparison by By Technology (2016-2032)
- Figure 74: Western Europe Agriculture Biotechnology Market Market Share Comparison by Country (2016-2032)
- Figure 75: Western Europe Agriculture Biotechnology Market Market Share Comparison by By Organism Type (2016-2032)
- Figure 76: Western Europe Agriculture Biotechnology Market Market Share Comparison by By Application (2016-2032)
- Figure 77: Western Europe Agriculture Biotechnology Market Market Share Comparison by By Type (2016-2032)
- Figure 78: Western Europe Agriculture Biotechnology Market Market Share Comparison by By Technology (2016-2032)
- Figure 79: Eastern Europe Agriculture Biotechnology Market Revenue (US$ Mn) Market Share by By Organism Typein 2022
- Figure 80: Eastern Europe Agriculture Biotechnology Market Market Attractiveness Analysis by By Organism Type, 2016-2032
- Figure 81: Eastern Europe Agriculture Biotechnology Market Revenue (US$ Mn) Market Share by By Applicationin 2022
- Figure 82: Eastern Europe Agriculture Biotechnology Market Market Attractiveness Analysis by By Application, 2016-2032
- Figure 83: Eastern Europe Agriculture Biotechnology Market Revenue (US$ Mn) Market Share by By Typein 2022
- Figure 84: Eastern Europe Agriculture Biotechnology Market Market Attractiveness Analysis by By Type, 2016-2032
- Figure 85: Eastern Europe Agriculture Biotechnology Market Revenue (US$ Mn) Market Share by By Technologyin 2022
- Figure 86: Eastern Europe Agriculture Biotechnology Market Market Attractiveness Analysis by By Technology, 2016-2032
- Figure 87: Eastern Europe Agriculture Biotechnology Market Revenue (US$ Mn) Market Share by Country in 2022
- Figure 88: Eastern Europe Agriculture Biotechnology Market Market Attractiveness Analysis by Country, 2016-2032
- Figure 89: Eastern Europe Agriculture Biotechnology Market Market Revenue (US$ Mn) (2016-2032)
- Figure 90: Eastern Europe Agriculture Biotechnology Market Market Revenue (US$ Mn) Comparison by Country (2016-2032)
- Figure 91: Eastern Europe Agriculture Biotechnology Market Market Revenue (US$ Mn) Comparison by By Organism Type (2016-2032)
- Figure 92: Eastern Europe Agriculture Biotechnology Market Market Revenue (US$ Mn) Comparison by By Application (2016-2032)
- Figure 93: Eastern Europe Agriculture Biotechnology Market Market Revenue (US$ Mn) Comparison by By Type (2016-2032)
- Figure 94: Eastern Europe Agriculture Biotechnology Market Market Revenue (US$ Mn) Comparison by By Technology (2016-2032)
- Figure 95: Eastern Europe Agriculture Biotechnology Market Market Y-o-Y Growth Rate Comparison by Country (2016-2032)
- Figure 96: Eastern Europe Agriculture Biotechnology Market Market Y-o-Y Growth Rate Comparison by By Organism Type (2016-2032)
- Figure 97: Eastern Europe Agriculture Biotechnology Market Market Y-o-Y Growth Rate Comparison by By Application (2016-2032)
- Figure 98: Eastern Europe Agriculture Biotechnology Market Market Y-o-Y Growth Rate Comparison by By Type (2016-2032)
- Figure 99: Eastern Europe Agriculture Biotechnology Market Market Y-o-Y Growth Rate Comparison by By Technology (2016-2032)
- Figure 100: Eastern Europe Agriculture Biotechnology Market Market Share Comparison by Country (2016-2032)
- Figure 101: Eastern Europe Agriculture Biotechnology Market Market Share Comparison by By Organism Type (2016-2032)
- Figure 102: Eastern Europe Agriculture Biotechnology Market Market Share Comparison by By Application (2016-2032)
- Figure 103: Eastern Europe Agriculture Biotechnology Market Market Share Comparison by By Type (2016-2032)
- Figure 104: Eastern Europe Agriculture Biotechnology Market Market Share Comparison by By Technology (2016-2032)
- Figure 105: APAC Agriculture Biotechnology Market Revenue (US$ Mn) Market Share by By Organism Typein 2022
- Figure 106: APAC Agriculture Biotechnology Market Market Attractiveness Analysis by By Organism Type, 2016-2032
- Figure 107: APAC Agriculture Biotechnology Market Revenue (US$ Mn) Market Share by By Applicationin 2022
- Figure 108: APAC Agriculture Biotechnology Market Market Attractiveness Analysis by By Application, 2016-2032
- Figure 109: APAC Agriculture Biotechnology Market Revenue (US$ Mn) Market Share by By Typein 2022
- Figure 110: APAC Agriculture Biotechnology Market Market Attractiveness Analysis by By Type, 2016-2032
- Figure 111: APAC Agriculture Biotechnology Market Revenue (US$ Mn) Market Share by By Technologyin 2022
- Figure 112: APAC Agriculture Biotechnology Market Market Attractiveness Analysis by By Technology, 2016-2032
- Figure 113: APAC Agriculture Biotechnology Market Revenue (US$ Mn) Market Share by Country in 2022
- Figure 114: APAC Agriculture Biotechnology Market Market Attractiveness Analysis by Country, 2016-2032
- Figure 115: APAC Agriculture Biotechnology Market Market Revenue (US$ Mn) (2016-2032)
- Figure 116: APAC Agriculture Biotechnology Market Market Revenue (US$ Mn) Comparison by Country (2016-2032)
- Figure 117: APAC Agriculture Biotechnology Market Market Revenue (US$ Mn) Comparison by By Organism Type (2016-2032)
- Figure 118: APAC Agriculture Biotechnology Market Market Revenue (US$ Mn) Comparison by By Application (2016-2032)
- Figure 119: APAC Agriculture Biotechnology Market Market Revenue (US$ Mn) Comparison by By Type (2016-2032)
- Figure 120: APAC Agriculture Biotechnology Market Market Revenue (US$ Mn) Comparison by By Technology (2016-2032)
- Figure 121: APAC Agriculture Biotechnology Market Market Y-o-Y Growth Rate Comparison by Country (2016-2032)
- Figure 122: APAC Agriculture Biotechnology Market Market Y-o-Y Growth Rate Comparison by By Organism Type (2016-2032)
- Figure 123: APAC Agriculture Biotechnology Market Market Y-o-Y Growth Rate Comparison by By Application (2016-2032)
- Figure 124: APAC Agriculture Biotechnology Market Market Y-o-Y Growth Rate Comparison by By Type (2016-2032)
- Figure 125: APAC Agriculture Biotechnology Market Market Y-o-Y Growth Rate Comparison by By Technology (2016-2032)
- Figure 126: APAC Agriculture Biotechnology Market Market Share Comparison by Country (2016-2032)
- Figure 127: APAC Agriculture Biotechnology Market Market Share Comparison by By Organism Type (2016-2032)
- Figure 128: APAC Agriculture Biotechnology Market Market Share Comparison by By Application (2016-2032)
- Figure 129: APAC Agriculture Biotechnology Market Market Share Comparison by By Type (2016-2032)
- Figure 130: APAC Agriculture Biotechnology Market Market Share Comparison by By Technology (2016-2032)
- Figure 131: Latin America Agriculture Biotechnology Market Revenue (US$ Mn) Market Share by By Organism Typein 2022
- Figure 132: Latin America Agriculture Biotechnology Market Market Attractiveness Analysis by By Organism Type, 2016-2032
- Figure 133: Latin America Agriculture Biotechnology Market Revenue (US$ Mn) Market Share by By Applicationin 2022
- Figure 134: Latin America Agriculture Biotechnology Market Market Attractiveness Analysis by By Application, 2016-2032
- Figure 135: Latin America Agriculture Biotechnology Market Revenue (US$ Mn) Market Share by By Typein 2022
- Figure 136: Latin America Agriculture Biotechnology Market Market Attractiveness Analysis by By Type, 2016-2032
- Figure 137: Latin America Agriculture Biotechnology Market Revenue (US$ Mn) Market Share by By Technologyin 2022
- Figure 138: Latin America Agriculture Biotechnology Market Market Attractiveness Analysis by By Technology, 2016-2032
- Figure 139: Latin America Agriculture Biotechnology Market Revenue (US$ Mn) Market Share by Country in 2022
- Figure 140: Latin America Agriculture Biotechnology Market Market Attractiveness Analysis by Country, 2016-2032
- Figure 141: Latin America Agriculture Biotechnology Market Market Revenue (US$ Mn) (2016-2032)
- Figure 142: Latin America Agriculture Biotechnology Market Market Revenue (US$ Mn) Comparison by Country (2016-2032)
- Figure 143: Latin America Agriculture Biotechnology Market Market Revenue (US$ Mn) Comparison by By Organism Type (2016-2032)
- Figure 144: Latin America Agriculture Biotechnology Market Market Revenue (US$ Mn) Comparison by By Application (2016-2032)
- Figure 145: Latin America Agriculture Biotechnology Market Market Revenue (US$ Mn) Comparison by By Type (2016-2032)
- Figure 146: Latin America Agriculture Biotechnology Market Market Revenue (US$ Mn) Comparison by By Technology (2016-2032)
- Figure 147: Latin America Agriculture Biotechnology Market Market Y-o-Y Growth Rate Comparison by Country (2016-2032)
- Figure 148: Latin America Agriculture Biotechnology Market Market Y-o-Y Growth Rate Comparison by By Organism Type (2016-2032)
- Figure 149: Latin America Agriculture Biotechnology Market Market Y-o-Y Growth Rate Comparison by By Application (2016-2032)
- Figure 150: Latin America Agriculture Biotechnology Market Market Y-o-Y Growth Rate Comparison by By Type (2016-2032)
- Figure 151: Latin America Agriculture Biotechnology Market Market Y-o-Y Growth Rate Comparison by By Technology (2016-2032)
- Figure 152: Latin America Agriculture Biotechnology Market Market Share Comparison by Country (2016-2032)
- Figure 153: Latin America Agriculture Biotechnology Market Market Share Comparison by By Organism Type (2016-2032)
- Figure 154: Latin America Agriculture Biotechnology Market Market Share Comparison by By Application (2016-2032)
- Figure 155: Latin America Agriculture Biotechnology Market Market Share Comparison by By Type (2016-2032)
- Figure 156: Latin America Agriculture Biotechnology Market Market Share Comparison by By Technology (2016-2032)
- Figure 157: Middle East & Africa Agriculture Biotechnology Market Revenue (US$ Mn) Market Share by By Organism Typein 2022
- Figure 158: Middle East & Africa Agriculture Biotechnology Market Market Attractiveness Analysis by By Organism Type, 2016-2032
- Figure 159: Middle East & Africa Agriculture Biotechnology Market Revenue (US$ Mn) Market Share by By Applicationin 2022
- Figure 160: Middle East & Africa Agriculture Biotechnology Market Market Attractiveness Analysis by By Application, 2016-2032
- Figure 161: Middle East & Africa Agriculture Biotechnology Market Revenue (US$ Mn) Market Share by By Typein 2022
- Figure 162: Middle East & Africa Agriculture Biotechnology Market Market Attractiveness Analysis by By Type, 2016-2032
- Figure 163: Middle East & Africa Agriculture Biotechnology Market Revenue (US$ Mn) Market Share by By Technologyin 2022
- Figure 164: Middle East & Africa Agriculture Biotechnology Market Market Attractiveness Analysis by By Technology, 2016-2032
- Figure 165: Middle East & Africa Agriculture Biotechnology Market Revenue (US$ Mn) Market Share by Country in 2022
- Figure 166: Middle East & Africa Agriculture Biotechnology Market Market Attractiveness Analysis by Country, 2016-2032
- Figure 167: Middle East & Africa Agriculture Biotechnology Market Market Revenue (US$ Mn) (2016-2032)
- Figure 168: Middle East & Africa Agriculture Biotechnology Market Market Revenue (US$ Mn) Comparison by Country (2016-2032)
- Figure 169: Middle East & Africa Agriculture Biotechnology Market Market Revenue (US$ Mn) Comparison by By Organism Type (2016-2032)
- Figure 170: Middle East & Africa Agriculture Biotechnology Market Market Revenue (US$ Mn) Comparison by By Application (2016-2032)
- Figure 171: Middle East & Africa Agriculture Biotechnology Market Market Revenue (US$ Mn) Comparison by By Type (2016-2032)
- Figure 172: Middle East & Africa Agriculture Biotechnology Market Market Revenue (US$ Mn) Comparison by By Technology (2016-2032)
- Figure 173: Middle East & Africa Agriculture Biotechnology Market Market Y-o-Y Growth Rate Comparison by Country (2016-2032)
- Figure 174: Middle East & Africa Agriculture Biotechnology Market Market Y-o-Y Growth Rate Comparison by By Organism Type (2016-2032)
- Figure 175: Middle East & Africa Agriculture Biotechnology Market Market Y-o-Y Growth Rate Comparison by By Application (2016-2032)
- Figure 176: Middle East & Africa Agriculture Biotechnology Market Market Y-o-Y Growth Rate Comparison by By Type (2016-2032)
- Figure 177: Middle East & Africa Agriculture Biotechnology Market Market Y-o-Y Growth Rate Comparison by By Technology (2016-2032)
- Figure 178: Middle East & Africa Agriculture Biotechnology Market Market Share Comparison by Country (2016-2032)
- Figure 179: Middle East & Africa Agriculture Biotechnology Market Market Share Comparison by By Organism Type (2016-2032)
- Figure 180: Middle East & Africa Agriculture Biotechnology Market Market Share Comparison by By Application (2016-2032)
- Figure 181: Middle East & Africa Agriculture Biotechnology Market Market Share Comparison by By Type (2016-2032)
- Figure 182: Middle East & Africa Agriculture Biotechnology Market Market Share Comparison by By Technology (2016-2032)
List of Tables
- Table 1: Global Agriculture Biotechnology Market Market Comparison by By Organism Type (2016-2032)
- Table 2: Global Agriculture Biotechnology Market Market Comparison by By Application (2016-2032)
- Table 3: Global Agriculture Biotechnology Market Market Comparison by By Type (2016-2032)
- Table 4: Global Agriculture Biotechnology Market Market Comparison by By Technology (2016-2032)
- Table 5: Global Agriculture Biotechnology Market Revenue (US$ Mn) Comparison by Region (2016-2032)
- Table 6: Global Agriculture Biotechnology Market Market Revenue (US$ Mn) (2016-2032)
- Table 7: Global Agriculture Biotechnology Market Market Revenue (US$ Mn) Comparison by Region (2016-2032)
- Table 8: Global Agriculture Biotechnology Market Market Revenue (US$ Mn) Comparison by By Organism Type (2016-2032)
- Table 9: Global Agriculture Biotechnology Market Market Revenue (US$ Mn) Comparison by By Application (2016-2032)
- Table 10: Global Agriculture Biotechnology Market Market Revenue (US$ Mn) Comparison by By Type (2016-2032)
- Table 11: Global Agriculture Biotechnology Market Market Revenue (US$ Mn) Comparison by By Technology (2016-2032)
- Table 12: Global Agriculture Biotechnology Market Market Y-o-Y Growth Rate Comparison by Region (2016-2032)
- Table 13: Global Agriculture Biotechnology Market Market Y-o-Y Growth Rate Comparison by By Organism Type (2016-2032)
- Table 14: Global Agriculture Biotechnology Market Market Y-o-Y Growth Rate Comparison by By Application (2016-2032)
- Table 15: Global Agriculture Biotechnology Market Market Y-o-Y Growth Rate Comparison by By Type (2016-2032)
- Table 16: Global Agriculture Biotechnology Market Market Y-o-Y Growth Rate Comparison by By Technology (2016-2032)
- Table 17: Global Agriculture Biotechnology Market Market Share Comparison by Region (2016-2032)
- Table 18: Global Agriculture Biotechnology Market Market Share Comparison by By Organism Type (2016-2032)
- Table 19: Global Agriculture Biotechnology Market Market Share Comparison by By Application (2016-2032)
- Table 20: Global Agriculture Biotechnology Market Market Share Comparison by By Type (2016-2032)
- Table 21: Global Agriculture Biotechnology Market Market Share Comparison by By Technology (2016-2032)
- Table 22: North America Agriculture Biotechnology Market Market Comparison by By Application (2016-2032)
- Table 23: North America Agriculture Biotechnology Market Market Comparison by By Type (2016-2032)
- Table 24: North America Agriculture Biotechnology Market Market Comparison by By Technology (2016-2032)
- Table 25: North America Agriculture Biotechnology Market Revenue (US$ Mn) Comparison by Country (2016-2032)
- Table 26: North America Agriculture Biotechnology Market Market Revenue (US$ Mn) (2016-2032)
- Table 27: North America Agriculture Biotechnology Market Market Revenue (US$ Mn) Comparison by Country (2016-2032)
- Table 28: North America Agriculture Biotechnology Market Market Revenue (US$ Mn) Comparison by By Organism Type (2016-2032)
- Table 29: North America Agriculture Biotechnology Market Market Revenue (US$ Mn) Comparison by By Application (2016-2032)
- Table 30: North America Agriculture Biotechnology Market Market Revenue (US$ Mn) Comparison by By Type (2016-2032)
- Table 31: North America Agriculture Biotechnology Market Market Revenue (US$ Mn) Comparison by By Technology (2016-2032)
- Table 32: North America Agriculture Biotechnology Market Market Y-o-Y Growth Rate Comparison by Country (2016-2032)
- Table 33: North America Agriculture Biotechnology Market Market Y-o-Y Growth Rate Comparison by By Organism Type (2016-2032)
- Table 34: North America Agriculture Biotechnology Market Market Y-o-Y Growth Rate Comparison by By Application (2016-2032)
- Table 35: North America Agriculture Biotechnology Market Market Y-o-Y Growth Rate Comparison by By Type (2016-2032)
- Table 36: North America Agriculture Biotechnology Market Market Y-o-Y Growth Rate Comparison by By Technology (2016-2032)
- Table 37: North America Agriculture Biotechnology Market Market Share Comparison by Country (2016-2032)
- Table 38: North America Agriculture Biotechnology Market Market Share Comparison by By Organism Type (2016-2032)
- Table 39: North America Agriculture Biotechnology Market Market Share Comparison by By Application (2016-2032)
- Table 40: North America Agriculture Biotechnology Market Market Share Comparison by By Type (2016-2032)
- Table 41: North America Agriculture Biotechnology Market Market Share Comparison by By Technology (2016-2032)
- Table 42: Western Europe Agriculture Biotechnology Market Market Comparison by By Organism Type (2016-2032)
- Table 43: Western Europe Agriculture Biotechnology Market Market Comparison by By Application (2016-2032)
- Table 44: Western Europe Agriculture Biotechnology Market Market Comparison by By Type (2016-2032)
- Table 45: Western Europe Agriculture Biotechnology Market Market Comparison by By Technology (2016-2032)
- Table 46: Western Europe Agriculture Biotechnology Market Revenue (US$ Mn) Comparison by Country (2016-2032)
- Table 47: Western Europe Agriculture Biotechnology Market Market Revenue (US$ Mn) (2016-2032)
- Table 48: Western Europe Agriculture Biotechnology Market Market Revenue (US$ Mn) Comparison by Country (2016-2032)
- Table 49: Western Europe Agriculture Biotechnology Market Market Revenue (US$ Mn) Comparison by By Organism Type (2016-2032)
- Table 50: Western Europe Agriculture Biotechnology Market Market Revenue (US$ Mn) Comparison by By Application (2016-2032)
- Table 51: Western Europe Agriculture Biotechnology Market Market Revenue (US$ Mn) Comparison by By Type (2016-2032)
- Table 52: Western Europe Agriculture Biotechnology Market Market Revenue (US$ Mn) Comparison by By Technology (2016-2032)
- Table 53: Western Europe Agriculture Biotechnology Market Market Y-o-Y Growth Rate Comparison by Country (2016-2032)
- Table 54: Western Europe Agriculture Biotechnology Market Market Y-o-Y Growth Rate Comparison by By Organism Type (2016-2032)
- Table 55: Western Europe Agriculture Biotechnology Market Market Y-o-Y Growth Rate Comparison by By Application (2016-2032)
- Table 56: Western Europe Agriculture Biotechnology Market Market Y-o-Y Growth Rate Comparison by By Type (2016-2032)
- Table 57: Western Europe Agriculture Biotechnology Market Market Y-o-Y Growth Rate Comparison by By Technology (2016-2032)
- Table 58: Western Europe Agriculture Biotechnology Market Market Share Comparison by Country (2016-2032)
- Table 59: Western Europe Agriculture Biotechnology Market Market Share Comparison by By Organism Type (2016-2032)
- Table 60: Western Europe Agriculture Biotechnology Market Market Share Comparison by By Application (2016-2032)
- Table 61: Western Europe Agriculture Biotechnology Market Market Share Comparison by By Type (2016-2032)
- Table 62: Western Europe Agriculture Biotechnology Market Market Share Comparison by By Technology (2016-2032)
- Table 63: Eastern Europe Agriculture Biotechnology Market Market Comparison by By Organism Type (2016-2032)
- Table 64: Eastern Europe Agriculture Biotechnology Market Market Comparison by By Application (2016-2032)
- Table 65: Eastern Europe Agriculture Biotechnology Market Market Comparison by By Type (2016-2032)
- Table 66: Eastern Europe Agriculture Biotechnology Market Market Comparison by By Technology (2016-2032)
- Table 67: Eastern Europe Agriculture Biotechnology Market Revenue (US$ Mn) Comparison by Country (2016-2032)
- Table 68: Eastern Europe Agriculture Biotechnology Market Market Revenue (US$ Mn) (2016-2032)
- Table 69: Eastern Europe Agriculture Biotechnology Market Market Revenue (US$ Mn) Comparison by Country (2016-2032)
- Table 70: Eastern Europe Agriculture Biotechnology Market Market Revenue (US$ Mn) Comparison by By Organism Type (2016-2032)
- Table 71: Eastern Europe Agriculture Biotechnology Market Market Revenue (US$ Mn) Comparison by By Application (2016-2032)
- Table 72: Eastern Europe Agriculture Biotechnology Market Market Revenue (US$ Mn) Comparison by By Type (2016-2032)
- Table 73: Eastern Europe Agriculture Biotechnology Market Market Revenue (US$ Mn) Comparison by By Technology (2016-2032)
- Table 74: Eastern Europe Agriculture Biotechnology Market Market Y-o-Y Growth Rate Comparison by Country (2016-2032)
- Table 75: Eastern Europe Agriculture Biotechnology Market Market Y-o-Y Growth Rate Comparison by By Organism Type (2016-2032)
- Table 76: Eastern Europe Agriculture Biotechnology Market Market Y-o-Y Growth Rate Comparison by By Application (2016-2032)
- Table 77: Eastern Europe Agriculture Biotechnology Market Market Y-o-Y Growth Rate Comparison by By Type (2016-2032)
- Table 78: Eastern Europe Agriculture Biotechnology Market Market Y-o-Y Growth Rate Comparison by By Technology (2016-2032)
- Table 79: Eastern Europe Agriculture Biotechnology Market Market Share Comparison by Country (2016-2032)
- Table 80: Eastern Europe Agriculture Biotechnology Market Market Share Comparison by By Organism Type (2016-2032)
- Table 81: Eastern Europe Agriculture Biotechnology Market Market Share Comparison by By Application (2016-2032)
- Table 82: Eastern Europe Agriculture Biotechnology Market Market Share Comparison by By Type (2016-2032)
- Table 83: Eastern Europe Agriculture Biotechnology Market Market Share Comparison by By Technology (2016-2032)
- Table 84: APAC Agriculture Biotechnology Market Market Comparison by By Organism Type (2016-2032)
- Table 85: APAC Agriculture Biotechnology Market Market Comparison by By Application (2016-2032)
- Table 86: APAC Agriculture Biotechnology Market Market Comparison by By Type (2016-2032)
- Table 87: APAC Agriculture Biotechnology Market Market Comparison by By Technology (2016-2032)
- Table 88: APAC Agriculture Biotechnology Market Revenue (US$ Mn) Comparison by Country (2016-2032)
- Table 89: APAC Agriculture Biotechnology Market Market Revenue (US$ Mn) (2016-2032)
- Table 90: APAC Agriculture Biotechnology Market Market Revenue (US$ Mn) Comparison by Country (2016-2032)
- Table 91: APAC Agriculture Biotechnology Market Market Revenue (US$ Mn) Comparison by By Organism Type (2016-2032)
- Table 92: APAC Agriculture Biotechnology Market Market Revenue (US$ Mn) Comparison by By Application (2016-2032)
- Table 93: APAC Agriculture Biotechnology Market Market Revenue (US$ Mn) Comparison by By Type (2016-2032)
- Table 94: APAC Agriculture Biotechnology Market Market Revenue (US$ Mn) Comparison by By Technology (2016-2032)
- Table 95: APAC Agriculture Biotechnology Market Market Y-o-Y Growth Rate Comparison by Country (2016-2032)
- Table 96: APAC Agriculture Biotechnology Market Market Y-o-Y Growth Rate Comparison by By Organism Type (2016-2032)
- Table 97: APAC Agriculture Biotechnology Market Market Y-o-Y Growth Rate Comparison by By Application (2016-2032)
- Table 98: APAC Agriculture Biotechnology Market Market Y-o-Y Growth Rate Comparison by By Type (2016-2032)
- Table 99: APAC Agriculture Biotechnology Market Market Y-o-Y Growth Rate Comparison by By Technology (2016-2032)
- Table 100: APAC Agriculture Biotechnology Market Market Share Comparison by Country (2016-2032)
- Table 101: APAC Agriculture Biotechnology Market Market Share Comparison by By Organism Type (2016-2032)
- Table 102: APAC Agriculture Biotechnology Market Market Share Comparison by By Application (2016-2032)
- Table 103: APAC Agriculture Biotechnology Market Market Share Comparison by By Type (2016-2032)
- Table 104: APAC Agriculture Biotechnology Market Market Share Comparison by By Technology (2016-2032)
- Table 105: Latin America Agriculture Biotechnology Market Market Comparison by By Organism Type (2016-2032)
- Table 106: Latin America Agriculture Biotechnology Market Market Comparison by By Application (2016-2032)
- Table 107: Latin America Agriculture Biotechnology Market Market Comparison by By Type (2016-2032)
- Table 108: Latin America Agriculture Biotechnology Market Market Comparison by By Technology (2016-2032)
- Table 109: Latin America Agriculture Biotechnology Market Revenue (US$ Mn) Comparison by Country (2016-2032)
- Table 110: Latin America Agriculture Biotechnology Market Market Revenue (US$ Mn) (2016-2032)
- Table 111: Latin America Agriculture Biotechnology Market Market Revenue (US$ Mn) Comparison by Country (2016-2032)
- Table 112: Latin America Agriculture Biotechnology Market Market Revenue (US$ Mn) Comparison by By Organism Type (2016-2032)
- Table 113: Latin America Agriculture Biotechnology Market Market Revenue (US$ Mn) Comparison by By Application (2016-2032)
- Table 114: Latin America Agriculture Biotechnology Market Market Revenue (US$ Mn) Comparison by By Type (2016-2032)
- Table 115: Latin America Agriculture Biotechnology Market Market Revenue (US$ Mn) Comparison by By Technology (2016-2032)
- Table 116: Latin America Agriculture Biotechnology Market Market Y-o-Y Growth Rate Comparison by Country (2016-2032)
- Table 117: Latin America Agriculture Biotechnology Market Market Y-o-Y Growth Rate Comparison by By Organism Type (2016-2032)
- Table 118: Latin America Agriculture Biotechnology Market Market Y-o-Y Growth Rate Comparison by By Application (2016-2032)
- Table 119: Latin America Agriculture Biotechnology Market Market Y-o-Y Growth Rate Comparison by By Type (2016-2032)
- Table 120: Latin America Agriculture Biotechnology Market Market Y-o-Y Growth Rate Comparison by By Technology (2016-2032)
- Table 121: Latin America Agriculture Biotechnology Market Market Share Comparison by Country (2016-2032)
- Table 122: Latin America Agriculture Biotechnology Market Market Share Comparison by By Organism Type (2016-2032)
- Table 123: Latin America Agriculture Biotechnology Market Market Share Comparison by By Application (2016-2032)
- Table 124: Latin America Agriculture Biotechnology Market Market Share Comparison by By Type (2016-2032)
- Table 125: Latin America Agriculture Biotechnology Market Market Share Comparison by By Technology (2016-2032)
- Table 126: Middle East & Africa Agriculture Biotechnology Market Market Comparison by By Organism Type (2016-2032)
- Table 127: Middle East & Africa Agriculture Biotechnology Market Market Comparison by By Application (2016-2032)
- Table 128: Middle East & Africa Agriculture Biotechnology Market Market Comparison by By Type (2016-2032)
- Table 129: Middle East & Africa Agriculture Biotechnology Market Market Comparison by By Technology (2016-2032)
- Table 130: Middle East & Africa Agriculture Biotechnology Market Revenue (US$ Mn) Comparison by Country (2016-2032)
- Table 131: Middle East & Africa Agriculture Biotechnology Market Market Revenue (US$ Mn) (2016-2032)
- Table 132: Middle East & Africa Agriculture Biotechnology Market Market Revenue (US$ Mn) Comparison by Country (2016-2032)
- Table 133: Middle East & Africa Agriculture Biotechnology Market Market Revenue (US$ Mn) Comparison by By Organism Type (2016-2032)
- Table 134: Middle East & Africa Agriculture Biotechnology Market Market Revenue (US$ Mn) Comparison by By Application (2016-2032)
- Table 135: Middle East & Africa Agriculture Biotechnology Market Market Revenue (US$ Mn) Comparison by By Type (2016-2032)
- Table 136: Middle East & Africa Agriculture Biotechnology Market Market Revenue (US$ Mn) Comparison by By Technology (2016-2032)
- Table 137: Middle East & Africa Agriculture Biotechnology Market Market Y-o-Y Growth Rate Comparison by Country (2016-2032)
- Table 138: Middle East & Africa Agriculture Biotechnology Market Market Y-o-Y Growth Rate Comparison by By Organism Type (2016-2032)
- Table 139: Middle East & Africa Agriculture Biotechnology Market Market Y-o-Y Growth Rate Comparison by By Application (2016-2032)
- Table 140: Middle East & Africa Agriculture Biotechnology Market Market Y-o-Y Growth Rate Comparison by By Type (2016-2032)
- Table 141: Middle East & Africa Agriculture Biotechnology Market Market Y-o-Y Growth Rate Comparison by By Technology (2016-2032)
- Table 142: Middle East & Africa Agriculture Biotechnology Market Market Share Comparison by Country (2016-2032)
- Table 143: Middle East & Africa Agriculture Biotechnology Market Market Share Comparison by By Organism Type (2016-2032)
- Table 144: Middle East & Africa Agriculture Biotechnology Market Market Share Comparison by By Application (2016-2032)
- Table 145: Middle East & Africa Agriculture Biotechnology Market Market Share Comparison by By Type (2016-2032)
- Table 146: Middle East & Africa Agriculture Biotechnology Market Market Share Comparison by By Technology (2016-2032)
- 1. Executive Summary
-
- Bayer AG
- ADAMA Ltd
- ChemChina
- Corteva
- Evogene Ltd.
- KWS SAAT SE & Co. KGaA
- Limagrain
- Marrone Bio Innovations
- MITSUI & CO., LTD
- Nufarm
- Performance Plants Inc.
- Valent BioSciences LLC
Our Clients


View Our Licence Options
