Global Agricultural Tractors Market By Type (Utility Tractors, Row Crop Tractors, and Other ) By Power Outlook (Less than 40 HP, 41 to 100 HP, and More ), By Drive Type, By Operations, By Region and Companies - Industry Segment Outlook, Market Assessment, Competition Scenario, Trends, and Forecast 2023-2032
-
20793
-
April 2023
-
177
-


-
This report was compiled by Kalyani Khudsange Kalyani Khudsange is a Research Analyst at Prudour Pvt. Ltd. with 2.5 years of experience in market research and a strong technical background in Chemical Engineering and manufacturing. Correspondence Sr. Research Analyst Linkedin | Detailed Market research Methodology Our methodology involves a mix of primary research, including interviews with leading mental health experts, and secondary research from reputable medical journals and databases. View Detailed Methodology Page
-
Quick Navigation
Report Overview
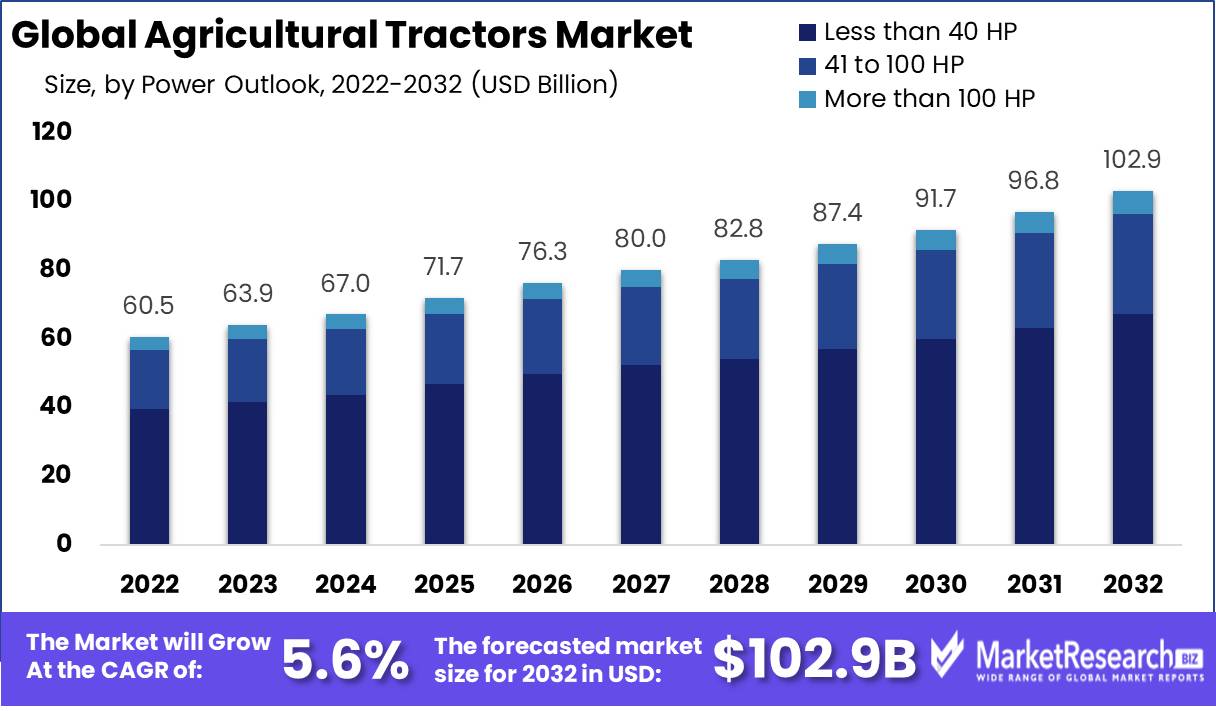
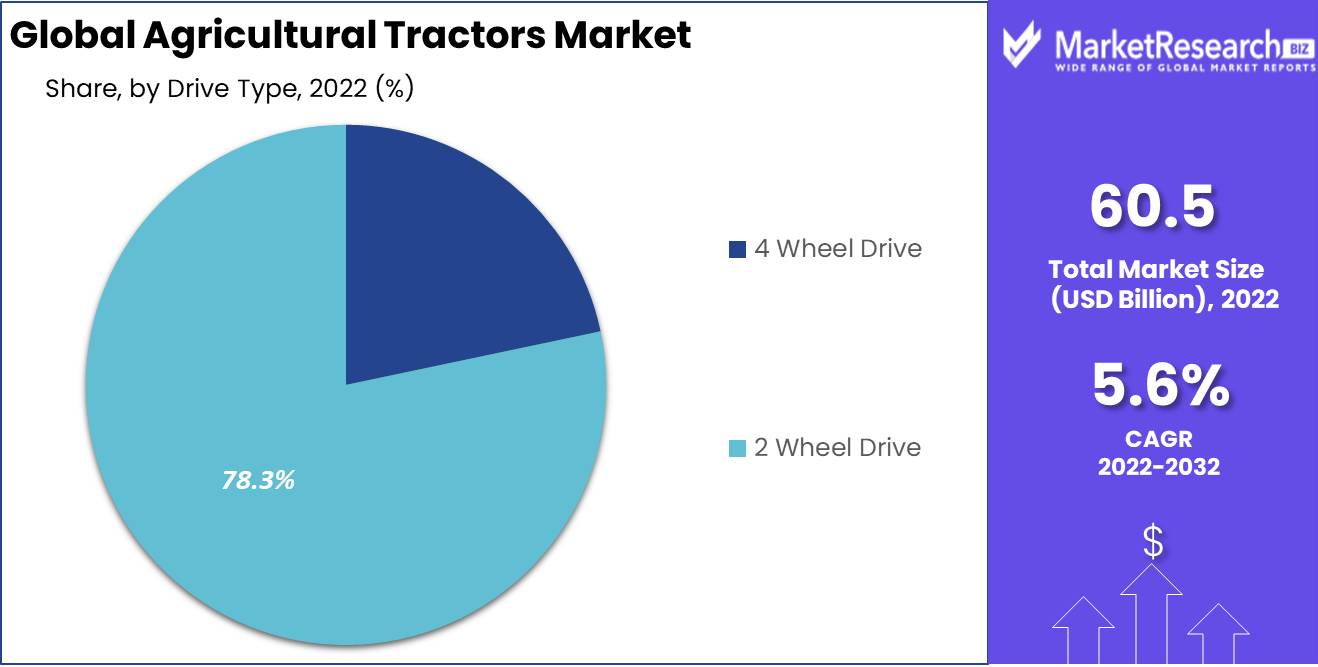
Global Agricultural Tractors Market size is expected to be worth around USD 102.5 Bn by 2032 from USD 60.5 Bn in 2022, growing at a CAGR of 5.6%. during the forecast period from 2023 to 2032.
The rising demand for small Tractorss for small farms and technological advancements like the blending of telematics is likely to boost the growth of the agricultural Tractorss market. The rapid development of mechanization is anticipated to boost the growth of the market over the next eight years. Furthermore, it is anticipated that the market could experience expansion due to the movement of farm workers into cities, resulting in a shortage of labor. The short production stoppage and disruption to the supply chain due to the COVID-19 epidemic slowed demand for the product.
Driving Factors
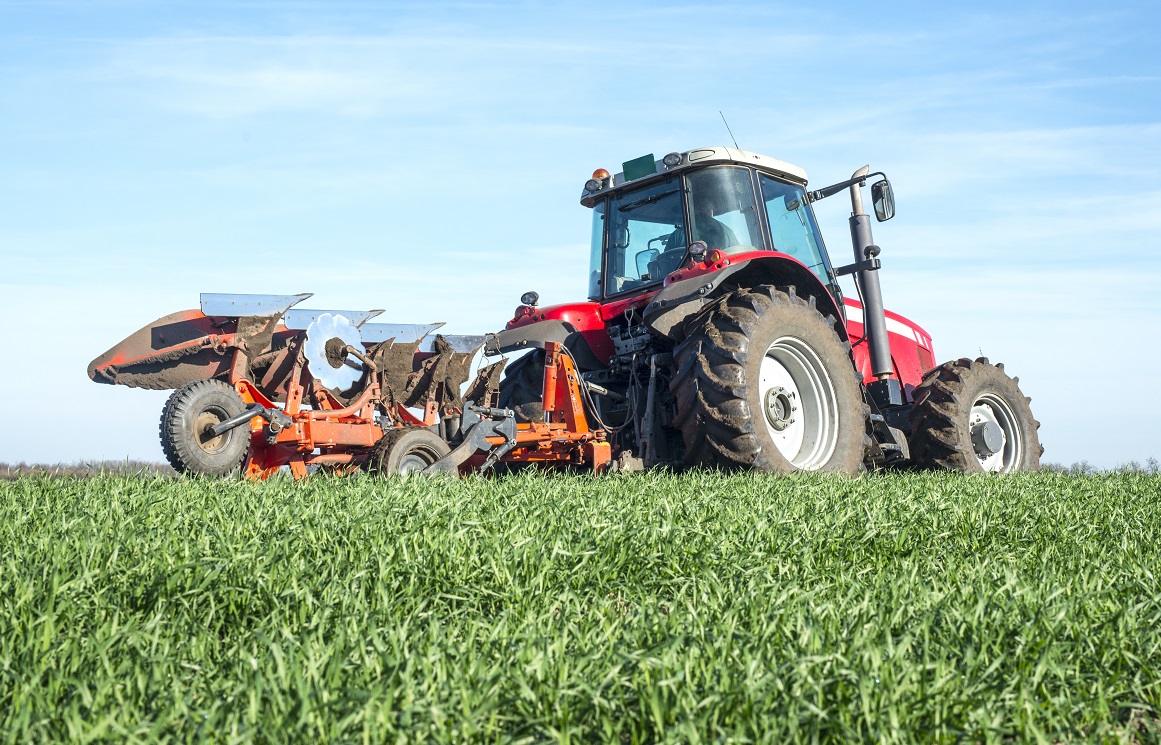
The world's population is growing rapidly, resulting in rising food demand. Agricultural Tractors Market play an important role in modern farming techniques, helping in various jobs such as plowing, planting, harvesting, and tilling. The need to boost agricultural productivity to meet the growing food need is driving the demand for agricultural Tractorss. The shift from conventional, manual, labor-intensive farming to mechanized farming is a significant driver for the agricultural Tractors market.
Tractorss offer significant advantages in terms of efficiency, productivity, and reduced labor dependency. Agricultural Tractorss are becoming more advanced with technological innovations. Modern Tractorss are equipped with features such as GPS navigation, precision farming technologies, telematics, and automated systems. These advancements enhance productivity, accuracy, and efficiency in farming operations, driving the demand for technologically advanced Tractorss.
Restraining Factors
The global agricultural Tractors market faces various impediments that hinder its growth and expansion. First and foremost, stringent government regulations and emissions standards restricting traditional diesel-powered Tractorss have led manufacturers to invest in alternative fuel technologies like electric or hybrid Tractorss that are still under development. Second, the high cost of agricultural machinery such as Tractorss presents a major barrier for small-scale farmers in developing nations, particularly when starting their business ventures.
Additionally, rural areas often lack infrastructure, such as proper roads and storage facilities that enable effective use of Tractorss and can limit their accessibility. Economic uncertainty, trade tensions, and fluctuating commodity prices may discourage farmers from purchasing new Tractorss and hamper market demand. Such obstacles challenge the global agricultural Tractors market, necessitating creative solutions and strategic adaptations for sustainable expansion.
By Type Analysis
The Agricultural Tractors Market orchard-type Tractors segment is anticipated to grow at the fastest level during the forecast period. Orchard Tractorss are specialized Tractorss used in fruit orchards and vineyards. They are designed with narrow profiles, low ground clearance, and compact dimensions to maneuver between tight rows and avoid damaging crops. Orchard Tractorss often come with specialized attachments and features for tasks like pruning, spraying, and harvesting in orchard environments.
By Power Outlook Analysis
Agricultural Tractors Market under-40 HP segment was responsible for more than 65.2% market share in terms of volume by 2022. The growth rate is attributable to the low price as well as the compact size and more convenience that is offered by Tractorss less than 40HP for all farming tasks. These machines are used primarily within the Asia Pacific region, where the majority of farms are less than 10 hectares in size and are the preferred choice of most farmers from the region. Additionally, the electrification of Tractorss in the smaller than 40 HP range is expected to increase in speed in the coming years.
The 40-100 HP range is anticipated to show an impressive CAGR over the forecast time. This is due to the increase in demand for these Tractorss in advanced markets like the U.S., Japan, and Germany. The rise in income, the technologically-savvy farmers, and established after-sales support are expected to increase the expansion of this segment over the forecast time. The growing demand for Tractorss with high power for farms with more than 10 hectares is likely to become a longer-term driver, propelling the segment during the forecast time.
By Drive Type Analysis
The Agricultural Tractors Market 2Wheel Drive segment held more than 78.3% market share in the volume of 2022. It is also predicted to grow at the fastest rate over the forecast time. Low initial costs and improved maneuverability are the long-term factors that are expected to drive the demand for the 2WD market, especially within the Asia Pacific market. 2WDs are the most sought-after Tractorss by farmers with a middle income in India. However, an increase in diesel costs has increased the operating costs of farmers and is expected to be among the biggest concerns over the forecast period.
By Operation Analysis
The Agricultural Tractors Market is segmented by manual and automatic Tractorss by operational proficiency. Manual Tractors vehicles are predicted to dominate the majority of the market. The cause for this is manual Tractorss are easier to handle, are less frequent to maintain, and have lower costs. In the upcoming years, the demand for manual Tractorss is predicted to grow significantly. Farmers can use a variety of manual Tractorss, as they are less expensive than autonomous Tractorss. The Agricultural Tractors Market segment for autonomous Tractorss is expected to grow in the next few years.
To diversification of their product offerings, companies are investing heavily in the production of electrically-propelled autonomous Tractorss. The development of an electric-powered autonomous Tractors is likely to be driven by government-sponsored initiatives in order to cut carbon emissions.
Market Key Segmentation
By Type
- Utility Tractorss
- Row Crop Tractorss
- Orchard Type Tractorss
- Other Types
By Power Outlook
- Less than 40 HP
- 41 to 100 HP
- More than 100 HP
By Drive Type
- 4 Wheel Drive
- 2 Wheel Drive
By Operations
- Automatic Tractors Vehicle
- Manual Tractors Vehicle
Growth Opportunity
The integration of advanced technologies in agricultural Tractorss presents a significant growth opportunity. Precision farming technologies, such as GPS navigation, auto-steering, and telematics, enhance operational efficiency, accuracy, and productivity. Ongoing advancements in connectivity, data analytics, and automation will likely drive the adoption of technologically advanced Tractorss, providing growth opportunities for manufacturers.
The Agricultural Tractors Market increasing focus on sustainability and environmental concerns creates a demand for more eco-friendly Tractorss. Manufacturers can seize opportunities by developing and promoting Tractorss powered by alternative fuels, such as electric, hybrid, or biofuels. Sustainable practices and eco-friendly features, including reduced emissions and improved fuel efficiency, are becoming important considerations for farmers and agricultural stakeholders.
The Agricultural Tractors Market adoption of precision farming practices and automation in agriculture is on the rise. Agricultural Tractors Market equipped with advanced technologies for variable rate application, autonomous operation, and real-time data collection and analysis can help farmers optimize resources, reduce costs, and increase productivity. Manufacturers that provide Tractorss with integrated precision farming and automation capabilities can tap into this growth opportunity.
Latest Trends
Rising adoption of precision farming techniques, which uses advanced technologies such as GPS, sensors, and data analytics to optimize farming practices. Tractorss equipped with precision agriculture features can provide accurate and efficient field operations, leading to improved productivity and reduced costs.Popularity of Autonomous or self-driving Tractorss is incraesing in the agricultural sector.
These type of Tractorss enabled with advanced technologies like GPS, sensors, and artificial intelligence to operate without human intervention. Autonomous Tractorss are beneficial such as increased productivity, reduced labor costs, and improved efficiency.The popularity for electric and hybrid Tractorss is on the peak due to increasing concerns over environmental sustainability and fuel efficiency. Electric and hybrid Tractorss produce fewer emissions and offer least operating costs compared to conventional Tractorss. Technological advancements in battery technology is the major factor behind the adoption of electric and hybrid Tractorss.
Regional Analysis
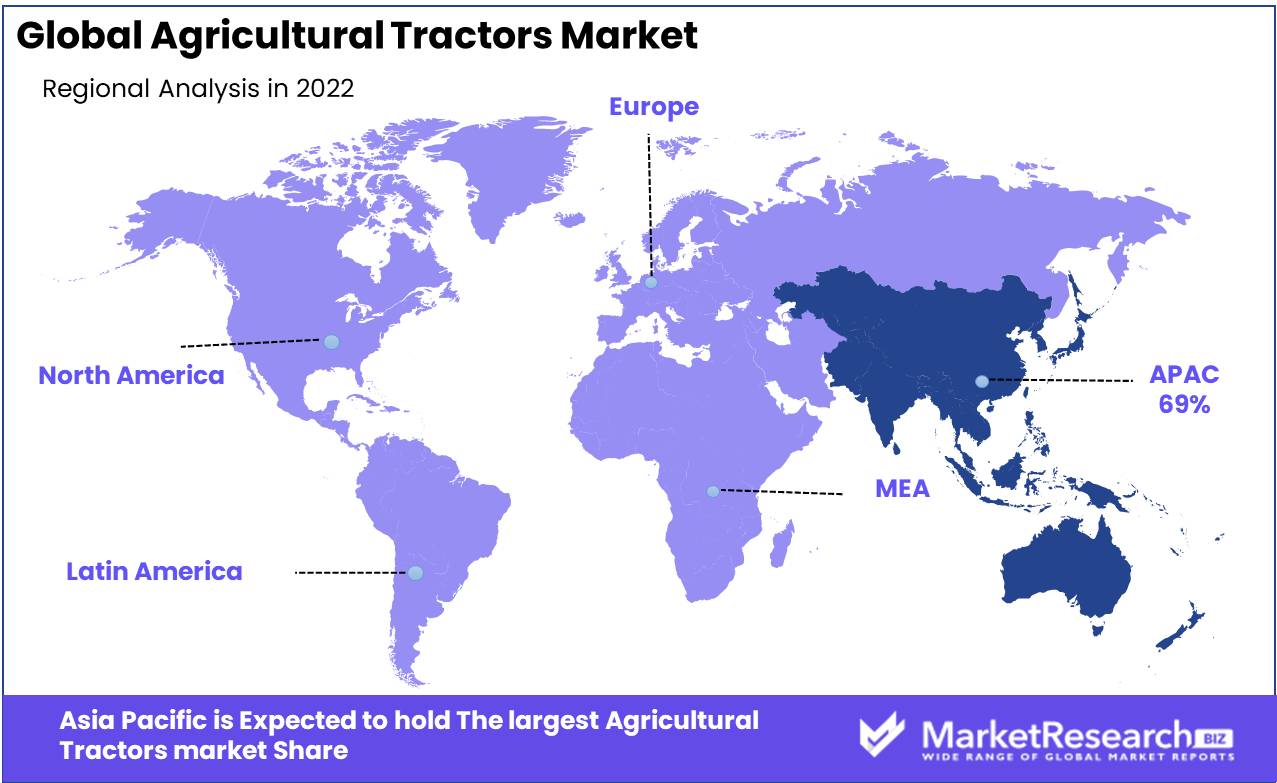
Asia Pacific led the Global Agricultural Tractors Market with a share of 69% in 2022. It is projected to increase at the fastest CAGR over the forecast period while maintaining the top position. Growth is fueled mainly by India and China. India was the leader of the APAC market, accounting for more than 54% of the market in 2022. In India, the sales of products were about 800 thousand units in 2022. The ease of loan access, the attractive Minimum Support Price (MSP), and better monsoon conditions are predicted to be favorable for the growth of the market in 2022.
Europe is predicted to expand at a moderate rate with respect to volume during 2023. The increase is due to the growing demand for large farm Tractorss, specifically from Italy, Greece, and Lithuania. Additionally, the huge demand for autonomous Tractorss is anticipated to boost regional market growth during the forecast time. On the other hand, a lengthy waiting time when purchasing a new Tractors due to delays in production is expected to hinder market growth during the forecast time.
Key Regions and Countries
- North America
- The US
- Canada
- Mexico
- Western Europe
- Germany
- France
- The UK
- Spain
- Italy
- Portugal
- Ireland
- Austria
- Switzerland
- Benelux
- Nordic
- Rest of Western Europe
- Eastern Europe
- Russia
- Poland
- The Czech Republic
- Greece
- Rest of Eastern Europe
- APAC
- China
- Japan
- South Korea
- India
- Australia & New Zealand
- Indonesia
- Malaysia
- Philippines
- Singapore
- Thailand
- Vietnam
- Rest of APAC
- Latin America
- Brazil
- Colombia
- Chile
- Argentina
- Costa Rica
- Rest of Latin America
- Middle East & Africa
- Algeria
- Egypt
- Israel
- Kuwait
- Nigeria
- Saudi Arabia
- South Africa
- Turkey
- United Arab Emirates
- Rest of MEA
Key Players Analysis
The shortage of skilled workers and expensive raw materials, and the supply of semiconductors are a few short-term problems confronting OEMs. In addition, due to the low inventories, dealers and OEMs are unable to meet the demands of consumers. However, strategic initiatives, like collaborations and new ideas, are expected to help overcome these bottlenecks in the next few years.
Top Key Players in Agricultural Tractors Market
- Deere & Company
- SAME DEUTZ-FAHR Group
- Kutoba Corporation
- McCormick International
- Mahindra Group
- Yanmar
- Farmtac
- Massey Ferguson
- Escorts Group
- Kubota
- Other Key Players
Recent Developments
- November 20, 2022: VST Tillers Tractorss Ltd and ZETOR TractorsS disclosed two best-in-class Tractors models during the CII Agro Tech India 2022 exhibition. These category Tractorss of 45 HP and 50 HP were jointly designed by VST & ZETOR at their India and Czech Republic plants.
- July 20, 2021: New Holland North America instigated the T7 Heavy-duty Tractors equipped with PLM Intelligence as an addition to its range of agricultural Tractorss. The new Tractors aims to assist farmers in becoming more productive by allowing multi-tasking in various transportation and field applications.
- June 20, 2022: Solis Yanmar company launched three new Tractors models in the category below 30 HP for Turkish farms to export from India
Report Scope
Report Features Description Market Value (2022) US$ 60.5 Bn Forecast Revenue (2032) US$ 102.5 Bn CAGR (2023-2032) 5.6% Base Year for Estimation 2022 Historic Period 2016-2022 Forecast Period 2023-2032 Report Coverage Revenue Forecast, Market Dynamics, COVID-19 Impact, Competitive Landscape, Recent Developments Segments Covered By Type- Utility Tractorss, Row Crop Tractorss, Orchard Type Tractorss, and Other Types; Power Outlook- Less than 40 HP, 41 to 100 HP, and More than 100 HP; Drive Type- 4 Wheel Drive and 2 Wheel Drive; By Operations- Automatic Tractors Vehicle and Manual Tractors Vehicle Regional Analysis North America - The US, Canada, & Mexico; Western Europe - Germany, France, The UK, Spain, Italy, Portugal, Ireland, Austria, Switzerland, Benelux, Nordic, & Rest of Western Europe; Eastern Europe - Russia, Poland, The Czech Republic, Greece, & Rest of Eastern Europe; APAC - China, Japan, South Korea, India, Australia & New Zealand, Indonesia, Malaysia, Philippines, Singapore, Thailand, Vietnam, & Rest of APAC; Latin America - Brazil, Colombia, Chile, Argentina, Costa Rica, & Rest of Latin America; The Middle East & Africa - Algeria, Egypt, Israel, Kuwait, Nigeria, Saudi Arabia, South Africa, Turkey, United Arab Emirates, & Rest of MEA. Competitive Landscape Deere & Company, SAME DEUTZ-FAHR Group, Kutoba Corporation, McCormick International, Mahindra Group, Yanmar, Farmtac, Massey Ferguson, Escorts Group, Kubota, Other Key Players Customization Scope Customization for segments, region/country-level will be provided. Moreover, additional customization can be done based on the requirements. Purchase Options We have three licenses to opt for: Single User License, Multi-User License (Up to 5 Users), Corporate Use License (Unlimited User and Printable PDF) -
- 1. Executive Summary
- 1.1. Definition
- 1.2. Taxonomy
- 1.3. Research Scope
- 1.4. Key Analysis
- 1.5. Key Findings by Major Segments
- 1.6. Top strategies by Major Players
- 2. Global Agricultural Tractors Market Overview
- 2.1. Agricultural Tractors Market Dynamics
- 2.1.1. Drivers
- 2.1.2. Opportunities
- 2.1.3. Restraints
- 2.1.4. Challenges
- 2.2. Macro-economic Factors
- 2.3. Regulatory Framework
- 2.4. Market Investment Feasibility Index
- 2.5. PEST Analysis
- 2.6. PORTER’S Five Force Analysis
- 2.7. Drivers & Restraints Impact Analysis
- 2.8. Industry Chain Analysis
- 2.9. Cost Structure Analysis
- 2.10. Marketing Strategy
- 2.11. Russia-Ukraine War Impact Analysis
- 2.12. Opportunity Map Analysis
- 2.13. Market Competition Scenario Analysis
- 2.14. Product Life Cycle Analysis
- 2.15. Opportunity Orbits
- 2.16. Manufacturer Intensity Map
- 2.17. Major Companies sales by Value & Volume
- 2.1. Agricultural Tractors Market Dynamics
- 3. Global Agricultural Tractors Market Analysis, Opportunity and Forecast, 2016-2032
- 3.1. Global Agricultural Tractors Market Analysis, 2016-2021
- 3.2. Global Agricultural Tractors Market Opportunity and Forecast, 2023-2032
- 3.3. Global Agricultural Tractors Market Analysis, Opportunity and Forecast, By Type, 2016-2032
- 3.3.1. Global Agricultural Tractors Market Analysis by Type: Introduction
- 3.3.2. Market Size Absolute $ Opportunity Analysis and Forecast, By Type, 2016-2032
- 3.3.3. Utility Tractorss
- 3.3.4. Row Crop Tractorss
- 3.3.5. Orchard Type Tractorss
- 3.3.6. Other Types
- 3.4. Global Agricultural Tractors Market Analysis, Opportunity and Forecast, By Power Outlook, 2016-2032
- 3.4.1. Global Agricultural Tractors Market Analysis by Power Outlook: Introduction
- 3.4.2. Market Size Absolute $ Opportunity Analysis and Forecast, By Power Outlook, 2016-2032
- 3.4.3. Less than 40 HP
- 3.4.4. 41 to 100 HP
- 3.4.5. More than 100 HP
- 3.5. Global Agricultural Tractors Market Analysis, Opportunity and Forecast, By Drive Type, 2016-2032
- 3.5.1. Global Agricultural Tractors Market Analysis by Drive Type: Introduction
- 3.5.2. Market Size Absolute $ Opportunity Analysis and Forecast, By Drive Type, 2016-2032
- 3.5.3. 4 Wheel Drive
- 3.5.4. 2 Wheel Drive
- 3.6. Global Agricultural Tractors Market Analysis, Opportunity and Forecast, By Operations , 2016-2032
- 3.6.1. Global Agricultural Tractors Market Analysis by Operations : Introduction
- 3.6.2. Market Size Absolute $ Opportunity Analysis and Forecast, By Operations , 2016-2032
- 3.6.3. Automatic Tractors Vehicle
- 3.6.4. Manual Tractors Vehicle
- 4. North America Agricultural Tractors Market Analysis, Opportunity and Forecast, 2016-2032
- 4.1. North America Agricultural Tractors Market Analysis, 2016-2021
- 4.2. North America Agricultural Tractors Market Opportunity and Forecast, 2023-2032
- 4.3. North America Agricultural Tractors Market Analysis, Opportunity and Forecast, By Type, 2016-2032
- 4.3.1. North America Agricultural Tractors Market Analysis by Type: Introduction
- 4.3.2. Market Size Absolute $ Opportunity Analysis and Forecast, By Type, 2016-2032
- 4.3.3. Utility Tractorss
- 4.3.4. Row Crop Tractorss
- 4.3.5. Orchard Type Tractorss
- 4.3.6. Other Types
- 4.4. North America Agricultural Tractors Market Analysis, Opportunity and Forecast, By Power Outlook, 2016-2032
- 4.4.1. North America Agricultural Tractors Market Analysis by Power Outlook: Introduction
- 4.4.2. Market Size Absolute $ Opportunity Analysis and Forecast, By Power Outlook, 2016-2032
- 4.4.3. Less than 40 HP
- 4.4.4. 41 to 100 HP
- 4.4.5. More than 100 HP
- 4.5. North America Agricultural Tractors Market Analysis, Opportunity and Forecast, By Drive Type, 2016-2032
- 4.5.1. North America Agricultural Tractors Market Analysis by Drive Type: Introduction
- 4.5.2. Market Size Absolute $ Opportunity Analysis and Forecast, By Drive Type, 2016-2032
- 4.5.3. 4 Wheel Drive
- 4.5.4. 2 Wheel Drive
- 4.6. North America Agricultural Tractors Market Analysis, Opportunity and Forecast, By Operations , 2016-2032
- 4.6.1. North America Agricultural Tractors Market Analysis by Operations : Introduction
- 4.6.2. Market Size Absolute $ Opportunity Analysis and Forecast, By Operations , 2016-2032
- 4.6.3. Automatic Tractors Vehicle
- 4.6.4. Manual Tractors Vehicle
- 4.7. North America Agricultural Tractors Market Analysis, Opportunity and Forecast, By Country , 2016-2032
- 4.7.1. North America Agricultural Tractors Market Analysis by Country : Introduction
- 4.7.2. Market Size Absolute $ Opportunity Analysis and Forecast, Country , 2016-2032
- 4.7.2.1. The US
- 4.7.2.2. Canada
- 4.7.2.3. Mexico
- 5. Western Europe Agricultural Tractors Market Analysis, Opportunity and Forecast, 2016-2032
- 5.1. Western Europe Agricultural Tractors Market Analysis, 2016-2021
- 5.2. Western Europe Agricultural Tractors Market Opportunity and Forecast, 2023-2032
- 5.3. Western Europe Agricultural Tractors Market Analysis, Opportunity and Forecast, By Type, 2016-2032
- 5.3.1. Western Europe Agricultural Tractors Market Analysis by Type: Introduction
- 5.3.2. Market Size Absolute $ Opportunity Analysis and Forecast, By Type, 2016-2032
- 5.3.3. Utility Tractorss
- 5.3.4. Row Crop Tractorss
- 5.3.5. Orchard Type Tractorss
- 5.3.6. Other Types
- 5.4. Western Europe Agricultural Tractors Market Analysis, Opportunity and Forecast, By Power Outlook, 2016-2032
- 5.4.1. Western Europe Agricultural Tractors Market Analysis by Power Outlook: Introduction
- 5.4.2. Market Size Absolute $ Opportunity Analysis and Forecast, By Power Outlook, 2016-2032
- 5.4.3. Less than 40 HP
- 5.4.4. 41 to 100 HP
- 5.4.5. More than 100 HP
- 5.5. Western Europe Agricultural Tractors Market Analysis, Opportunity and Forecast, By Drive Type, 2016-2032
- 5.5.1. Western Europe Agricultural Tractors Market Analysis by Drive Type: Introduction
- 5.5.2. Market Size Absolute $ Opportunity Analysis and Forecast, By Drive Type, 2016-2032
- 5.5.3. 4 Wheel Drive
- 5.5.4. 2 Wheel Drive
- 5.6. Western Europe Agricultural Tractors Market Analysis, Opportunity and Forecast, By Operations , 2016-2032
- 5.6.1. Western Europe Agricultural Tractors Market Analysis by Operations : Introduction
- 5.6.2. Market Size Absolute $ Opportunity Analysis and Forecast, By Operations , 2016-2032
- 5.6.3. Automatic Tractors Vehicle
- 5.6.4. Manual Tractors Vehicle
- 5.7. Western Europe Agricultural Tractors Market Analysis, Opportunity and Forecast, By Country , 2016-2032
- 5.7.1. Western Europe Agricultural Tractors Market Analysis by Country : Introduction
- 5.7.2. Market Size Absolute $ Opportunity Analysis and Forecast, Country , 2016-2032
- 5.7.2.1. Germany
- 5.7.2.2. France
- 5.7.2.3. The UK
- 5.7.2.4. Spain
- 5.7.2.5. Italy
- 5.7.2.6. Portugal
- 5.7.2.7. Ireland
- 5.7.2.8. Austria
- 5.7.2.9. Switzerland
- 5.7.2.10. Benelux
- 5.7.2.11. Nordic
- 5.7.2.12. Rest of Western Europe
- 6. Eastern Europe Agricultural Tractors Market Analysis, Opportunity and Forecast, 2016-2032
- 6.1. Eastern Europe Agricultural Tractors Market Analysis, 2016-2021
- 6.2. Eastern Europe Agricultural Tractors Market Opportunity and Forecast, 2023-2032
- 6.3. Eastern Europe Agricultural Tractors Market Analysis, Opportunity and Forecast, By Type, 2016-2032
- 6.3.1. Eastern Europe Agricultural Tractors Market Analysis by Type: Introduction
- 6.3.2. Market Size Absolute $ Opportunity Analysis and Forecast, By Type, 2016-2032
- 6.3.3. Utility Tractorss
- 6.3.4. Row Crop Tractorss
- 6.3.5. Orchard Type Tractorss
- 6.3.6. Other Types
- 6.4. Eastern Europe Agricultural Tractors Market Analysis, Opportunity and Forecast, By Power Outlook, 2016-2032
- 6.4.1. Eastern Europe Agricultural Tractors Market Analysis by Power Outlook: Introduction
- 6.4.2. Market Size Absolute $ Opportunity Analysis and Forecast, By Power Outlook, 2016-2032
- 6.4.3. Less than 40 HP
- 6.4.4. 41 to 100 HP
- 6.4.5. More than 100 HP
- 6.5. Eastern Europe Agricultural Tractors Market Analysis, Opportunity and Forecast, By Drive Type, 2016-2032
- 6.5.1. Eastern Europe Agricultural Tractors Market Analysis by Drive Type: Introduction
- 6.5.2. Market Size Absolute $ Opportunity Analysis and Forecast, By Drive Type, 2016-2032
- 6.5.3. 4 Wheel Drive
- 6.5.4. 2 Wheel Drive
- 6.6. Eastern Europe Agricultural Tractors Market Analysis, Opportunity and Forecast, By Operations , 2016-2032
- 6.6.1. Eastern Europe Agricultural Tractors Market Analysis by Operations : Introduction
- 6.6.2. Market Size Absolute $ Opportunity Analysis and Forecast, By Operations , 2016-2032
- 6.6.3. Automatic Tractors Vehicle
- 6.6.4. Manual Tractors Vehicle
- 6.7. Eastern Europe Agricultural Tractors Market Analysis, Opportunity and Forecast, By Country , 2016-2032
- 6.7.1. Eastern Europe Agricultural Tractors Market Analysis by Country : Introduction
- 6.7.2. Market Size Absolute $ Opportunity Analysis and Forecast, Country , 2016-2032
- 6.7.2.1. Russia
- 6.7.2.2. Poland
- 6.7.2.3. The Czech Republic
- 6.7.2.4. Greece
- 6.7.2.5. Rest of Eastern Europe
- 7. APAC Agricultural Tractors Market Analysis, Opportunity and Forecast, 2016-2032
- 7.1. APAC Agricultural Tractors Market Analysis, 2016-2021
- 7.2. APAC Agricultural Tractors Market Opportunity and Forecast, 2023-2032
- 7.3. APAC Agricultural Tractors Market Analysis, Opportunity and Forecast, By Type, 2016-2032
- 7.3.1. APAC Agricultural Tractors Market Analysis by Type: Introduction
- 7.3.2. Market Size Absolute $ Opportunity Analysis and Forecast, By Type, 2016-2032
- 7.3.3. Utility Tractorss
- 7.3.4. Row Crop Tractorss
- 7.3.5. Orchard Type Tractorss
- 7.3.6. Other Types
- 7.4. APAC Agricultural Tractors Market Analysis, Opportunity and Forecast, By Power Outlook, 2016-2032
- 7.4.1. APAC Agricultural Tractors Market Analysis by Power Outlook: Introduction
- 7.4.2. Market Size Absolute $ Opportunity Analysis and Forecast, By Power Outlook, 2016-2032
- 7.4.3. Less than 40 HP
- 7.4.4. 41 to 100 HP
- 7.4.5. More than 100 HP
- 7.5. APAC Agricultural Tractors Market Analysis, Opportunity and Forecast, By Drive Type, 2016-2032
- 7.5.1. APAC Agricultural Tractors Market Analysis by Drive Type: Introduction
- 7.5.2. Market Size Absolute $ Opportunity Analysis and Forecast, By Drive Type, 2016-2032
- 7.5.3. 4 Wheel Drive
- 7.5.4. 2 Wheel Drive
- 7.6. APAC Agricultural Tractors Market Analysis, Opportunity and Forecast, By Operations , 2016-2032
- 7.6.1. APAC Agricultural Tractors Market Analysis by Operations : Introduction
- 7.6.2. Market Size Absolute $ Opportunity Analysis and Forecast, By Operations , 2016-2032
- 7.6.3. Automatic Tractors Vehicle
- 7.6.4. Manual Tractors Vehicle
- 7.7. APAC Agricultural Tractors Market Analysis, Opportunity and Forecast, By Country , 2016-2032
- 7.7.1. APAC Agricultural Tractors Market Analysis by Country : Introduction
- 7.7.2. Market Size Absolute $ Opportunity Analysis and Forecast, Country , 2016-2032
- 7.7.2.1. China
- 7.7.2.2. Japan
- 7.7.2.3. South Korea
- 7.7.2.4. India
- 7.7.2.5. Australia & New Zeland
- 7.7.2.6. Indonesia
- 7.7.2.7. Malaysia
- 7.7.2.8. Philippines
- 7.7.2.9. Singapore
- 7.7.2.10. Thailand
- 7.7.2.11. Vietnam
- 7.7.2.12. Rest of APAC
- 8. Latin America Agricultural Tractors Market Analysis, Opportunity and Forecast, 2016-2032
- 8.1. Latin America Agricultural Tractors Market Analysis, 2016-2021
- 8.2. Latin America Agricultural Tractors Market Opportunity and Forecast, 2023-2032
- 8.3. Latin America Agricultural Tractors Market Analysis, Opportunity and Forecast, By Type, 2016-2032
- 8.3.1. Latin America Agricultural Tractors Market Analysis by Type: Introduction
- 8.3.2. Market Size Absolute $ Opportunity Analysis and Forecast, By Type, 2016-2032
- 8.3.3. Utility Tractorss
- 8.3.4. Row Crop Tractorss
- 8.3.5. Orchard Type Tractorss
- 8.3.6. Other Types
- 8.4. Latin America Agricultural Tractors Market Analysis, Opportunity and Forecast, By Power Outlook, 2016-2032
- 8.4.1. Latin America Agricultural Tractors Market Analysis by Power Outlook: Introduction
- 8.4.2. Market Size Absolute $ Opportunity Analysis and Forecast, By Power Outlook, 2016-2032
- 8.4.3. Less than 40 HP
- 8.4.4. 41 to 100 HP
- 8.4.5. More than 100 HP
- 8.5. Latin America Agricultural Tractors Market Analysis, Opportunity and Forecast, By Drive Type, 2016-2032
- 8.5.1. Latin America Agricultural Tractors Market Analysis by Drive Type: Introduction
- 8.5.2. Market Size Absolute $ Opportunity Analysis and Forecast, By Drive Type, 2016-2032
- 8.5.3. 4 Wheel Drive
- 8.5.4. 2 Wheel Drive
- 8.6. Latin America Agricultural Tractors Market Analysis, Opportunity and Forecast, By Operations , 2016-2032
- 8.6.1. Latin America Agricultural Tractors Market Analysis by Operations : Introduction
- 8.6.2. Market Size Absolute $ Opportunity Analysis and Forecast, By Operations , 2016-2032
- 8.6.3. Automatic Tractors Vehicle
- 8.6.4. Manual Tractors Vehicle
- 8.7. Latin America Agricultural Tractors Market Analysis, Opportunity and Forecast, By Country , 2016-2032
- 8.7.1. Latin America Agricultural Tractors Market Analysis by Country : Introduction
- 8.7.2. Market Size Absolute $ Opportunity Analysis and Forecast, Country , 2016-2032
- 8.7.2.1. Brazil
- 8.7.2.2. Colombia
- 8.7.2.3. Chile
- 8.7.2.4. Argentina
- 8.7.2.5. Costa Rica
- 8.7.2.6. Rest of Latin America
- 9. Middle East & Africa Agricultural Tractors Market Analysis, Opportunity and Forecast, 2016-2032
- 9.1. Middle East & Africa Agricultural Tractors Market Analysis, 2016-2021
- 9.2. Middle East & Africa Agricultural Tractors Market Opportunity and Forecast, 2023-2032
- 9.3. Middle East & Africa Agricultural Tractors Market Analysis, Opportunity and Forecast, By Type, 2016-2032
- 9.3.1. Middle East & Africa Agricultural Tractors Market Analysis by Type: Introduction
- 9.3.2. Market Size Absolute $ Opportunity Analysis and Forecast, By Type, 2016-2032
- 9.3.3. Utility Tractorss
- 9.3.4. Row Crop Tractorss
- 9.3.5. Orchard Type Tractorss
- 9.3.6. Other Types
- 9.4. Middle East & Africa Agricultural Tractors Market Analysis, Opportunity and Forecast, By Power Outlook, 2016-2032
- 9.4.1. Middle East & Africa Agricultural Tractors Market Analysis by Power Outlook: Introduction
- 9.4.2. Market Size Absolute $ Opportunity Analysis and Forecast, By Power Outlook, 2016-2032
- 9.4.3. Less than 40 HP
- 9.4.4. 41 to 100 HP
- 9.4.5. More than 100 HP
- 9.5. Middle East & Africa Agricultural Tractors Market Analysis, Opportunity and Forecast, By Drive Type, 2016-2032
- 9.5.1. Middle East & Africa Agricultural Tractors Market Analysis by Drive Type: Introduction
- 9.5.2. Market Size Absolute $ Opportunity Analysis and Forecast, By Drive Type, 2016-2032
- 9.5.3. 4 Wheel Drive
- 9.5.4. 2 Wheel Drive
- 9.6. Middle East & Africa Agricultural Tractors Market Analysis, Opportunity and Forecast, By Operations , 2016-2032
- 9.6.1. Middle East & Africa Agricultural Tractors Market Analysis by Operations : Introduction
- 9.6.2. Market Size Absolute $ Opportunity Analysis and Forecast, By Operations , 2016-2032
- 9.6.3. Automatic Tractors Vehicle
- 9.6.4. Manual Tractors Vehicle
- 9.7. Middle East & Africa Agricultural Tractors Market Analysis, Opportunity and Forecast, By Country , 2016-2032
- 9.7.1. Middle East & Africa Agricultural Tractors Market Analysis by Country : Introduction
- 9.7.2. Market Size Absolute $ Opportunity Analysis and Forecast, Country , 2016-2032
- 9.7.2.1. Algeria
- 9.7.2.2. Egypt
- 9.7.2.3. Israel
- 9.7.2.4. Kuwait
- 9.7.2.5. Nigeria
- 9.7.2.6. Saudi Arabia
- 9.7.2.7. South Africa
- 9.7.2.8. Turkey
- 9.7.2.9. The UAE
- 9.7.2.10. Rest of MEA
- 10. Global Agricultural Tractors Market Analysis, Opportunity and Forecast, By Region , 2016-2032
- 10.1. Global Agricultural Tractors Market Analysis by Region : Introduction
- 10.2. Market Size Absolute $ Opportunity Analysis and Forecast, By Region , 2016-2032
- 10.2.1. North America
- 10.2.2. Western Europe
- 10.2.3. Eastern Europe
- 10.2.4. APAC
- 10.2.5. Latin America
- 10.2.6. Middle East & Africa
- 11. Global Agricultural Tractors Market Competitive Landscape, Market Share Analysis, and Company Profiles
- 11.1. Market Share Analysis
- 11.2. Company Profiles
- 11.3. Deere & Company
- 11.3.1. Company Overview
- 11.3.2. Financial Highlights
- 11.3.3. Product Portfolio
- 11.3.4. SWOT Analysis
- 11.3.5. Key Strategies and Developments
- 11.4. SAME DEUTZ-FAHR Group
- 11.4.1. Company Overview
- 11.4.2. Financial Highlights
- 11.4.3. Product Portfolio
- 11.4.4. SWOT Analysis
- 11.4.5. Key Strategies and Developments
- 11.5. Kutoba Corporation
- 11.5.1. Company Overview
- 11.5.2. Financial Highlights
- 11.5.3. Product Portfolio
- 11.5.4. SWOT Analysis
- 11.5.5. Key Strategies and Developments
- 11.6. McCormick International
- 11.6.1. Company Overview
- 11.6.2. Financial Highlights
- 11.6.3. Product Portfolio
- 11.6.4. SWOT Analysis
- 11.6.5. Key Strategies and Developments
- 11.7. Mahindra Group
- 11.7.1. Company Overview
- 11.7.2. Financial Highlights
- 11.7.3. Product Portfolio
- 11.7.4. SWOT Analysis
- 11.7.5. Key Strategies and Developments
- 11.8. Yanmar
- 11.8.1. Company Overview
- 11.8.2. Financial Highlights
- 11.8.3. Product Portfolio
- 11.8.4. SWOT Analysis
- 11.8.5. Key Strategies and Developments
- 11.9. Farmtac
- 11.9.1. Company Overview
- 11.9.2. Financial Highlights
- 11.9.3. Product Portfolio
- 11.9.4. SWOT Analysis
- 11.9.5. Key Strategies and Developments
- 11.10. Massey Ferguson
- 11.10.1. Company Overview
- 11.10.2. Financial Highlights
- 11.10.3. Product Portfolio
- 11.10.4. SWOT Analysis
- 11.10.5. Key Strategies and Developments
- 11.11. Escorts Group
- 11.11.1. Company Overview
- 11.11.2. Financial Highlights
- 11.11.3. Product Portfolio
- 11.11.4. SWOT Analysis
- 11.11.5. Key Strategies and Developments
- 11.12. Kubota
- 11.12.1. Company Overview
- 11.12.2. Financial Highlights
- 11.12.3. Product Portfolio
- 11.12.4. SWOT Analysis
- 11.12.5. Key Strategies and Developments
- 11.13. Other Key Players
- 11.13.1. Company Overview
- 11.13.2. Financial Highlights
- 11.13.3. Product Portfolio
- 11.13.4. SWOT Analysis
- 11.13.5. Key Strategies and Developments
- 12. Assumptions and Acronyms
- 13. Research Methodology
- 14. Contact
List of Figures
-
- Figure 1: Global Agricultural Tractors Market Revenue (US$ Mn) Market Share by Type in 2022
- Figure 2: Global Agricultural Tractors Market Attractiveness Analysis by Type, 2016-2032
- Figure 3: Global Agricultural Tractors Market Revenue (US$ Mn) Market Share by Power Outlookin 2022
- Figure 4: Global Agricultural Tractors Market Attractiveness Analysis by Power Outlook, 2016-2032
- Figure 5: Global Agricultural Tractors Market Revenue (US$ Mn) Market Share by Drive Typein 2022
- Figure 6: Global Agricultural Tractors Market Attractiveness Analysis by Drive Type, 2016-2032
- Figure 7: Global Agricultural Tractors Market Revenue (US$ Mn) Market Share by Operations in 2022
- Figure 8: Global Agricultural Tractors Market Attractiveness Analysis by Operations , 2016-2032
- Figure 9: Global Agricultural Tractors Market Revenue (US$ Mn) Market Share by Region in 2022
- Figure 10: Global Agricultural Tractors Market Attractiveness Analysis by Region, 2016-2032
- Figure 11: Global Agricultural Tractors Market Revenue (US$ Mn) (2016-2032)
- Figure 12: Global Agricultural Tractors Market Revenue (US$ Mn) Comparison by Region (2016-2032)
- Figure 13: Global Agricultural Tractors Market Revenue (US$ Mn) Comparison by Type (2016-2032)
- Figure 14: Global Agricultural Tractors Market Revenue (US$ Mn) Comparison by Power Outlook (2016-2032)
- Figure 15: Global Agricultural Tractors Market Revenue (US$ Mn) Comparison by Drive Type (2016-2032)
- Figure 16: Global Agricultural Tractors Market Revenue (US$ Mn) Comparison by Operations (2016-2032)
- Figure 17: Global Agricultural Tractors Market Y-o-Y Growth Rate Comparison by Region (2016-2032)
- Figure 18: Global Agricultural Tractors Market Y-o-Y Growth Rate Comparison by Type (2016-2032)
- Figure 19: Global Agricultural Tractors Market Y-o-Y Growth Rate Comparison by Power Outlook (2016-2032)
- Figure 20: Global Agricultural Tractors Market Y-o-Y Growth Rate Comparison by Drive Type (2016-2032)
- Figure 21: Global Agricultural Tractors Market Y-o-Y Growth Rate Comparison by Operations (2016-2032)
- Figure 22: Global Agricultural Tractors Market Share Comparison by Region (2016-2032)
- Figure 23: Global Agricultural Tractors Market Share Comparison by Type (2016-2032)
- Figure 24: Global Agricultural Tractors Market Share Comparison by Power Outlook (2016-2032)
- Figure 25: Global Agricultural Tractors Market Share Comparison by Drive Type (2016-2032)
- Figure 26: Global Agricultural Tractors Market Share Comparison by Operations (2016-2032)
- Figure 27: North America Agricultural Tractors Market Revenue (US$ Mn) Market Share by Typein 2022
- Figure 28: North America Agricultural Tractors Market Attractiveness Analysis by Type, 2016-2032
- Figure 29: North America Agricultural Tractors Market Revenue (US$ Mn) Market Share by Power Outlookin 2022
- Figure 30: North America Agricultural Tractors Market Attractiveness Analysis by Power Outlook, 2016-2032
- Figure 31: North America Agricultural Tractors Market Revenue (US$ Mn) Market Share by Drive Typein 2022
- Figure 32: North America Agricultural Tractors Market Attractiveness Analysis by Drive Type, 2016-2032
- Figure 33: North America Agricultural Tractors Market Revenue (US$ Mn) Market Share by Operations in 2022
- Figure 34: North America Agricultural Tractors Market Attractiveness Analysis by Operations , 2016-2032
- Figure 35: North America Agricultural Tractors Market Revenue (US$ Mn) Market Share by Country in 2022
- Figure 36: North America Agricultural Tractors Market Attractiveness Analysis by Country, 2016-2032
- Figure 37: North America Agricultural Tractors Market Revenue (US$ Mn) (2016-2032)
- Figure 38: North America Agricultural Tractors Market Revenue (US$ Mn) Comparison by Country (2016-2032)
- Figure 39: North America Agricultural Tractors Market Revenue (US$ Mn) Comparison by Type (2016-2032)
- Figure 40: North America Agricultural Tractors Market Revenue (US$ Mn) Comparison by Power Outlook (2016-2032)
- Figure 41: North America Agricultural Tractors Market Revenue (US$ Mn) Comparison by Drive Type (2016-2032)
- Figure 42: North America Agricultural Tractors Market Revenue (US$ Mn) Comparison by Operations (2016-2032)
- Figure 43: North America Agricultural Tractors Market Y-o-Y Growth Rate Comparison by Country (2016-2032)
- Figure 44: North America Agricultural Tractors Market Y-o-Y Growth Rate Comparison by Type (2016-2032)
- Figure 45: North America Agricultural Tractors Market Y-o-Y Growth Rate Comparison by Power Outlook (2016-2032)
- Figure 46: North America Agricultural Tractors Market Y-o-Y Growth Rate Comparison by Drive Type (2016-2032)
- Figure 47: North America Agricultural Tractors Market Y-o-Y Growth Rate Comparison by Operations (2016-2032)
- Figure 48: North America Agricultural Tractors Market Share Comparison by Country (2016-2032)
- Figure 49: North America Agricultural Tractors Market Share Comparison by Type (2016-2032)
- Figure 50: North America Agricultural Tractors Market Share Comparison by Power Outlook (2016-2032)
- Figure 51: North America Agricultural Tractors Market Share Comparison by Drive Type (2016-2032)
- Figure 52: North America Agricultural Tractors Market Share Comparison by Operations (2016-2032)
- Figure 53: Western Europe Agricultural Tractors Market Revenue (US$ Mn) Market Share by Typein 2022
- Figure 54: Western Europe Agricultural Tractors Market Attractiveness Analysis by Type, 2016-2032
- Figure 55: Western Europe Agricultural Tractors Market Revenue (US$ Mn) Market Share by Power Outlookin 2022
- Figure 56: Western Europe Agricultural Tractors Market Attractiveness Analysis by Power Outlook, 2016-2032
- Figure 57: Western Europe Agricultural Tractors Market Revenue (US$ Mn) Market Share by Drive Typein 2022
- Figure 58: Western Europe Agricultural Tractors Market Attractiveness Analysis by Drive Type, 2016-2032
- Figure 59: Western Europe Agricultural Tractors Market Revenue (US$ Mn) Market Share by Operations in 2022
- Figure 60: Western Europe Agricultural Tractors Market Attractiveness Analysis by Operations , 2016-2032
- Figure 61: Western Europe Agricultural Tractors Market Revenue (US$ Mn) Market Share by Country in 2022
- Figure 62: Western Europe Agricultural Tractors Market Attractiveness Analysis by Country, 2016-2032
- Figure 63: Western Europe Agricultural Tractors Market Revenue (US$ Mn) (2016-2032)
- Figure 64: Western Europe Agricultural Tractors Market Revenue (US$ Mn) Comparison by Country (2016-2032)
- Figure 65: Western Europe Agricultural Tractors Market Revenue (US$ Mn) Comparison by Type (2016-2032)
- Figure 66: Western Europe Agricultural Tractors Market Revenue (US$ Mn) Comparison by Power Outlook (2016-2032)
- Figure 67: Western Europe Agricultural Tractors Market Revenue (US$ Mn) Comparison by Drive Type (2016-2032)
- Figure 68: Western Europe Agricultural Tractors Market Revenue (US$ Mn) Comparison by Operations (2016-2032)
- Figure 69: Western Europe Agricultural Tractors Market Y-o-Y Growth Rate Comparison by Country (2016-2032)
- Figure 70: Western Europe Agricultural Tractors Market Y-o-Y Growth Rate Comparison by Type (2016-2032)
- Figure 71: Western Europe Agricultural Tractors Market Y-o-Y Growth Rate Comparison by Power Outlook (2016-2032)
- Figure 72: Western Europe Agricultural Tractors Market Y-o-Y Growth Rate Comparison by Drive Type (2016-2032)
- Figure 73: Western Europe Agricultural Tractors Market Y-o-Y Growth Rate Comparison by Operations (2016-2032)
- Figure 74: Western Europe Agricultural Tractors Market Share Comparison by Country (2016-2032)
- Figure 75: Western Europe Agricultural Tractors Market Share Comparison by Type (2016-2032)
- Figure 76: Western Europe Agricultural Tractors Market Share Comparison by Power Outlook (2016-2032)
- Figure 77: Western Europe Agricultural Tractors Market Share Comparison by Drive Type (2016-2032)
- Figure 78: Western Europe Agricultural Tractors Market Share Comparison by Operations (2016-2032)
- Figure 79: Eastern Europe Agricultural Tractors Market Revenue (US$ Mn) Market Share by Typein 2022
- Figure 80: Eastern Europe Agricultural Tractors Market Attractiveness Analysis by Type, 2016-2032
- Figure 81: Eastern Europe Agricultural Tractors Market Revenue (US$ Mn) Market Share by Power Outlookin 2022
- Figure 82: Eastern Europe Agricultural Tractors Market Attractiveness Analysis by Power Outlook, 2016-2032
- Figure 83: Eastern Europe Agricultural Tractors Market Revenue (US$ Mn) Market Share by Drive Typein 2022
- Figure 84: Eastern Europe Agricultural Tractors Market Attractiveness Analysis by Drive Type, 2016-2032
- Figure 85: Eastern Europe Agricultural Tractors Market Revenue (US$ Mn) Market Share by Operations in 2022
- Figure 86: Eastern Europe Agricultural Tractors Market Attractiveness Analysis by Operations , 2016-2032
- Figure 87: Eastern Europe Agricultural Tractors Market Revenue (US$ Mn) Market Share by Country in 2022
- Figure 88: Eastern Europe Agricultural Tractors Market Attractiveness Analysis by Country, 2016-2032
- Figure 89: Eastern Europe Agricultural Tractors Market Revenue (US$ Mn) (2016-2032)
- Figure 90: Eastern Europe Agricultural Tractors Market Revenue (US$ Mn) Comparison by Country (2016-2032)
- Figure 91: Eastern Europe Agricultural Tractors Market Revenue (US$ Mn) Comparison by Type (2016-2032)
- Figure 92: Eastern Europe Agricultural Tractors Market Revenue (US$ Mn) Comparison by Power Outlook (2016-2032)
- Figure 93: Eastern Europe Agricultural Tractors Market Revenue (US$ Mn) Comparison by Drive Type (2016-2032)
- Figure 94: Eastern Europe Agricultural Tractors Market Revenue (US$ Mn) Comparison by Operations (2016-2032)
- Figure 95: Eastern Europe Agricultural Tractors Market Y-o-Y Growth Rate Comparison by Country (2016-2032)
- Figure 96: Eastern Europe Agricultural Tractors Market Y-o-Y Growth Rate Comparison by Type (2016-2032)
- Figure 97: Eastern Europe Agricultural Tractors Market Y-o-Y Growth Rate Comparison by Power Outlook (2016-2032)
- Figure 98: Eastern Europe Agricultural Tractors Market Y-o-Y Growth Rate Comparison by Drive Type (2016-2032)
- Figure 99: Eastern Europe Agricultural Tractors Market Y-o-Y Growth Rate Comparison by Operations (2016-2032)
- Figure 100: Eastern Europe Agricultural Tractors Market Share Comparison by Country (2016-2032)
- Figure 101: Eastern Europe Agricultural Tractors Market Share Comparison by Type (2016-2032)
- Figure 102: Eastern Europe Agricultural Tractors Market Share Comparison by Power Outlook (2016-2032)
- Figure 103: Eastern Europe Agricultural Tractors Market Share Comparison by Drive Type (2016-2032)
- Figure 104: Eastern Europe Agricultural Tractors Market Share Comparison by Operations (2016-2032)
- Figure 105: APAC Agricultural Tractors Market Revenue (US$ Mn) Market Share by Typein 2022
- Figure 106: APAC Agricultural Tractors Market Attractiveness Analysis by Type, 2016-2032
- Figure 107: APAC Agricultural Tractors Market Revenue (US$ Mn) Market Share by Power Outlookin 2022
- Figure 108: APAC Agricultural Tractors Market Attractiveness Analysis by Power Outlook, 2016-2032
- Figure 109: APAC Agricultural Tractors Market Revenue (US$ Mn) Market Share by Drive Typein 2022
- Figure 110: APAC Agricultural Tractors Market Attractiveness Analysis by Drive Type, 2016-2032
- Figure 111: APAC Agricultural Tractors Market Revenue (US$ Mn) Market Share by Operations in 2022
- Figure 112: APAC Agricultural Tractors Market Attractiveness Analysis by Operations , 2016-2032
- Figure 113: APAC Agricultural Tractors Market Revenue (US$ Mn) Market Share by Country in 2022
- Figure 114: APAC Agricultural Tractors Market Attractiveness Analysis by Country, 2016-2032
- Figure 115: APAC Agricultural Tractors Market Revenue (US$ Mn) (2016-2032)
- Figure 116: APAC Agricultural Tractors Market Revenue (US$ Mn) Comparison by Country (2016-2032)
- Figure 117: APAC Agricultural Tractors Market Revenue (US$ Mn) Comparison by Type (2016-2032)
- Figure 118: APAC Agricultural Tractors Market Revenue (US$ Mn) Comparison by Power Outlook (2016-2032)
- Figure 119: APAC Agricultural Tractors Market Revenue (US$ Mn) Comparison by Drive Type (2016-2032)
- Figure 120: APAC Agricultural Tractors Market Revenue (US$ Mn) Comparison by Operations (2016-2032)
- Figure 121: APAC Agricultural Tractors Market Y-o-Y Growth Rate Comparison by Country (2016-2032)
- Figure 122: APAC Agricultural Tractors Market Y-o-Y Growth Rate Comparison by Type (2016-2032)
- Figure 123: APAC Agricultural Tractors Market Y-o-Y Growth Rate Comparison by Power Outlook (2016-2032)
- Figure 124: APAC Agricultural Tractors Market Y-o-Y Growth Rate Comparison by Drive Type (2016-2032)
- Figure 125: APAC Agricultural Tractors Market Y-o-Y Growth Rate Comparison by Operations (2016-2032)
- Figure 126: APAC Agricultural Tractors Market Share Comparison by Country (2016-2032)
- Figure 127: APAC Agricultural Tractors Market Share Comparison by Type (2016-2032)
- Figure 128: APAC Agricultural Tractors Market Share Comparison by Power Outlook (2016-2032)
- Figure 129: APAC Agricultural Tractors Market Share Comparison by Drive Type (2016-2032)
- Figure 130: APAC Agricultural Tractors Market Share Comparison by Operations (2016-2032)
- Figure 131: Latin America Agricultural Tractors Market Revenue (US$ Mn) Market Share by Typein 2022
- Figure 132: Latin America Agricultural Tractors Market Attractiveness Analysis by Type, 2016-2032
- Figure 133: Latin America Agricultural Tractors Market Revenue (US$ Mn) Market Share by Power Outlookin 2022
- Figure 134: Latin America Agricultural Tractors Market Attractiveness Analysis by Power Outlook, 2016-2032
- Figure 135: Latin America Agricultural Tractors Market Revenue (US$ Mn) Market Share by Drive Typein 2022
- Figure 136: Latin America Agricultural Tractors Market Attractiveness Analysis by Drive Type, 2016-2032
- Figure 137: Latin America Agricultural Tractors Market Revenue (US$ Mn) Market Share by Operations in 2022
- Figure 138: Latin America Agricultural Tractors Market Attractiveness Analysis by Operations , 2016-2032
- Figure 139: Latin America Agricultural Tractors Market Revenue (US$ Mn) Market Share by Country in 2022
- Figure 140: Latin America Agricultural Tractors Market Attractiveness Analysis by Country, 2016-2032
- Figure 141: Latin America Agricultural Tractors Market Revenue (US$ Mn) (2016-2032)
- Figure 142: Latin America Agricultural Tractors Market Revenue (US$ Mn) Comparison by Country (2016-2032)
- Figure 143: Latin America Agricultural Tractors Market Revenue (US$ Mn) Comparison by Type (2016-2032)
- Figure 144: Latin America Agricultural Tractors Market Revenue (US$ Mn) Comparison by Power Outlook (2016-2032)
- Figure 145: Latin America Agricultural Tractors Market Revenue (US$ Mn) Comparison by Drive Type (2016-2032)
- Figure 146: Latin America Agricultural Tractors Market Revenue (US$ Mn) Comparison by Operations (2016-2032)
- Figure 147: Latin America Agricultural Tractors Market Y-o-Y Growth Rate Comparison by Country (2016-2032)
- Figure 148: Latin America Agricultural Tractors Market Y-o-Y Growth Rate Comparison by Type (2016-2032)
- Figure 149: Latin America Agricultural Tractors Market Y-o-Y Growth Rate Comparison by Power Outlook (2016-2032)
- Figure 150: Latin America Agricultural Tractors Market Y-o-Y Growth Rate Comparison by Drive Type (2016-2032)
- Figure 151: Latin America Agricultural Tractors Market Y-o-Y Growth Rate Comparison by Operations (2016-2032)
- Figure 152: Latin America Agricultural Tractors Market Share Comparison by Country (2016-2032)
- Figure 153: Latin America Agricultural Tractors Market Share Comparison by Type (2016-2032)
- Figure 154: Latin America Agricultural Tractors Market Share Comparison by Power Outlook (2016-2032)
- Figure 155: Latin America Agricultural Tractors Market Share Comparison by Drive Type (2016-2032)
- Figure 156: Latin America Agricultural Tractors Market Share Comparison by Operations (2016-2032)
- Figure 157: Middle East & Africa Agricultural Tractors Market Revenue (US$ Mn) Market Share by Typein 2022
- Figure 158: Middle East & Africa Agricultural Tractors Market Attractiveness Analysis by Type, 2016-2032
- Figure 159: Middle East & Africa Agricultural Tractors Market Revenue (US$ Mn) Market Share by Power Outlookin 2022
- Figure 160: Middle East & Africa Agricultural Tractors Market Attractiveness Analysis by Power Outlook, 2016-2032
- Figure 161: Middle East & Africa Agricultural Tractors Market Revenue (US$ Mn) Market Share by Drive Typein 2022
- Figure 162: Middle East & Africa Agricultural Tractors Market Attractiveness Analysis by Drive Type, 2016-2032
- Figure 163: Middle East & Africa Agricultural Tractors Market Revenue (US$ Mn) Market Share by Operations in 2022
- Figure 164: Middle East & Africa Agricultural Tractors Market Attractiveness Analysis by Operations , 2016-2032
- Figure 165: Middle East & Africa Agricultural Tractors Market Revenue (US$ Mn) Market Share by Country in 2022
- Figure 166: Middle East & Africa Agricultural Tractors Market Attractiveness Analysis by Country, 2016-2032
- Figure 167: Middle East & Africa Agricultural Tractors Market Revenue (US$ Mn) (2016-2032)
- Figure 168: Middle East & Africa Agricultural Tractors Market Revenue (US$ Mn) Comparison by Country (2016-2032)
- Figure 169: Middle East & Africa Agricultural Tractors Market Revenue (US$ Mn) Comparison by Type (2016-2032)
- Figure 170: Middle East & Africa Agricultural Tractors Market Revenue (US$ Mn) Comparison by Power Outlook (2016-2032)
- Figure 171: Middle East & Africa Agricultural Tractors Market Revenue (US$ Mn) Comparison by Drive Type (2016-2032)
- Figure 172: Middle East & Africa Agricultural Tractors Market Revenue (US$ Mn) Comparison by Operations (2016-2032)
- Figure 173: Middle East & Africa Agricultural Tractors Market Y-o-Y Growth Rate Comparison by Country (2016-2032)
- Figure 174: Middle East & Africa Agricultural Tractors Market Y-o-Y Growth Rate Comparison by Type (2016-2032)
- Figure 175: Middle East & Africa Agricultural Tractors Market Y-o-Y Growth Rate Comparison by Power Outlook (2016-2032)
- Figure 176: Middle East & Africa Agricultural Tractors Market Y-o-Y Growth Rate Comparison by Drive Type (2016-2032)
- Figure 177: Middle East & Africa Agricultural Tractors Market Y-o-Y Growth Rate Comparison by Operations (2016-2032)
- Figure 178: Middle East & Africa Agricultural Tractors Market Share Comparison by Country (2016-2032)
- Figure 179: Middle East & Africa Agricultural Tractors Market Share Comparison by Type (2016-2032)
- Figure 180: Middle East & Africa Agricultural Tractors Market Share Comparison by Power Outlook (2016-2032)
- Figure 181: Middle East & Africa Agricultural Tractors Market Share Comparison by Drive Type (2016-2032)
- Figure 182: Middle East & Africa Agricultural Tractors Market Share Comparison by Operations (2016-2032)
List of Tables
- Table 1: Global Agricultural Tractors Market Comparison by Type (2016-2032)
- Table 2: Global Agricultural Tractors Market Comparison by Power Outlook (2016-2032)
- Table 3: Global Agricultural Tractors Market Comparison by Drive Type (2016-2032)
- Table 4: Global Agricultural Tractors Market Comparison by Operations (2016-2032)
- Table 5: Global Agricultural Tractors Market Revenue (US$ Mn) Comparison by Region (2016-2032)
- Table 6: Global Agricultural Tractors Market Revenue (US$ Mn) (2016-2032)
- Table 7: Global Agricultural Tractors Market Revenue (US$ Mn) Comparison by Region (2016-2032)
- Table 8: Global Agricultural Tractors Market Revenue (US$ Mn) Comparison by Type (2016-2032)
- Table 9: Global Agricultural Tractors Market Revenue (US$ Mn) Comparison by Power Outlook (2016-2032)
- Table 10: Global Agricultural Tractors Market Revenue (US$ Mn) Comparison by Drive Type (2016-2032)
- Table 11: Global Agricultural Tractors Market Revenue (US$ Mn) Comparison by Operations (2016-2032)
- Table 12: Global Agricultural Tractors Market Y-o-Y Growth Rate Comparison by Region (2016-2032)
- Table 13: Global Agricultural Tractors Market Y-o-Y Growth Rate Comparison by Type (2016-2032)
- Table 14: Global Agricultural Tractors Market Y-o-Y Growth Rate Comparison by Power Outlook (2016-2032)
- Table 15: Global Agricultural Tractors Market Y-o-Y Growth Rate Comparison by Drive Type (2016-2032)
- Table 16: Global Agricultural Tractors Market Y-o-Y Growth Rate Comparison by Operations (2016-2032)
- Table 17: Global Agricultural Tractors Market Share Comparison by Region (2016-2032)
- Table 18: Global Agricultural Tractors Market Share Comparison by Type (2016-2032)
- Table 19: Global Agricultural Tractors Market Share Comparison by Power Outlook (2016-2032)
- Table 20: Global Agricultural Tractors Market Share Comparison by Drive Type (2016-2032)
- Table 21: Global Agricultural Tractors Market Share Comparison by Operations (2016-2032)
- Table 22: North America Agricultural Tractors Market Comparison by Power Outlook (2016-2032)
- Table 23: North America Agricultural Tractors Market Comparison by Drive Type (2016-2032)
- Table 24: North America Agricultural Tractors Market Comparison by Operations (2016-2032)
- Table 25: North America Agricultural Tractors Market Revenue (US$ Mn) Comparison by Country (2016-2032)
- Table 26: North America Agricultural Tractors Market Revenue (US$ Mn) (2016-2032)
- Table 27: North America Agricultural Tractors Market Revenue (US$ Mn) Comparison by Country (2016-2032)
- Table 28: North America Agricultural Tractors Market Revenue (US$ Mn) Comparison by Type (2016-2032)
- Table 29: North America Agricultural Tractors Market Revenue (US$ Mn) Comparison by Power Outlook (2016-2032)
- Table 30: North America Agricultural Tractors Market Revenue (US$ Mn) Comparison by Drive Type (2016-2032)
- Table 31: North America Agricultural Tractors Market Revenue (US$ Mn) Comparison by Operations (2016-2032)
- Table 32: North America Agricultural Tractors Market Y-o-Y Growth Rate Comparison by Country (2016-2032)
- Table 33: North America Agricultural Tractors Market Y-o-Y Growth Rate Comparison by Type (2016-2032)
- Table 34: North America Agricultural Tractors Market Y-o-Y Growth Rate Comparison by Power Outlook (2016-2032)
- Table 35: North America Agricultural Tractors Market Y-o-Y Growth Rate Comparison by Drive Type (2016-2032)
- Table 36: North America Agricultural Tractors Market Y-o-Y Growth Rate Comparison by Operations (2016-2032)
- Table 37: North America Agricultural Tractors Market Share Comparison by Country (2016-2032)
- Table 38: North America Agricultural Tractors Market Share Comparison by Type (2016-2032)
- Table 39: North America Agricultural Tractors Market Share Comparison by Power Outlook (2016-2032)
- Table 40: North America Agricultural Tractors Market Share Comparison by Drive Type (2016-2032)
- Table 41: North America Agricultural Tractors Market Share Comparison by Operations (2016-2032)
- Table 42: Western Europe Agricultural Tractors Market Comparison by Type (2016-2032)
- Table 43: Western Europe Agricultural Tractors Market Comparison by Power Outlook (2016-2032)
- Table 44: Western Europe Agricultural Tractors Market Comparison by Drive Type (2016-2032)
- Table 45: Western Europe Agricultural Tractors Market Comparison by Operations (2016-2032)
- Table 46: Western Europe Agricultural Tractors Market Revenue (US$ Mn) Comparison by Country (2016-2032)
- Table 47: Western Europe Agricultural Tractors Market Revenue (US$ Mn) (2016-2032)
- Table 48: Western Europe Agricultural Tractors Market Revenue (US$ Mn) Comparison by Country (2016-2032)
- Table 49: Western Europe Agricultural Tractors Market Revenue (US$ Mn) Comparison by Type (2016-2032)
- Table 50: Western Europe Agricultural Tractors Market Revenue (US$ Mn) Comparison by Power Outlook (2016-2032)
- Table 51: Western Europe Agricultural Tractors Market Revenue (US$ Mn) Comparison by Drive Type (2016-2032)
- Table 52: Western Europe Agricultural Tractors Market Revenue (US$ Mn) Comparison by Operations (2016-2032)
- Table 53: Western Europe Agricultural Tractors Market Y-o-Y Growth Rate Comparison by Country (2016-2032)
- Table 54: Western Europe Agricultural Tractors Market Y-o-Y Growth Rate Comparison by Type (2016-2032)
- Table 55: Western Europe Agricultural Tractors Market Y-o-Y Growth Rate Comparison by Power Outlook (2016-2032)
- Table 56: Western Europe Agricultural Tractors Market Y-o-Y Growth Rate Comparison by Drive Type (2016-2032)
- Table 57: Western Europe Agricultural Tractors Market Y-o-Y Growth Rate Comparison by Operations (2016-2032)
- Table 58: Western Europe Agricultural Tractors Market Share Comparison by Country (2016-2032)
- Table 59: Western Europe Agricultural Tractors Market Share Comparison by Type (2016-2032)
- Table 60: Western Europe Agricultural Tractors Market Share Comparison by Power Outlook (2016-2032)
- Table 61: Western Europe Agricultural Tractors Market Share Comparison by Drive Type (2016-2032)
- Table 62: Western Europe Agricultural Tractors Market Share Comparison by Operations (2016-2032)
- Table 63: Eastern Europe Agricultural Tractors Market Comparison by Type (2016-2032)
- Table 64: Eastern Europe Agricultural Tractors Market Comparison by Power Outlook (2016-2032)
- Table 65: Eastern Europe Agricultural Tractors Market Comparison by Drive Type (2016-2032)
- Table 66: Eastern Europe Agricultural Tractors Market Comparison by Operations (2016-2032)
- Table 67: Eastern Europe Agricultural Tractors Market Revenue (US$ Mn) Comparison by Country (2016-2032)
- Table 68: Eastern Europe Agricultural Tractors Market Revenue (US$ Mn) (2016-2032)
- Table 69: Eastern Europe Agricultural Tractors Market Revenue (US$ Mn) Comparison by Country (2016-2032)
- Table 70: Eastern Europe Agricultural Tractors Market Revenue (US$ Mn) Comparison by Type (2016-2032)
- Table 71: Eastern Europe Agricultural Tractors Market Revenue (US$ Mn) Comparison by Power Outlook (2016-2032)
- Table 72: Eastern Europe Agricultural Tractors Market Revenue (US$ Mn) Comparison by Drive Type (2016-2032)
- Table 73: Eastern Europe Agricultural Tractors Market Revenue (US$ Mn) Comparison by Operations (2016-2032)
- Table 74: Eastern Europe Agricultural Tractors Market Y-o-Y Growth Rate Comparison by Country (2016-2032)
- Table 75: Eastern Europe Agricultural Tractors Market Y-o-Y Growth Rate Comparison by Type (2016-2032)
- Table 76: Eastern Europe Agricultural Tractors Market Y-o-Y Growth Rate Comparison by Power Outlook (2016-2032)
- Table 77: Eastern Europe Agricultural Tractors Market Y-o-Y Growth Rate Comparison by Drive Type (2016-2032)
- Table 78: Eastern Europe Agricultural Tractors Market Y-o-Y Growth Rate Comparison by Operations (2016-2032)
- Table 79: Eastern Europe Agricultural Tractors Market Share Comparison by Country (2016-2032)
- Table 80: Eastern Europe Agricultural Tractors Market Share Comparison by Type (2016-2032)
- Table 81: Eastern Europe Agricultural Tractors Market Share Comparison by Power Outlook (2016-2032)
- Table 82: Eastern Europe Agricultural Tractors Market Share Comparison by Drive Type (2016-2032)
- Table 83: Eastern Europe Agricultural Tractors Market Share Comparison by Operations (2016-2032)
- Table 84: APAC Agricultural Tractors Market Comparison by Type (2016-2032)
- Table 85: APAC Agricultural Tractors Market Comparison by Power Outlook (2016-2032)
- Table 86: APAC Agricultural Tractors Market Comparison by Drive Type (2016-2032)
- Table 87: APAC Agricultural Tractors Market Comparison by Operations (2016-2032)
- Table 88: APAC Agricultural Tractors Market Revenue (US$ Mn) Comparison by Country (2016-2032)
- Table 89: APAC Agricultural Tractors Market Revenue (US$ Mn) (2016-2032)
- Table 90: APAC Agricultural Tractors Market Revenue (US$ Mn) Comparison by Country (2016-2032)
- Table 91: APAC Agricultural Tractors Market Revenue (US$ Mn) Comparison by Type (2016-2032)
- Table 92: APAC Agricultural Tractors Market Revenue (US$ Mn) Comparison by Power Outlook (2016-2032)
- Table 93: APAC Agricultural Tractors Market Revenue (US$ Mn) Comparison by Drive Type (2016-2032)
- Table 94: APAC Agricultural Tractors Market Revenue (US$ Mn) Comparison by Operations (2016-2032)
- Table 95: APAC Agricultural Tractors Market Y-o-Y Growth Rate Comparison by Country (2016-2032)
- Table 96: APAC Agricultural Tractors Market Y-o-Y Growth Rate Comparison by Type (2016-2032)
- Table 97: APAC Agricultural Tractors Market Y-o-Y Growth Rate Comparison by Power Outlook (2016-2032)
- Table 98: APAC Agricultural Tractors Market Y-o-Y Growth Rate Comparison by Drive Type (2016-2032)
- Table 99: APAC Agricultural Tractors Market Y-o-Y Growth Rate Comparison by Operations (2016-2032)
- Table 100: APAC Agricultural Tractors Market Share Comparison by Country (2016-2032)
- Table 101: APAC Agricultural Tractors Market Share Comparison by Type (2016-2032)
- Table 102: APAC Agricultural Tractors Market Share Comparison by Power Outlook (2016-2032)
- Table 103: APAC Agricultural Tractors Market Share Comparison by Drive Type (2016-2032)
- Table 104: APAC Agricultural Tractors Market Share Comparison by Operations (2016-2032)
- Table 105: Latin America Agricultural Tractors Market Comparison by Type (2016-2032)
- Table 106: Latin America Agricultural Tractors Market Comparison by Power Outlook (2016-2032)
- Table 107: Latin America Agricultural Tractors Market Comparison by Drive Type (2016-2032)
- Table 108: Latin America Agricultural Tractors Market Comparison by Operations (2016-2032)
- Table 109: Latin America Agricultural Tractors Market Revenue (US$ Mn) Comparison by Country (2016-2032)
- Table 110: Latin America Agricultural Tractors Market Revenue (US$ Mn) (2016-2032)
- Table 111: Latin America Agricultural Tractors Market Revenue (US$ Mn) Comparison by Country (2016-2032)
- Table 112: Latin America Agricultural Tractors Market Revenue (US$ Mn) Comparison by Type (2016-2032)
- Table 113: Latin America Agricultural Tractors Market Revenue (US$ Mn) Comparison by Power Outlook (2016-2032)
- Table 114: Latin America Agricultural Tractors Market Revenue (US$ Mn) Comparison by Drive Type (2016-2032)
- Table 115: Latin America Agricultural Tractors Market Revenue (US$ Mn) Comparison by Operations (2016-2032)
- Table 116: Latin America Agricultural Tractors Market Y-o-Y Growth Rate Comparison by Country (2016-2032)
- Table 117: Latin America Agricultural Tractors Market Y-o-Y Growth Rate Comparison by Type (2016-2032)
- Table 118: Latin America Agricultural Tractors Market Y-o-Y Growth Rate Comparison by Power Outlook (2016-2032)
- Table 119: Latin America Agricultural Tractors Market Y-o-Y Growth Rate Comparison by Drive Type (2016-2032)
- Table 120: Latin America Agricultural Tractors Market Y-o-Y Growth Rate Comparison by Operations (2016-2032)
- Table 121: Latin America Agricultural Tractors Market Share Comparison by Country (2016-2032)
- Table 122: Latin America Agricultural Tractors Market Share Comparison by Type (2016-2032)
- Table 123: Latin America Agricultural Tractors Market Share Comparison by Power Outlook (2016-2032)
- Table 124: Latin America Agricultural Tractors Market Share Comparison by Drive Type (2016-2032)
- Table 125: Latin America Agricultural Tractors Market Share Comparison by Operations (2016-2032)
- Table 126: Middle East & Africa Agricultural Tractors Market Comparison by Type (2016-2032)
- Table 127: Middle East & Africa Agricultural Tractors Market Comparison by Power Outlook (2016-2032)
- Table 128: Middle East & Africa Agricultural Tractors Market Comparison by Drive Type (2016-2032)
- Table 129: Middle East & Africa Agricultural Tractors Market Comparison by Operations (2016-2032)
- Table 130: Middle East & Africa Agricultural Tractors Market Revenue (US$ Mn) Comparison by Country (2016-2032)
- Table 131: Middle East & Africa Agricultural Tractors Market Revenue (US$ Mn) (2016-2032)
- Table 132: Middle East & Africa Agricultural Tractors Market Revenue (US$ Mn) Comparison by Country (2016-2032)
- Table 133: Middle East & Africa Agricultural Tractors Market Revenue (US$ Mn) Comparison by Type (2016-2032)
- Table 134: Middle East & Africa Agricultural Tractors Market Revenue (US$ Mn) Comparison by Power Outlook (2016-2032)
- Table 135: Middle East & Africa Agricultural Tractors Market Revenue (US$ Mn) Comparison by Drive Type (2016-2032)
- Table 136: Middle East & Africa Agricultural Tractors Market Revenue (US$ Mn) Comparison by Operations (2016-2032)
- Table 137: Middle East & Africa Agricultural Tractors Market Y-o-Y Growth Rate Comparison by Country (2016-2032)
- Table 138: Middle East & Africa Agricultural Tractors Market Y-o-Y Growth Rate Comparison by Type (2016-2032)
- Table 139: Middle East & Africa Agricultural Tractors Market Y-o-Y Growth Rate Comparison by Power Outlook (2016-2032)
- Table 140: Middle East & Africa Agricultural Tractors Market Y-o-Y Growth Rate Comparison by Drive Type (2016-2032)
- Table 141: Middle East & Africa Agricultural Tractors Market Y-o-Y Growth Rate Comparison by Operations (2016-2032)
- Table 142: Middle East & Africa Agricultural Tractors Market Share Comparison by Country (2016-2032)
- Table 143: Middle East & Africa Agricultural Tractors Market Share Comparison by Type (2016-2032)
- Table 144: Middle East & Africa Agricultural Tractors Market Share Comparison by Power Outlook (2016-2032)
- Table 145: Middle East & Africa Agricultural Tractors Market Share Comparison by Drive Type (2016-2032)
- Table 146: Middle East & Africa Agricultural Tractors Market Share Comparison by Operations (2016-2032)
- 1. Executive Summary
-
- Deere & Company
- SAME DEUTZ-FAHR Group
- Kutoba Corporation
- McCormick International
- Mahindra Group
- Yanmar
- Farmtac
- Massey Ferguson
- Escorts Group
- Kubota
- Other Key Players
Our Clients


View Our Licence Options
