Agricultural Inoculants Market By Function (Crop Nutrition, Crop Protection), By Microorganism (Bacteria, Fungi, Other Microorganisms), By Mode of Application (Seed Inoculation, Soil Inoculation), By Crop Type (Grains, Cereals, Pulses, Oilseeds, Commercial Crops, Fruits and Vegetables, Other Crop Types), By Region And Companies - Industry Segment Outlook, Market Assessment, Competition Scenario, Trends, And Forecast 2024-2033
-
47606
-
June 2024
-
300
-


-
This report was compiled by Shreyas Rokade Shreyas Rokade is a seasoned Research Analyst with CMFE, bringing extensive expertise in market research and consulting, with a strong background in Chemical Engineering. Correspondence Team Lead-CMFE Linkedin | Detailed Market research Methodology Our methodology involves a mix of primary research, including interviews with leading mental health experts, and secondary research from reputable medical journals and databases. View Detailed Methodology Page
-
Quick Navigation
Report Overview
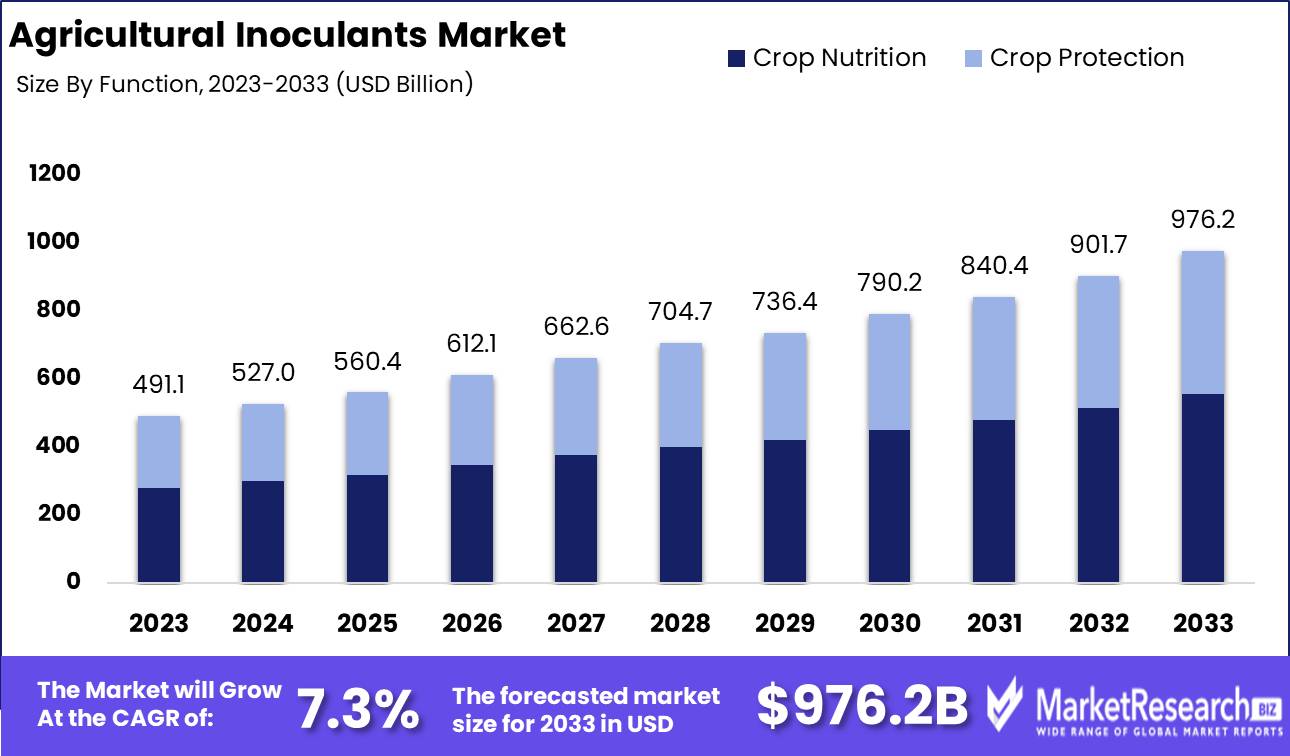
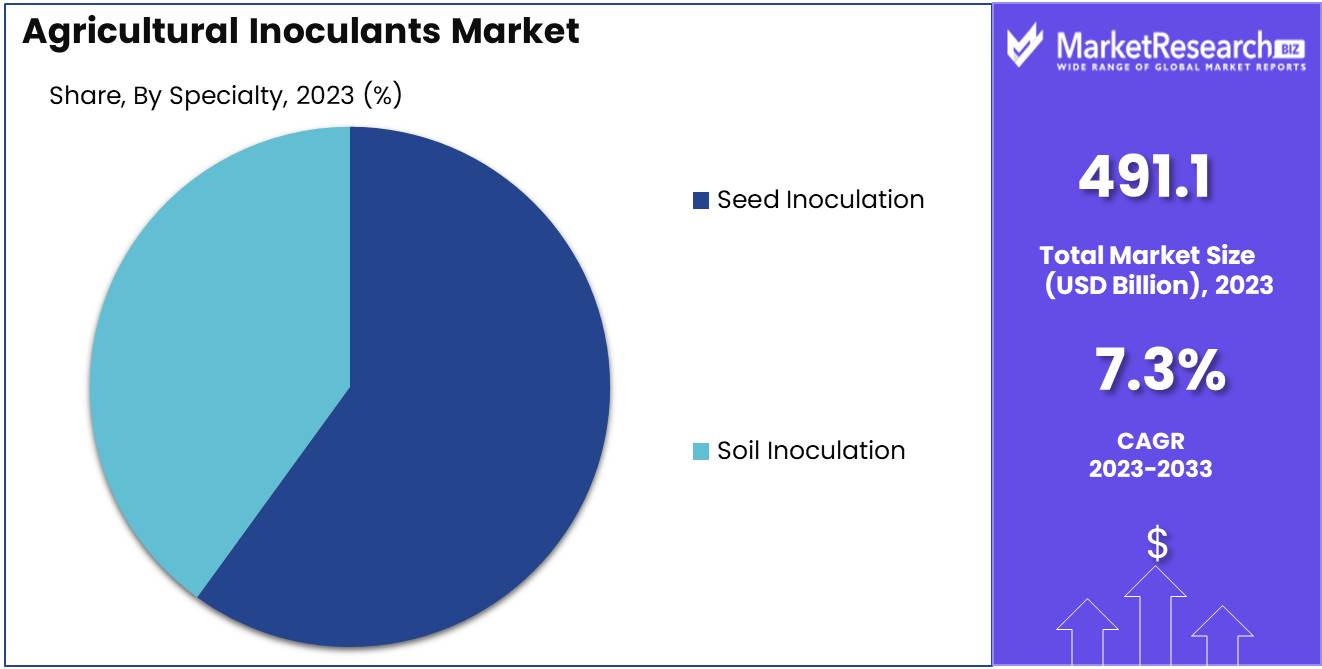
The Agricultural Inoculants Market was valued at USD 491.1 Billion in 2023. It is expected to reach USD 976.2 Billion by 2033, with a CAGR of 7.3% during the forecast period from 2024 to 2033.
The Agricultural Inoculants Market encompasses the industry focused on the production and distribution of biological substances that enhance the growth and health of crops by promoting beneficial microbial activity. These inoculants, often comprising bacteria, fungi, or other microorganisms, are applied to seeds, soil, or plants to improve nutrient uptake, enhance resistance to pests and diseases, and promote sustainable agricultural practices.
The agricultural inoculants market is poised for significant growth, driven by the increasing preference for organic products among consumers. This shift towards natural and environmentally friendly agricultural inputs underscores the rising demand for inoculants, which enhance soil fertility and plant health without the adverse environmental impacts associated with chemical fertilizers. The market is benefiting from heightened awareness and regulatory support for sustainable farming practices, propelling the adoption of microbial inoculants.
However, despite these favorable trends, the industry faces notable challenges, particularly concerning product stability. Ensuring the stability and viability of microbial inoculants during storage and application remains a technical hurdle that manufacturers must overcome to maintain efficacy and farmer trust.
Innovation in product development is anticipated to be a critical driver of market growth. Enhanced formulations and advanced delivery systems are at the forefront of addressing current challenges, offering improved stability and efficiency of inoculants. These innovations not only improve product performance but also expand the applicability of inoculants across diverse agricultural settings. As companies invest in research and development, we expect to see a proliferation of sophisticated inoculant solutions that cater to the nuanced needs of modern agriculture. This technological advancement, coupled with the growing demand for organic farming solutions, positions the agricultural inoculants market for robust growth, shaping the future of sustainable agriculture.
Key Takeaways
- Market Growth: The Agricultural Inoculants Market was valued at USD 491.1 Billion in 2023. It is expected to reach USD 976.2 Billion by 2033, with a CAGR of 7.3% during the forecast period from 2024 to 2033.
- By Function: Crop Nutrition dominated the Agricultural Inoculants Market, emphasizing sustainability.
- By Microorganism: Bacteria dominated the Agricultural Inoculants Market for their efficacy.
- By Mode of Application: Seed Inoculation dominated the agricultural inoculants market by application.
- By Crop Type: Grains dominated the agricultural inoculants market by crop type.
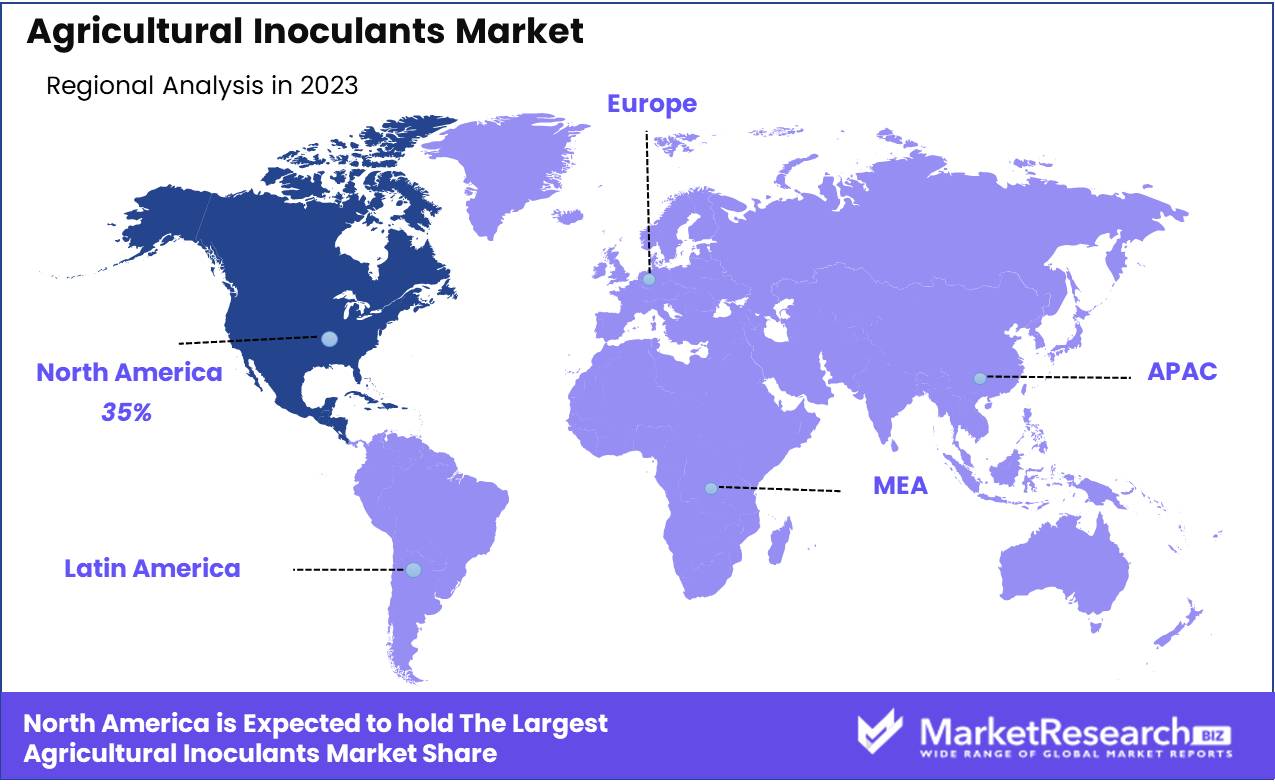
- Regional Dominance: North America leads the Agricultural Inoculants Market with a 35% share.
- Growth Opportunity: The global agricultural inoculants market is poised for growth driven by soil health awareness and biofertilizer demand.
Driving factors
Adoption of Organic and Eco-Friendly Farming Practices: Catalyst for Agricultural Inoculants Market Expansion
The shift towards organic and eco-friendly farming practices is a significant driver for the agricultural inoculants market. As consumers and regulatory bodies increasingly prioritize sustainability and environmental health, farmers are adopting practices that reduce chemical usage and enhance soil health. Agricultural inoculants, which include beneficial microorganisms like bacteria, fungi, and algae, play a critical role in organic farming by improving nutrient uptake, promoting plant growth, and enhancing soil fertility. These inoculants provide a natural alternative to synthetic fertilizers and pesticides, aligning perfectly with the principles of organic farming. Consequently, the demand for these biological solutions is surging, contributing to the robust growth of the agricultural inoculants market.
Declining Area of Arable Land and Rising Food Security Concerns: Driving Efficiency and Yield Enhancement
The global decline in arable land, coupled with increasing food security concerns, underscores the need for more efficient and sustainable agricultural practices. As urbanization and industrialization encroach on farmland, the agricultural sector faces the challenge of producing more food on less land. Agricultural inoculants offer a solution by enhances plant health and productivity without the environmental drawbacks of traditional agrochemicals.
For instance, inoculants that fix atmospheric nitrogen or solubilize phosphorus can significantly boost crop yields and improve soil health, thus making more efficient use of limited arable land. This efficiency is crucial in addressing food security, as it allows for higher output and resilience in agricultural systems. The heightened focus on food security is therefore driving the adoption of inoculants, supporting market growth.
Increased Demand for Organic Food Products: Bolstering Market Demand for Inoculants
The rising consumer preference for organic food products is another pivotal factor propelling the agricultural inoculants market. Organic food sales have been on an upward trajectory, driven by increasing awareness of health benefits, environmental sustainability, and food safety. This demand translates into greater adoption of organic farming practices, which rely heavily on biological inputs such as inoculants to maintain soil fertility and plant health without synthetic chemicals. The growth in the organic food market directly stimulates the demand for agricultural inoculants, as farmers seek to meet consumer expectations while adhering to organic farming standards. This trend not only boosts market growth but also encourages innovation and the development of new inoculant products tailored to the needs of organic agriculture.
Restraining Factors
Limited Awareness Curtails Market Penetration and Adoption Rates in the Agricultural Inoculants Sector
One of the primary restraining factors affecting the growth of the agricultural inoculants market is the limited awareness among farmers and agricultural stakeholders. Despite the numerous benefits that inoculants offer, including enhanced nutrient uptake and improved crop yields, many farmers remain unaware of these advantages. This lack of awareness is particularly prevalent in developing regions where educational outreach and access to information are less robust.
A study by the Food and Agriculture Organization (FAO) indicates that less than 20% of farmers in emerging economies are familiar with the concept and application of agricultural inoculants. This information gap results in a slower adoption rate, as farmers continue to rely on traditional methods that they are more familiar with. Additionally, even in developed regions, the penetration of these advanced agricultural inputs remains lower than potential due to insufficient extension services and educational programs that can effectively communicate the benefits of inoculants.
High Demand for Conventional Products Hinders Shift Towards Innovative Agricultural Solutions
The agricultural sector has long been dominated by conventional products such as chemical fertilizers and pesticides. The high demand for these traditional inputs presents a significant barrier to the growth of the agricultural inoculants market. Farmers, particularly those with established practices, often show reluctance to switch to new products due to perceived risks and the costs associated with changing their farming systems.
Statistical data from market research indicates that conventional products still account for approximately 70-80% of the total agricultural inputs market. This dominance is fueled by the familiarity, proven efficacy, and extensive distribution networks of conventional products. In contrast, agricultural inoculants, despite their long-term benefits and environmental advantages, struggle to gain a foothold in this highly competitive market landscape.
By Function Analysis
In 2023, Crop Nutrition dominated the Agricultural Inoculants Market, emphasizing sustainability.
In 2023, Crop Nutrition held a dominant market position in the By Function segment of the Agricultural Inoculants Market. This predominance is attributed to the growing emphasis on sustainable agriculture practices and the increasing demand for enhanced crop yields. Agricultural inoculants, particularly those focused on crop nutrition, play a crucial role in improving soil health and nutrient availability, leading to more robust plant growth and higher productivity. These inoculants, including biofertilizers and plant growth-promoting bacteria, have gained traction due to their ability to reduce dependency on chemical fertilizers, aligning with global sustainability goals.
On the other hand, Crop Protection, the secondary sub-segment, has also seen significant growth driven by the rising need to combat plant diseases and pests. Agricultural inoculants in this category, such as biopesticides and antagonistic microorganisms, provide an eco-friendly alternative to synthetic pesticides. They not only help in managing pests and diseases effectively but also promote the overall health of the agro-ecosystem. The synergy between these two functions enhanced nutrition and effective protection—underpins the comprehensive utility of agricultural inoculants, reinforcing their importance in modern agricultural practices.
By Microorganism Analysis
In 2023, Bacteria dominated the Agricultural Inoculants Market for their efficacy.
In 2023, Bacteria held a dominant market position in the "By Microorganism" segment of the Agricultural Inoculants Market. The primary driver for this dominance is the bacteria's efficiency in promoting plant growth and enhancing soil fertility through nitrogen fixation, phosphorus solubilization, and the synthesis of growth-promoting substances. Among bacterial inoculants, Rhizobium, Azotobacter, and Azospirillum are particularly notable for their widespread application and proven efficacy.
Fungi, though not as dominant as bacteria, also play a significant role in the market, primarily through mycorrhizal fungi which form symbiotic relationships with plant roots, improving water and nutrient uptake. Despite being a smaller segment, other microorganisms, including algae and actinomycetes, contribute to niche applications where they provide specific benefits such as disease suppression and bio-remediation. The rising emphasis on sustainable agriculture and the need to reduce chemical fertilizer usage further propels the adoption of bacterial inoculants, positioning them as a cornerstone in the agricultural inoculants market. This trend is expected to continue as research and development efforts yield new bacterial strains with enhanced agricultural benefits.
By Mode of Application Analysis
In 2023, Seed Inoculation dominated the agricultural inoculants market by application.
In 2023, Seed Inoculation held a dominant market position in the "By Mode of Application" segment of the agricultural inoculants market. This segment benefits significantly from the precision and efficiency that seed inoculation offers, ensuring that beneficial microorganisms are directly applied to seeds before planting. This method optimizes the symbiotic relationship between plants and microbes, enhancing nutrient uptake, improving resistance to diseases, and increasing overall crop yields. It is particularly favored in large-scale farming operations where uniform application and cost-efficiency are critical.
Simultaneously, soil inoculation remains a vital method, complementing seed inoculation by enriching the soil microbiome directly. This approach is especially beneficial for improving soil health and fertility over the long term, creating a more sustainable agricultural environment. Soil inoculation can be tailored to specific soil conditions and crop requirements, providing a versatile solution for various agricultural settings. Both seed and soil inoculation methods play crucial roles in advancing sustainable agriculture, with seed inoculation leading in market share due to its immediate impact on crop performance and ease of integration into existing farming practices.
By Crop Type Analysis
In 2023, Grains dominated the agricultural inoculants market by crop type.
In 2023, Grains held a dominant market position in the "By Crop Type" segment of the Agricultural Inoculants Market. This preeminence is attributed to the substantial global demand for staple grains such as wheat, rice, and corn, which are essential to food security and nutrition worldwide. Agricultural inoculants, which include beneficial bacteria, fungi, and other microorganisms, are increasingly utilized in grain cultivation to enhance nutrient uptake, improve soil health, and boost crop resilience against pests and diseases. The widespread adoption of sustainable farming practices and the growing emphasis on reducing chemical fertilizer use has further propelled the uptake of inoculants in grain production.
Cereals, closely related to grains, also saw significant adoption due to similar agronomic benefits and their crucial role in global diets. Pulses experienced moderate growth as inoculants help in nitrogen fixation, an essential process for leguminous plants. Oilseeds like soybeans and canola benefited from inoculants that enhance oil content and overall yield, responding to the rising demand for vegetable oils and biofuels. Commercial crops such as cotton and tobacco leveraged inoculants to improve soil fertility and crop quality.
Fruits and vegetables witnessed increased inoculant use as these products demand high soil fertility and disease resistance to meet quality standards. Other crop types, including niche and specialty crops, also adopted inoculants, driven by the need for enhanced productivity and sustainability in diverse agricultural practices. Overall, grains' leading position underscores the pivotal role of inoculants in modern agriculture’s shift towards more sustainable and productive farming methods.
Key Market Segments
By Function
- Crop Nutrition
- Crop Protection
By Microorganism
- Bacteria
- Fungi
- Other Microorganisms
By Mode of Application
- Seed Inoculation
- Soil Inoculation
By Crop Type
- Grains
- Cereals
- Pulses
- Oilseeds
- Commercial Crops
- Fruits and Vegetables
- Other Crop Types
Growth Opportunity
Rise in Awareness of Soil Health
The increasing recognition of soil health as a critical component of sustainable agriculture presents a significant growth opportunity for the global agricultural inoculants market. Farmers and agricultural stakeholders are becoming more aware of the detrimental effects of over-reliance on chemical fertilizers, leading to a shift towards organic and sustainable farming practices. Agricultural inoculants, which enhance soil fertility and plant health through beneficial microorganisms, are poised to benefit from this trend. As more educational programs and government initiatives promote soil health awareness, the demand for inoculants is expected to rise, driving market growth.
Growing Need for Biofertilizers
The growing need for biofertilizers, driven by the global push for environmentally friendly and sustainable farming solutions, further underscores the market potential for agricultural inoculants. Biofertilizers, which utilize natural processes involving microorganisms to improve soil fertility, align perfectly with the rising consumer and regulatory demands for sustainable agricultural inputs. This trend is particularly strong in regions with stringent environmental regulations and in markets where organic produce commands a premium price. The use of inoculants as biofertilizers can lead to higher crop yields, improved soil health, and reduced chemical input costs, making them an attractive option for farmers globally.
Latest Trends
Growing Awareness of Environmental Impact
The agricultural inoculants market is poised to benefit significantly from an increasing awareness of the environmental impact of traditional agricultural practices. As sustainability becomes a pivotal concern globally, farmers and agricultural stakeholders are increasingly turning to inoculants to enhance crop productivity while minimizing ecological footprints. Inoculants, which include beneficial bacteria, fungi, and other microorganisms, play a crucial role in enhancing soil health and reducing the reliance on chemical fertilizers and pesticides. This shift not only supports environmental conservation but also promotes sustainable farming practices, aligning with the growing consumer demand for environmentally friendly and organic produce. Companies in the agricultural sector are thus investing in research and development to innovate and introduce more effective and sustainable inoculant products.
Government Initiatives Support Market Growth
Government initiatives worldwide are providing substantial support to the agricultural inoculants market. Various national and international policies aimed at promoting sustainable agriculture and reducing greenhouse gas emissions are creating a favorable regulatory environment for the adoption of inoculants. For instance, subsidies, grants, and favorable regulations for sustainable agricultural inputs are encouraging farmers to adopt inoculants. In regions like North America and Europe, governments are actively supporting organic farming and soil health improvement programs, further driving market growth.
Additionally, developing economies are recognizing the long-term benefits of sustainable agricultural practices, with governments investing in education and resources to facilitate the adoption of inoculants among small and medium-scale farmers. This support is not only fostering market expansion but also contributing to global efforts in combating climate change and ensuring food security.
Regional Analysis
North America leads the Agricultural Inoculants Market with a 35% share.
The Agricultural Inoculants Market demonstrates significant regional variation in adoption and growth potential, driven by diverse agricultural practices and environmental conditions. In North America, the market is robust, underpinned by advanced farming techniques and a strong emphasis on sustainable agriculture. The region holds the largest market share, accounting for approximately 35% of the global market. The U.S. and Canada lead in this region due to their extensive arable land and high investment in agricultural biotechnology.
Europe follows closely, driven by stringent regulations on chemical fertilizers and pesticides, which boost the adoption of bio-based alternatives like inoculants. Countries such as Germany, France, and the UK are prominent players, fostering market growth through innovation and supportive policies.
The Asia Pacific region exhibits rapid growth, with countries like China, India, and Australia leading the adoption of agricultural inoculants. This growth is propelled by increasing awareness of sustainable farming practices and government initiatives promoting organic farming. The region's diverse climatic conditions also necessitate varied inoculant formulations, further driving market expansion.
In Latin America, Brazil and Argentina are the primary contributors, leveraging their vast agricultural landscapes and focus on enhancing crop yields. The Middle East & Africa, while currently the smallest market, shows promising potential with increasing agricultural activities and growing interest in sustainable farming technologies.
Key Regions and Countries
North America
- The US
- Canada
- Rest of North America
Europe
- Germany
- France
- The UK
- Spain
- Netherlands
- Russia
- Italy
- Rest of Europe
Asia-Pacific
- China
- Japan
- Singapore
- Thailand
- South Korea
- Vietnam
- India
- New Zealand
- Rest of Asia Pacific
Latin America
- Mexico
- Brazil
- Rest of Latin America
Middle East & Africa
- Saudi Arabia
- South Africa
- UAE
- Rest of the Middle East & Africa
Key Players Analysis
The global agricultural inoculants market in 2024 is poised for significant growth, driven by the increasing demand for sustainable farming practices and enhanced crop yields. Leading the market are key players such as Corteva Inc., BASF SE, and Bayer AG, whose robust R&D capabilities and extensive product portfolios enable them to set industry standards. Corteva Inc., with its focus on innovation and farmer-centric solutions, is likely to expand its market share through new product launches and strategic collaborations.
BASF SE and Bayer AG, both headquartered in Germany, leverage their strong presence in agricultural chemicals to integrate inoculants into their broader product offerings. Their global distribution networks and commitment to sustainability position them as dominant forces in the market.
Novozymes A/S, a leader in biotechnology, continues to innovate with microbial solutions that enhance soil health and crop productivity, strengthening its competitive edge. Canadian firm Brettyoung and Argentina’s Rizobacter Argentina S.A. are notable for their regional expertise and tailored solutions for local farming conditions.
Italpollina S.p.A. and Advanced Biological Marketing Inc. are distinguished by their focus on organic and biological products, aligning with the growing consumer preference for eco-friendly agriculture. Soil Technologies Corporation and Verdesian Life Sciences LLC, both U.S.-based, emphasize technological advancements and product efficacy, contributing to the market’s evolution.
Overall, these companies are driving the agricultural inoculants market forward through innovation, sustainability, and strategic market positioning, meeting the evolving demands of global agriculture.
Market Key Players
- Corteva Inc (U.S.)
- BASF SE (Germany)
- Bayer AG (Germany)
- Novozymes A/S (Denmark)
- Brett Young (Canada)
- Rizobacter Argentina S.A. (Argentina)
- Italpollina S.p.A. (Italy)
- Advanced Biological Marketing Inc. (U.S.)
- Soil Technologies Corporation (U.S.)
- Verdesian Life Sciences LLC (U.S.)
Recent Development
- In March 2024, BASF SE introduced a new line of microbial inoculants designed to enhance nitrogen fixation and phosphorus solubilization in crops. This development aims to boost crop productivity and reduce the dependency on synthetic fertilizers, aligning with global trends towards sustainable agriculture.
- In February 2024, Verdesian Life Sciences announced a partnership with the University of Illinois to develop advanced microbial inoculants. This collaboration focuses on leveraging cutting-edge research to create inoculants that can improve soil health and crop resilience against environmental stresses.
- In January 2024, Novozymes launched three new biological inoculants BioniQ, TagTeam BioniQPro, and TagTeam BioniQChickpea targeted at improving crop yields and soil health. This expansion highlights Novozymes' commitment to enhancing sustainable agricultural practices through microbial solutions.
Report Scope
Report Features Description Market Value (2023) USD 491.1 Billion Forecast Revenue (2033) USD 976.2 Billion CAGR (2024-2032) 7.3% Base Year for Estimation 2023 Historic Period 2016-2023 Forecast Period 2024-2033 Report Coverage Revenue Forecast, Market Dynamics, COVID-19 Impact, Competitive Landscape, Recent Developments Segments Covered By Function (Crop Nutrition, Crop Protection), By Microorganism (Bacteria, Fungi, Other Microorganisms), By Mode of Application (Seed Inoculation, Soil Inoculation), By Crop Type (Grains, Cereals, Pulses, Oilseeds, Commercial Crops, Fruits and Vegetables, Other Crop Types) Regional Analysis North America - The US, Canada, Rest of North America, Europe - Germany, France, The UK, Spain, Italy, Russia, Netherlands, Rest of Europe, Asia-Pacific - China, Japan, South Korea, India, New Zealand, Singapore, Thailand, Vietnam, Rest of Asia Pacific, Latin America - Brazil, Mexico, Rest of Latin America, Middle East & Africa - South Africa, Saudi Arabia, UAE, Rest of Middle East & Africa Competitive Landscape Corteva Inc (U.S.), BASF SE (Germany), Bayer AG (Germany), Novozymes A/S (Denmark), Brettyoung (Canada), Rizobacter Argentina S.A. (Argentina), Italpollina S.p.A. (Italy), Advanced Biological Marketing Inc. (U.S.), Soil Technologies Corporation (U.S.), Verdesian Life Sciences LLC (U.S.) Customization Scope Customization for segments, region/country-level will be provided. Moreover, additional customization can be done based on the requirements. Purchase Options We have three licenses to opt for Single User License, Multi-User License (Up to 5 Users), Corporate Use License (Unlimited User and Printable PDF) -
- 1. Executive Summary
- 1.1. Definition
- 1.2. Taxonomy
- 1.3. Research Scope
- 1.4. Key Analysis
- 1.5. Key Findings by Major Segments
- 1.6. Top strategies by Major Players
- 2. Global Agricultural Inoculants Market Overview
- 2.1. Agricultural Inoculants Market Dynamics
- 2.1.1. Drivers
- 2.1.2. Opportunities
- 2.1.3. Restraints
- 2.1.4. Challenges
- 2.2. Macro-economic Factors
- 2.3. Regulatory Framework
- 2.4. Market Investment Feasibility Index
- 2.5. PEST Analysis
- 2.6. PORTER’S Five Force Analysis
- 2.7. Drivers & Restraints Impact Analysis
- 2.8. Industry Chain Analysis
- 2.9. Cost Structure Analysis
- 2.10. Marketing Strategy
- 2.11. Russia-Ukraine War Impact Analysis
- 2.12. Opportunity Map Analysis
- 2.13. Market Competition Scenario Analysis
- 2.14. Product Life Cycle Analysis
- 2.15. Opportunity Orbits
- 2.16. Manufacturer Intensity Map
- 2.17. Major Companies sales by Value & Volume
- 2.1. Agricultural Inoculants Market Dynamics
- 3. Global Agricultural Inoculants Market Analysis, Opportunity and Forecast, 2016-2032
- 3.1. Global Agricultural Inoculants Market Analysis, 2016-2021
- 3.2. Global Agricultural Inoculants Market Opportunity and Forecast, 2023-2032
- 3.3. Global Agricultural Inoculants Market Analysis, Opportunity and Forecast, By Function , 2016-2032
- 3.3.1. Global Agricultural Inoculants Market Analysis by Function : Introduction
- 3.3.2. Market Size Absolute $ Opportunity Analysis and Forecast, By Function , 2016-2032
- 3.3.3. Crop Nutrition
- 3.3.4. Crop Protection
- 3.4. Global Agricultural Inoculants Market Analysis, Opportunity and Forecast, By Microorganism , 2016-2032
- 3.4.1. Global Agricultural Inoculants Market Analysis by Microorganism : Introduction
- 3.4.2. Market Size Absolute $ Opportunity Analysis and Forecast, By Microorganism , 2016-2032
- 3.4.3. Bacteria
- 3.4.4. Fungi
- 3.4.5. Other Microorganisms
- 3.5. Global Agricultural Inoculants Market Analysis, Opportunity and Forecast, By Mode of Application , 2016-2032
- 3.5.1. Global Agricultural Inoculants Market Analysis by Mode of Application : Introduction
- 3.5.2. Market Size Absolute $ Opportunity Analysis and Forecast, By Mode of Application , 2016-2032
- 3.5.3. Seed Inoculation
- 3.5.4. Soil Inoculation
- 3.6. Global Agricultural Inoculants Market Analysis, Opportunity and Forecast, By Crop Type , 2016-2032
- 3.6.1. Global Agricultural Inoculants Market Analysis by Crop Type : Introduction
- 3.6.2. Market Size Absolute $ Opportunity Analysis and Forecast, By Crop Type , 2016-2032
- 3.6.3. Grains
- 3.6.4. Cereals
- 3.6.5. Pulses
- 3.6.6. Oilseeds
- 3.6.7. Commercial Crops
- 3.6.8. Fruits and Vegetables
- 3.6.9. Other Crop Types
- 4. North America Agricultural Inoculants Market Analysis, Opportunity and Forecast, 2016-2032
- 4.1. North America Agricultural Inoculants Market Analysis, 2016-2021
- 4.2. North America Agricultural Inoculants Market Opportunity and Forecast, 2023-2032
- 4.3. North America Agricultural Inoculants Market Analysis, Opportunity and Forecast, By Function , 2016-2032
- 4.3.1. North America Agricultural Inoculants Market Analysis by Function : Introduction
- 4.3.2. Market Size Absolute $ Opportunity Analysis and Forecast, By Function , 2016-2032
- 4.3.3. Crop Nutrition
- 4.3.4. Crop Protection
- 4.4. North America Agricultural Inoculants Market Analysis, Opportunity and Forecast, By Microorganism , 2016-2032
- 4.4.1. North America Agricultural Inoculants Market Analysis by Microorganism : Introduction
- 4.4.2. Market Size Absolute $ Opportunity Analysis and Forecast, By Microorganism , 2016-2032
- 4.4.3. Bacteria
- 4.4.4. Fungi
- 4.4.5. Other Microorganisms
- 4.5. North America Agricultural Inoculants Market Analysis, Opportunity and Forecast, By Mode of Application , 2016-2032
- 4.5.1. North America Agricultural Inoculants Market Analysis by Mode of Application : Introduction
- 4.5.2. Market Size Absolute $ Opportunity Analysis and Forecast, By Mode of Application , 2016-2032
- 4.5.3. Seed Inoculation
- 4.5.4. Soil Inoculation
- 4.6. North America Agricultural Inoculants Market Analysis, Opportunity and Forecast, By Crop Type , 2016-2032
- 4.6.1. North America Agricultural Inoculants Market Analysis by Crop Type : Introduction
- 4.6.2. Market Size Absolute $ Opportunity Analysis and Forecast, By Crop Type , 2016-2032
- 4.6.3. Grains
- 4.6.4. Cereals
- 4.6.5. Pulses
- 4.6.6. Oilseeds
- 4.6.7. Commercial Crops
- 4.6.8. Fruits and Vegetables
- 4.6.9. Other Crop Types
- 4.7. North America Agricultural Inoculants Market Analysis, Opportunity and Forecast, By Country , 2016-2032
- 4.7.1. North America Agricultural Inoculants Market Analysis by Country : Introduction
- 4.7.2. Market Size Absolute $ Opportunity Analysis and Forecast, Country , 2016-2032
- 4.7.2.1. The US
- 4.7.2.2. Canada
- 4.7.2.3. Mexico
- 5. Western Europe Agricultural Inoculants Market Analysis, Opportunity and Forecast, 2016-2032
- 5.1. Western Europe Agricultural Inoculants Market Analysis, 2016-2021
- 5.2. Western Europe Agricultural Inoculants Market Opportunity and Forecast, 2023-2032
- 5.3. Western Europe Agricultural Inoculants Market Analysis, Opportunity and Forecast, By Function , 2016-2032
- 5.3.1. Western Europe Agricultural Inoculants Market Analysis by Function : Introduction
- 5.3.2. Market Size Absolute $ Opportunity Analysis and Forecast, By Function , 2016-2032
- 5.3.3. Crop Nutrition
- 5.3.4. Crop Protection
- 5.4. Western Europe Agricultural Inoculants Market Analysis, Opportunity and Forecast, By Microorganism , 2016-2032
- 5.4.1. Western Europe Agricultural Inoculants Market Analysis by Microorganism : Introduction
- 5.4.2. Market Size Absolute $ Opportunity Analysis and Forecast, By Microorganism , 2016-2032
- 5.4.3. Bacteria
- 5.4.4. Fungi
- 5.4.5. Other Microorganisms
- 5.5. Western Europe Agricultural Inoculants Market Analysis, Opportunity and Forecast, By Mode of Application , 2016-2032
- 5.5.1. Western Europe Agricultural Inoculants Market Analysis by Mode of Application : Introduction
- 5.5.2. Market Size Absolute $ Opportunity Analysis and Forecast, By Mode of Application , 2016-2032
- 5.5.3. Seed Inoculation
- 5.5.4. Soil Inoculation
- 5.6. Western Europe Agricultural Inoculants Market Analysis, Opportunity and Forecast, By Crop Type , 2016-2032
- 5.6.1. Western Europe Agricultural Inoculants Market Analysis by Crop Type : Introduction
- 5.6.2. Market Size Absolute $ Opportunity Analysis and Forecast, By Crop Type , 2016-2032
- 5.6.3. Grains
- 5.6.4. Cereals
- 5.6.5. Pulses
- 5.6.6. Oilseeds
- 5.6.7. Commercial Crops
- 5.6.8. Fruits and Vegetables
- 5.6.9. Other Crop Types
- 5.7. Western Europe Agricultural Inoculants Market Analysis, Opportunity and Forecast, By Country , 2016-2032
- 5.7.1. Western Europe Agricultural Inoculants Market Analysis by Country : Introduction
- 5.7.2. Market Size Absolute $ Opportunity Analysis and Forecast, Country , 2016-2032
- 5.7.2.1. Germany
- 5.7.2.2. France
- 5.7.2.3. The UK
- 5.7.2.4. Spain
- 5.7.2.5. Italy
- 5.7.2.6. Portugal
- 5.7.2.7. Ireland
- 5.7.2.8. Austria
- 5.7.2.9. Switzerland
- 5.7.2.10. Benelux
- 5.7.2.11. Nordic
- 5.7.2.12. Rest of Western Europe
- 6. Eastern Europe Agricultural Inoculants Market Analysis, Opportunity and Forecast, 2016-2032
- 6.1. Eastern Europe Agricultural Inoculants Market Analysis, 2016-2021
- 6.2. Eastern Europe Agricultural Inoculants Market Opportunity and Forecast, 2023-2032
- 6.3. Eastern Europe Agricultural Inoculants Market Analysis, Opportunity and Forecast, By Function , 2016-2032
- 6.3.1. Eastern Europe Agricultural Inoculants Market Analysis by Function : Introduction
- 6.3.2. Market Size Absolute $ Opportunity Analysis and Forecast, By Function , 2016-2032
- 6.3.3. Crop Nutrition
- 6.3.4. Crop Protection
- 6.4. Eastern Europe Agricultural Inoculants Market Analysis, Opportunity and Forecast, By Microorganism , 2016-2032
- 6.4.1. Eastern Europe Agricultural Inoculants Market Analysis by Microorganism : Introduction
- 6.4.2. Market Size Absolute $ Opportunity Analysis and Forecast, By Microorganism , 2016-2032
- 6.4.3. Bacteria
- 6.4.4. Fungi
- 6.4.5. Other Microorganisms
- 6.5. Eastern Europe Agricultural Inoculants Market Analysis, Opportunity and Forecast, By Mode of Application , 2016-2032
- 6.5.1. Eastern Europe Agricultural Inoculants Market Analysis by Mode of Application : Introduction
- 6.5.2. Market Size Absolute $ Opportunity Analysis and Forecast, By Mode of Application , 2016-2032
- 6.5.3. Seed Inoculation
- 6.5.4. Soil Inoculation
- 6.6. Eastern Europe Agricultural Inoculants Market Analysis, Opportunity and Forecast, By Crop Type , 2016-2032
- 6.6.1. Eastern Europe Agricultural Inoculants Market Analysis by Crop Type : Introduction
- 6.6.2. Market Size Absolute $ Opportunity Analysis and Forecast, By Crop Type , 2016-2032
- 6.6.3. Grains
- 6.6.4. Cereals
- 6.6.5. Pulses
- 6.6.6. Oilseeds
- 6.6.7. Commercial Crops
- 6.6.8. Fruits and Vegetables
- 6.6.9. Other Crop Types
- 6.7. Eastern Europe Agricultural Inoculants Market Analysis, Opportunity and Forecast, By Country , 2016-2032
- 6.7.1. Eastern Europe Agricultural Inoculants Market Analysis by Country : Introduction
- 6.7.2. Market Size Absolute $ Opportunity Analysis and Forecast, Country , 2016-2032
- 6.7.2.1. Russia
- 6.7.2.2. Poland
- 6.7.2.3. The Czech Republic
- 6.7.2.4. Greece
- 6.7.2.5. Rest of Eastern Europe
- 7. APAC Agricultural Inoculants Market Analysis, Opportunity and Forecast, 2016-2032
- 7.1. APAC Agricultural Inoculants Market Analysis, 2016-2021
- 7.2. APAC Agricultural Inoculants Market Opportunity and Forecast, 2023-2032
- 7.3. APAC Agricultural Inoculants Market Analysis, Opportunity and Forecast, By Function , 2016-2032
- 7.3.1. APAC Agricultural Inoculants Market Analysis by Function : Introduction
- 7.3.2. Market Size Absolute $ Opportunity Analysis and Forecast, By Function , 2016-2032
- 7.3.3. Crop Nutrition
- 7.3.4. Crop Protection
- 7.4. APAC Agricultural Inoculants Market Analysis, Opportunity and Forecast, By Microorganism , 2016-2032
- 7.4.1. APAC Agricultural Inoculants Market Analysis by Microorganism : Introduction
- 7.4.2. Market Size Absolute $ Opportunity Analysis and Forecast, By Microorganism , 2016-2032
- 7.4.3. Bacteria
- 7.4.4. Fungi
- 7.4.5. Other Microorganisms
- 7.5. APAC Agricultural Inoculants Market Analysis, Opportunity and Forecast, By Mode of Application , 2016-2032
- 7.5.1. APAC Agricultural Inoculants Market Analysis by Mode of Application : Introduction
- 7.5.2. Market Size Absolute $ Opportunity Analysis and Forecast, By Mode of Application , 2016-2032
- 7.5.3. Seed Inoculation
- 7.5.4. Soil Inoculation
- 7.6. APAC Agricultural Inoculants Market Analysis, Opportunity and Forecast, By Crop Type , 2016-2032
- 7.6.1. APAC Agricultural Inoculants Market Analysis by Crop Type : Introduction
- 7.6.2. Market Size Absolute $ Opportunity Analysis and Forecast, By Crop Type , 2016-2032
- 7.6.3. Grains
- 7.6.4. Cereals
- 7.6.5. Pulses
- 7.6.6. Oilseeds
- 7.6.7. Commercial Crops
- 7.6.8. Fruits and Vegetables
- 7.6.9. Other Crop Types
- 7.7. APAC Agricultural Inoculants Market Analysis, Opportunity and Forecast, By Country , 2016-2032
- 7.7.1. APAC Agricultural Inoculants Market Analysis by Country : Introduction
- 7.7.2. Market Size Absolute $ Opportunity Analysis and Forecast, Country , 2016-2032
- 7.7.2.1. China
- 7.7.2.2. Japan
- 7.7.2.3. South Korea
- 7.7.2.4. India
- 7.7.2.5. Australia & New Zeland
- 7.7.2.6. Indonesia
- 7.7.2.7. Malaysia
- 7.7.2.8. Philippines
- 7.7.2.9. Singapore
- 7.7.2.10. Thailand
- 7.7.2.11. Vietnam
- 7.7.2.12. Rest of APAC
- 8. Latin America Agricultural Inoculants Market Analysis, Opportunity and Forecast, 2016-2032
- 8.1. Latin America Agricultural Inoculants Market Analysis, 2016-2021
- 8.2. Latin America Agricultural Inoculants Market Opportunity and Forecast, 2023-2032
- 8.3. Latin America Agricultural Inoculants Market Analysis, Opportunity and Forecast, By Function , 2016-2032
- 8.3.1. Latin America Agricultural Inoculants Market Analysis by Function : Introduction
- 8.3.2. Market Size Absolute $ Opportunity Analysis and Forecast, By Function , 2016-2032
- 8.3.3. Crop Nutrition
- 8.3.4. Crop Protection
- 8.4. Latin America Agricultural Inoculants Market Analysis, Opportunity and Forecast, By Microorganism , 2016-2032
- 8.4.1. Latin America Agricultural Inoculants Market Analysis by Microorganism : Introduction
- 8.4.2. Market Size Absolute $ Opportunity Analysis and Forecast, By Microorganism , 2016-2032
- 8.4.3. Bacteria
- 8.4.4. Fungi
- 8.4.5. Other Microorganisms
- 8.5. Latin America Agricultural Inoculants Market Analysis, Opportunity and Forecast, By Mode of Application , 2016-2032
- 8.5.1. Latin America Agricultural Inoculants Market Analysis by Mode of Application : Introduction
- 8.5.2. Market Size Absolute $ Opportunity Analysis and Forecast, By Mode of Application , 2016-2032
- 8.5.3. Seed Inoculation
- 8.5.4. Soil Inoculation
- 8.6. Latin America Agricultural Inoculants Market Analysis, Opportunity and Forecast, By Crop Type , 2016-2032
- 8.6.1. Latin America Agricultural Inoculants Market Analysis by Crop Type : Introduction
- 8.6.2. Market Size Absolute $ Opportunity Analysis and Forecast, By Crop Type , 2016-2032
- 8.6.3. Grains
- 8.6.4. Cereals
- 8.6.5. Pulses
- 8.6.6. Oilseeds
- 8.6.7. Commercial Crops
- 8.6.8. Fruits and Vegetables
- 8.6.9. Other Crop Types
- 8.7. Latin America Agricultural Inoculants Market Analysis, Opportunity and Forecast, By Country , 2016-2032
- 8.7.1. Latin America Agricultural Inoculants Market Analysis by Country : Introduction
- 8.7.2. Market Size Absolute $ Opportunity Analysis and Forecast, Country , 2016-2032
- 8.7.2.1. Brazil
- 8.7.2.2. Colombia
- 8.7.2.3. Chile
- 8.7.2.4. Argentina
- 8.7.2.5. Costa Rica
- 8.7.2.6. Rest of Latin America
- 9. Middle East & Africa Agricultural Inoculants Market Analysis, Opportunity and Forecast, 2016-2032
- 9.1. Middle East & Africa Agricultural Inoculants Market Analysis, 2016-2021
- 9.2. Middle East & Africa Agricultural Inoculants Market Opportunity and Forecast, 2023-2032
- 9.3. Middle East & Africa Agricultural Inoculants Market Analysis, Opportunity and Forecast, By Function , 2016-2032
- 9.3.1. Middle East & Africa Agricultural Inoculants Market Analysis by Function : Introduction
- 9.3.2. Market Size Absolute $ Opportunity Analysis and Forecast, By Function , 2016-2032
- 9.3.3. Crop Nutrition
- 9.3.4. Crop Protection
- 9.4. Middle East & Africa Agricultural Inoculants Market Analysis, Opportunity and Forecast, By Microorganism , 2016-2032
- 9.4.1. Middle East & Africa Agricultural Inoculants Market Analysis by Microorganism : Introduction
- 9.4.2. Market Size Absolute $ Opportunity Analysis and Forecast, By Microorganism , 2016-2032
- 9.4.3. Bacteria
- 9.4.4. Fungi
- 9.4.5. Other Microorganisms
- 9.5. Middle East & Africa Agricultural Inoculants Market Analysis, Opportunity and Forecast, By Mode of Application , 2016-2032
- 9.5.1. Middle East & Africa Agricultural Inoculants Market Analysis by Mode of Application : Introduction
- 9.5.2. Market Size Absolute $ Opportunity Analysis and Forecast, By Mode of Application , 2016-2032
- 9.5.3. Seed Inoculation
- 9.5.4. Soil Inoculation
- 9.6. Middle East & Africa Agricultural Inoculants Market Analysis, Opportunity and Forecast, By Crop Type , 2016-2032
- 9.6.1. Middle East & Africa Agricultural Inoculants Market Analysis by Crop Type : Introduction
- 9.6.2. Market Size Absolute $ Opportunity Analysis and Forecast, By Crop Type , 2016-2032
- 9.6.3. Grains
- 9.6.4. Cereals
- 9.6.5. Pulses
- 9.6.6. Oilseeds
- 9.6.7. Commercial Crops
- 9.6.8. Fruits and Vegetables
- 9.6.9. Other Crop Types
- 9.7. Middle East & Africa Agricultural Inoculants Market Analysis, Opportunity and Forecast, By Country , 2016-2032
- 9.7.1. Middle East & Africa Agricultural Inoculants Market Analysis by Country : Introduction
- 9.7.2. Market Size Absolute $ Opportunity Analysis and Forecast, Country , 2016-2032
- 9.7.2.1. Algeria
- 9.7.2.2. Egypt
- 9.7.2.3. Israel
- 9.7.2.4. Kuwait
- 9.7.2.5. Nigeria
- 9.7.2.6. Saudi Arabia
- 9.7.2.7. South Africa
- 9.7.2.8. Turkey
- 9.7.2.9. The UAE
- 9.7.2.10. Rest of MEA
- 10. Global Agricultural Inoculants Market Analysis, Opportunity and Forecast, By Region , 2016-2032
- 10.1. Global Agricultural Inoculants Market Analysis by Region : Introduction
- 10.2. Market Size Absolute $ Opportunity Analysis and Forecast, By Region , 2016-2032
- 10.2.1. North America
- 10.2.2. Western Europe
- 10.2.3. Eastern Europe
- 10.2.4. APAC
- 10.2.5. Latin America
- 10.2.6. Middle East & Africa
- 11. Global Agricultural Inoculants Market Competitive Landscape, Market Share Analysis, and Company Profiles
- 11.1. Market Share Analysis
- 11.2. Company Profiles
- 11.3. Corteva Inc (U.S.)
- 11.3.1. Company Overview
- 11.3.2. Financial Highlights
- 11.3.3. Product Portfolio
- 11.3.4. SWOT Analysis
- 11.3.5. Key Strategies and Developments
- 11.4. BASF SE (Germany)
- 11.4.1. Company Overview
- 11.4.2. Financial Highlights
- 11.4.3. Product Portfolio
- 11.4.4. SWOT Analysis
- 11.4.5. Key Strategies and Developments
- 11.5. Bayer AG (Germany)
- 11.5.1. Company Overview
- 11.5.2. Financial Highlights
- 11.5.3. Product Portfolio
- 11.5.4. SWOT Analysis
- 11.5.5. Key Strategies and Developments
- 11.6. Novozymes A/S (Denmark)
- 11.6.1. Company Overview
- 11.6.2. Financial Highlights
- 11.6.3. Product Portfolio
- 11.6.4. SWOT Analysis
- 11.6.5. Key Strategies and Developments
- 11.7. Brettyoung (Canada)
- 11.7.1. Company Overview
- 11.7.2. Financial Highlights
- 11.7.3. Product Portfolio
- 11.7.4. SWOT Analysis
- 11.7.5. Key Strategies and Developments
- 11.8. Rizobacter Argentina S.A. (Argentina)
- 11.8.1. Company Overview
- 11.8.2. Financial Highlights
- 11.8.3. Product Portfolio
- 11.8.4. SWOT Analysis
- 11.8.5. Key Strategies and Developments
- 11.9. Italpollina S.p.A. (Italy)
- 11.9.1. Company Overview
- 11.9.2. Financial Highlights
- 11.9.3. Product Portfolio
- 11.9.4. SWOT Analysis
- 11.9.5. Key Strategies and Developments
- 11.10. Advanced Biological Marketing Inc. (U.S.)
- 11.10.1. Company Overview
- 11.10.2. Financial Highlights
- 11.10.3. Product Portfolio
- 11.10.4. SWOT Analysis
- 11.10.5. Key Strategies and Developments
- 11.11. Soil Technologies Corporation (U.S.)
- 11.11.1. Company Overview
- 11.11.2. Financial Highlights
- 11.11.3. Product Portfolio
- 11.11.4. SWOT Analysis
- 11.11.5. Key Strategies and Developments
- 11.12. Verdesian Life Sciences LLC (U.S.)
- 11.12.1. Company Overview
- 11.12.2. Financial Highlights
- 11.12.3. Product Portfolio
- 11.12.4. SWOT Analysis
- 11.12.5. Key Strategies and Developments
- 11.13.1. Company Overview
- 11.13.2. Financial Highlights
- 11.13.3. Product Portfolio
- 11.13.4. SWOT Analysis
- 11.13.5. Key Strategies and Developments
- 12. Assumptions and Acronyms
- 13. Research Methodology
- 14. Contact
"
- List of Figures
- "
- Figure 1: Global Agricultural Inoculants Market Revenue (US$ Mn) Market Share by Function in 2022
- Figure 2: Global Agricultural Inoculants Market Market Attractiveness Analysis by Function , 2016-2032
- Figure 3: Global Agricultural Inoculants Market Revenue (US$ Mn) Market Share by Microorganism in 2022
- Figure 4: Global Agricultural Inoculants Market Market Attractiveness Analysis by Microorganism , 2016-2032
- Figure 5: Global Agricultural Inoculants Market Revenue (US$ Mn) Market Share by Mode of Application in 2022
- Figure 6: Global Agricultural Inoculants Market Market Attractiveness Analysis by Mode of Application , 2016-2032
- Figure 7: Global Agricultural Inoculants Market Revenue (US$ Mn) Market Share by Crop Type in 2022
- Figure 8: Global Agricultural Inoculants Market Market Attractiveness Analysis by Crop Type , 2016-2032
- Figure 9: Global Agricultural Inoculants Market Revenue (US$ Mn) Market Share by Region in 2022
- Figure 10: Global Agricultural Inoculants Market Market Attractiveness Analysis by Region, 2016-2032
- Figure 11: Global Agricultural Inoculants Market Market Revenue (US$ Mn) (2016-2032)
- Figure 12: Global Agricultural Inoculants Market Market Revenue (US$ Mn) Comparison by Region (2016-2032)
- Figure 13: Global Agricultural Inoculants Market Market Revenue (US$ Mn) Comparison by Function (2016-2032)
- Figure 14: Global Agricultural Inoculants Market Market Revenue (US$ Mn) Comparison by Microorganism (2016-2032)
- Figure 15: Global Agricultural Inoculants Market Market Revenue (US$ Mn) Comparison by Mode of Application (2016-2032)
- Figure 16: Global Agricultural Inoculants Market Market Revenue (US$ Mn) Comparison by Crop Type (2016-2032)
- Figure 17: Global Agricultural Inoculants Market Market Y-o-Y Growth Rate Comparison by Region (2016-2032)
- Figure 18: Global Agricultural Inoculants Market Market Y-o-Y Growth Rate Comparison by Function (2016-2032)
- Figure 19: Global Agricultural Inoculants Market Market Y-o-Y Growth Rate Comparison by Microorganism (2016-2032)
- Figure 20: Global Agricultural Inoculants Market Market Y-o-Y Growth Rate Comparison by Mode of Application (2016-2032)
- Figure 21: Global Agricultural Inoculants Market Market Y-o-Y Growth Rate Comparison by Crop Type (2016-2032)
- Figure 22: Global Agricultural Inoculants Market Market Share Comparison by Region (2016-2032)
- Figure 23: Global Agricultural Inoculants Market Market Share Comparison by Function (2016-2032)
- Figure 24: Global Agricultural Inoculants Market Market Share Comparison by Microorganism (2016-2032)
- Figure 25: Global Agricultural Inoculants Market Market Share Comparison by Mode of Application (2016-2032)
- Figure 26: Global Agricultural Inoculants Market Market Share Comparison by Crop Type (2016-2032)
- Figure 27: North America Agricultural Inoculants Market Revenue (US$ Mn) Market Share by Function in 2022
- Figure 28: North America Agricultural Inoculants Market Market Attractiveness Analysis by Function , 2016-2032
- Figure 29: North America Agricultural Inoculants Market Revenue (US$ Mn) Market Share by Microorganism in 2022
- Figure 30: North America Agricultural Inoculants Market Market Attractiveness Analysis by Microorganism , 2016-2032
- Figure 31: North America Agricultural Inoculants Market Revenue (US$ Mn) Market Share by Mode of Application in 2022
- Figure 32: North America Agricultural Inoculants Market Market Attractiveness Analysis by Mode of Application , 2016-2032
- Figure 33: North America Agricultural Inoculants Market Revenue (US$ Mn) Market Share by Crop Type in 2022
- Figure 34: North America Agricultural Inoculants Market Market Attractiveness Analysis by Crop Type , 2016-2032
- Figure 35: North America Agricultural Inoculants Market Revenue (US$ Mn) Market Share by Country in 2022
- Figure 36: North America Agricultural Inoculants Market Market Attractiveness Analysis by Country, 2016-2032
- Figure 37: North America Agricultural Inoculants Market Market Revenue (US$ Mn) (2016-2032)
- Figure 38: North America Agricultural Inoculants Market Market Revenue (US$ Mn) Comparison by Country (2016-2032)
- Figure 39: North America Agricultural Inoculants Market Market Revenue (US$ Mn) Comparison by Function (2016-2032)
- Figure 40: North America Agricultural Inoculants Market Market Revenue (US$ Mn) Comparison by Microorganism (2016-2032)
- Figure 41: North America Agricultural Inoculants Market Market Revenue (US$ Mn) Comparison by Mode of Application (2016-2032)
- Figure 42: North America Agricultural Inoculants Market Market Revenue (US$ Mn) Comparison by Crop Type (2016-2032)
- Figure 43: North America Agricultural Inoculants Market Market Y-o-Y Growth Rate Comparison by Country (2016-2032)
- Figure 44: North America Agricultural Inoculants Market Market Y-o-Y Growth Rate Comparison by Function (2016-2032)
- Figure 45: North America Agricultural Inoculants Market Market Y-o-Y Growth Rate Comparison by Microorganism (2016-2032)
- Figure 46: North America Agricultural Inoculants Market Market Y-o-Y Growth Rate Comparison by Mode of Application (2016-2032)
- Figure 47: North America Agricultural Inoculants Market Market Y-o-Y Growth Rate Comparison by Crop Type (2016-2032)
- Figure 48: North America Agricultural Inoculants Market Market Share Comparison by Country (2016-2032)
- Figure 49: North America Agricultural Inoculants Market Market Share Comparison by Function (2016-2032)
- Figure 50: North America Agricultural Inoculants Market Market Share Comparison by Microorganism (2016-2032)
- Figure 51: North America Agricultural Inoculants Market Market Share Comparison by Mode of Application (2016-2032)
- Figure 52: North America Agricultural Inoculants Market Market Share Comparison by Crop Type (2016-2032)
- Figure 53: Western Europe Agricultural Inoculants Market Revenue (US$ Mn) Market Share by Function in 2022
- Figure 54: Western Europe Agricultural Inoculants Market Market Attractiveness Analysis by Function , 2016-2032
- Figure 55: Western Europe Agricultural Inoculants Market Revenue (US$ Mn) Market Share by Microorganism in 2022
- Figure 56: Western Europe Agricultural Inoculants Market Market Attractiveness Analysis by Microorganism , 2016-2032
- Figure 57: Western Europe Agricultural Inoculants Market Revenue (US$ Mn) Market Share by Mode of Application in 2022
- Figure 58: Western Europe Agricultural Inoculants Market Market Attractiveness Analysis by Mode of Application , 2016-2032
- Figure 59: Western Europe Agricultural Inoculants Market Revenue (US$ Mn) Market Share by Crop Type in 2022
- Figure 60: Western Europe Agricultural Inoculants Market Market Attractiveness Analysis by Crop Type , 2016-2032
- Figure 61: Western Europe Agricultural Inoculants Market Revenue (US$ Mn) Market Share by Country in 2022
- Figure 62: Western Europe Agricultural Inoculants Market Market Attractiveness Analysis by Country, 2016-2032
- Figure 63: Western Europe Agricultural Inoculants Market Market Revenue (US$ Mn) (2016-2032)
- Figure 64: Western Europe Agricultural Inoculants Market Market Revenue (US$ Mn) Comparison by Country (2016-2032)
- Figure 65: Western Europe Agricultural Inoculants Market Market Revenue (US$ Mn) Comparison by Function (2016-2032)
- Figure 66: Western Europe Agricultural Inoculants Market Market Revenue (US$ Mn) Comparison by Microorganism (2016-2032)
- Figure 67: Western Europe Agricultural Inoculants Market Market Revenue (US$ Mn) Comparison by Mode of Application (2016-2032)
- Figure 68: Western Europe Agricultural Inoculants Market Market Revenue (US$ Mn) Comparison by Crop Type (2016-2032)
- Figure 69: Western Europe Agricultural Inoculants Market Market Y-o-Y Growth Rate Comparison by Country (2016-2032)
- Figure 70: Western Europe Agricultural Inoculants Market Market Y-o-Y Growth Rate Comparison by Function (2016-2032)
- Figure 71: Western Europe Agricultural Inoculants Market Market Y-o-Y Growth Rate Comparison by Microorganism (2016-2032)
- Figure 72: Western Europe Agricultural Inoculants Market Market Y-o-Y Growth Rate Comparison by Mode of Application (2016-2032)
- Figure 73: Western Europe Agricultural Inoculants Market Market Y-o-Y Growth Rate Comparison by Crop Type (2016-2032)
- Figure 74: Western Europe Agricultural Inoculants Market Market Share Comparison by Country (2016-2032)
- Figure 75: Western Europe Agricultural Inoculants Market Market Share Comparison by Function (2016-2032)
- Figure 76: Western Europe Agricultural Inoculants Market Market Share Comparison by Microorganism (2016-2032)
- Figure 77: Western Europe Agricultural Inoculants Market Market Share Comparison by Mode of Application (2016-2032)
- Figure 78: Western Europe Agricultural Inoculants Market Market Share Comparison by Crop Type (2016-2032)
- Figure 79: Eastern Europe Agricultural Inoculants Market Revenue (US$ Mn) Market Share by Function in 2022
- Figure 80: Eastern Europe Agricultural Inoculants Market Market Attractiveness Analysis by Function , 2016-2032
- Figure 81: Eastern Europe Agricultural Inoculants Market Revenue (US$ Mn) Market Share by Microorganism in 2022
- Figure 82: Eastern Europe Agricultural Inoculants Market Market Attractiveness Analysis by Microorganism , 2016-2032
- Figure 83: Eastern Europe Agricultural Inoculants Market Revenue (US$ Mn) Market Share by Mode of Application in 2022
- Figure 84: Eastern Europe Agricultural Inoculants Market Market Attractiveness Analysis by Mode of Application , 2016-2032
- Figure 85: Eastern Europe Agricultural Inoculants Market Revenue (US$ Mn) Market Share by Crop Type in 2022
- Figure 86: Eastern Europe Agricultural Inoculants Market Market Attractiveness Analysis by Crop Type , 2016-2032
- Figure 87: Eastern Europe Agricultural Inoculants Market Revenue (US$ Mn) Market Share by Country in 2022
- Figure 88: Eastern Europe Agricultural Inoculants Market Market Attractiveness Analysis by Country, 2016-2032
- Figure 89: Eastern Europe Agricultural Inoculants Market Market Revenue (US$ Mn) (2016-2032)
- Figure 90: Eastern Europe Agricultural Inoculants Market Market Revenue (US$ Mn) Comparison by Country (2016-2032)
- Figure 91: Eastern Europe Agricultural Inoculants Market Market Revenue (US$ Mn) Comparison by Function (2016-2032)
- Figure 92: Eastern Europe Agricultural Inoculants Market Market Revenue (US$ Mn) Comparison by Microorganism (2016-2032)
- Figure 93: Eastern Europe Agricultural Inoculants Market Market Revenue (US$ Mn) Comparison by Mode of Application (2016-2032)
- Figure 94: Eastern Europe Agricultural Inoculants Market Market Revenue (US$ Mn) Comparison by Crop Type (2016-2032)
- Figure 95: Eastern Europe Agricultural Inoculants Market Market Y-o-Y Growth Rate Comparison by Country (2016-2032)
- Figure 96: Eastern Europe Agricultural Inoculants Market Market Y-o-Y Growth Rate Comparison by Function (2016-2032)
- Figure 97: Eastern Europe Agricultural Inoculants Market Market Y-o-Y Growth Rate Comparison by Microorganism (2016-2032)
- Figure 98: Eastern Europe Agricultural Inoculants Market Market Y-o-Y Growth Rate Comparison by Mode of Application (2016-2032)
- Figure 99: Eastern Europe Agricultural Inoculants Market Market Y-o-Y Growth Rate Comparison by Crop Type (2016-2032)
- Figure 100: Eastern Europe Agricultural Inoculants Market Market Share Comparison by Country (2016-2032)
- Figure 101: Eastern Europe Agricultural Inoculants Market Market Share Comparison by Function (2016-2032)
- Figure 102: Eastern Europe Agricultural Inoculants Market Market Share Comparison by Microorganism (2016-2032)
- Figure 103: Eastern Europe Agricultural Inoculants Market Market Share Comparison by Mode of Application (2016-2032)
- Figure 104: Eastern Europe Agricultural Inoculants Market Market Share Comparison by Crop Type (2016-2032)
- Figure 105: APAC Agricultural Inoculants Market Revenue (US$ Mn) Market Share by Function in 2022
- Figure 106: APAC Agricultural Inoculants Market Market Attractiveness Analysis by Function , 2016-2032
- Figure 107: APAC Agricultural Inoculants Market Revenue (US$ Mn) Market Share by Microorganism in 2022
- Figure 108: APAC Agricultural Inoculants Market Market Attractiveness Analysis by Microorganism , 2016-2032
- Figure 109: APAC Agricultural Inoculants Market Revenue (US$ Mn) Market Share by Mode of Application in 2022
- Figure 110: APAC Agricultural Inoculants Market Market Attractiveness Analysis by Mode of Application , 2016-2032
- Figure 111: APAC Agricultural Inoculants Market Revenue (US$ Mn) Market Share by Crop Type in 2022
- Figure 112: APAC Agricultural Inoculants Market Market Attractiveness Analysis by Crop Type , 2016-2032
- Figure 113: APAC Agricultural Inoculants Market Revenue (US$ Mn) Market Share by Country in 2022
- Figure 114: APAC Agricultural Inoculants Market Market Attractiveness Analysis by Country, 2016-2032
- Figure 115: APAC Agricultural Inoculants Market Market Revenue (US$ Mn) (2016-2032)
- Figure 116: APAC Agricultural Inoculants Market Market Revenue (US$ Mn) Comparison by Country (2016-2032)
- Figure 117: APAC Agricultural Inoculants Market Market Revenue (US$ Mn) Comparison by Function (2016-2032)
- Figure 118: APAC Agricultural Inoculants Market Market Revenue (US$ Mn) Comparison by Microorganism (2016-2032)
- Figure 119: APAC Agricultural Inoculants Market Market Revenue (US$ Mn) Comparison by Mode of Application (2016-2032)
- Figure 120: APAC Agricultural Inoculants Market Market Revenue (US$ Mn) Comparison by Crop Type (2016-2032)
- Figure 121: APAC Agricultural Inoculants Market Market Y-o-Y Growth Rate Comparison by Country (2016-2032)
- Figure 122: APAC Agricultural Inoculants Market Market Y-o-Y Growth Rate Comparison by Function (2016-2032)
- Figure 123: APAC Agricultural Inoculants Market Market Y-o-Y Growth Rate Comparison by Microorganism (2016-2032)
- Figure 124: APAC Agricultural Inoculants Market Market Y-o-Y Growth Rate Comparison by Mode of Application (2016-2032)
- Figure 125: APAC Agricultural Inoculants Market Market Y-o-Y Growth Rate Comparison by Crop Type (2016-2032)
- Figure 126: APAC Agricultural Inoculants Market Market Share Comparison by Country (2016-2032)
- Figure 127: APAC Agricultural Inoculants Market Market Share Comparison by Function (2016-2032)
- Figure 128: APAC Agricultural Inoculants Market Market Share Comparison by Microorganism (2016-2032)
- Figure 129: APAC Agricultural Inoculants Market Market Share Comparison by Mode of Application (2016-2032)
- Figure 130: APAC Agricultural Inoculants Market Market Share Comparison by Crop Type (2016-2032)
- Figure 131: Latin America Agricultural Inoculants Market Revenue (US$ Mn) Market Share by Function in 2022
- Figure 132: Latin America Agricultural Inoculants Market Market Attractiveness Analysis by Function , 2016-2032
- Figure 133: Latin America Agricultural Inoculants Market Revenue (US$ Mn) Market Share by Microorganism in 2022
- Figure 134: Latin America Agricultural Inoculants Market Market Attractiveness Analysis by Microorganism , 2016-2032
- Figure 135: Latin America Agricultural Inoculants Market Revenue (US$ Mn) Market Share by Mode of Application in 2022
- Figure 136: Latin America Agricultural Inoculants Market Market Attractiveness Analysis by Mode of Application , 2016-2032
- Figure 137: Latin America Agricultural Inoculants Market Revenue (US$ Mn) Market Share by Crop Type in 2022
- Figure 138: Latin America Agricultural Inoculants Market Market Attractiveness Analysis by Crop Type , 2016-2032
- Figure 139: Latin America Agricultural Inoculants Market Revenue (US$ Mn) Market Share by Country in 2022
- Figure 140: Latin America Agricultural Inoculants Market Market Attractiveness Analysis by Country, 2016-2032
- Figure 141: Latin America Agricultural Inoculants Market Market Revenue (US$ Mn) (2016-2032)
- Figure 142: Latin America Agricultural Inoculants Market Market Revenue (US$ Mn) Comparison by Country (2016-2032)
- Figure 143: Latin America Agricultural Inoculants Market Market Revenue (US$ Mn) Comparison by Function (2016-2032)
- Figure 144: Latin America Agricultural Inoculants Market Market Revenue (US$ Mn) Comparison by Microorganism (2016-2032)
- Figure 145: Latin America Agricultural Inoculants Market Market Revenue (US$ Mn) Comparison by Mode of Application (2016-2032)
- Figure 146: Latin America Agricultural Inoculants Market Market Revenue (US$ Mn) Comparison by Crop Type (2016-2032)
- Figure 147: Latin America Agricultural Inoculants Market Market Y-o-Y Growth Rate Comparison by Country (2016-2032)
- Figure 148: Latin America Agricultural Inoculants Market Market Y-o-Y Growth Rate Comparison by Function (2016-2032)
- Figure 149: Latin America Agricultural Inoculants Market Market Y-o-Y Growth Rate Comparison by Microorganism (2016-2032)
- Figure 150: Latin America Agricultural Inoculants Market Market Y-o-Y Growth Rate Comparison by Mode of Application (2016-2032)
- Figure 151: Latin America Agricultural Inoculants Market Market Y-o-Y Growth Rate Comparison by Crop Type (2016-2032)
- Figure 152: Latin America Agricultural Inoculants Market Market Share Comparison by Country (2016-2032)
- Figure 153: Latin America Agricultural Inoculants Market Market Share Comparison by Function (2016-2032)
- Figure 154: Latin America Agricultural Inoculants Market Market Share Comparison by Microorganism (2016-2032)
- Figure 155: Latin America Agricultural Inoculants Market Market Share Comparison by Mode of Application (2016-2032)
- Figure 156: Latin America Agricultural Inoculants Market Market Share Comparison by Crop Type (2016-2032)
- Figure 157: Middle East & Africa Agricultural Inoculants Market Revenue (US$ Mn) Market Share by Function in 2022
- Figure 158: Middle East & Africa Agricultural Inoculants Market Market Attractiveness Analysis by Function , 2016-2032
- Figure 159: Middle East & Africa Agricultural Inoculants Market Revenue (US$ Mn) Market Share by Microorganism in 2022
- Figure 160: Middle East & Africa Agricultural Inoculants Market Market Attractiveness Analysis by Microorganism , 2016-2032
- Figure 161: Middle East & Africa Agricultural Inoculants Market Revenue (US$ Mn) Market Share by Mode of Application in 2022
- Figure 162: Middle East & Africa Agricultural Inoculants Market Market Attractiveness Analysis by Mode of Application , 2016-2032
- Figure 163: Middle East & Africa Agricultural Inoculants Market Revenue (US$ Mn) Market Share by Crop Type in 2022
- Figure 164: Middle East & Africa Agricultural Inoculants Market Market Attractiveness Analysis by Crop Type , 2016-2032
- Figure 165: Middle East & Africa Agricultural Inoculants Market Revenue (US$ Mn) Market Share by Country in 2022
- Figure 166: Middle East & Africa Agricultural Inoculants Market Market Attractiveness Analysis by Country, 2016-2032
- Figure 167: Middle East & Africa Agricultural Inoculants Market Market Revenue (US$ Mn) (2016-2032)
- Figure 168: Middle East & Africa Agricultural Inoculants Market Market Revenue (US$ Mn) Comparison by Country (2016-2032)
- Figure 169: Middle East & Africa Agricultural Inoculants Market Market Revenue (US$ Mn) Comparison by Function (2016-2032)
- Figure 170: Middle East & Africa Agricultural Inoculants Market Market Revenue (US$ Mn) Comparison by Microorganism (2016-2032)
- Figure 171: Middle East & Africa Agricultural Inoculants Market Market Revenue (US$ Mn) Comparison by Mode of Application (2016-2032)
- Figure 172: Middle East & Africa Agricultural Inoculants Market Market Revenue (US$ Mn) Comparison by Crop Type (2016-2032)
- Figure 173: Middle East & Africa Agricultural Inoculants Market Market Y-o-Y Growth Rate Comparison by Country (2016-2032)
- Figure 174: Middle East & Africa Agricultural Inoculants Market Market Y-o-Y Growth Rate Comparison by Function (2016-2032)
- Figure 175: Middle East & Africa Agricultural Inoculants Market Market Y-o-Y Growth Rate Comparison by Microorganism (2016-2032)
- Figure 176: Middle East & Africa Agricultural Inoculants Market Market Y-o-Y Growth Rate Comparison by Mode of Application (2016-2032)
- Figure 177: Middle East & Africa Agricultural Inoculants Market Market Y-o-Y Growth Rate Comparison by Crop Type (2016-2032)
- Figure 178: Middle East & Africa Agricultural Inoculants Market Market Share Comparison by Country (2016-2032)
- Figure 179: Middle East & Africa Agricultural Inoculants Market Market Share Comparison by Function (2016-2032)
- Figure 180: Middle East & Africa Agricultural Inoculants Market Market Share Comparison by Microorganism (2016-2032)
- Figure 181: Middle East & Africa Agricultural Inoculants Market Market Share Comparison by Mode of Application (2016-2032)
- Figure 182: Middle East & Africa Agricultural Inoculants Market Market Share Comparison by Crop Type (2016-2032)
"
- List of Tables
- "
- Table 1: Global Agricultural Inoculants Market Market Comparison by Function (2016-2032)
- Table 2: Global Agricultural Inoculants Market Market Comparison by Microorganism (2016-2032)
- Table 3: Global Agricultural Inoculants Market Market Comparison by Mode of Application (2016-2032)
- Table 4: Global Agricultural Inoculants Market Market Comparison by Crop Type (2016-2032)
- Table 5: Global Agricultural Inoculants Market Revenue (US$ Mn) Comparison by Region (2016-2032)
- Table 6: Global Agricultural Inoculants Market Market Revenue (US$ Mn) (2016-2032)
- Table 7: Global Agricultural Inoculants Market Market Revenue (US$ Mn) Comparison by Region (2016-2032)
- Table 8: Global Agricultural Inoculants Market Market Revenue (US$ Mn) Comparison by Function (2016-2032)
- Table 9: Global Agricultural Inoculants Market Market Revenue (US$ Mn) Comparison by Microorganism (2016-2032)
- Table 10: Global Agricultural Inoculants Market Market Revenue (US$ Mn) Comparison by Mode of Application (2016-2032)
- Table 11: Global Agricultural Inoculants Market Market Revenue (US$ Mn) Comparison by Crop Type (2016-2032)
- Table 12: Global Agricultural Inoculants Market Market Y-o-Y Growth Rate Comparison by Region (2016-2032)
- Table 13: Global Agricultural Inoculants Market Market Y-o-Y Growth Rate Comparison by Function (2016-2032)
- Table 14: Global Agricultural Inoculants Market Market Y-o-Y Growth Rate Comparison by Microorganism (2016-2032)
- Table 15: Global Agricultural Inoculants Market Market Y-o-Y Growth Rate Comparison by Mode of Application (2016-2032)
- Table 16: Global Agricultural Inoculants Market Market Y-o-Y Growth Rate Comparison by Crop Type (2016-2032)
- Table 17: Global Agricultural Inoculants Market Market Share Comparison by Region (2016-2032)
- Table 18: Global Agricultural Inoculants Market Market Share Comparison by Function (2016-2032)
- Table 19: Global Agricultural Inoculants Market Market Share Comparison by Microorganism (2016-2032)
- Table 20: Global Agricultural Inoculants Market Market Share Comparison by Mode of Application (2016-2032)
- Table 21: Global Agricultural Inoculants Market Market Share Comparison by Crop Type (2016-2032)
- Table 22: North America Agricultural Inoculants Market Market Comparison by Microorganism (2016-2032)
- Table 23: North America Agricultural Inoculants Market Market Comparison by Mode of Application (2016-2032)
- Table 24: North America Agricultural Inoculants Market Market Comparison by Crop Type (2016-2032)
- Table 25: North America Agricultural Inoculants Market Revenue (US$ Mn) Comparison by Country (2016-2032)
- Table 26: North America Agricultural Inoculants Market Market Revenue (US$ Mn) (2016-2032)
- Table 27: North America Agricultural Inoculants Market Market Revenue (US$ Mn) Comparison by Country (2016-2032)
- Table 28: North America Agricultural Inoculants Market Market Revenue (US$ Mn) Comparison by Function (2016-2032)
- Table 29: North America Agricultural Inoculants Market Market Revenue (US$ Mn) Comparison by Microorganism (2016-2032)
- Table 30: North America Agricultural Inoculants Market Market Revenue (US$ Mn) Comparison by Mode of Application (2016-2032)
- Table 31: North America Agricultural Inoculants Market Market Revenue (US$ Mn) Comparison by Crop Type (2016-2032)
- Table 32: North America Agricultural Inoculants Market Market Y-o-Y Growth Rate Comparison by Country (2016-2032)
- Table 33: North America Agricultural Inoculants Market Market Y-o-Y Growth Rate Comparison by Function (2016-2032)
- Table 34: North America Agricultural Inoculants Market Market Y-o-Y Growth Rate Comparison by Microorganism (2016-2032)
- Table 35: North America Agricultural Inoculants Market Market Y-o-Y Growth Rate Comparison by Mode of Application (2016-2032)
- Table 36: North America Agricultural Inoculants Market Market Y-o-Y Growth Rate Comparison by Crop Type (2016-2032)
- Table 37: North America Agricultural Inoculants Market Market Share Comparison by Country (2016-2032)
- Table 38: North America Agricultural Inoculants Market Market Share Comparison by Function (2016-2032)
- Table 39: North America Agricultural Inoculants Market Market Share Comparison by Microorganism (2016-2032)
- Table 40: North America Agricultural Inoculants Market Market Share Comparison by Mode of Application (2016-2032)
- Table 41: North America Agricultural Inoculants Market Market Share Comparison by Crop Type (2016-2032)
- Table 42: Western Europe Agricultural Inoculants Market Market Comparison by Function (2016-2032)
- Table 43: Western Europe Agricultural Inoculants Market Market Comparison by Microorganism (2016-2032)
- Table 44: Western Europe Agricultural Inoculants Market Market Comparison by Mode of Application (2016-2032)
- Table 45: Western Europe Agricultural Inoculants Market Market Comparison by Crop Type (2016-2032)
- Table 46: Western Europe Agricultural Inoculants Market Revenue (US$ Mn) Comparison by Country (2016-2032)
- Table 47: Western Europe Agricultural Inoculants Market Market Revenue (US$ Mn) (2016-2032)
- Table 48: Western Europe Agricultural Inoculants Market Market Revenue (US$ Mn) Comparison by Country (2016-2032)
- Table 49: Western Europe Agricultural Inoculants Market Market Revenue (US$ Mn) Comparison by Function (2016-2032)
- Table 50: Western Europe Agricultural Inoculants Market Market Revenue (US$ Mn) Comparison by Microorganism (2016-2032)
- Table 51: Western Europe Agricultural Inoculants Market Market Revenue (US$ Mn) Comparison by Mode of Application (2016-2032)
- Table 52: Western Europe Agricultural Inoculants Market Market Revenue (US$ Mn) Comparison by Crop Type (2016-2032)
- Table 53: Western Europe Agricultural Inoculants Market Market Y-o-Y Growth Rate Comparison by Country (2016-2032)
- Table 54: Western Europe Agricultural Inoculants Market Market Y-o-Y Growth Rate Comparison by Function (2016-2032)
- Table 55: Western Europe Agricultural Inoculants Market Market Y-o-Y Growth Rate Comparison by Microorganism (2016-2032)
- Table 56: Western Europe Agricultural Inoculants Market Market Y-o-Y Growth Rate Comparison by Mode of Application (2016-2032)
- Table 57: Western Europe Agricultural Inoculants Market Market Y-o-Y Growth Rate Comparison by Crop Type (2016-2032)
- Table 58: Western Europe Agricultural Inoculants Market Market Share Comparison by Country (2016-2032)
- Table 59: Western Europe Agricultural Inoculants Market Market Share Comparison by Function (2016-2032)
- Table 60: Western Europe Agricultural Inoculants Market Market Share Comparison by Microorganism (2016-2032)
- Table 61: Western Europe Agricultural Inoculants Market Market Share Comparison by Mode of Application (2016-2032)
- Table 62: Western Europe Agricultural Inoculants Market Market Share Comparison by Crop Type (2016-2032)
- Table 63: Eastern Europe Agricultural Inoculants Market Market Comparison by Function (2016-2032)
- Table 64: Eastern Europe Agricultural Inoculants Market Market Comparison by Microorganism (2016-2032)
- Table 65: Eastern Europe Agricultural Inoculants Market Market Comparison by Mode of Application (2016-2032)
- Table 66: Eastern Europe Agricultural Inoculants Market Market Comparison by Crop Type (2016-2032)
- Table 67: Eastern Europe Agricultural Inoculants Market Revenue (US$ Mn) Comparison by Country (2016-2032)
- Table 68: Eastern Europe Agricultural Inoculants Market Market Revenue (US$ Mn) (2016-2032)
- Table 69: Eastern Europe Agricultural Inoculants Market Market Revenue (US$ Mn) Comparison by Country (2016-2032)
- Table 70: Eastern Europe Agricultural Inoculants Market Market Revenue (US$ Mn) Comparison by Function (2016-2032)
- Table 71: Eastern Europe Agricultural Inoculants Market Market Revenue (US$ Mn) Comparison by Microorganism (2016-2032)
- Table 72: Eastern Europe Agricultural Inoculants Market Market Revenue (US$ Mn) Comparison by Mode of Application (2016-2032)
- Table 73: Eastern Europe Agricultural Inoculants Market Market Revenue (US$ Mn) Comparison by Crop Type (2016-2032)
- Table 74: Eastern Europe Agricultural Inoculants Market Market Y-o-Y Growth Rate Comparison by Country (2016-2032)
- Table 75: Eastern Europe Agricultural Inoculants Market Market Y-o-Y Growth Rate Comparison by Function (2016-2032)
- Table 76: Eastern Europe Agricultural Inoculants Market Market Y-o-Y Growth Rate Comparison by Microorganism (2016-2032)
- Table 77: Eastern Europe Agricultural Inoculants Market Market Y-o-Y Growth Rate Comparison by Mode of Application (2016-2032)
- Table 78: Eastern Europe Agricultural Inoculants Market Market Y-o-Y Growth Rate Comparison by Crop Type (2016-2032)
- Table 79: Eastern Europe Agricultural Inoculants Market Market Share Comparison by Country (2016-2032)
- Table 80: Eastern Europe Agricultural Inoculants Market Market Share Comparison by Function (2016-2032)
- Table 81: Eastern Europe Agricultural Inoculants Market Market Share Comparison by Microorganism (2016-2032)
- Table 82: Eastern Europe Agricultural Inoculants Market Market Share Comparison by Mode of Application (2016-2032)
- Table 83: Eastern Europe Agricultural Inoculants Market Market Share Comparison by Crop Type (2016-2032)
- Table 84: APAC Agricultural Inoculants Market Market Comparison by Function (2016-2032)
- Table 85: APAC Agricultural Inoculants Market Market Comparison by Microorganism (2016-2032)
- Table 86: APAC Agricultural Inoculants Market Market Comparison by Mode of Application (2016-2032)
- Table 87: APAC Agricultural Inoculants Market Market Comparison by Crop Type (2016-2032)
- Table 88: APAC Agricultural Inoculants Market Revenue (US$ Mn) Comparison by Country (2016-2032)
- Table 89: APAC Agricultural Inoculants Market Market Revenue (US$ Mn) (2016-2032)
- Table 90: APAC Agricultural Inoculants Market Market Revenue (US$ Mn) Comparison by Country (2016-2032)
- Table 91: APAC Agricultural Inoculants Market Market Revenue (US$ Mn) Comparison by Function (2016-2032)
- Table 92: APAC Agricultural Inoculants Market Market Revenue (US$ Mn) Comparison by Microorganism (2016-2032)
- Table 93: APAC Agricultural Inoculants Market Market Revenue (US$ Mn) Comparison by Mode of Application (2016-2032)
- Table 94: APAC Agricultural Inoculants Market Market Revenue (US$ Mn) Comparison by Crop Type (2016-2032)
- Table 95: APAC Agricultural Inoculants Market Market Y-o-Y Growth Rate Comparison by Country (2016-2032)
- Table 96: APAC Agricultural Inoculants Market Market Y-o-Y Growth Rate Comparison by Function (2016-2032)
- Table 97: APAC Agricultural Inoculants Market Market Y-o-Y Growth Rate Comparison by Microorganism (2016-2032)
- Table 98: APAC Agricultural Inoculants Market Market Y-o-Y Growth Rate Comparison by Mode of Application (2016-2032)
- Table 99: APAC Agricultural Inoculants Market Market Y-o-Y Growth Rate Comparison by Crop Type (2016-2032)
- Table 100: APAC Agricultural Inoculants Market Market Share Comparison by Country (2016-2032)
- Table 101: APAC Agricultural Inoculants Market Market Share Comparison by Function (2016-2032)
- Table 102: APAC Agricultural Inoculants Market Market Share Comparison by Microorganism (2016-2032)
- Table 103: APAC Agricultural Inoculants Market Market Share Comparison by Mode of Application (2016-2032)
- Table 104: APAC Agricultural Inoculants Market Market Share Comparison by Crop Type (2016-2032)
- Table 105: Latin America Agricultural Inoculants Market Market Comparison by Function (2016-2032)
- Table 106: Latin America Agricultural Inoculants Market Market Comparison by Microorganism (2016-2032)
- Table 107: Latin America Agricultural Inoculants Market Market Comparison by Mode of Application (2016-2032)
- Table 108: Latin America Agricultural Inoculants Market Market Comparison by Crop Type (2016-2032)
- Table 109: Latin America Agricultural Inoculants Market Revenue (US$ Mn) Comparison by Country (2016-2032)
- Table 110: Latin America Agricultural Inoculants Market Market Revenue (US$ Mn) (2016-2032)
- Table 111: Latin America Agricultural Inoculants Market Market Revenue (US$ Mn) Comparison by Country (2016-2032)
- Table 112: Latin America Agricultural Inoculants Market Market Revenue (US$ Mn) Comparison by Function (2016-2032)
- Table 113: Latin America Agricultural Inoculants Market Market Revenue (US$ Mn) Comparison by Microorganism (2016-2032)
- Table 114: Latin America Agricultural Inoculants Market Market Revenue (US$ Mn) Comparison by Mode of Application (2016-2032)
- Table 115: Latin America Agricultural Inoculants Market Market Revenue (US$ Mn) Comparison by Crop Type (2016-2032)
- Table 116: Latin America Agricultural Inoculants Market Market Y-o-Y Growth Rate Comparison by Country (2016-2032)
- Table 117: Latin America Agricultural Inoculants Market Market Y-o-Y Growth Rate Comparison by Function (2016-2032)
- Table 118: Latin America Agricultural Inoculants Market Market Y-o-Y Growth Rate Comparison by Microorganism (2016-2032)
- Table 119: Latin America Agricultural Inoculants Market Market Y-o-Y Growth Rate Comparison by Mode of Application (2016-2032)
- Table 120: Latin America Agricultural Inoculants Market Market Y-o-Y Growth Rate Comparison by Crop Type (2016-2032)
- Table 121: Latin America Agricultural Inoculants Market Market Share Comparison by Country (2016-2032)
- Table 122: Latin America Agricultural Inoculants Market Market Share Comparison by Function (2016-2032)
- Table 123: Latin America Agricultural Inoculants Market Market Share Comparison by Microorganism (2016-2032)
- Table 124: Latin America Agricultural Inoculants Market Market Share Comparison by Mode of Application (2016-2032)
- Table 125: Latin America Agricultural Inoculants Market Market Share Comparison by Crop Type (2016-2032)
- Table 126: Middle East & Africa Agricultural Inoculants Market Market Comparison by Function (2016-2032)
- Table 127: Middle East & Africa Agricultural Inoculants Market Market Comparison by Microorganism (2016-2032)
- Table 128: Middle East & Africa Agricultural Inoculants Market Market Comparison by Mode of Application (2016-2032)
- Table 129: Middle East & Africa Agricultural Inoculants Market Market Comparison by Crop Type (2016-2032)
- Table 130: Middle East & Africa Agricultural Inoculants Market Revenue (US$ Mn) Comparison by Country (2016-2032)
- Table 131: Middle East & Africa Agricultural Inoculants Market Market Revenue (US$ Mn) (2016-2032)
- Table 132: Middle East & Africa Agricultural Inoculants Market Market Revenue (US$ Mn) Comparison by Country (2016-2032)
- Table 133: Middle East & Africa Agricultural Inoculants Market Market Revenue (US$ Mn) Comparison by Function (2016-2032)
- Table 134: Middle East & Africa Agricultural Inoculants Market Market Revenue (US$ Mn) Comparison by Microorganism (2016-2032)
- Table 135: Middle East & Africa Agricultural Inoculants Market Market Revenue (US$ Mn) Comparison by Mode of Application (2016-2032)
- Table 136: Middle East & Africa Agricultural Inoculants Market Market Revenue (US$ Mn) Comparison by Crop Type (2016-2032)
- Table 137: Middle East & Africa Agricultural Inoculants Market Market Y-o-Y Growth Rate Comparison by Country (2016-2032)
- Table 138: Middle East & Africa Agricultural Inoculants Market Market Y-o-Y Growth Rate Comparison by Function (2016-2032)
- Table 139: Middle East & Africa Agricultural Inoculants Market Market Y-o-Y Growth Rate Comparison by Microorganism (2016-2032)
- Table 140: Middle East & Africa Agricultural Inoculants Market Market Y-o-Y Growth Rate Comparison by Mode of Application (2016-2032)
- Table 141: Middle East & Africa Agricultural Inoculants Market Market Y-o-Y Growth Rate Comparison by Crop Type (2016-2032)
- Table 142: Middle East & Africa Agricultural Inoculants Market Market Share Comparison by Country (2016-2032)
- Table 143: Middle East & Africa Agricultural Inoculants Market Market Share Comparison by Function (2016-2032)
- Table 144: Middle East & Africa Agricultural Inoculants Market Market Share Comparison by Microorganism (2016-2032)
- Table 145: Middle East & Africa Agricultural Inoculants Market Market Share Comparison by Mode of Application (2016-2032)
- Table 146: Middle East & Africa Agricultural Inoculants Market Market Share Comparison by Crop Type (2016-2032)
- 1. Executive Summary
-
- Corteva Inc (U.S.)
- BASF SE (Germany)
- Bayer AG (Germany)
- Novozymes A/S (Denmark)
- Brett Young (Canada)
- Rizobacter Argentina S.A. (Argentina)
- Italpollina S.p.A. (Italy)
- Advanced Biological Marketing Inc. (U.S.)
- Soil Technologies Corporation (U.S.)
- Verdesian Life Sciences LLC (U.S.)
Our Clients


View Our Licence Options
