Oilseeds Market By Oilseed Type (Sunflower, Soybean, Sesame, Cottonseed, Rapeseed, Other), By Product (Animal Feed and Edible Oil), By Breeding (Genetically Modified and Conventional), By Region And Companies - Industry Segment Outlook, Market Assessment, Competition Scenario, Trends, And Forecast 2024-2033
-
6963
-
August 2024
-
300
-


-
This report was compiled by Shreyas Rokade Shreyas Rokade is a seasoned Research Analyst with CMFE, bringing extensive expertise in market research and consulting, with a strong background in Chemical Engineering. Correspondence Team Lead-CMFE Linkedin | Detailed Market research Methodology Our methodology involves a mix of primary research, including interviews with leading mental health experts, and secondary research from reputable medical journals and databases. View Detailed Methodology Page
-
Quick Navigation
Report Overview
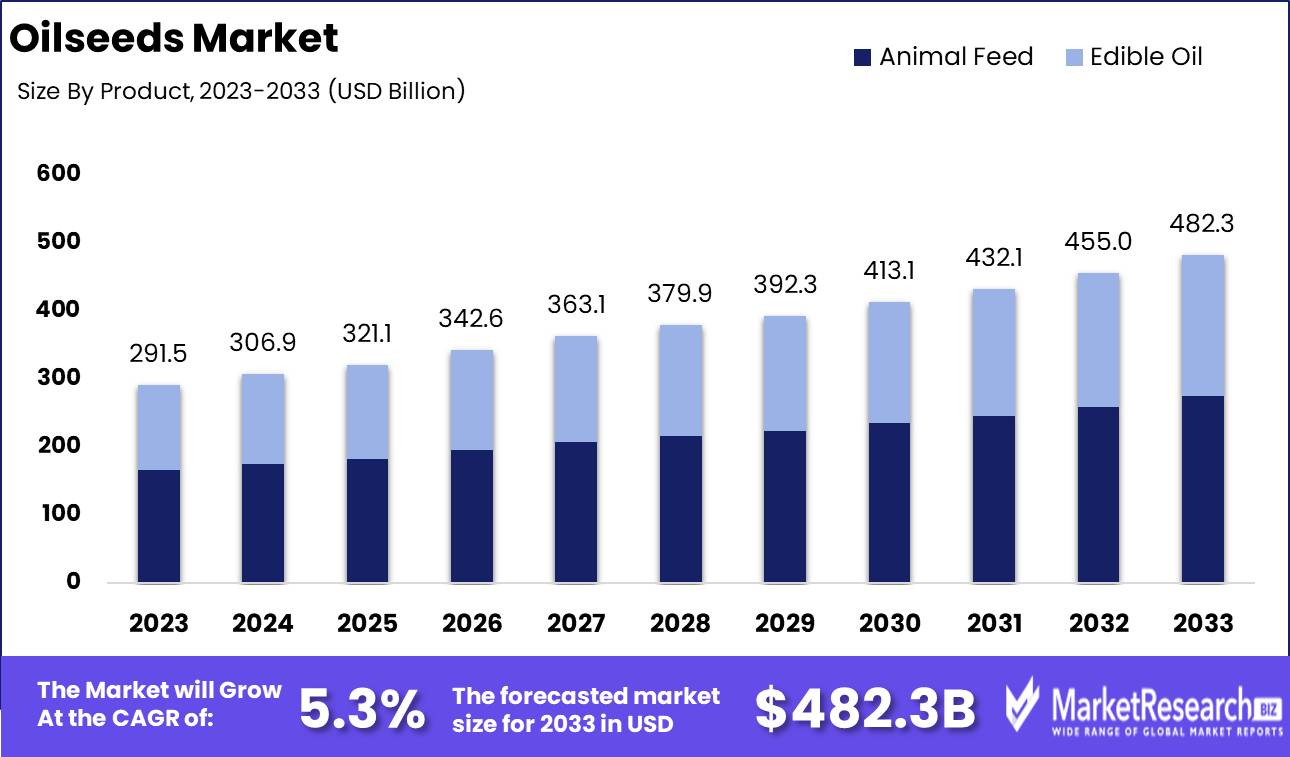
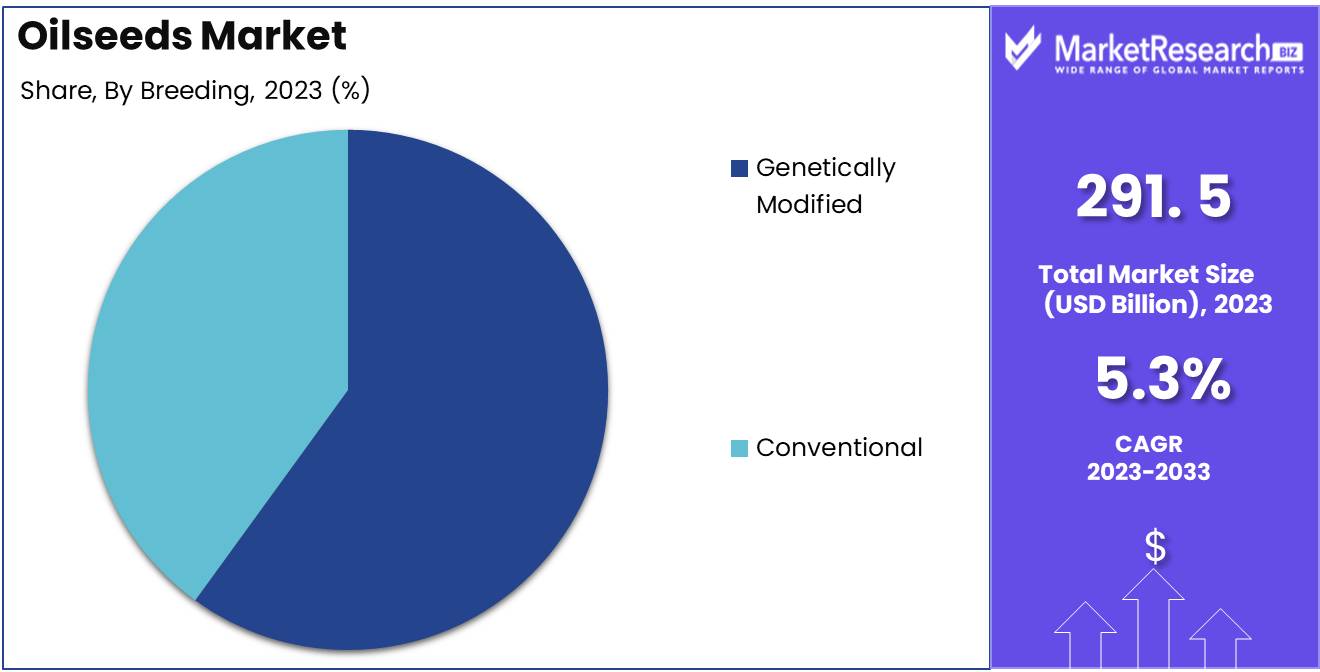
The Oilseeds Market was valued at USD 291.5 billion in 2023. It is expected to reach USD 482.3 billion by 2033, with a CAGR of 5.3% during the forecast period from 2024 to 2033.
The objective of the oilseeds market is to meet the rising global demand for oils and their byproducts. This market focuses on the cultivation of specific seed varieties optimized for oil extraction, ensuring high-quality oil and satisfying the diverse needs of industries and consumers around the globe.
Due to its adaptability and breadth of applications, the oilseeds market is of utmost importance. Primarily, it is a significant source of consumable oils, which serve as dietary staples for millions of people around the world. In addition, oilseeds play a significant role in the production of biofuels, which contributes to the pursuit of greener and more sustainable energy sources.
Due to technological advancements, the oilseeds market has witnessed remarkable innovations. The genetic modification of seeds to increase oil content and improve crop yield is a significant development. This innovation has enabled farmers to produce more oilseeds with fewer resources, thereby minimizing environmental impact and boosting productivity.
The oilseeds market has attracted substantial public and private sector investments. Numerous businesses have recognized the growth and profit potential of this market, which has led to the establishment of large-scale oilseed processing facilities and research and development centers. These investments have paved the way for oilseeds and their byproducts to be incorporated into a variety of products and services.
Numerous industries have made substantial investments in the development of the oilseeds market because they recognize its potential. Manufacturers of food and beverages rely on a steady supply of high-quality oils to produce their products. Additionally, oilseeds are utilized by the cosmetics industry for the production of skin care and beautification products. In addition, the pharmaceutical industry uses oilseeds in the production of numerous medications.
Key Takeaways
- Market Growth: The Oilseeds Market was valued at USD 291.5 billion in 2023. It is expected to reach USD 482.3 billion by 2033, with a CAGR of 5.3% during the forecast period from 2024 to 2033.
- By Oilseed Type: Sunflower dominated the Oilseeds Market with high demand.
- By Product: Animal Feed dominated the Oilseeds Market, outpacing Edible Oil.
- By Breeding: Genetically Modified oilseeds dominated the Oilseeds Market segment.
- Regional Dominance: Asia Pacific leads the global oilseeds market with a 45% largest share.
- Growth Opportunity: The global oilseeds market is poised for growth, supported by advancements in biotechnology and strategic market diversification.
Driving factors
Growing Demand for Vegetable Oils and Foods Rich in Protein
The escalating global demand for vegetable oils and protein-rich foods has been a major catalyst for the growth of the oilseeds market. As consumer preferences shift towards healthier diets, the demand for vegetable oils, which are commonly derived from oilseeds such as soybeans, sunflowers, and canola, has surged. According to recent industry reports, the global vegetable oil market is expected to reach USD 267.6 billion by 2028, driven by increased consumption of plant-based oils in cooking and food processing. This heightened demand for vegetable oils directly propels the oilseeds market, as oilseeds are the primary raw materials used in producing these oils.
Moreover, the rising interest in protein-rich diets, including plant-based protein sources, further boosts the demand for oilseeds. Oilseeds are integral to the production of protein-rich meals and snacks, catering to the growing segment of health-conscious and vegetarian consumers. The global plant-based protein market, which encompasses oilseed-derived proteins, is projected to grow at a compound annual growth rate (CAGR) of 7.5% from 2023 to 2030. This growth reflects a broader trend towards plant-based diets and contributes significantly to the expansion of the oilseeds market.
Industry Expansion in the Food and Beverage Sector
The expansion of the food and beverage sector has notably influenced the growth of the oilseeds market. As the global population increases and urbanization accelerates, there is a greater demand for processed and packaged foods, which frequently utilize vegetable oils and oilseed derivatives. The food and beverage industry's growth is closely tied to the increasing consumption of ready-to-eat meals, snacks, and baked goods, all of which require substantial quantities of vegetable oils for production.
Statistics indicate that the global food and beverage sector is projected to reach USD 8.3 trillion by 2026. This expansion creates a robust market for oilseeds, as manufacturers require a steady supply of oilseed products to meet production needs. The demand for oilseeds in the food industry is also driven by the need for cost-effective and versatile ingredients that can enhance the flavor, texture, and shelf-life of food products. Consequently, the burgeoning food and beverage sector underpins sustained growth in the oilseeds market.
Technological Advances in Oilseed Cultivation and Processing
Technological advancements in oilseed cultivation and processing have significantly contributed to the growth of the oilseeds market. Innovations such as genetically modified (GM) crops, precision agriculture, and advanced processing techniques have enhanced crop yields, reduced production costs, and improved oil extraction efficiency. These technological improvements have made oilseed farming more productive and sustainable, addressing challenges such as pest management, soil health, and climate variability.
For instance, the adoption of GM oilseed varieties, such as herbicide-tolerant soybeans, has increased resistance to pests and diseases, leading to higher yields. Furthermore, advancements in processing technologies, including solvent extraction and cold pressing, have optimized oil extraction and quality. As a result, the oilseeds market benefits from increased supply and reduced production costs, which contribute to its overall growth.
Restraining Factors
Impact of Commodity Price Fluctuations on Oilseeds Market Growth
Changes in commodity prices significantly affect the oilseeds market by influencing production costs and market stability. Fluctuations in global commodity prices, particularly for inputs like fertilizers and energy, can lead to increased operational costs for oilseed producers. These cost increases can, in turn, result in higher prices for oilseeds and their derivatives, impacting consumer demand and market growth.
For instance, if the price of fertilizers rises, oilseed producers may face higher production costs, which could reduce profit margins or lead to higher prices for end products. This scenario could suppress demand, especially in price-sensitive markets. Conversely, if commodity prices drop, it could temporarily boost production and lower prices, potentially increasing market consumption but affecting producer revenues negatively.
The volatility in commodity prices creates uncertainty in investment decisions and can impact long-term planning and production stability within the oilseeds sector. This instability can hinder market growth by creating an unpredictable business environment for producers and investors.
Challenges in Pest and Disease Management Affecting Oilseeds Market Expansion
Pest and disease control issues are critical factors restraining the growth of the oilseeds market. The presence of pests and diseases can severely impact crop yields and quality, leading to reduced production volumes and increased costs for pest management solutions.
Outbreaks of pests and diseases can lead to significant crop losses, which directly affects the supply chain and can cause price increases for oilseeds. These supply disruptions can lead to market instability and reduced consumer confidence. Additionally, the cost of implementing effective pest and disease control measures adds to the overall expense of oilseed production, further impacting profitability and market growth.
By Oilseed Type Analysis
In 2023, Sunflower dominated the Oilseeds Market with high demand.
In 2023, Sunflower held a dominant market position in the By Oilseed Type segment of the Oilseeds Market. Sunflower seeds are renowned for their high oil content and favorable fatty acid profile, which has driven their widespread adoption in various food and industrial applications. This has contributed to their leading position in the market. The sunflower oil's light flavor and high smoke point make it a preferred choice for cooking and frying, further bolstering its demand. Additionally, the oil's use in salad dressings and as an ingredient in processed foods underscores its versatility.
Soybeans followed closely, driven by their significant role in animal feed and their high protein content, which supports its substantial demand in the livestock industry. Sesame seeds are valued for their distinctive flavor and nutritional benefits, including high levels of essential fatty acids and antioxidants. Cottonseed and Rapeseed oils also occupy significant market shares, with cottonseed oil known for its stability and rapeseed oil appreciated for its low saturated fat content. Other oilseeds, including niche varieties, contribute to the market, although they represent a smaller segment compared to the aforementioned types.
By Product Analysis
In 2023, Animal Feed dominated the Oilseeds Market, outpacing Edible Oil.
In 2023, Animal Feed held a dominant market position in the Oilseeds Market. This segment's prominence can be attributed to the rising global demand for livestock products, which drives the need for high-quality animal feed. Oilseeds, particularly soybeans, and canola, are crucial in animal feed formulations due to their high protein content, which supports the growth and health of various livestock species. This segment benefits from the expansion of the livestock sector and increasing meat consumption worldwide.
Conversely, Edible Oil also represents a significant segment of the Oilseeds Market. The demand for edible oils, such as soybean oil, canola oil, and sunflower oil, has been propelled by changing consumer preferences toward healthier cooking oils and the growing food industry. The rise in health-conscious eating habits and the expansion of the processed food sector have significantly boosted the demand for edible oils. Both segments contribute substantially to the overall market dynamics, with Animal Feed maintaining a larger share due to its essential role in agriculture and food production.
By Breeding Analysis
In 2023, Genetically Modified oilseeds dominated the Oilseeds Market segment.
In 2023, Genetically Modified (GM) oilseeds held a dominant market position in the Breeding segment of the Oilseeds Market. This dominance can be attributed to the increasing adoption of GM crops due to their enhanced traits such as improved resistance to pests, diseases, and environmental stresses, which significantly boosts yield and profitability for farmers. GM oilseeds, particularly soybeans, canola, and corn, are engineered to withstand herbicides and insects, offering farmers the advantage of reduced pesticide usage and higher crop productivity. This has led to their widespread acceptance and preference in various agricultural regions, particularly in North America and South America, where large-scale commercial farming practices are prevalent.
In contrast, Conventional oilseeds, while still holding a portion of the market, face growing challenges due to the lower yields and higher susceptibility to pests and diseases compared to their genetically modified counterparts. Conventional breeding methods do not offer the same level of resistance or productivity enhancements, which impacts their competitiveness in the modern agricultural landscape. Thus, the shift towards GM oilseeds continues to shape the market dynamics in favor of genetically modified varieties.
Key Market Segments
By Oilseed Type
- Sunflower
- Soybean
- Sesame
- Cottonseed
- Rapeseed
- Other
By Product
- Animal Feed
- Edible Oil
By Breeding
- Genetically Modified
- Conventional
Growth Opportunity
Utilizing Advances in Genetic Engineering and Biotechnology
One of the most significant opportunities in the oilseeds market lies in the application of genetic engineering and biotechnology. Advances in these fields are enabling the development of high-yield, disease-resistant, and climate-resilient oilseed varieties. These innovations are critical as they address challenges related to crop productivity and sustainability. Genetically modified (GM) oilseeds can offer improved nutritional profiles and higher oil content, meeting the rising demand for healthier and more efficient oilseed products. Companies investing in biotechnological research and development are well-positioned to capture substantial market share by introducing innovative products that enhance agricultural productivity and sustainability.
Market Diversification and Niche Market Opportunities
Another promising avenue for growth is market diversification and the exploration of niche market opportunities. The oilseeds sector is increasingly focusing on diversifying its product offerings to cater to specialized markets, such as plant-based oils and biofuels. Additionally, there is a growing demand for organic and non-GMO oilseed products, driven by consumer preferences for healthier and more sustainable options. Companies that successfully tap into these niche segments can differentiate themselves from competitors and capitalize on the expanding market for premium and specialized oilseed products.
Latest Trends
Rising Demand for Edible Oils
The Oilseeds Market is experiencing significant growth driven by an increasing global demand for edible oils. This surge is largely attributed to the rising consumption of vegetable oils in developing economies, where urbanization and changing lifestyles are driving higher food consumption.
Additionally, the growth of the food processing industry, which utilizes oilseeds for the production of various edible oils, is contributing to this trend. Major oilseed-producing countries, including Brazil, the United States, and Argentina, are expanding their production capacities to meet this demand. Innovations in extraction technologies and the development of high-yielding oilseed varieties are further expected to boost supply and stabilize prices.
Health-Conscious Consumer Trends
A notable trend influencing the Oilseeds Market is the shift toward health-conscious consumer behavior. As awareness of the health benefits of various oils increases, consumers are increasingly seeking products that offer nutritional advantages. This trend is prompting a rise in the consumption of oils rich in omega-3 and omega-6 fatty acids, such as flaxseed and canola oil. The market is witnessing a growing preference for non-GMO and organic oilseed products, reflecting broader concerns about health and sustainability.
Furthermore, the impact of diet-related health issues, such as cardiovascular diseases and obesity, is driving demand for healthier oil alternatives. Companies are responding to these trends by introducing products that cater to the health-conscious consumer, thereby shaping the market dynamics.
Regional Analysis
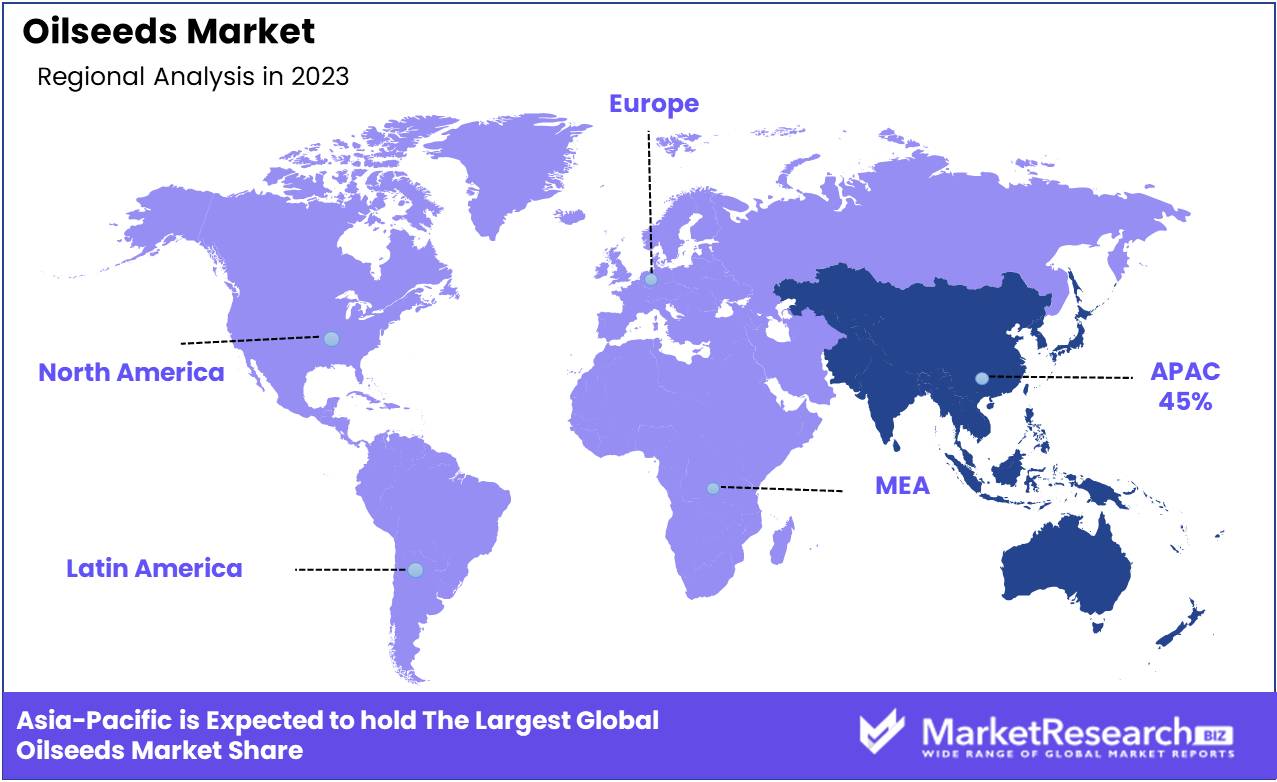
Asia Pacific leads the global oilseeds market with a 45% largest share.
The global oilseeds market exhibits significant regional variations, driven by diverse agricultural practices and consumption patterns. North America holds a substantial share of the market, with the United States and Canada being major producers. In 2023, North America accounted for approximately 22% of global oilseeds production, driven by the extensive cultivation of soybeans and canola.
Europe represents a key region in the oilseeds market, contributing around 18% to global production. The European Union's focus on sustainable agriculture and crop diversification supports a steady output of rapeseed and sunflower seeds.
Asia Pacific dominates the oilseeds market, with a notable largest market share of approximately 45%. This dominance is attributed to major producers like China and India, which together account for a significant portion of global oilseeds output. The region's rapid industrialization and growing population drive both production and consumption.
Middle East & Africa contributes around 8% to the global market, with oilseed production primarily focused on sunflowers and soybeans in select countries. Latin America holds about 12% of the global market, with Brazil and Argentina leading in soybean production.
Key Regions and Countries
North America
- The US
- Canada
- Rest of North America
Europe
- Germany
- France
- The UK
- Spain
- Netherlands
- Russia
- Italy
- Rest of Europe
Asia-Pacific
- China
- Japan
- Singapore
- Thailand
- South Korea
- Vietnam
- India
- New Zealand
- Rest of Asia Pacific
Latin America
- Mexico
- Brazil
- Rest of Latin America
Middle East & Africa
- Saudi Arabia
- South Africa
- UAE
- Rest of the Middle East & Africa
Key Players Analysis
The global oilseeds market will be shaped by several key players that leverage their expertise and resources to drive growth and innovation. Leading the charge is Cargill Incorporated (U.S.), renowned for its extensive supply chain network and significant investments in technology and sustainability. Cargill's commitment to enhancing the efficiency and environmental impact of oilseed production positions it as a major influence in the market.
Dow (U.S.) and BASF SE (Germany) continue to be pivotal, offering advanced solutions in agrochemicals that enhance oilseed yield and resilience. Dow’s innovations in crop protection and BASF's advancements in genetic crop modification and crop protection products underscore their strategic importance in optimizing oilseed production.
DuPont (U.S.) and Evonik Industries AG (Germany) contribute through their focus on agricultural biotechnology and nutritional solutions. DuPont’s emphasis on seed development and Evonik’s expertise in feed additives play a crucial role in improving oilseed productivity and feed efficiency. Chr. Hansen Holding A/S (Denmark) and DSM (Netherlands) bring critical expertise in natural ingredients and fermentation technologies, essential for enhancing oilseed quality and processing.
Charoen Pokphand Foods PCL (Thailand) and SunOpta (Canada) leverage their regional strengths to supply high-quality oilseed products across various markets. Charoen Pokphand’s extensive distribution network and SunOpta’s focus on organic and non-GMO oilseeds highlight their market relevance. European players like Nutreco, ForFarmers, and De Heus Animal Nutrition (Netherlands) maintain a strong presence with their emphasis on animal nutrition and feed solutions, crucial for integrating oilseeds into the agricultural supply chain.
Market Key Players
- Cargill Incorporated (U.S.)
- Dow (U.S.)
- BASF SE (Germany)
- Chr. Hansen Holding A/S (Denmark)
- DSM (Netherlands)
- DuPont (U.S.)
- Evonik Industries AG (Germany)
- NOVUS INTERNATIONAL (U.S.)
- Alltech (Nicholasville)
- Associated British Foods plc (U.K.)
- Charoen Pokphand Foods PCL (Thailand)
- Nutreco (Netherlands)
- ForFarmers. (Netherlands)
- De Heus Animal Nutrition (Netherlands)
- Land O'Lakes (U.S.)
- Kent Nutrition Group (U.S.)
- J. D. HEISKELL & CO. (U.S.)
- Perdue Farms (U.S.)
- SunOpta (Canada)
- Scratch Peck Feeds (U.S.)
- De Heus Animal Nutrition (Netherlands)
- MEGAMIX (Russia)
- Agrofeed (Hungary)
Recent Development
- In June 2024, Archer Daniels Midland Company (ADM) announced the expansion of its oilseeds processing operations in Egypt. This strategic move aims to enhance ADM's supply chain capabilities and meet the increasing demand for oilseed products in the Middle East and North Africa region.
- In May 2024, Cargill inaugurated a new biodiesel production facility in Mato Grosso, Brazil. This plant will utilize oilseeds like soybeans to produce biodiesel, supporting Brazil's renewable energy initiatives and expanding Cargill's footprint in the biofuels market.
- In April 2024, Bunge Limited entered into a joint venture with BP to develop sustainable aviation fuel (SAF) derived from oilseeds. This collaboration focuses on leveraging Bunge's extensive oilseeds processing infrastructure and BP's expertise in fuel technology to produce SAF, targeting the aviation industry's shift towards greener alternatives.
Report Scope
Report Features Description Market Value (2023) USD 291.5 Billion Forecast Revenue (2033) USD 482.3 Billion CAGR (2024-2032) 5.3% Base Year for Estimation 2023 Historic Period 2016-2023 Forecast Period 2024-2033 Report Coverage Revenue Forecast, Market Dynamics, COVID-19 Impact, Competitive Landscape, Recent Developments Segments Covered By Oilseed Type (Sunflower, Soybean, Sesame, Cottonseed, Rapeseed, Other), By Product (Animal Feed and Edible Oil), By Breeding (Genetically Modified and Conventional) Regional Analysis North America - The US, Canada, Rest of North America, Europe - Germany, France, The UK, Spain, Italy, Russia, Netherlands, Rest of Europe, Asia-Pacific - China, Japan, South Korea, India, New Zealand, Singapore, Thailand, Vietnam, Rest of Asia Pacific, Latin America - Brazil, Mexico, Rest of Latin America, Middle East & Africa - South Africa, Saudi Arabia, UAE, Rest of Middle East & Africa Competitive Landscape Cargill Incorporated (U.S.), Dow (U.S.), BASF SE (Germany), Chr. Hansen Holding A/S (Denmark), DSM (Netherlands), DuPont (U.S.), Evonik Industries AG (Germany), NOVUS INTERNATIONAL (U.S.), Alltech (Nicholasville), Associated British Foods plc (U.K.), Charoen Pokphand Foods PCL (Thailand), Nutreco (Netherlands), ForFarmers. (Netherlands), De Heus Animal Nutrition (Netherlands), Land O'Lakes (U.S.), Kent Nutrition Group (U.S.), J. D. HEISKELL & CO. (U.S.), Perdue Farms (U.S.), SunOpta (Canada), Scratch Peck Feeds (U.S.), De Heus Animal Nutrition (Netherlands), MEGAMIX (Russia), Agrofeed (Hungary) Customization Scope Customization for segments at the regional/country level will be provided. Moreover, additional customization can be done based on the requirements. Purchase Options We have three licenses to opt for Single User License, Multi-User License (Up to 5 Users), Corporate Use License (Unlimited User and Printable PDF) -
-
- Cargill Incorporated (U.S.)
- Dow (U.S.)
- BASF SE (Germany)
- Chr. Hansen Holding A/S (Denmark)
- DSM (Netherlands)
- DuPont (U.S.)
- Evonik Industries AG (Germany)
- NOVUS INTERNATIONAL (U.S.)
- Alltech (Nicholasville)
- Associated British Foods plc (U.K.)
- Charoen Pokphand Foods PCL (Thailand)
- Nutreco (Netherlands)
- ForFarmers. (Netherlands)
- De Heus Animal Nutrition (Netherlands)
- Land O'Lakes (U.S.)
- Kent Nutrition Group (U.S.)
- J. D. HEISKELL & CO. (U.S.)
- Perdue Farms (U.S.)
- SunOpta (Canada)
- Scratch Peck Feeds (U.S.)
- De Heus Animal Nutrition (Netherlands)
- MEGAMIX (Russia)
- Agrofeed (Hungary)
Our Clients


View Our Licence Options
