
Achondroplasia Market By Treatment (Surgery, Growth Hormone Therapy, Supportive Therapy, Vosoritide), By Route of Administration (Oral, Parenteral), By End-User (Hospitals & Clinics, Homecare, Speciality Centers, Other), By Region And Companies - Industry Segment Outlook, Market Assessment, Competition Scenario, Trends, And Forecast 2024-2033
-
38274
-
April 2024
-
285
-


-
This report was compiled by Trishita Deb Trishita Deb is an experienced market research and consulting professional with over 7 years of expertise across healthcare, consumer goods, and materials, contributing to over 400 healthcare-related reports. Correspondence Team Lead- Healthcare Linkedin | Detailed Market research Methodology Our methodology involves a mix of primary research, including interviews with leading mental health experts, and secondary research from reputable medical journals and databases. View Detailed Methodology Page
-
Quick Navigation
Report Overview
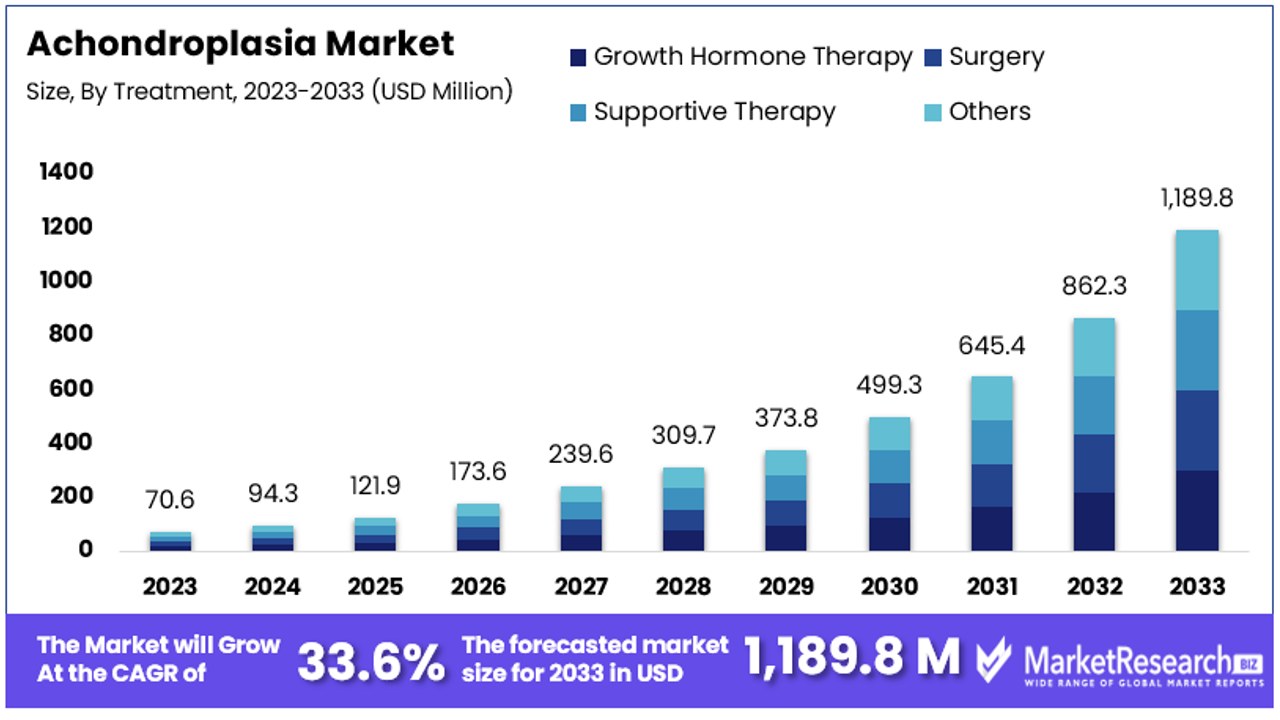
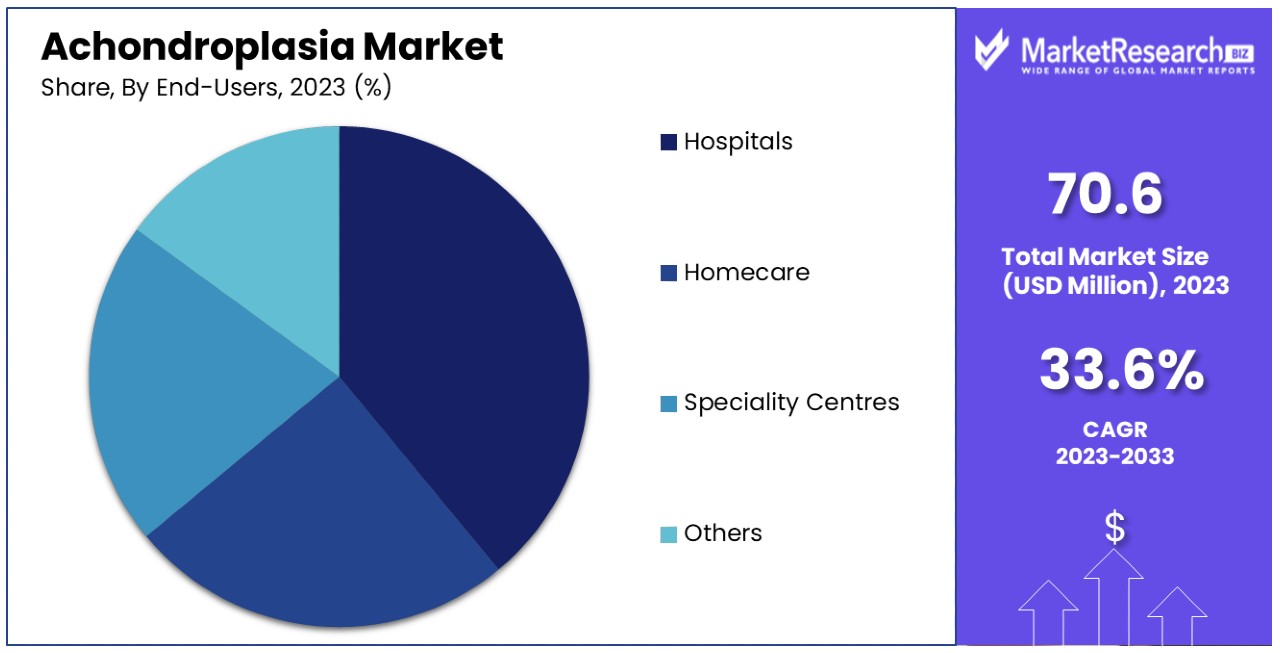
The Global Achondroplasia Market size is expected to be worth around USD 1,189.8 Million by 2033, from USD 70.6 Million in 2023, growing at a CAGR of 33.60% during the forecast period from 2024 to 2033.
The surge in demand for advanced treatments and medications is one of the main driving factors for the achondroplasia market expansion. Achondroplasia is a rare type of genetic bone disorder. It is recognized as the most common skeletal dysplasia in human bodies. Achondroplasia accounts for more than 90% of cases of uneven short stature, which is called dwarfism.
Such a condition is caused by a mutation in the transmembrane section of the fibroblast growth factor receptor 3, which is also known as FGFR3. It monitors an autosomal dominant way for the legacy with 100% penetrance. The FGFR3 gene guides the body to create the necessary proteins for bone growth and maintenance. The mutation in the FGFR3 gene leads to the protein becoming overactive and obstructing normal skeletal formation.
Achondroplasia in children is very common, as it does not let cartilage transform into a normal bone. This leads to the formation of short arms and legs with a large head. According to the National Center for Biotechnology Information in August 2023, there are over 80% of cases where the condition prevails due to sporadic mutations, which cause children to be born with achondroplasia with no genetic medical history of the disorder among the parents.
Moreover, 20% of achondroplastic people have at least one affected parent. The risk to the children of people with achondroplasia of inheriting a mutated replica of the FGFR3 gene is 50%. When both individuals are affected by this condition, their children or offspring have a 1 out of 4 chance of having normal height, a 1 in 2 chance of having heterozygous achondroplasia, and a 1 in 4 chance of having homozygous achondroplasia.
Achondroplasia can be examined before birth by fetal ultrasound. This diagnosis uses sound waves and a computer to analyze and develop images of the baby that is growing inside the womb. DNA testing will also be done before the birth to check fetal ultrasound outcomes. There is no treatment for the children or individuals affected by achondroplasia.
But some doctors are using growth hormones to boost the growth rate of a child’s bones. Regular health checks and proper medication help deal with achondroplasia. The demand for the achondroplasia market will increase due to the sudden rise in achondroplasia cases, which will help in market expansion in the coming years.
Key Takeaways
- Market Value: The Achondroplasia Market is expected to reach USD 1,189.8 Million by 2033, exhibiting significant growth from USD 70.6 Million in 2023, with a notable CAGR of 33.60% during the forecast period from 2024 to 2033.
- Dominant Segments:
- Growth Hormone Therapy commands a 27% share, playing a pivotal role in managing achondroplasia by stimulating bone growth.
- Parenteral Route of Administration prevails due to the administration of growth hormone therapy via injections.
- Hospitals lead as the primary end-user segment, providing comprehensive care including diagnosis, treatment, and management.
- Hospital Pharmacies dominate distribution channels, ensuring immediate access to prescribed therapies, especially in hospital settings.
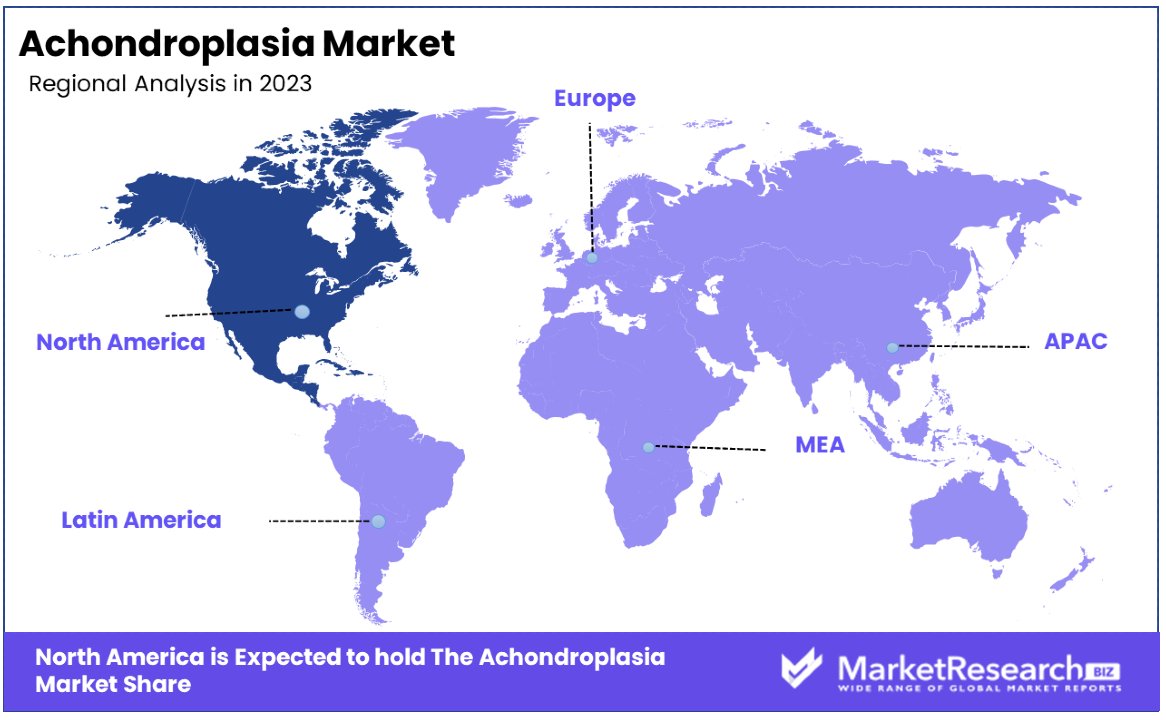
- Regional Dynamics: North America dominates with a 36% market share, followed closely by Europe at approximately 29%, driven by strong healthcare systems and significant research activities.
- Key Players: Pfizer Inc., Novartis AG, Eli Lilly and Company, among others, are key players shaping the achondroplasia market landscape. These players contribute to market growth through research, development, and the provision of therapeutic solutions.
- Analyst Viewpoint: Analysts anticipate continued growth in the achondroplasia market, driven by advancements in treatment modalities, increased awareness, and expanding research efforts.
- Growth Opportunities:
- The market offers opportunities for innovation in treatment modalities, especially in supportive therapies and surgical interventions.
- Expanding into emerging markets and leveraging digital health technologies could further drive market growth and accessibility to treatments
Driving Factors
Increasing Awareness and Early Diagnosis Drives Market Growth
The growth of the Achondroplasia Market is significantly propelled by heightened awareness and the prioritization of early diagnosis. In recent years, efforts to increase awareness among healthcare professionals and the general public have been fruitful, leading to a higher rate of early detection. This awareness enables early interventions, improving patient outcomes and stimulating demand for tailored treatments and management strategies.
Statistics indicate that early diagnosis facilitates better management of symptoms, reducing long-term complications and improving quality of life for those affected. Moreover, this trend has encouraged investments in research and development, aiming to meet the rising demand for effective solutions. The convergence of increased awareness and early diagnosis not only amplifies the need for specialized healthcare services but also fosters a more informed and prepared community, ready to address the challenges of achondroplasia.
Advancements in Genetic Testing and Prenatal Screening Fuel Market Expansion
Advancements in genetic testing and prenatal screening have revolutionized the detection of achondroplasia, offering profound implications for market growth. With the refinement of prenatal screening techniques, such as chorionic villus sampling (CVS) and amniocentesis, the detection of the FGFR3 gene mutation—responsible for achondroplasia—has become more accessible and accurate.
This technological progress has enabled early intervention strategies and personalized care plans from birth, significantly impacting the market by increasing the demand for specialized prenatal and postnatal services. The ability to identify achondroplasia prenatally allows for a proactive healthcare approach, enhancing the demand for innovative treatment options and supporting services. Consequently, this factor not only contributes to the direct expansion of the market but also catalyzes further research and development efforts aimed at addressing the unique needs of this population.
Development of Targeted Therapies Catalyzes Market Innovation
The exploration and development of targeted therapies represent a pivotal shift in the Achondroplasia Market, driving substantial growth through innovation. Current research initiatives focus on addressing the genetic roots of achondroplasia, with companies like BioMarin Pharmaceutical and QED Therapeutics at the forefront of developing novel therapeutic solutions. These targeted therapies aim to correct the disproportionate growth characteristics and alleviate associated health complications, offering hope for a significant improvement in patient quality of life.
Although still under development, these therapeutic approaches signify a major advancement in treatment paradigms, promising to transform patient care and management. The focus on targeted therapies not only underscores the market's evolution towards more effective and personalized treatment options but also highlights the industry's commitment to addressing the comprehensive needs of individuals with achondroplasia. This focus encourages ongoing investment in research and development, further fueling market growth and innovation.
Restraining Factors
High Cost of Treatments and Interventions Restrains Market Growth
The Achondroplasia Market faces significant growth constraints due to the high costs associated with treatments and interventions. For many affected families, the financial burden of growth hormone therapy, surgical procedures, and other necessary interventions is daunting. In regions lacking comprehensive healthcare coverage or subsidized care, these costs become prohibitive, limiting the willingness or ability of patients to seek out advanced treatments.
This financial barrier not only impacts the direct adoption of current treatments but also potentially stifles demand for new, innovative therapies that may come at an even higher cost. Consequently, the high cost of treatments directly limits the market's expansion, as it restricts the patient population that can afford these critical care options, thus hindering overall market growth.
Limited Awareness and Access in Developing Regions Restrains Market Growth
In developing regions, the growth of the Achondroplasia Market is further restrained by limited awareness and access to diagnosis and treatment. Despite increasing global awareness, many developing countries still face challenges such as inadequate healthcare infrastructure, scarcity of genetic testing facilities, and socio-economic barriers.
These challenges lead to underdiagnosis and limited access to essential care and support for individuals with achondroplasia. The lack of awareness and resources not only affects the ability of patients to receive timely and effective treatment but also impacts the market's potential for growth in these regions. The unmet needs in developing countries represent a significant gap in the market, limiting the expansion of the achondroplasia treatment and care ecosystem globally.
Treatment Analysis
Growth Hormone Therapy Dominates Achondroplasia Market with 27% Share
In the Achondroplasia Market, the treatment segment is integral to understanding the landscape of therapeutic options available and their market dynamics. Among these, Growth Hormone Therapy emerges as the dominant sub-segment. This therapy plays a pivotal role in managing achondroplasia by stimulating bone growth and improving the stature of individuals affected by this genetic condition. Its prominence in the market is attributed to the tangible outcomes it delivers in terms of height increase and the improvement of proportional discrepancies, making it a highly sought-after treatment option for achondroplasia patients.
Surgery, another significant sub-segment, includes procedures aimed at correcting specific abnormalities associated with achondroplasia, such as spinal stenosis and limb lengthening. Although impactful, surgeries are typically reserved for severe cases due to their invasive nature and the risks involved. Supportive Therapy encompasses a range of non-invasive treatments such as physical therapy, occupational therapy, and counseling, which are crucial for enhancing the quality of life of individuals with achondroplasia but don't directly influence growth as hormone therapy does. The "Others" category includes emerging treatments and interventions still under research or in early stages of adoption, which could potentially reshape the market landscape in the future.
Surgery and supportive therapy segments, while not as large as growth hormone therapy, contribute to the market by offering essential interventions for managing complications and improving the functionality and well-being of patients. These treatments address the multifaceted needs of achondroplasia patients, underscoring the importance of a comprehensive treatment approach that includes both medical and supportive care.
Route of Administration Analysis
Parenteral Route Prevails in Achondroplasia Treatment Market
In the Route of Administration segment, Parenteral is the dominant sub-segment, primarily due to the administration of growth hormone therapy, which is typically delivered through injections. This method's prevalence is closely linked to the effectiveness of growth hormone therapy in managing achondroplasia, making parenteral administration a critical component of the treatment landscape. Oral administration, while convenient and less invasive, currently plays a secondary role in the achondroplasia market, largely because the key therapies for achondroplasia, including growth hormone, do not have oral formulations.
The dominance of the parenteral route in the achondroplasia market is reinforced by advancements in injection devices and techniques that aim to improve patient comfort and compliance. However, the invasive nature of injections and the requirement for regular administration pose challenges, particularly for pediatric patients. The development of oral therapies for achondroplasia or the adaptation of existing treatments to oral formulations could significantly impact this segment, potentially shifting market dynamics toward a more balanced distribution between oral and parenteral routes.
End-Users Analysis
Hospitals Lead End-User Segment in Achondroplasia Market, Providing Comprehensive Care
Hospitals represent the dominant end-user segment in the Achondroplasia Market, primarily due to the comprehensive care they offer, including diagnosis, treatment, and management of achondroplasia. The availability of specialized services, such as surgery and growth hormone therapy, makes hospitals a central hub for achondroplasia care.
Homecare, while growing, primarily supports post-treatment recovery and ongoing supportive therapies, highlighting the trend towards maintaining quality of life outside hospital settings. Specialty Centers, dedicated to genetic disorders or pediatric care, play a critical role in providing specialized treatments and support for achondroplasia patients, often working in conjunction with hospitals to offer comprehensive care. The "Others" category encompasses various healthcare settings that contribute to the care continuum, such as community clinics and rehabilitation centers, offering accessible care options and supporting the overall treatment landscape.
Hospitals' dominance is supported by their ability to offer multi-disciplinary care, essential for addressing the complex needs of achondroplasia patients. The integration of various treatment modalities, from surgery to hormone therapy and supportive care, within hospital settings facilitates a holistic approach to achondroplasia management. However, the expanding role of homecare and specialty centers reflects a shift towards personalized and specialized care, indicating a diversifying market that accommodates the varying needs and preferences of patients and families.
Distribution Channel Analysis
Hospital Pharmacies Dominate Distribution Channels in Achondroplasia Treatment Market
The Distribution Channel segment is crucial for understanding how treatments for achondroplasia reach patients. Hospital Pharmacies stand out as the dominant sub-segment, primarily due to their role in dispensing medications and treatments directly to patients receiving care in hospital settings, including growth hormone therapy and post-surgical medications.
Online Pharmacies are rapidly growing, offering convenience and accessibility, especially for homecare settings, by delivering medications and supplies directly to patients' homes. Retail Pharmacies complement the distribution landscape by providing access to supportive care medications and over-the-counter products that assist in managing symptoms associated with achondroplasia.
The prominence of hospital pharmacies is linked to the integrated care model in hospital settings, where immediate access to prescribed therapies is critical for treatment efficacy and patient convenience. The rise of online pharmacies reflects broader trends in healthcare towards digitalization and patient-centered care, offering a discreet and efficient option for obtaining medications. Retail pharmacies serve as an essential access point for the broader community, including individuals with achondroplasia who require immediate or routine over-the-counter medications.
The distribution of treatments for achondroplasia through these channels ensures that patients have access to necessary therapies across different settings, supporting comprehensive care. The growth of online and retail pharmacies indicates a shift towards more diversified and accessible distribution models, which could further evolve with advancements in e-commerce and digital health technologies.
Key Market Segments
By Treatment
- Growth Hormone Therapy
- Surgery
- Supportive Therapy
- Others
By Route of Administration
- Oral
- Parenteral
By End-Users
- Hospitals
- Homecare
- Speciality Centres
- Others
By Distribution Channel
- Hospital Pharmacy
- Online Pharmacy
- Retail Pharmacy
Growth Opportunities
Personalized Medicine and Precision Therapies Offer Growth Opportunity
The advent of personalized medicine and precision therapies marks a transformative growth opportunity within the Achondroplasia Market. As research unravels the genetic intricacies of achondroplasia, the development of treatments tailored to individual genetic profiles becomes feasible.
This approach not only promises to enhance the efficacy of treatments but also to significantly improve the quality of life for patients. With the potential to precisely target the genetic anomalies causing achondroplasia, personalized therapies could revolutionize patient care, fostering a surge in demand for customized treatment plans and contributing to market expansion.
Expansion of Newborn Screening Programs Offers Growth Opportunity
The expansion of newborn screening programs to include achondroplasia represents a substantial opportunity for market growth. Early detection of achondroplasia through newborn screening enables immediate access to treatment and support, laying the groundwork for improved long-term outcomes.
As newborn screening for achondroplasia becomes more widespread, a corresponding increase in the need for diagnostic services, genetic counseling, and early intervention measures is anticipated. This trend not only supports the market's growth by boosting demand for existing services and treatments but also opens avenues for the development of new therapeutic and support options.
Trending Factors
Patient-Centric Approach and Improved Quality of Life Are Trending Factors
The shift towards a patient-centric approach in managing achondroplasia emphasizes the importance of improving the quality of life for individuals with the condition. This trend reflects a holistic view of care that encompasses emotional, social, and psychological support alongside traditional medical treatments.
Initiatives such as support groups, counseling, and educational resources are gaining prominence, indicating a broader understanding of the needs of those living with achondroplasia. This comprehensive care model is becoming a benchmark in the healthcare sector, driving advancements in services and treatments that address the full spectrum of patient needs.
Telemedicine and Remote Monitoring Are Trending Factors
Telemedicine and remote monitoring are rapidly emerging as pivotal elements in the care of individuals with achondroplasia. These technologies offer a new avenue for healthcare delivery, enabling continuous patient care without the need for physical hospital visits.
This is particularly beneficial for patients in remote or underserved regions, where access to specialized care may be limited. The growing adoption of these technologies highlights their potential to significantly enhance accessibility to healthcare services, reduce the logistical burden on families, and streamline the management of achondroplasia, contributing to a trend towards more accessible and efficient patient care.
Genetic Counseling and Prenatal Testing Advancements Are Trending Factors
Advancements in genetic counseling and prenatal testing for achondroplasia are shaping up as key trending factors in the market. The progress in genetic testing technologies has improved the ability of healthcare providers to offer detailed guidance and support to expectant parents.
This trend towards enhanced genetic counseling and testing services reflects a growing emphasis on informed decision-making and early intervention. As these services become more accessible and comprehensive, they play a critical role in empowering families with crucial information and support, further emphasizing the market's trend towards anticipatory and informed healthcare practices.
Regional Analysis
North America Dominates with 36% Market Share
North America's commanding 36% share in the Achondroplasia Market is attributed to several key factors, including advanced healthcare infrastructure, significant investments in genetic research, and a strong focus on personalized medicine. The region's developed healthcare system enables widespread access to cutting-edge treatments and interventions, while ongoing research initiatives contribute to the development of innovative therapies. Additionally, heightened awareness and supportive policies towards genetic disorders drive early diagnosis and treatment, bolstering the market's growth in this region.
North America are shaped by a collaborative ecosystem that includes research institutions, biotech companies, and healthcare providers. This collaboration facilitates rapid advancements in treatment approaches and enhances patient care. The region's robust regulatory framework also plays a crucial role in ensuring the safety and efficacy of new therapies, encouraging innovation in the market.
For other regions:
- Europe follows North America closely with a market share of approximately 29%, driven by similar factors such as strong healthcare systems, high awareness, and significant research activities.
- Asia Pacific is experiencing rapid growth, with a market share of 21%, attributed to improving healthcare infrastructure, increasing awareness, and rising investments in healthcare technologies.
- Middle East & Africa hold a smaller market share of 9%, where growth is gradually increasing due to improving access to healthcare and rising awareness of genetic disorders.
- Latin America also has a significant presence in the market with a share of 5%, where growth is driven by improvements in healthcare infrastructure and increased focus on child health.
Key Regions and Countries
- North America
- The US
- Canada
- Mexico
- Western Europe
- Germany
- France
- The UK
- Spain
- Italy
- Portugal
- Ireland
- Austria
- Switzerland
- Benelux
- Nordic
- Rest of Western Europe
- Eastern Europe
- Russia
- Poland
- The Czech Republic
- Greece
- Rest of Eastern Europe
- APAC
- China
- Japan
- South Korea
- India
- Australia & New Zealand
- Indonesia
- Malaysia
- Philippines
- Singapore
- Thailand
- Vietnam
- Rest of APAC
- Latin America
- Brazil
- Colombia
- Chile
- Argentina
- Costa Rica
- Rest of Latin America
- Middle East & Africa
- Algeria
- Egypt
- Israel
- Kuwait
- Nigeria
- Saudi Arabia
- South Africa
- Turkey
- United Arab Emirates
- Rest of MEA
Key Players Analysis
In the competitive landscape of the Achondroplasia market, several key players vie for prominence, each contributing unique approaches to address the challenges associated with this genetic disorder. Pfizer Inc., a pharmaceutical giant renowned for its innovation, collaborates on groundbreaking research and development initiatives.
Ascendis Pharma A/S stands out for its commitment to transformative therapies, leveraging advanced technologies to target the underlying causes of Achondroplasia. BridgeBio Pharma, Inc. distinguishes itself through a diversified pipeline and strategic partnerships, positioning it as a formidable contender in the market.
Teva Pharmaceutical Industries Ltd. and Ipsen Pharma bring their extensive expertise in drug development and commercialization to the forefront, exploring novel treatment modalities to improve patient outcomes. Novartis AG, Eli Lilly and Company, and JCR Pharmaceuticals Co., Ltd. exhibit a global presence and robust research capabilities, driving innovation and expanding therapeutic options for Achondroplasia patients worldwide.
Additionally, emerging players like Xiamen Amoytop Biotech Co., ProLynx Inc., and Ferring B.V. contribute to the competitive landscape with promising advancements in biotechnology and drug delivery systems. KVK TECH, INC., LG Chem, VIVUS LLC., F. Hoffmann-La Roche Ltd, BioMarin Pharmaceutical Inc., and Bristol-Myers Squibb Company further enrich the market with their diverse portfolios and commitment to addressing the unmet needs of Achondroplasia patients. As competition intensifies, collaborative efforts and strategic alliances are likely to drive innovation and propel advancements in Achondroplasia therapeutics.
Market Key Players
- Pfizer Inc.
- Ascendis Pharma A/S
- BridgeBio Pharma, Inc.
- Teva Pharmaceutical Industries Ltd.
- Ipsen Pharma
- Novartis AG
- Eli Lilly and Company
- JCR Pharmaceuticals Co., Ltd
- Xiamen Amoytop Biotech Co.,
- ProLynx Inc.
- Ferring B.V.
- KVK TECH, INC.
- LG Chem
- VIVUS LLC.
- F. Hoffmann-La Roche Ltd
- BioMarin Pharmaceutical
- Bristol-Myers Squibb Company
Recent Developments
- In 2022, Ascendis Pharma AS will initiate a Phase 3 clinical trial for Vosoritide, a treatment for achondroplasia; BioMarin Pharmaceutical Inc will follow suit in 2023.
- In 2023, The acquisition of BridgeBio Pharma Inc by Pfizer Inc demonstrated the pharmaceutical giant's continued dedication to achondroplasia treatment research. The acquisition has strengthened Pfizer's pipeline with BBP-265, a prospective genetic disease therapy in preclinical development. It is believed that BBP-265 targets the underlying cause of achondroplasia by promoting endochondral bone growth.
- In 2023, BioMarin Pharmaceutical Inc. will initiate the Phase 2 clinical trial for BMN-270, its achondroplasia treatment. In addition to targeting the underlying genetic cause of achondroplasia, this therapy aims to enhance the production of the FGFR3 receptor, which plays a crucial role in the disorder's development.
Report Scope
Report Features Description Market Value (2022) USD 70.6 Mn Forecast Revenue (2032) USD 1,189.8 Mn CAGR (2023-2032) 33.6% Base Year for Estimation 2023 Historic Period 2016-2023 Forecast Period 2024-2033 Report Coverage Revenue Forecast, Market Dynamics, COVID-19 Impact, Competitive Landscape, Recent Developments Segments Covered By Treatment (Surgery, Growth Hormone Therapy, Supportive Therapy, Vosoritide)
By Route of Administration (Oral, Parenteral)
By End-User (Hospitals & Clinics, Homecare, Speciality Centers, Other End-Users)Regional Analysis North America – The US, Canada, & Mexico; Western Europe – Germany, France, The UK, Spain, Italy, Portugal, Ireland, Austria, Switzerland, Benelux, Nordic, & Rest of Western Europe; Eastern Europe – Russia, Poland, The Czech Republic, Greece, & Rest of Eastern Europe; APAC – China, Japan, South Korea, India, Australia & New Zealand, Indonesia, Malaysia, Philippines, Singapore, Thailand, Vietnam, & Rest of APAC; Latin America – Brazil, Colombia, Chile, Argentina, Costa Rica, & Rest of Latin America; Middle East & Africa – Algeria, Egypt, Israel, Kuwait, Nigeria, Saudi Arabia, South Africa, Turkey, United Arab Emirates, & Rest of MEA Competitive Landscape Teva Pharmaceuticals Industries Ltd, F.Hoffman-La Roche Ltd., Aurobiondo Pharma, Bristol-Myers Squibb Company, GSK plc, Ascendis Pharma A/S, Mylan N.V., Johnson & Johnson, Pfizer Inc. Customization Scope Customization for segments, region/country-level will be provided. Moreover, additional customization can be done based on the requirements. Purchase Options We have three licenses to opt for: Single User License, Multi-User License (Up to 5 Users), Corporate Use License (Unlimited User and Printable PDF) -
- 1. Executive Summary
- 1.1. Definition
- 1.2. Taxonomy
- 1.3. Research Scope
- 1.4. Key Analysis
- 1.5. Key Findings by Major Segments
- 1.6. Top strategies by Major Players
- 2. Global Achondroplasia Market Overview
- 2.1. Achondroplasia Market Dynamics
- 2.1.1. Drivers
- 2.1.2. Opportunities
- 2.1.3. Restraints
- 2.1.4. Challenges
- 2.2. Macro-economic Factors
- 2.3. Regulatory Framework
- 2.4. Market Investment Feasibility Index
- 2.5. PEST Analysis
- 2.6. PORTER’S Five Force Analysis
- 2.7. Drivers & Restraints Impact Analysis
- 2.8. Industry Chain Analysis
- 2.9. Cost Structure Analysis
- 2.10. Marketing Strategy
- 2.11. Russia-Ukraine War Impact Analysis
- 2.12. Opportunity Map Analysis
- 2.13. Market Competition Scenario Analysis
- 2.14. Product Life Cycle Analysis
- 2.15. Opportunity Orbits
- 2.16. Manufacturer Intensity Map
- 2.17. Major Companies sales by Value & Volume
- 2.1. Achondroplasia Market Dynamics
- 3. Global Achondroplasia Market Analysis, Opportunity and Forecast, 2016-2032
- 3.1. Global Achondroplasia Market Analysis, 2016-2021
- 3.2. Global Achondroplasia Market Opportunity and Forecast, 2023-2032
- 3.3. Global Achondroplasia Market Analysis, Opportunity and Forecast, By By Treatment, 2016-2032
- 3.3.1. Global Achondroplasia Market Analysis by By Treatment: Introduction
- 3.3.2. Market Size Absolute $ Opportunity Analysis and Forecast, By By Treatment, 2016-2032
- 3.3.3. Surgery
- 3.3.4. Growth Hormone Therapy
- 3.3.5. Supportive Therapy
- 3.3.6. Vosoritide
- 3.4. Global Achondroplasia Market Analysis, Opportunity and Forecast, By By Route of Administration, 2016-2032
- 3.4.1. Global Achondroplasia Market Analysis by By Route of Administration: Introduction
- 3.4.2. Market Size Absolute $ Opportunity Analysis and Forecast, By By Route of Administration, 2016-2032
- 3.4.3. Oral
- 3.4.4. Parenteral
- 3.5. Global Achondroplasia Market Analysis, Opportunity and Forecast, By By End-User, 2016-2032
- 3.5.1. Global Achondroplasia Market Analysis by By End-User: Introduction
- 3.5.2. Market Size Absolute $ Opportunity Analysis and Forecast, By By End-User, 2016-2032
- 3.5.3. Hospitals & Clinics
- 3.5.4. Homecare
- 3.5.5. Speciality Centers
- 4. North America Achondroplasia Market Analysis, Opportunity and Forecast, 2016-2032
- 4.1. North America Achondroplasia Market Analysis, 2016-2021
- 4.2. North America Achondroplasia Market Opportunity and Forecast, 2023-2032
- 4.3. North America Achondroplasia Market Analysis, Opportunity and Forecast, By By Treatment, 2016-2032
- 4.3.1. North America Achondroplasia Market Analysis by By Treatment: Introduction
- 4.3.2. Market Size Absolute $ Opportunity Analysis and Forecast, By By Treatment, 2016-2032
- 4.3.3. Surgery
- 4.3.4. Growth Hormone Therapy
- 4.3.5. Supportive Therapy
- 4.3.6. Vosoritide
- 4.4. North America Achondroplasia Market Analysis, Opportunity and Forecast, By By Route of Administration, 2016-2032
- 4.4.1. North America Achondroplasia Market Analysis by By Route of Administration: Introduction
- 4.4.2. Market Size Absolute $ Opportunity Analysis and Forecast, By By Route of Administration, 2016-2032
- 4.4.3. Oral
- 4.4.4. Parenteral
- 4.5. North America Achondroplasia Market Analysis, Opportunity and Forecast, By By End-User, 2016-2032
- 4.5.1. North America Achondroplasia Market Analysis by By End-User: Introduction
- 4.5.2. Market Size Absolute $ Opportunity Analysis and Forecast, By By End-User, 2016-2032
- 4.5.3. Hospitals & Clinics
- 4.5.4. Homecare
- 4.5.5. Speciality Centers
- 4.6. North America Achondroplasia Market Analysis, Opportunity and Forecast, By Country , 2016-2032
- 4.6.1. North America Achondroplasia Market Analysis by Country : Introduction
- 4.6.2. Market Size Absolute $ Opportunity Analysis and Forecast, Country , 2016-2032
- 4.6.2.1. The US
- 4.6.2.2. Canada
- 4.6.2.3. Mexico
- 5. Western Europe Achondroplasia Market Analysis, Opportunity and Forecast, 2016-2032
- 5.1. Western Europe Achondroplasia Market Analysis, 2016-2021
- 5.2. Western Europe Achondroplasia Market Opportunity and Forecast, 2023-2032
- 5.3. Western Europe Achondroplasia Market Analysis, Opportunity and Forecast, By By Treatment, 2016-2032
- 5.3.1. Western Europe Achondroplasia Market Analysis by By Treatment: Introduction
- 5.3.2. Market Size Absolute $ Opportunity Analysis and Forecast, By By Treatment, 2016-2032
- 5.3.3. Surgery
- 5.3.4. Growth Hormone Therapy
- 5.3.5. Supportive Therapy
- 5.3.6. Vosoritide
- 5.4. Western Europe Achondroplasia Market Analysis, Opportunity and Forecast, By By Route of Administration, 2016-2032
- 5.4.1. Western Europe Achondroplasia Market Analysis by By Route of Administration: Introduction
- 5.4.2. Market Size Absolute $ Opportunity Analysis and Forecast, By By Route of Administration, 2016-2032
- 5.4.3. Oral
- 5.4.4. Parenteral
- 5.5. Western Europe Achondroplasia Market Analysis, Opportunity and Forecast, By By End-User, 2016-2032
- 5.5.1. Western Europe Achondroplasia Market Analysis by By End-User: Introduction
- 5.5.2. Market Size Absolute $ Opportunity Analysis and Forecast, By By End-User, 2016-2032
- 5.5.3. Hospitals & Clinics
- 5.5.4. Homecare
- 5.5.5. Speciality Centers
- 5.6. Western Europe Achondroplasia Market Analysis, Opportunity and Forecast, By Country , 2016-2032
- 5.6.1. Western Europe Achondroplasia Market Analysis by Country : Introduction
- 5.6.2. Market Size Absolute $ Opportunity Analysis and Forecast, Country , 2016-2032
- 5.6.2.1. Germany
- 5.6.2.2. France
- 5.6.2.3. The UK
- 5.6.2.4. Spain
- 5.6.2.5. Italy
- 5.6.2.6. Portugal
- 5.6.2.7. Ireland
- 5.6.2.8. Austria
- 5.6.2.9. Switzerland
- 5.6.2.10. Benelux
- 5.6.2.11. Nordic
- 5.6.2.12. Rest of Western Europe
- 6. Eastern Europe Achondroplasia Market Analysis, Opportunity and Forecast, 2016-2032
- 6.1. Eastern Europe Achondroplasia Market Analysis, 2016-2021
- 6.2. Eastern Europe Achondroplasia Market Opportunity and Forecast, 2023-2032
- 6.3. Eastern Europe Achondroplasia Market Analysis, Opportunity and Forecast, By By Treatment, 2016-2032
- 6.3.1. Eastern Europe Achondroplasia Market Analysis by By Treatment: Introduction
- 6.3.2. Market Size Absolute $ Opportunity Analysis and Forecast, By By Treatment, 2016-2032
- 6.3.3. Surgery
- 6.3.4. Growth Hormone Therapy
- 6.3.5. Supportive Therapy
- 6.3.6. Vosoritide
- 6.4. Eastern Europe Achondroplasia Market Analysis, Opportunity and Forecast, By By Route of Administration, 2016-2032
- 6.4.1. Eastern Europe Achondroplasia Market Analysis by By Route of Administration: Introduction
- 6.4.2. Market Size Absolute $ Opportunity Analysis and Forecast, By By Route of Administration, 2016-2032
- 6.4.3. Oral
- 6.4.4. Parenteral
- 6.5. Eastern Europe Achondroplasia Market Analysis, Opportunity and Forecast, By By End-User, 2016-2032
- 6.5.1. Eastern Europe Achondroplasia Market Analysis by By End-User: Introduction
- 6.5.2. Market Size Absolute $ Opportunity Analysis and Forecast, By By End-User, 2016-2032
- 6.5.3. Hospitals & Clinics
- 6.5.4. Homecare
- 6.5.5. Speciality Centers
- 6.6. Eastern Europe Achondroplasia Market Analysis, Opportunity and Forecast, By Country , 2016-2032
- 6.6.1. Eastern Europe Achondroplasia Market Analysis by Country : Introduction
- 6.6.2. Market Size Absolute $ Opportunity Analysis and Forecast, Country , 2016-2032
- 6.6.2.1. Russia
- 6.6.2.2. Poland
- 6.6.2.3. The Czech Republic
- 6.6.2.4. Greece
- 6.6.2.5. Rest of Eastern Europe
- 7. APAC Achondroplasia Market Analysis, Opportunity and Forecast, 2016-2032
- 7.1. APAC Achondroplasia Market Analysis, 2016-2021
- 7.2. APAC Achondroplasia Market Opportunity and Forecast, 2023-2032
- 7.3. APAC Achondroplasia Market Analysis, Opportunity and Forecast, By By Treatment, 2016-2032
- 7.3.1. APAC Achondroplasia Market Analysis by By Treatment: Introduction
- 7.3.2. Market Size Absolute $ Opportunity Analysis and Forecast, By By Treatment, 2016-2032
- 7.3.3. Surgery
- 7.3.4. Growth Hormone Therapy
- 7.3.5. Supportive Therapy
- 7.3.6. Vosoritide
- 7.4. APAC Achondroplasia Market Analysis, Opportunity and Forecast, By By Route of Administration, 2016-2032
- 7.4.1. APAC Achondroplasia Market Analysis by By Route of Administration: Introduction
- 7.4.2. Market Size Absolute $ Opportunity Analysis and Forecast, By By Route of Administration, 2016-2032
- 7.4.3. Oral
- 7.4.4. Parenteral
- 7.5. APAC Achondroplasia Market Analysis, Opportunity and Forecast, By By End-User, 2016-2032
- 7.5.1. APAC Achondroplasia Market Analysis by By End-User: Introduction
- 7.5.2. Market Size Absolute $ Opportunity Analysis and Forecast, By By End-User, 2016-2032
- 7.5.3. Hospitals & Clinics
- 7.5.4. Homecare
- 7.5.5. Speciality Centers
- 7.6. APAC Achondroplasia Market Analysis, Opportunity and Forecast, By Country , 2016-2032
- 7.6.1. APAC Achondroplasia Market Analysis by Country : Introduction
- 7.6.2. Market Size Absolute $ Opportunity Analysis and Forecast, Country , 2016-2032
- 7.6.2.1. China
- 7.6.2.2. Japan
- 7.6.2.3. South Korea
- 7.6.2.4. India
- 7.6.2.5. Australia & New Zeland
- 7.6.2.6. Indonesia
- 7.6.2.7. Malaysia
- 7.6.2.8. Philippines
- 7.6.2.9. Singapore
- 7.6.2.10. Thailand
- 7.6.2.11. Vietnam
- 7.6.2.12. Rest of APAC
- 8. Latin America Achondroplasia Market Analysis, Opportunity and Forecast, 2016-2032
- 8.1. Latin America Achondroplasia Market Analysis, 2016-2021
- 8.2. Latin America Achondroplasia Market Opportunity and Forecast, 2023-2032
- 8.3. Latin America Achondroplasia Market Analysis, Opportunity and Forecast, By By Treatment, 2016-2032
- 8.3.1. Latin America Achondroplasia Market Analysis by By Treatment: Introduction
- 8.3.2. Market Size Absolute $ Opportunity Analysis and Forecast, By By Treatment, 2016-2032
- 8.3.3. Surgery
- 8.3.4. Growth Hormone Therapy
- 8.3.5. Supportive Therapy
- 8.3.6. Vosoritide
- 8.4. Latin America Achondroplasia Market Analysis, Opportunity and Forecast, By By Route of Administration, 2016-2032
- 8.4.1. Latin America Achondroplasia Market Analysis by By Route of Administration: Introduction
- 8.4.2. Market Size Absolute $ Opportunity Analysis and Forecast, By By Route of Administration, 2016-2032
- 8.4.3. Oral
- 8.4.4. Parenteral
- 8.5. Latin America Achondroplasia Market Analysis, Opportunity and Forecast, By By End-User, 2016-2032
- 8.5.1. Latin America Achondroplasia Market Analysis by By End-User: Introduction
- 8.5.2. Market Size Absolute $ Opportunity Analysis and Forecast, By By End-User, 2016-2032
- 8.5.3. Hospitals & Clinics
- 8.5.4. Homecare
- 8.5.5. Speciality Centers
- 8.6. Latin America Achondroplasia Market Analysis, Opportunity and Forecast, By Country , 2016-2032
- 8.6.1. Latin America Achondroplasia Market Analysis by Country : Introduction
- 8.6.2. Market Size Absolute $ Opportunity Analysis and Forecast, Country , 2016-2032
- 8.6.2.1. Brazil
- 8.6.2.2. Colombia
- 8.6.2.3. Chile
- 8.6.2.4. Argentina
- 8.6.2.5. Costa Rica
- 8.6.2.6. Rest of Latin America
- 9. Middle East & Africa Achondroplasia Market Analysis, Opportunity and Forecast, 2016-2032
- 9.1. Middle East & Africa Achondroplasia Market Analysis, 2016-2021
- 9.2. Middle East & Africa Achondroplasia Market Opportunity and Forecast, 2023-2032
- 9.3. Middle East & Africa Achondroplasia Market Analysis, Opportunity and Forecast, By By Treatment, 2016-2032
- 9.3.1. Middle East & Africa Achondroplasia Market Analysis by By Treatment: Introduction
- 9.3.2. Market Size Absolute $ Opportunity Analysis and Forecast, By By Treatment, 2016-2032
- 9.3.3. Surgery
- 9.3.4. Growth Hormone Therapy
- 9.3.5. Supportive Therapy
- 9.3.6. Vosoritide
- 9.4. Middle East & Africa Achondroplasia Market Analysis, Opportunity and Forecast, By By Route of Administration, 2016-2032
- 9.4.1. Middle East & Africa Achondroplasia Market Analysis by By Route of Administration: Introduction
- 9.4.2. Market Size Absolute $ Opportunity Analysis and Forecast, By By Route of Administration, 2016-2032
- 9.4.3. Oral
- 9.4.4. Parenteral
- 9.5. Middle East & Africa Achondroplasia Market Analysis, Opportunity and Forecast, By By End-User, 2016-2032
- 9.5.1. Middle East & Africa Achondroplasia Market Analysis by By End-User: Introduction
- 9.5.2. Market Size Absolute $ Opportunity Analysis and Forecast, By By End-User, 2016-2032
- 9.5.3. Hospitals & Clinics
- 9.5.4. Homecare
- 9.5.5. Speciality Centers
- 9.6. Middle East & Africa Achondroplasia Market Analysis, Opportunity and Forecast, By Country , 2016-2032
- 9.6.1. Middle East & Africa Achondroplasia Market Analysis by Country : Introduction
- 9.6.2. Market Size Absolute $ Opportunity Analysis and Forecast, Country , 2016-2032
- 9.6.2.1. Algeria
- 9.6.2.2. Egypt
- 9.6.2.3. Israel
- 9.6.2.4. Kuwait
- 9.6.2.5. Nigeria
- 9.6.2.6. Saudi Arabia
- 9.6.2.7. South Africa
- 9.6.2.8. Turkey
- 9.6.2.9. The UAE
- 9.6.2.10. Rest of MEA
- 10. Global Achondroplasia Market Analysis, Opportunity and Forecast, By Region , 2016-2032
- 10.1. Global Achondroplasia Market Analysis by Region : Introduction
- 10.2. Market Size Absolute $ Opportunity Analysis and Forecast, By Region , 2016-2032
- 10.2.1. North America
- 10.2.2. Western Europe
- 10.2.3. Eastern Europe
- 10.2.4. APAC
- 10.2.5. Latin America
- 10.2.6. Middle East & Africa
- 11. Global Achondroplasia Market Competitive Landscape, Market Share Analysis, and Company Profiles
- 11.1. Market Share Analysis
- 11.2. Company Profiles
- 11.3. Teva Pharmaceutricals Industries Ltd
- 11.3.1. Company Overview
- 11.3.2. Financial Highlights
- 11.3.3. Product Portfolio
- 11.3.4. SWOT Analysis
- 11.3.5. Key Strategies and Developments
- 11.4. BioMarin Pharmaceutical
- 11.4.1. Company Overview
- 11.4.2. Financial Highlights
- 11.4.3. Product Portfolio
- 11.4.4. SWOT Analysis
- 11.4.5. Key Strategies and Developments
- 11.5. F.Hoffman-La Roche Ltd.
- 11.5.1. Company Overview
- 11.5.2. Financial Highlights
- 11.5.3. Product Portfolio
- 11.5.4. SWOT Analysis
- 11.5.5. Key Strategies and Developments
- 11.6. Aurobiondo Pharma
- 11.6.1. Company Overview
- 11.6.2. Financial Highlights
- 11.6.3. Product Portfolio
- 11.6.4. SWOT Analysis
- 11.6.5. Key Strategies and Developments
- 11.7. Bristol-Myers Squibb Company
- 11.7.1. Company Overview
- 11.7.2. Financial Highlights
- 11.7.3. Product Portfolio
- 11.7.4. SWOT Analysis
- 11.7.5. Key Strategies and Developments
- 11.8. GSK plc
- 11.8.1. Company Overview
- 11.8.2. Financial Highlights
- 11.8.3. Product Portfolio
- 11.8.4. SWOT Analysis
- 11.8.5. Key Strategies and Developments
- 11.9. Ascendis Pharma A/S
- 11.9.1. Company Overview
- 11.9.2. Financial Highlights
- 11.9.3. Product Portfolio
- 11.9.4. SWOT Analysis
- 11.9.5. Key Strategies and Developments
- 11.10. Mylan N.V.
- 11.10.1. Company Overview
- 11.10.2. Financial Highlights
- 11.10.3. Product Portfolio
- 11.10.4. SWOT Analysis
- 11.10.5. Key Strategies and Developments
- 11.11. Johnson & Johnson
- 11.11.1. Company Overview
- 11.11.2. Financial Highlights
- 11.11.3. Product Portfolio
- 11.11.4. SWOT Analysis
- 11.11.5. Key Strategies and Developments
- 11.12. Pfizer Inc.
- 11.12.1. Company Overview
- 11.12.2. Financial Highlights
- 11.12.3. Product Portfolio
- 11.12.4. SWOT Analysis
- 11.12.5. Key Strategies and Developments
- 12. Assumptions and Acronyms
- 13. Research Methodology
- 14. Contact
List of Figures
- Figure 1: Global Achondroplasia Market Revenue (US$ Mn) Market Share by By Treatment in 2022
- Figure 2: Global Achondroplasia Market Attractiveness Analysis by By Treatment, 2016-2032
- Figure 3: Global Achondroplasia Market Revenue (US$ Mn) Market Share by By Route of Administrationin 2022
- Figure 4: Global Achondroplasia Market Attractiveness Analysis by By Route of Administration, 2016-2032
- Figure 5: Global Achondroplasia Market Revenue (US$ Mn) Market Share by By End-Userin 2022
- Figure 6: Global Achondroplasia Market Attractiveness Analysis by By End-User, 2016-2032
- Figure 7: Global Achondroplasia Market Revenue (US$ Mn) Market Share by Region in 2022
- Figure 8: Global Achondroplasia Market Attractiveness Analysis by Region, 2016-2032
- Figure 9: Global Achondroplasia Market Revenue (US$ Mn) (2016-2032)
- Figure 10: Global Achondroplasia Market Revenue (US$ Mn) Comparison by Region (2016-2032)
- Figure 11: Global Achondroplasia Market Revenue (US$ Mn) Comparison by By Treatment (2016-2032)
- Figure 12: Global Achondroplasia Market Revenue (US$ Mn) Comparison by By Route of Administration (2016-2032)
- Figure 13: Global Achondroplasia Market Revenue (US$ Mn) Comparison by By End-User (2016-2032)
- Figure 14: Global Achondroplasia Market Y-o-Y Growth Rate Comparison by Region (2016-2032)
- Figure 15: Global Achondroplasia Market Y-o-Y Growth Rate Comparison by By Treatment (2016-2032)
- Figure 16: Global Achondroplasia Market Y-o-Y Growth Rate Comparison by By Route of Administration (2016-2032)
- Figure 17: Global Achondroplasia Market Y-o-Y Growth Rate Comparison by By End-User (2016-2032)
- Figure 18: Global Achondroplasia Market Share Comparison by Region (2016-2032)
- Figure 19: Global Achondroplasia Market Share Comparison by By Treatment (2016-2032)
- Figure 20: Global Achondroplasia Market Share Comparison by By Route of Administration (2016-2032)
- Figure 21: Global Achondroplasia Market Share Comparison by By End-User (2016-2032)
- Figure 22: North America Achondroplasia Market Revenue (US$ Mn) Market Share by By Treatmentin 2022
- Figure 23: North America Achondroplasia Market Attractiveness Analysis by By Treatment, 2016-2032
- Figure 24: North America Achondroplasia Market Revenue (US$ Mn) Market Share by By Route of Administrationin 2022
- Figure 25: North America Achondroplasia Market Attractiveness Analysis by By Route of Administration, 2016-2032
- Figure 26: North America Achondroplasia Market Revenue (US$ Mn) Market Share by By End-Userin 2022
- Figure 27: North America Achondroplasia Market Attractiveness Analysis by By End-User, 2016-2032
- Figure 28: North America Achondroplasia Market Revenue (US$ Mn) Market Share by Country in 2022
- Figure 29: North America Achondroplasia Market Attractiveness Analysis by Country, 2016-2032
- Figure 30: North America Achondroplasia Market Revenue (US$ Mn) (2016-2032)
- Figure 31: North America Achondroplasia Market Revenue (US$ Mn) Comparison by Country (2016-2032)
- Figure 32: North America Achondroplasia Market Revenue (US$ Mn) Comparison by By Treatment (2016-2032)
- Figure 33: North America Achondroplasia Market Revenue (US$ Mn) Comparison by By Route of Administration (2016-2032)
- Figure 34: North America Achondroplasia Market Revenue (US$ Mn) Comparison by By End-User (2016-2032)
- Figure 35: North America Achondroplasia Market Y-o-Y Growth Rate Comparison by Country (2016-2032)
- Figure 36: North America Achondroplasia Market Y-o-Y Growth Rate Comparison by By Treatment (2016-2032)
- Figure 37: North America Achondroplasia Market Y-o-Y Growth Rate Comparison by By Route of Administration (2016-2032)
- Figure 38: North America Achondroplasia Market Y-o-Y Growth Rate Comparison by By End-User (2016-2032)
- Figure 39: North America Achondroplasia Market Share Comparison by Country (2016-2032)
- Figure 40: North America Achondroplasia Market Share Comparison by By Treatment (2016-2032)
- Figure 41: North America Achondroplasia Market Share Comparison by By Route of Administration (2016-2032)
- Figure 42: North America Achondroplasia Market Share Comparison by By End-User (2016-2032)
- Figure 43: Western Europe Achondroplasia Market Revenue (US$ Mn) Market Share by By Treatmentin 2022
- Figure 44: Western Europe Achondroplasia Market Attractiveness Analysis by By Treatment, 2016-2032
- Figure 45: Western Europe Achondroplasia Market Revenue (US$ Mn) Market Share by By Route of Administrationin 2022
- Figure 46: Western Europe Achondroplasia Market Attractiveness Analysis by By Route of Administration, 2016-2032
- Figure 47: Western Europe Achondroplasia Market Revenue (US$ Mn) Market Share by By End-Userin 2022
- Figure 48: Western Europe Achondroplasia Market Attractiveness Analysis by By End-User, 2016-2032
- Figure 49: Western Europe Achondroplasia Market Revenue (US$ Mn) Market Share by Country in 2022
- Figure 50: Western Europe Achondroplasia Market Attractiveness Analysis by Country, 2016-2032
- Figure 51: Western Europe Achondroplasia Market Revenue (US$ Mn) (2016-2032)
- Figure 52: Western Europe Achondroplasia Market Revenue (US$ Mn) Comparison by Country (2016-2032)
- Figure 53: Western Europe Achondroplasia Market Revenue (US$ Mn) Comparison by By Treatment (2016-2032)
- Figure 54: Western Europe Achondroplasia Market Revenue (US$ Mn) Comparison by By Route of Administration (2016-2032)
- Figure 55: Western Europe Achondroplasia Market Revenue (US$ Mn) Comparison by By End-User (2016-2032)
- Figure 56: Western Europe Achondroplasia Market Y-o-Y Growth Rate Comparison by Country (2016-2032)
- Figure 57: Western Europe Achondroplasia Market Y-o-Y Growth Rate Comparison by By Treatment (2016-2032)
- Figure 58: Western Europe Achondroplasia Market Y-o-Y Growth Rate Comparison by By Route of Administration (2016-2032)
- Figure 59: Western Europe Achondroplasia Market Y-o-Y Growth Rate Comparison by By End-User (2016-2032)
- Figure 60: Western Europe Achondroplasia Market Share Comparison by Country (2016-2032)
- Figure 61: Western Europe Achondroplasia Market Share Comparison by By Treatment (2016-2032)
- Figure 62: Western Europe Achondroplasia Market Share Comparison by By Route of Administration (2016-2032)
- Figure 63: Western Europe Achondroplasia Market Share Comparison by By End-User (2016-2032)
- Figure 64: Eastern Europe Achondroplasia Market Revenue (US$ Mn) Market Share by By Treatmentin 2022
- Figure 65: Eastern Europe Achondroplasia Market Attractiveness Analysis by By Treatment, 2016-2032
- Figure 66: Eastern Europe Achondroplasia Market Revenue (US$ Mn) Market Share by By Route of Administrationin 2022
- Figure 67: Eastern Europe Achondroplasia Market Attractiveness Analysis by By Route of Administration, 2016-2032
- Figure 68: Eastern Europe Achondroplasia Market Revenue (US$ Mn) Market Share by By End-Userin 2022
- Figure 69: Eastern Europe Achondroplasia Market Attractiveness Analysis by By End-User, 2016-2032
- Figure 70: Eastern Europe Achondroplasia Market Revenue (US$ Mn) Market Share by Country in 2022
- Figure 71: Eastern Europe Achondroplasia Market Attractiveness Analysis by Country, 2016-2032
- Figure 72: Eastern Europe Achondroplasia Market Revenue (US$ Mn) (2016-2032)
- Figure 73: Eastern Europe Achondroplasia Market Revenue (US$ Mn) Comparison by Country (2016-2032)
- Figure 74: Eastern Europe Achondroplasia Market Revenue (US$ Mn) Comparison by By Treatment (2016-2032)
- Figure 75: Eastern Europe Achondroplasia Market Revenue (US$ Mn) Comparison by By Route of Administration (2016-2032)
- Figure 76: Eastern Europe Achondroplasia Market Revenue (US$ Mn) Comparison by By End-User (2016-2032)
- Figure 77: Eastern Europe Achondroplasia Market Y-o-Y Growth Rate Comparison by Country (2016-2032)
- Figure 78: Eastern Europe Achondroplasia Market Y-o-Y Growth Rate Comparison by By Treatment (2016-2032)
- Figure 79: Eastern Europe Achondroplasia Market Y-o-Y Growth Rate Comparison by By Route of Administration (2016-2032)
- Figure 80: Eastern Europe Achondroplasia Market Y-o-Y Growth Rate Comparison by By End-User (2016-2032)
- Figure 81: Eastern Europe Achondroplasia Market Share Comparison by Country (2016-2032)
- Figure 82: Eastern Europe Achondroplasia Market Share Comparison by By Treatment (2016-2032)
- Figure 83: Eastern Europe Achondroplasia Market Share Comparison by By Route of Administration (2016-2032)
- Figure 84: Eastern Europe Achondroplasia Market Share Comparison by By End-User (2016-2032)
- Figure 85: APAC Achondroplasia Market Revenue (US$ Mn) Market Share by By Treatmentin 2022
- Figure 86: APAC Achondroplasia Market Attractiveness Analysis by By Treatment, 2016-2032
- Figure 87: APAC Achondroplasia Market Revenue (US$ Mn) Market Share by By Route of Administrationin 2022
- Figure 88: APAC Achondroplasia Market Attractiveness Analysis by By Route of Administration, 2016-2032
- Figure 89: APAC Achondroplasia Market Revenue (US$ Mn) Market Share by By End-Userin 2022
- Figure 90: APAC Achondroplasia Market Attractiveness Analysis by By End-User, 2016-2032
- Figure 91: APAC Achondroplasia Market Revenue (US$ Mn) Market Share by Country in 2022
- Figure 92: APAC Achondroplasia Market Attractiveness Analysis by Country, 2016-2032
- Figure 93: APAC Achondroplasia Market Revenue (US$ Mn) (2016-2032)
- Figure 94: APAC Achondroplasia Market Revenue (US$ Mn) Comparison by Country (2016-2032)
- Figure 95: APAC Achondroplasia Market Revenue (US$ Mn) Comparison by By Treatment (2016-2032)
- Figure 96: APAC Achondroplasia Market Revenue (US$ Mn) Comparison by By Route of Administration (2016-2032)
- Figure 97: APAC Achondroplasia Market Revenue (US$ Mn) Comparison by By End-User (2016-2032)
- Figure 98: APAC Achondroplasia Market Y-o-Y Growth Rate Comparison by Country (2016-2032)
- Figure 99: APAC Achondroplasia Market Y-o-Y Growth Rate Comparison by By Treatment (2016-2032)
- Figure 100: APAC Achondroplasia Market Y-o-Y Growth Rate Comparison by By Route of Administration (2016-2032)
- Figure 101: APAC Achondroplasia Market Y-o-Y Growth Rate Comparison by By End-User (2016-2032)
- Figure 102: APAC Achondroplasia Market Share Comparison by Country (2016-2032)
- Figure 103: APAC Achondroplasia Market Share Comparison by By Treatment (2016-2032)
- Figure 104: APAC Achondroplasia Market Share Comparison by By Route of Administration (2016-2032)
- Figure 105: APAC Achondroplasia Market Share Comparison by By End-User (2016-2032)
- Figure 106: Latin America Achondroplasia Market Revenue (US$ Mn) Market Share by By Treatmentin 2022
- Figure 107: Latin America Achondroplasia Market Attractiveness Analysis by By Treatment, 2016-2032
- Figure 108: Latin America Achondroplasia Market Revenue (US$ Mn) Market Share by By Route of Administrationin 2022
- Figure 109: Latin America Achondroplasia Market Attractiveness Analysis by By Route of Administration, 2016-2032
- Figure 110: Latin America Achondroplasia Market Revenue (US$ Mn) Market Share by By End-Userin 2022
- Figure 111: Latin America Achondroplasia Market Attractiveness Analysis by By End-User, 2016-2032
- Figure 112: Latin America Achondroplasia Market Revenue (US$ Mn) Market Share by Country in 2022
- Figure 113: Latin America Achondroplasia Market Attractiveness Analysis by Country, 2016-2032
- Figure 114: Latin America Achondroplasia Market Revenue (US$ Mn) (2016-2032)
- Figure 115: Latin America Achondroplasia Market Revenue (US$ Mn) Comparison by Country (2016-2032)
- Figure 116: Latin America Achondroplasia Market Revenue (US$ Mn) Comparison by By Treatment (2016-2032)
- Figure 117: Latin America Achondroplasia Market Revenue (US$ Mn) Comparison by By Route of Administration (2016-2032)
- Figure 118: Latin America Achondroplasia Market Revenue (US$ Mn) Comparison by By End-User (2016-2032)
- Figure 119: Latin America Achondroplasia Market Y-o-Y Growth Rate Comparison by Country (2016-2032)
- Figure 120: Latin America Achondroplasia Market Y-o-Y Growth Rate Comparison by By Treatment (2016-2032)
- Figure 121: Latin America Achondroplasia Market Y-o-Y Growth Rate Comparison by By Route of Administration (2016-2032)
- Figure 122: Latin America Achondroplasia Market Y-o-Y Growth Rate Comparison by By End-User (2016-2032)
- Figure 123: Latin America Achondroplasia Market Share Comparison by Country (2016-2032)
- Figure 124: Latin America Achondroplasia Market Share Comparison by By Treatment (2016-2032)
- Figure 125: Latin America Achondroplasia Market Share Comparison by By Route of Administration (2016-2032)
- Figure 126: Latin America Achondroplasia Market Share Comparison by By End-User (2016-2032)
- Figure 127: Middle East & Africa Achondroplasia Market Revenue (US$ Mn) Market Share by By Treatmentin 2022
- Figure 128: Middle East & Africa Achondroplasia Market Attractiveness Analysis by By Treatment, 2016-2032
- Figure 129: Middle East & Africa Achondroplasia Market Revenue (US$ Mn) Market Share by By Route of Administrationin 2022
- Figure 130: Middle East & Africa Achondroplasia Market Attractiveness Analysis by By Route of Administration, 2016-2032
- Figure 131: Middle East & Africa Achondroplasia Market Revenue (US$ Mn) Market Share by By End-Userin 2022
- Figure 132: Middle East & Africa Achondroplasia Market Attractiveness Analysis by By End-User, 2016-2032
- Figure 133: Middle East & Africa Achondroplasia Market Revenue (US$ Mn) Market Share by Country in 2022
- Figure 134: Middle East & Africa Achondroplasia Market Attractiveness Analysis by Country, 2016-2032
- Figure 135: Middle East & Africa Achondroplasia Market Revenue (US$ Mn) (2016-2032)
- Figure 136: Middle East & Africa Achondroplasia Market Revenue (US$ Mn) Comparison by Country (2016-2032)
- Figure 137: Middle East & Africa Achondroplasia Market Revenue (US$ Mn) Comparison by By Treatment (2016-2032)
- Figure 138: Middle East & Africa Achondroplasia Market Revenue (US$ Mn) Comparison by By Route of Administration (2016-2032)
- Figure 139: Middle East & Africa Achondroplasia Market Revenue (US$ Mn) Comparison by By End-User (2016-2032)
- Figure 140: Middle East & Africa Achondroplasia Market Y-o-Y Growth Rate Comparison by Country (2016-2032)
- Figure 141: Middle East & Africa Achondroplasia Market Y-o-Y Growth Rate Comparison by By Treatment (2016-2032)
- Figure 142: Middle East & Africa Achondroplasia Market Y-o-Y Growth Rate Comparison by By Route of Administration (2016-2032)
- Figure 143: Middle East & Africa Achondroplasia Market Y-o-Y Growth Rate Comparison by By End-User (2016-2032)
- Figure 144: Middle East & Africa Achondroplasia Market Share Comparison by Country (2016-2032)
- Figure 145: Middle East & Africa Achondroplasia Market Share Comparison by By Treatment (2016-2032)
- Figure 146: Middle East & Africa Achondroplasia Market Share Comparison by By Route of Administration (2016-2032)
- Figure 147: Middle East & Africa Achondroplasia Market Share Comparison by By End-User (2016-2032)
List of Tables
- Table 1: Global Achondroplasia Market Comparison by By Treatment (2016-2032)
- Table 2: Global Achondroplasia Market Comparison by By Route of Administration (2016-2032)
- Table 3: Global Achondroplasia Market Comparison by By End-User (2016-2032)
- Table 4: Global Achondroplasia Market Revenue (US$ Mn) Comparison by Region (2016-2032)
- Table 5: Global Achondroplasia Market Revenue (US$ Mn) (2016-2032)
- Table 6: Global Achondroplasia Market Revenue (US$ Mn) Comparison by Region (2016-2032)
- Table 7: Global Achondroplasia Market Revenue (US$ Mn) Comparison by By Treatment (2016-2032)
- Table 8: Global Achondroplasia Market Revenue (US$ Mn) Comparison by By Route of Administration (2016-2032)
- Table 9: Global Achondroplasia Market Revenue (US$ Mn) Comparison by By End-User (2016-2032)
- Table 10: Global Achondroplasia Market Y-o-Y Growth Rate Comparison by Region (2016-2032)
- Table 11: Global Achondroplasia Market Y-o-Y Growth Rate Comparison by By Treatment (2016-2032)
- Table 12: Global Achondroplasia Market Y-o-Y Growth Rate Comparison by By Route of Administration (2016-2032)
- Table 13: Global Achondroplasia Market Y-o-Y Growth Rate Comparison by By End-User (2016-2032)
- Table 14: Global Achondroplasia Market Share Comparison by Region (2016-2032)
- Table 15: Global Achondroplasia Market Share Comparison by By Treatment (2016-2032)
- Table 16: Global Achondroplasia Market Share Comparison by By Route of Administration (2016-2032)
- Table 17: Global Achondroplasia Market Share Comparison by By End-User (2016-2032)
- Table 18: North America Achondroplasia Market Comparison by By Route of Administration (2016-2032)
- Table 19: North America Achondroplasia Market Comparison by By End-User (2016-2032)
- Table 20: North America Achondroplasia Market Revenue (US$ Mn) Comparison by Country (2016-2032)
- Table 21: North America Achondroplasia Market Revenue (US$ Mn) (2016-2032)
- Table 22: North America Achondroplasia Market Revenue (US$ Mn) Comparison by Country (2016-2032)
- Table 23: North America Achondroplasia Market Revenue (US$ Mn) Comparison by By Treatment (2016-2032)
- Table 24: North America Achondroplasia Market Revenue (US$ Mn) Comparison by By Route of Administration (2016-2032)
- Table 25: North America Achondroplasia Market Revenue (US$ Mn) Comparison by By End-User (2016-2032)
- Table 26: North America Achondroplasia Market Y-o-Y Growth Rate Comparison by Country (2016-2032)
- Table 27: North America Achondroplasia Market Y-o-Y Growth Rate Comparison by By Treatment (2016-2032)
- Table 28: North America Achondroplasia Market Y-o-Y Growth Rate Comparison by By Route of Administration (2016-2032)
- Table 29: North America Achondroplasia Market Y-o-Y Growth Rate Comparison by By End-User (2016-2032)
- Table 30: North America Achondroplasia Market Share Comparison by Country (2016-2032)
- Table 31: North America Achondroplasia Market Share Comparison by By Treatment (2016-2032)
- Table 32: North America Achondroplasia Market Share Comparison by By Route of Administration (2016-2032)
- Table 33: North America Achondroplasia Market Share Comparison by By End-User (2016-2032)
- Table 34: Western Europe Achondroplasia Market Comparison by By Treatment (2016-2032)
- Table 35: Western Europe Achondroplasia Market Comparison by By Route of Administration (2016-2032)
- Table 36: Western Europe Achondroplasia Market Comparison by By End-User (2016-2032)
- Table 37: Western Europe Achondroplasia Market Revenue (US$ Mn) Comparison by Country (2016-2032)
- Table 38: Western Europe Achondroplasia Market Revenue (US$ Mn) (2016-2032)
- Table 39: Western Europe Achondroplasia Market Revenue (US$ Mn) Comparison by Country (2016-2032)
- Table 40: Western Europe Achondroplasia Market Revenue (US$ Mn) Comparison by By Treatment (2016-2032)
- Table 41: Western Europe Achondroplasia Market Revenue (US$ Mn) Comparison by By Route of Administration (2016-2032)
- Table 42: Western Europe Achondroplasia Market Revenue (US$ Mn) Comparison by By End-User (2016-2032)
- Table 43: Western Europe Achondroplasia Market Y-o-Y Growth Rate Comparison by Country (2016-2032)
- Table 44: Western Europe Achondroplasia Market Y-o-Y Growth Rate Comparison by By Treatment (2016-2032)
- Table 45: Western Europe Achondroplasia Market Y-o-Y Growth Rate Comparison by By Route of Administration (2016-2032)
- Table 46: Western Europe Achondroplasia Market Y-o-Y Growth Rate Comparison by By End-User (2016-2032)
- Table 47: Western Europe Achondroplasia Market Share Comparison by Country (2016-2032)
- Table 48: Western Europe Achondroplasia Market Share Comparison by By Treatment (2016-2032)
- Table 49: Western Europe Achondroplasia Market Share Comparison by By Route of Administration (2016-2032)
- Table 50: Western Europe Achondroplasia Market Share Comparison by By End-User (2016-2032)
- Table 51: Eastern Europe Achondroplasia Market Comparison by By Treatment (2016-2032)
- Table 52: Eastern Europe Achondroplasia Market Comparison by By Route of Administration (2016-2032)
- Table 53: Eastern Europe Achondroplasia Market Comparison by By End-User (2016-2032)
- Table 54: Eastern Europe Achondroplasia Market Revenue (US$ Mn) Comparison by Country (2016-2032)
- Table 55: Eastern Europe Achondroplasia Market Revenue (US$ Mn) (2016-2032)
- Table 56: Eastern Europe Achondroplasia Market Revenue (US$ Mn) Comparison by Country (2016-2032)
- Table 57: Eastern Europe Achondroplasia Market Revenue (US$ Mn) Comparison by By Treatment (2016-2032)
- Table 58: Eastern Europe Achondroplasia Market Revenue (US$ Mn) Comparison by By Route of Administration (2016-2032)
- Table 59: Eastern Europe Achondroplasia Market Revenue (US$ Mn) Comparison by By End-User (2016-2032)
- Table 60: Eastern Europe Achondroplasia Market Y-o-Y Growth Rate Comparison by Country (2016-2032)
- Table 61: Eastern Europe Achondroplasia Market Y-o-Y Growth Rate Comparison by By Treatment (2016-2032)
- Table 62: Eastern Europe Achondroplasia Market Y-o-Y Growth Rate Comparison by By Route of Administration (2016-2032)
- Table 63: Eastern Europe Achondroplasia Market Y-o-Y Growth Rate Comparison by By End-User (2016-2032)
- Table 64: Eastern Europe Achondroplasia Market Share Comparison by Country (2016-2032)
- Table 65: Eastern Europe Achondroplasia Market Share Comparison by By Treatment (2016-2032)
- Table 66: Eastern Europe Achondroplasia Market Share Comparison by By Route of Administration (2016-2032)
- Table 67: Eastern Europe Achondroplasia Market Share Comparison by By End-User (2016-2032)
- Table 68: APAC Achondroplasia Market Comparison by By Treatment (2016-2032)
- Table 69: APAC Achondroplasia Market Comparison by By Route of Administration (2016-2032)
- Table 70: APAC Achondroplasia Market Comparison by By End-User (2016-2032)
- Table 71: APAC Achondroplasia Market Revenue (US$ Mn) Comparison by Country (2016-2032)
- Table 72: APAC Achondroplasia Market Revenue (US$ Mn) (2016-2032)
- Table 73: APAC Achondroplasia Market Revenue (US$ Mn) Comparison by Country (2016-2032)
- Table 74: APAC Achondroplasia Market Revenue (US$ Mn) Comparison by By Treatment (2016-2032)
- Table 75: APAC Achondroplasia Market Revenue (US$ Mn) Comparison by By Route of Administration (2016-2032)
- Table 76: APAC Achondroplasia Market Revenue (US$ Mn) Comparison by By End-User (2016-2032)
- Table 77: APAC Achondroplasia Market Y-o-Y Growth Rate Comparison by Country (2016-2032)
- Table 78: APAC Achondroplasia Market Y-o-Y Growth Rate Comparison by By Treatment (2016-2032)
- Table 79: APAC Achondroplasia Market Y-o-Y Growth Rate Comparison by By Route of Administration (2016-2032)
- Table 80: APAC Achondroplasia Market Y-o-Y Growth Rate Comparison by By End-User (2016-2032)
- Table 81: APAC Achondroplasia Market Share Comparison by Country (2016-2032)
- Table 82: APAC Achondroplasia Market Share Comparison by By Treatment (2016-2032)
- Table 83: APAC Achondroplasia Market Share Comparison by By Route of Administration (2016-2032)
- Table 84: APAC Achondroplasia Market Share Comparison by By End-User (2016-2032)
- Table 85: Latin America Achondroplasia Market Comparison by By Treatment (2016-2032)
- Table 86: Latin America Achondroplasia Market Comparison by By Route of Administration (2016-2032)
- Table 87: Latin America Achondroplasia Market Comparison by By End-User (2016-2032)
- Table 88: Latin America Achondroplasia Market Revenue (US$ Mn) Comparison by Country (2016-2032)
- Table 89: Latin America Achondroplasia Market Revenue (US$ Mn) (2016-2032)
- Table 90: Latin America Achondroplasia Market Revenue (US$ Mn) Comparison by Country (2016-2032)
- Table 91: Latin America Achondroplasia Market Revenue (US$ Mn) Comparison by By Treatment (2016-2032)
- Table 92: Latin America Achondroplasia Market Revenue (US$ Mn) Comparison by By Route of Administration (2016-2032)
- Table 93: Latin America Achondroplasia Market Revenue (US$ Mn) Comparison by By End-User (2016-2032)
- Table 94: Latin America Achondroplasia Market Y-o-Y Growth Rate Comparison by Country (2016-2032)
- Table 95: Latin America Achondroplasia Market Y-o-Y Growth Rate Comparison by By Treatment (2016-2032)
- Table 96: Latin America Achondroplasia Market Y-o-Y Growth Rate Comparison by By Route of Administration (2016-2032)
- Table 97: Latin America Achondroplasia Market Y-o-Y Growth Rate Comparison by By End-User (2016-2032)
- Table 98: Latin America Achondroplasia Market Share Comparison by Country (2016-2032)
- Table 99: Latin America Achondroplasia Market Share Comparison by By Treatment (2016-2032)
- Table 100: Latin America Achondroplasia Market Share Comparison by By Route of Administration (2016-2032)
- Table 101: Latin America Achondroplasia Market Share Comparison by By End-User (2016-2032)
- Table 102: Middle East & Africa Achondroplasia Market Comparison by By Treatment (2016-2032)
- Table 103: Middle East & Africa Achondroplasia Market Comparison by By Route of Administration (2016-2032)
- Table 104: Middle East & Africa Achondroplasia Market Comparison by By End-User (2016-2032)
- Table 105: Middle East & Africa Achondroplasia Market Revenue (US$ Mn) Comparison by Country (2016-2032)
- Table 106: Middle East & Africa Achondroplasia Market Revenue (US$ Mn) (2016-2032)
- Table 107: Middle East & Africa Achondroplasia Market Revenue (US$ Mn) Comparison by Country (2016-2032)
- Table 108: Middle East & Africa Achondroplasia Market Revenue (US$ Mn) Comparison by By Treatment (2016-2032)
- Table 109: Middle East & Africa Achondroplasia Market Revenue (US$ Mn) Comparison by By Route of Administration (2016-2032)
- Table 110: Middle East & Africa Achondroplasia Market Revenue (US$ Mn) Comparison by By End-User (2016-2032)
- Table 111: Middle East & Africa Achondroplasia Market Y-o-Y Growth Rate Comparison by Country (2016-2032)
- Table 112: Middle East & Africa Achondroplasia Market Y-o-Y Growth Rate Comparison by By Treatment (2016-2032)
- Table 113: Middle East & Africa Achondroplasia Market Y-o-Y Growth Rate Comparison by By Route of Administration (2016-2032)
- Table 114: Middle East & Africa Achondroplasia Market Y-o-Y Growth Rate Comparison by By End-User (2016-2032)
- Table 115: Middle East & Africa Achondroplasia Market Share Comparison by Country (2016-2032)
- Table 116: Middle East & Africa Achondroplasia Market Share Comparison by By Treatment (2016-2032)
- Table 117: Middle East & Africa Achondroplasia Market Share Comparison by By Route of Administration (2016-2032)
- Table 118: Middle East & Africa Achondroplasia Market Share Comparison by By End-User (2016-2032)
- 1. Executive Summary
-
- Teva Pharmaceutricals Industries Ltd
- BioMarin Pharmaceutical
- F.Hoffman-La Roche Ltd.
- Aurobiondo Pharma
- Bristol-Myers Squibb Company
- GSK plc
- Ascendis Pharma A/S
- Mylan N.V.
- Johnson & Johnson
- Pfizer Inc.
- Other Key Palyers
Our Clients


View Our Licence Options
