
Zebrafish Market Report By Type (Wild-Type Zebrafish, Mutant Zebrafish, Transgenic Zebrafish), By Application (Drug Discovery and Development, Toxicology Studies, Disease Modeling, Genetic Studies, Developmental Biology Research, Regenerative Medicine Research, Behavioral Studies, Others), By End Users, By Region and Companies - Industry Segment Outlook, Market Assessment, Competition Scenario, Trends and Forecast 2024-2033
-
45695
-
May 2024
-
320
-


-
This report was compiled by Trishita Deb Trishita Deb is an experienced market research and consulting professional with over 7 years of expertise across healthcare, consumer goods, and materials, contributing to over 400 healthcare-related reports. Correspondence Team Lead- Healthcare Linkedin | Detailed Market research Methodology Our methodology involves a mix of primary research, including interviews with leading mental health experts, and secondary research from reputable medical journals and databases. View Detailed Methodology Page
-
Quick Navigation
Report Overview
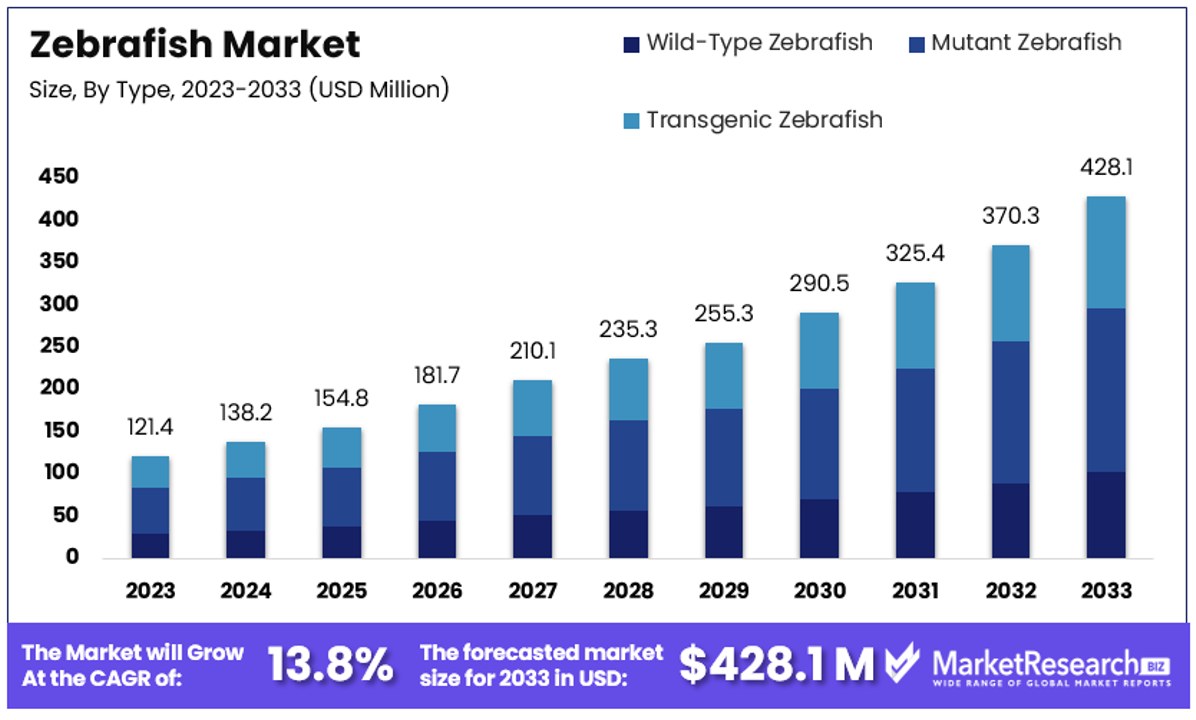
The Global Zebrafish Market size is expected to be worth around USD 428.1 Million by 2033, from USD 121.4 Million in 2023, growing at a CAGR of 13.8% during the forecast period from 2024 to 2033.
The zebrafish market encompasses the trade and utilization of zebrafish, primarily within the biomedical research sector. Zebrafish are extensively used as model organisms in genetic, pharmacological, and developmental studies due to their transparent embryos and rapid growth rates.
This market supports the demand from academic institutions, pharmaceutical companies, and biotechnology firms, offering organisms, rearing systems, and related services. The growth of this market is propelled by the increasing reliance on zebrafish for drug discovery and genomics research, making it a critical area of investment for industry leaders seeking innovative research solutions.
The Zebrafish Market is rapidly gaining traction within the biomedical research community, reflecting a broader trend towards more personalized and precise medical therapies. The expansion of this market is significantly influenced by the growth of personalized medicine.
Data indicate that the number of personalized medicines available on the market surged from 132 in 2016 to 286 in 2020, doubling within a mere four years. Furthermore, personalized medicines constituted 25% of the new drugs approved by the FDA in 2019, a sharp increase from just 5% in 2005.
This surge underscores a critical shift in therapeutic development, where tailored treatments based on individual genetic profiles are becoming the norm. Zebrafish play a pivotal role in this shift due to their genetic similarity to humans and their suitability for high-throughput screening and genetic analysis. These capabilities make zebrafish an invaluable model for studying disease mechanisms and drug responses at a personalized level.
Investment in the zebrafish market is increasingly viewed as strategic, not only for advancing scientific understanding but also for its potential economic benefits. As pharmaceutical companies and research institutions push the boundaries of personalized medicine, the demand for zebrafish as a research tool is expected to grow. This market is poised for further expansion as it continues to enable innovations in drug discovery and genetic research, highlighting its integral role in the next generation of medical advancements.
Key Takeaways
- Market Value: The Global Zebrafish Market is anticipated to reach USD 428.1 million by 2033, experiencing significant growth from USD 121.4 million in 2023, with a robust CAGR of 13.8% during the forecast period from 2024 to 2033.
- Type Analysis: Mutant Zebrafish lead with a significant percentage due to their pivotal role in specific disease modeling and genetic research, followed by Wild-Type and Transgenic Zebrafish, each serving distinct purposes in biological studies and pharmaceutical research.
- Application Analysis: Drug Discovery and Development dominates with a substantial percentage, driven by the urgent need for effective and safe pharmaceuticals, followed by Disease Modeling and Genetic Studies, reflecting the versatility and breadth of zebrafish applications.
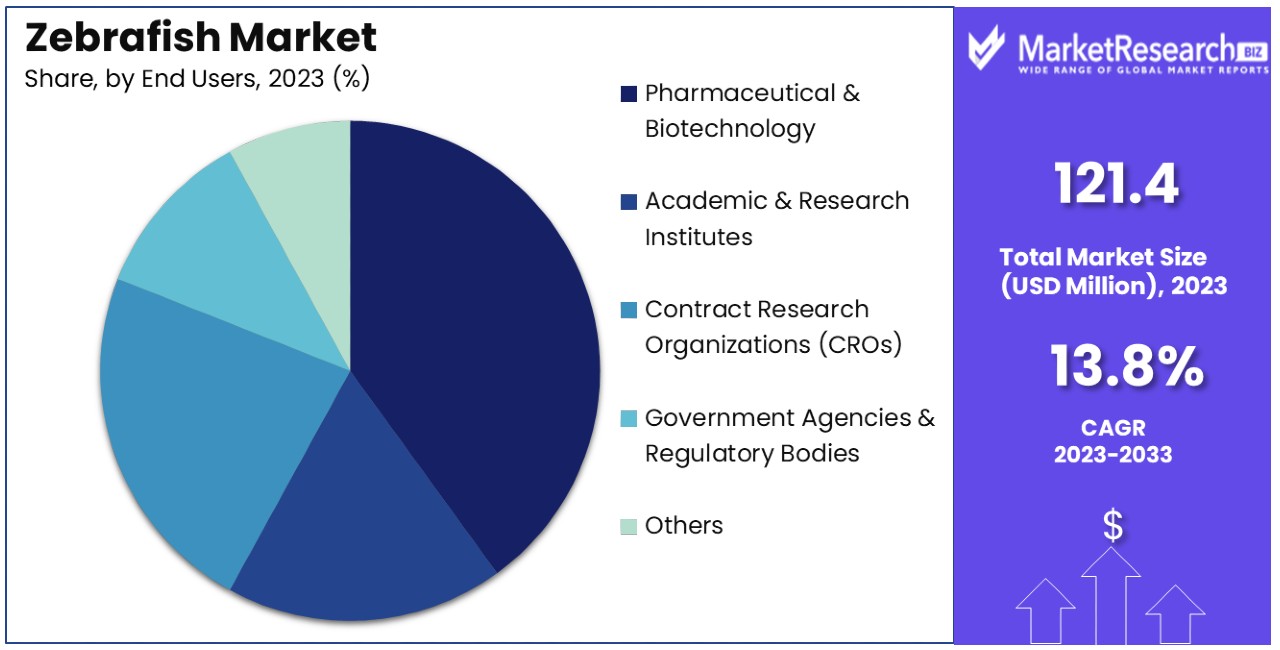
- End User Analysis: Pharmaceutical and Biotechnology Companies are the predominant end users, investing extensively in R&D for new drug development and regulatory compliance, followed by Academic and Research Institutes, Contract Research Organizations (CROs), and Government Agencies.
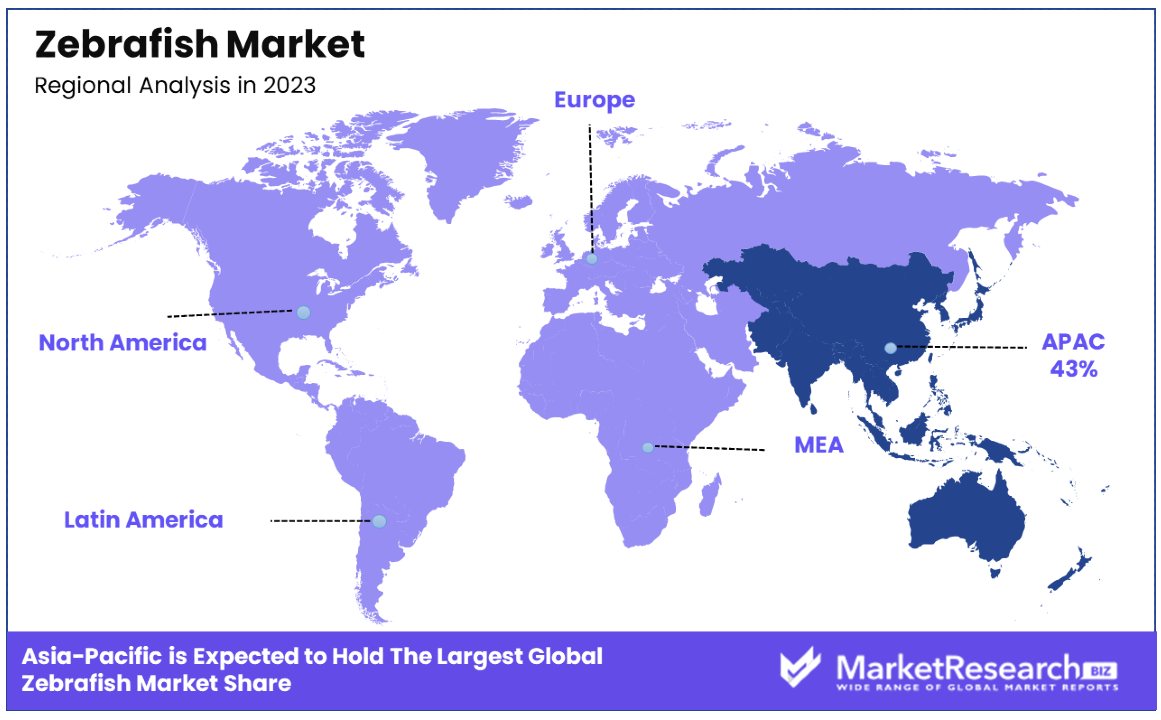
- Asia-Pacific: Dominates the market with a 43% market share, driven by significant investments in pharmaceutical research and development, particularly in countries like China, Japan, and Singapore, which are emerging as key players in biotechnology and drug discovery.
- North America: Holds approximately 29% of the global market, supported by a robust pharmaceutical industry, advanced research infrastructure, and strong regulatory frameworks that foster innovation and investment in zebrafish research.
- Analyst Viewpoint: Analysts anticipate sustained growth in the Zebrafish Market, driven by increasing demand for translational research models, advancements in genetic engineering and imaging technologies, and the expanding applications of zebrafish in drug discovery, disease modeling, and regenerative medicine.
- Growth Opportunities: Growth opportunities lie in expanding collaborations between academia, industry, and government agencies to accelerate research and innovation, investing in infrastructure for zebrafish husbandry and experimentation.
Driving Factors
Increasing Demand for Personalized Medicine Drives Market Growth
The surge in personalized medicine is a significant catalyst for the Zebrafish Market. Personalized treatments, which tailor medical therapy to individual genetic profiles, have become more prevalent, with personalized medicines representing 25% of new FDA approvals in 2019, up from 5% in 2005. Zebrafish, due to their genetic closeness to humans, are essential in this domain, particularly in the preclinical phase of drug development.
They allow researchers to explore drug efficacy and safety on a genetic level, leading to more targeted and effective therapies. Institutions like the Sanger Institute leverage zebrafish to innovate cancer treatment approaches, underscoring their value in developing precise medical solutions. This growing demand enhances the market for zebrafish as it aligns with the broader trend towards customized healthcare solutions.
Advancements in Genome Editing Technologies Drives Market Growth
The evolution of genome editing tools, notably CRISPR/Cas9, has transformed the Zebrafish Market by enabling precise genetic alterations. This advancement is crucial for creating accurate disease models, which are pivotal for drug discovery and understanding disease mechanisms.
For instance, CRISPR has been used at the University of Utah to develop zebrafish models for congenital heart diseases, illustrating how such tools facilitate rapid advancements in medical research. These technologies not only enhance the capability to mimic human diseases in zebrafish but also speed up the research process, thereby expanding the market as they become integral to modern genetic research and pharmaceutical development.
Growing Focus on Regenerative Medicine Drives Market Growth
Regenerative medicine's focus on restoring tissue function using the body's own repair mechanisms has increased the utility of zebrafish in this field. Known for their remarkable regenerative abilities, particularly in heart and fin tissues, zebrafish are invaluable for studying these processes.
Research initiatives, such as those at the Hubrecht Institute, explore cardiac regeneration in zebrafish, shedding light on potential human applications. This research niche bolsters the demand for zebrafish models, as understanding regenerative pathways in zebrafish can directly influence therapeutic approaches in humans, thereby propelling the market growth within the sphere of regenerative medicine.
Increasing Prevalence of Chronic Diseases Drives Market Growth
The global rise in chronic diseases like cancer, cardiovascular disorders, and neurological conditions has escalated the demand for innovative and effective treatments. Zebrafish are extensively utilized in the early stages of pharmaceutical development for these diseases due to their physiological resemblance to humans and the ease of observing disease progression and treatment response.
For example, the University of Edinburgh uses zebrafish in Alzheimer’s research, aiming to uncover new therapeutic strategies. This increasing reliance on zebrafish models is driven by the urgent need for new drugs and treatments, making them a cornerstone in the ongoing battle against chronic diseases, and significantly expanding their market.
Restraining Factors
Limitations in Modeling Complex Human Diseases Restrains Market Growth
Zebrafish, despite their genetic similarity to humans, face significant challenges in modeling complex human diseases that involve sophisticated physiological processes or specialized organ systems. These limitations can deter the adoption of zebrafish models in areas such as neurology and immunology, where the complexity of the diseases exceeds the capability of zebrafish to provide accurate models.
For instance, the simplicity of the zebrafish immune system and the absence of certain brain structures make them less suitable for advanced studies on autoimmune and certain neurological disorders. This mismatch restricts the applicability of zebrafish in wide-ranging pharmaceutical research, thus restraining the growth of the market in segments that require intricate disease modeling.
Regulatory Challenges and Ethical Concerns Restrains Market Growth
The use of zebrafish in scientific research, while ethically advantageous compared to higher vertebrates, is still governed by stringent regulatory frameworks and ethical standards. These regulations are designed to ensure humane treatment and responsible use of zebrafish, but they can also complicate research processes. For example, obtaining the necessary approvals for zebrafish experiments can be time-consuming and resource-intensive.
This regulatory complexity can slow the integration of zebrafish models into mainstream research and development activities, particularly in regions with strict oversight. Consequently, these ethical and regulatory challenges act as barriers to the broader adoption and development of zebrafish-based research methodologies, thus limiting market expansion.
Type Analysis
Mutant Zebrafish dominate with a significant percentage due to their crucial role in specific disease modeling and genetic research.
The Zebrafish Market is segmented into three types: Wild-Type, Mutant, and Transgenic Zebrafish. Among these, Mutant Zebrafish hold the dominant position. This is primarily because of their utility in the precise modeling of human diseases, particularly genetic disorders and their responses to various treatments. Researchers modify the DNA of zebrafish to mimic human genetic conditions, allowing for detailed studies on the onset and progression of these diseases as well as the efficacy of potential treatments.
Mutant Zebrafish are extensively utilized in high-throughput screening of drugs and genetic analysis, which are integral to advancing personalized medicine—a field that is rapidly growing as evidenced by the increasing percentage of personalized drugs approved by regulatory bodies like the FDA. The ability to engineer zebrafish with specific genetic alterations makes them invaluable for dissecting complex biological processes and drug interactions.
On the other hand, Wild-Type Zebrafish are typically used for baseline biological studies and environmental monitoring due to their unchanged genetic makeup, which provides standard data points for comparative analysis. Transgenic Zebrafish, where foreign genes are introduced, are pivotal in studying gene function and regulation. They also play a significant role in developmental biology research. However, the complex creation and maintenance processes of Transgenic Zebrafish sometimes limit their use compared to Mutant Zebrafish, which are more directly aligned with the current needs of medical research, thus affirming the latter's dominance in the market.
Application Analysis
Drug Discovery and Development dominates with a significant percentage due to the critical need for effective and safe pharmaceuticals.
Within the application segment of the Zebrafish Market, Drug Discovery and Development emerges as the dominant sub-segment. This prominence is driven by the pharmaceutical industry’s ongoing quest for newer, more effective drugs, especially in the context of rising chronic disease prevalence worldwide. Zebrafish are extensively used in the early phases of drug discovery to assess the efficacy and safety of compounds, benefiting from their translational relevance to human biology and cost-effectiveness compared to other animal models.
Zebrafish speed up the drug screening process, allowing for the rapid identification of promising compounds and the elimination of toxic or ineffective ones early in the development cycle. Their use in toxicity studies further underscores their value, as zebrafish embryos are particularly sensitive to compounds, providing early indicators of potential human toxicities.
Other application segments, such as Disease Modeling and Genetic Studies, are also critical, leveraging zebrafish for their ability to replicate human disease pathways and genetic disorders. Developmental Biology Research and Regenerative Medicine Research utilize zebrafish to explore embryonic development and tissue regeneration, respectively. Behavioral Studies and other specialized fields like Toxicology Studies further expand the application spectrum of zebrafish, but the immediate and pressing demands of drug development dictate the predominant focus of the market.
End User Analysis
Pharmaceutical and Biotechnology Companies dominate with a significant percentage due to their extensive investment in R&D for new drug development.
Among the end users in the Zebrafish Market, Pharmaceutical and Biotechnology Companies are the predominant segment. These entities invest heavily in research and development to innovate new treatments and cures, with zebrafish playing a key role in their R&D activities. The suitability of zebrafish for large-scale screening and their efficacy in modeling human diseases make them an essential component of the drug development process.
The engagement of these companies with zebrafish is also propelled by the need to comply with regulatory standards for drug safety and efficacy, which demand rigorous preclinical testing. Zebrafish models facilitate this by providing relevant biological insights that can predict human responses, thereby optimizing the research timeline and costs.
Academic and Research Institutes follow closely, utilizing zebrafish in a wide array of scientific studies, including fundamental biological research and advanced disease studies. Contract Research Organizations (CROs) and Government Agencies also leverage zebrafish to perform outsourced pharmaceutical research and regulatory studies, respectively. These sectors contribute to the zebrafish market but are overshadowed by the pharmaceutical sector's direct impact on healthcare outcomes and its intense focus on developing medical solutions.
Key Market Segments
By Type
- Wild-Type Zebrafish
- Mutant Zebrafish
- Transgenic Zebrafish
By Application
- Drug Discovery and Development
- Toxicology Studies
- Disease Modeling
- Genetic Studies
- Developmental Biology Research
- Regenerative Medicine Research
- Behavioral Studies
- Others
By End Users
- Pharmaceutical and Biotechnology Companies
- Academic and Research Institutes
- Contract Research Organizations (CROs)
- Government Agencies and Regulatory Bodies
- Others
Growth Opportunities
Expansion into Emerging Markets Offers Growth Opportunity
The Zebrafish Market is poised for significant growth in emerging economies, where the surge in biomedical research and drug development initiatives provides a fertile ground for its expansion. Nations like China, India, and Brazil are increasingly investing in life sciences research, which includes substantial funding for state-of-the-art research facilities and education centers.
For instance, the establishment of a zebrafish facility at the Indian Institute of Science Education and Research (IISER) exemplifies this trend, aiming to support varied research activities in developmental biology, neuroscience, and regenerative medicine. The growing scientific community in these regions is keen to adopt advanced research models like zebrafish to accelerate their research outputs and integrate with global scientific advancements. This expansion not only increases the market footprint but also diversifies the applications and innovations driven by zebrafish models.
Collaboration and Partnerships Offers Growth Opportunity
Strategic collaborations and partnerships between academic entities, pharmaceutical corporations, and biotechnology firms represent a substantial growth opportunity for the Zebrafish Market. These partnerships are instrumental in enhancing research capabilities through shared expertise, resources, and technological exchanges.
A prime example of such synergy is the Zebrafish International Resource Center (ZIRC) at the University of Oregon, which plays a pivotal role in distributing zebrafish lines globally and offering necessary technical support. This facilitates a broader adoption of zebrafish models across various research domains, enabling a more efficient and collaborative research environment. Through such networks, the zebrafish community not only expands its reach but also enhances its impact on advancing scientific discovery and therapeutic development, leveraging collective strengths for mutual and market-wide benefits.
Trending Factors
Adoption of Automated Systems and Robotics Are Trending Factors
The trend towards incorporating automation and robotics in zebrafish research is reshaping the landscape of biomedical studies. Automated systems designed for zebrafish care, breeding, and experimental procedures are transforming traditional research methodologies by enhancing efficiency, reducing human labor, and ensuring greater consistency in experimental outcomes.
Companies like ViewPoint Life Sciences and Techniplast are at the forefront, developing sophisticated automated housing and handling systems tailored for zebrafish. The University of Utah's adoption of these automated systems exemplifies their integration into mainstream research, streamlining operations and optimizing resource allocation. This trend is driven by the need for high-throughput screening capabilities and precision in research, making automation a key factor in the market's ongoing evolution and expansion.
Integration of Artificial Intelligence and Machine Learning Are Trending Factors
The integration of artificial intelligence (AI) and machine learning (ML) in zebrafish research represents a significant trend with the potential to revolutionize how biological and medical inquiries are conducted. AI and ML technologies are increasingly applied to analyze complex datasets from zebrafish studies, improving the accuracy and speed of image analysis, data processing, and pattern recognition.
This technology enables researchers to uncover deeper insights more quickly, particularly in the context of large-scale behavioral studies and phenotypic screenings. An example of this innovation is at the University of Cambridge, where an AI-powered system has been developed to automatically track and analyze zebrafish behavior, greatly enhancing research efficiency and effectiveness in studies related to neurodegenerative diseases. This trend not only enhances the capabilities of research but also opens new avenues for breakthroughs in understanding and treating human diseases.
Regional Analysis
Asia-Pacific Dominates with 43% Market Share
Asia-Pacific's dominant position in the Zebrafish Market can be attributed to substantial investments in biomedical research and development, coupled with rapid economic growth in key countries like China and India. The region benefits from government initiatives aimed at boosting healthcare infrastructure and research capabilities. Additionally, the increasing number of research institutions and pharmaceutical companies setting up operations in this region contributes to the high adoption of zebrafish models for drug discovery and genetic studies.
The market dynamics in Asia-Pacific are influenced by a growing focus on personalized medicine and the expansion of the biotechnology sector. The availability of skilled researchers and lower operational costs compared to Western countries further enhance the region’s appeal as a hub for scientific research. These factors collectively ensure a continuous demand for zebrafish in a variety of research applications, reinforcing the region's leading position in the global market.
Regional Market Shares and Growth:
- North America: Holding approximately 29% of the global market, North America is driven by robust research infrastructure and significant funding for genetics and pharmaceutical research.
- Europe: Europe accounts for about 22% of the market. The region’s strength lies in its strong regulatory framework supporting research and innovation in biotechnology.
- Asia-Pacific: As noted, dominates with 43% market share, buoyed by extensive growth in research facilities and healthcare investments.
- Middle East & Africa: This region captures around 4% of the market, with growth influenced by increasing healthcare research initiatives and investments in education sectors.
- Latin America: Holding 2% of the market, Latin America is slowly expanding its research capabilities and collaborations in biotechnological studies.
Key Regions and Countries
- North America
- The US
- Canada
- Mexico
- Western Europe
- Germany
- France
- The UK
- Spain
- Italy
- Portugal
- Ireland
- Austria
- Switzerland
- Benelux
- Nordic
- Rest of Western Europe
- Eastern Europe
- Russia
- Poland
- The Czech Republic
- Greece
- Rest of Eastern Europe
- APAC
- China
- Japan
- South Korea
- India
- Australia & New Zealand
- Indonesia
- Malaysia
- Philippines
- Singapore
- Thailand
- Vietnam
- Rest of APAC
- Latin America
- Brazil
- Colombia
- Chile
- Argentina
- Costa Rica
- Rest of Latin America
- Middle East & Africa
- Algeria
- Egypt
- Israel
- Kuwait
- Nigeria
- Saudi Arabia
- South Africa
- Turkey
- United Arab Emirates
- Rest of MEA
Key Players Analysis
The Zebrafish Market features several key players driving its growth and development. Among these companies are InVivo Biosystems, Hangzhou Hunter Biotechnology Co., Ltd., Shanghai Model Organisms Center Inc., Biobide Company, Charles River Laboratories Company, Eze-Rinka Company, Tecniplast, Zeon Biotech, EkkWill Waterlife Resources, Segrest Farms, Aquatic Enterprises Inc., Aquatic Habitats, Bluefin, Aquaneering Inc., and Aquatic Solutions Hawaii.
Each company in this market segment has its unique impact, strategic positioning, and market influence. InVivo Biosystems, for instance, is recognized for its advanced research tools and solutions, contributing significantly to the scientific community's understanding of zebrafish biology and behavior.
Hangzhou Hunter Biotechnology Co., Ltd., and Shanghai Model Organisms Center Inc. are key players in the Asian market, leveraging their regional presence and expertise to provide zebrafish models and services tailored to local research needs.
Biobide Company and Charles River Laboratories Company are renowned for their comprehensive portfolio of zebrafish models and services, catering to pharmaceutical and biotechnology companies worldwide. Eze-Rinka Company and Tecniplast specialize in providing state-of-the-art zebrafish housing and husbandry equipment, supporting researchers in maintaining optimal experimental conditions.
Zeon Biotech and EkkWill Waterlife Resources focus on the development of zebrafish feed and nutrition solutions, ensuring the health and vitality of research organisms. Segrest Farms and Aquatic Enterprises Inc. are prominent suppliers of zebrafish and other aquatic species, playing a crucial role in the aquaculture industry's supply chain.
Aquatic Habitats, Bluefin, Aquaneering Inc., and Aquatic Solutions Hawaii offer a range of aquatic systems and infrastructure solutions, facilitating zebrafish research in both academic and commercial settings.
Collectively, these key players contribute to the Zebrafish Market's dynamism and innovation, driving advancements in biomedical research, drug discovery, and environmental science through their diverse products, services, and expertise.
Market Key Players
- InVivo Biosystems
- Hangzhou Hunter Biotechnology Co., Ltd.
- Shanghai Model Organisms Center Inc.
- Biobide Company
- Charles River Laboratories Company
- Eze-Rinka Company
- Tecniplast
- Zeon Biotech
- EkkWill Waterlife Resources
- Segrest Farms
- Aquatic Enterprises Inc.
- Aquatic Habitats
- Bluefin
- Aquaneering Inc.
- Aquatic Solutions Hawaii
Recent Developments
- On April 2024, Ana Morão, a corporate sustainability scientist at Corbion, discussed the importance of sustainable omega-3s from microalgae fermentation. Corbion, the manufacturer of AlgaPrime DHA, provides an alternative to fish oil- and fishmeal-based feed, addressing the sustainability challenges faced by the seafood industry. The partnership with Checkerspot aims to develop specific triglyceride oils at scale, aligning with Mara Renewables' commitment to sustainable innovation.
- On April 2024, there was a discussion on the need to shift to sustainable omega-3 sources for human consumption. The focus was on the changing tide in the omega-3 industry, emphasizing the importance of transitioning to sustainable sources like life’s™OMEGA EPA and DHA from microalgae. This shift is driven by factors such as supply shortages and increased consumer preference for non-marine algal-sourced omega-3s due to concerns about marine contamination.
- On October 2023, researchers explored the effects of nanomaterials on zebrafish, particularly on their behavior and development. The study highlighted the use of zebrafish larvae as a model for assessing interactions with nanomaterials, showcasing how different shapes of nanomaterials can impact growth and development in zebrafish. This research contributes to understanding the safety and effects of nanomedicine on aquatic organisms.
Report Scope
Report Features Description Market Value (2023) USD 121.4 Million Forecast Revenue (2033) USD 428.1 Million CAGR (2024-2033) 13.80% Base Year for Estimation 2023 Historic Period 2018-2023 Forecast Period 2024-2033 Report Coverage Revenue Forecast, Market Dynamics, Competitive Landscape, Recent Developments Segments Covered By Type (Wild-Type Zebrafish, Mutant Zebrafish, Transgenic Zebrafish), By Application (Drug Discovery and Development, Toxicology Studies, Disease Modeling, Genetic Studies, Developmental Biology Research, Regenerative Medicine Research, Behavioral Studies, Others), By End Users (Pharmaceutical and Biotechnology Companies, Academic and Research Institutes, Contract Research Organizations (CROs), Government Agencies and Regulatory Bodies, Others) Regional Analysis North America - The US, Canada, & Mexico; Western Europe - Germany, France, The UK, Spain, Italy, Portugal, Ireland, Austria, Switzerland, Benelux, Nordic, & Rest of Western Europe; Eastern Europe - Russia, Poland, The Czech Republic, Greece, & Rest of Eastern Europe; APAC - China, Japan, South Korea, India, Australia & New Zealand, Indonesia, Malaysia, Philippines, Singapore, Thailand, Vietnam, & Rest of APAC; Latin America - Brazil, Colombia, Chile, Argentina, Costa Rica, & Rest of Latin America; Middle East & Africa - Algeria, Egypt, Israel, Kuwait, Nigeria, Saudi Arabia, South Africa, Turkey, United Arab Emirates, & Rest of MEA Competitive Landscape InVivo Biosystems, Hangzhou Hunter Biotechnology Co., Ltd., Shanghai Model Organisms Center Inc., Biobide Company, Charles River Laboratories Company, Eze-Rinka Company, Tecniplast, Zeon Biotech, EkkWill Waterlife Resources, Segrest Farms, Aquatic Enterprises Inc., Aquatic Habitats, Bluefin, Aquaneering Inc., Aquatic Solutions Hawaii Customization Scope Customization for segments, region/country-level will be provided. Moreover, additional customization can be done based on the requirements. Purchase Options We have three licenses to opt for: Single User License, Multi-User License (Up to 5 Users), Corporate Use License (Unlimited User and Printable PDF) -
- 1. Executive Summary
- 1.1. Definition
- 1.2. Taxonomy
- 1.3. Research Scope
- 1.4. Key Analysis
- 1.5. Key Findings by Major Segments
- 1.6. Top strategies by Major Players
- 2. Global Zebrafish Market Overview
- 2.1. Zebrafish Market Dynamics
- 2.1.1. Drivers
- 2.1.2. Opportunities
- 2.1.3. Restraints
- 2.1.4. Challenges
- 2.2. Macro-economic Factors
- 2.3. Regulatory Framework
- 2.4. Market Investment Feasibility Index
- 2.5. PEST Analysis
- 2.6. PORTER’S Five Force Analysis
- 2.7. Drivers & Restraints Impact Analysis
- 2.8. Industry Chain Analysis
- 2.9. Cost Structure Analysis
- 2.10. Marketing Strategy
- 2.11. Russia-Ukraine War Impact Analysis
- 2.12. Opportunity Map Analysis
- 2.13. Market Competition Scenario Analysis
- 2.14. Product Life Cycle Analysis
- 2.15. Opportunity Orbits
- 2.16. Manufacturer Intensity Map
- 2.17. Major Companies sales by Value & Volume
- 2.1. Zebrafish Market Dynamics
- 3. Global Zebrafish Market Analysis, Opportunity and Forecast, 2016-2032
- 3.1. Global Zebrafish Market Analysis, 2016-2021
- 3.2. Global Zebrafish Market Opportunity and Forecast, 2023-2032
- 3.3. Global Zebrafish Market Analysis, Opportunity and Forecast, By Type, 2016-2032
- 3.3.1. Global Zebrafish Market Analysis by Type: Introduction
- 3.3.2. Market Size Absolute $ Opportunity Analysis and Forecast, By Type, 2016-2032
- 3.3.3. Wild-Type Zebrafish
- 3.3.4. Mutant Zebrafish
- 3.3.5. Transgenic Zebrafish
- 3.4. Global Zebrafish Market Analysis, Opportunity and Forecast, By Application, 2016-2032
- 3.4.1. Global Zebrafish Market Analysis by Application: Introduction
- 3.4.2. Market Size Absolute $ Opportunity Analysis and Forecast, By Application, 2016-2032
- 3.4.3. Drug Discovery and Development
- 3.4.4. Toxicology Studies
- 3.4.5. Disease Modeling
- 3.4.6. Genetic Studies
- 3.4.7. Developmental Biology Research
- 3.4.8. Regenerative Medicine Research
- 3.4.9. Behavioral Studies
- 3.4.10. Others
- 3.5. Global Zebrafish Market Analysis, Opportunity and Forecast, By End Users, 2016-2032
- 3.5.1. Global Zebrafish Market Analysis by End Users: Introduction
- 3.5.2. Market Size Absolute $ Opportunity Analysis and Forecast, By End Users, 2016-2032
- 3.5.3. Pharmaceutical and Biotechnology Companies
- 3.5.4. Academic and Research Institutes
- 3.5.5. Contract Research Organizations (CROs)
- 3.5.6. Government Agencies and Regulatory Bodies
- 3.5.7. Others
- 4. North America Zebrafish Market Analysis, Opportunity and Forecast, 2016-2032
- 4.1. North America Zebrafish Market Analysis, 2016-2021
- 4.2. North America Zebrafish Market Opportunity and Forecast, 2023-2032
- 4.3. North America Zebrafish Market Analysis, Opportunity and Forecast, By Type, 2016-2032
- 4.3.1. North America Zebrafish Market Analysis by Type: Introduction
- 4.3.2. Market Size Absolute $ Opportunity Analysis and Forecast, By Type, 2016-2032
- 4.3.3. Wild-Type Zebrafish
- 4.3.4. Mutant Zebrafish
- 4.3.5. Transgenic Zebrafish
- 4.4. North America Zebrafish Market Analysis, Opportunity and Forecast, By Application, 2016-2032
- 4.4.1. North America Zebrafish Market Analysis by Application: Introduction
- 4.4.2. Market Size Absolute $ Opportunity Analysis and Forecast, By Application, 2016-2032
- 4.4.3. Drug Discovery and Development
- 4.4.4. Toxicology Studies
- 4.4.5. Disease Modeling
- 4.4.6. Genetic Studies
- 4.4.7. Developmental Biology Research
- 4.4.8. Regenerative Medicine Research
- 4.4.9. Behavioral Studies
- 4.4.10. Others
- 4.5. North America Zebrafish Market Analysis, Opportunity and Forecast, By End Users, 2016-2032
- 4.5.1. North America Zebrafish Market Analysis by End Users: Introduction
- 4.5.2. Market Size Absolute $ Opportunity Analysis and Forecast, By End Users, 2016-2032
- 4.5.3. Pharmaceutical and Biotechnology Companies
- 4.5.4. Academic and Research Institutes
- 4.5.5. Contract Research Organizations (CROs)
- 4.5.6. Government Agencies and Regulatory Bodies
- 4.5.7. Others
- 4.6. North America Zebrafish Market Analysis, Opportunity and Forecast, By Country , 2016-2032
- 4.6.1. North America Zebrafish Market Analysis by Country : Introduction
- 4.6.2. Market Size Absolute $ Opportunity Analysis and Forecast, Country , 2016-2032
- 4.6.2.1. The US
- 4.6.2.2. Canada
- 4.6.2.3. Mexico
- 5. Western Europe Zebrafish Market Analysis, Opportunity and Forecast, 2016-2032
- 5.1. Western Europe Zebrafish Market Analysis, 2016-2021
- 5.2. Western Europe Zebrafish Market Opportunity and Forecast, 2023-2032
- 5.3. Western Europe Zebrafish Market Analysis, Opportunity and Forecast, By Type, 2016-2032
- 5.3.1. Western Europe Zebrafish Market Analysis by Type: Introduction
- 5.3.2. Market Size Absolute $ Opportunity Analysis and Forecast, By Type, 2016-2032
- 5.3.3. Wild-Type Zebrafish
- 5.3.4. Mutant Zebrafish
- 5.3.5. Transgenic Zebrafish
- 5.4. Western Europe Zebrafish Market Analysis, Opportunity and Forecast, By Application, 2016-2032
- 5.4.1. Western Europe Zebrafish Market Analysis by Application: Introduction
- 5.4.2. Market Size Absolute $ Opportunity Analysis and Forecast, By Application, 2016-2032
- 5.4.3. Drug Discovery and Development
- 5.4.4. Toxicology Studies
- 5.4.5. Disease Modeling
- 5.4.6. Genetic Studies
- 5.4.7. Developmental Biology Research
- 5.4.8. Regenerative Medicine Research
- 5.4.9. Behavioral Studies
- 5.4.10. Others
- 5.5. Western Europe Zebrafish Market Analysis, Opportunity and Forecast, By End Users, 2016-2032
- 5.5.1. Western Europe Zebrafish Market Analysis by End Users: Introduction
- 5.5.2. Market Size Absolute $ Opportunity Analysis and Forecast, By End Users, 2016-2032
- 5.5.3. Pharmaceutical and Biotechnology Companies
- 5.5.4. Academic and Research Institutes
- 5.5.5. Contract Research Organizations (CROs)
- 5.5.6. Government Agencies and Regulatory Bodies
- 5.5.7. Others
- 5.6. Western Europe Zebrafish Market Analysis, Opportunity and Forecast, By Country , 2016-2032
- 5.6.1. Western Europe Zebrafish Market Analysis by Country : Introduction
- 5.6.2. Market Size Absolute $ Opportunity Analysis and Forecast, Country , 2016-2032
- 5.6.2.1. Germany
- 5.6.2.2. France
- 5.6.2.3. The UK
- 5.6.2.4. Spain
- 5.6.2.5. Italy
- 5.6.2.6. Portugal
- 5.6.2.7. Ireland
- 5.6.2.8. Austria
- 5.6.2.9. Switzerland
- 5.6.2.10. Benelux
- 5.6.2.11. Nordic
- 5.6.2.12. Rest of Western Europe
- 6. Eastern Europe Zebrafish Market Analysis, Opportunity and Forecast, 2016-2032
- 6.1. Eastern Europe Zebrafish Market Analysis, 2016-2021
- 6.2. Eastern Europe Zebrafish Market Opportunity and Forecast, 2023-2032
- 6.3. Eastern Europe Zebrafish Market Analysis, Opportunity and Forecast, By Type, 2016-2032
- 6.3.1. Eastern Europe Zebrafish Market Analysis by Type: Introduction
- 6.3.2. Market Size Absolute $ Opportunity Analysis and Forecast, By Type, 2016-2032
- 6.3.3. Wild-Type Zebrafish
- 6.3.4. Mutant Zebrafish
- 6.3.5. Transgenic Zebrafish
- 6.4. Eastern Europe Zebrafish Market Analysis, Opportunity and Forecast, By Application, 2016-2032
- 6.4.1. Eastern Europe Zebrafish Market Analysis by Application: Introduction
- 6.4.2. Market Size Absolute $ Opportunity Analysis and Forecast, By Application, 2016-2032
- 6.4.3. Drug Discovery and Development
- 6.4.4. Toxicology Studies
- 6.4.5. Disease Modeling
- 6.4.6. Genetic Studies
- 6.4.7. Developmental Biology Research
- 6.4.8. Regenerative Medicine Research
- 6.4.9. Behavioral Studies
- 6.4.10. Others
- 6.5. Eastern Europe Zebrafish Market Analysis, Opportunity and Forecast, By End Users, 2016-2032
- 6.5.1. Eastern Europe Zebrafish Market Analysis by End Users: Introduction
- 6.5.2. Market Size Absolute $ Opportunity Analysis and Forecast, By End Users, 2016-2032
- 6.5.3. Pharmaceutical and Biotechnology Companies
- 6.5.4. Academic and Research Institutes
- 6.5.5. Contract Research Organizations (CROs)
- 6.5.6. Government Agencies and Regulatory Bodies
- 6.5.7. Others
- 6.6. Eastern Europe Zebrafish Market Analysis, Opportunity and Forecast, By Country , 2016-2032
- 6.6.1. Eastern Europe Zebrafish Market Analysis by Country : Introduction
- 6.6.2. Market Size Absolute $ Opportunity Analysis and Forecast, Country , 2016-2032
- 6.6.2.1. Russia
- 6.6.2.2. Poland
- 6.6.2.3. The Czech Republic
- 6.6.2.4. Greece
- 6.6.2.5. Rest of Eastern Europe
- 7. APAC Zebrafish Market Analysis, Opportunity and Forecast, 2016-2032
- 7.1. APAC Zebrafish Market Analysis, 2016-2021
- 7.2. APAC Zebrafish Market Opportunity and Forecast, 2023-2032
- 7.3. APAC Zebrafish Market Analysis, Opportunity and Forecast, By Type, 2016-2032
- 7.3.1. APAC Zebrafish Market Analysis by Type: Introduction
- 7.3.2. Market Size Absolute $ Opportunity Analysis and Forecast, By Type, 2016-2032
- 7.3.3. Wild-Type Zebrafish
- 7.3.4. Mutant Zebrafish
- 7.3.5. Transgenic Zebrafish
- 7.4. APAC Zebrafish Market Analysis, Opportunity and Forecast, By Application, 2016-2032
- 7.4.1. APAC Zebrafish Market Analysis by Application: Introduction
- 7.4.2. Market Size Absolute $ Opportunity Analysis and Forecast, By Application, 2016-2032
- 7.4.3. Drug Discovery and Development
- 7.4.4. Toxicology Studies
- 7.4.5. Disease Modeling
- 7.4.6. Genetic Studies
- 7.4.7. Developmental Biology Research
- 7.4.8. Regenerative Medicine Research
- 7.4.9. Behavioral Studies
- 7.4.10. Others
- 7.5. APAC Zebrafish Market Analysis, Opportunity and Forecast, By End Users, 2016-2032
- 7.5.1. APAC Zebrafish Market Analysis by End Users: Introduction
- 7.5.2. Market Size Absolute $ Opportunity Analysis and Forecast, By End Users, 2016-2032
- 7.5.3. Pharmaceutical and Biotechnology Companies
- 7.5.4. Academic and Research Institutes
- 7.5.5. Contract Research Organizations (CROs)
- 7.5.6. Government Agencies and Regulatory Bodies
- 7.5.7. Others
- 7.6. APAC Zebrafish Market Analysis, Opportunity and Forecast, By Country , 2016-2032
- 7.6.1. APAC Zebrafish Market Analysis by Country : Introduction
- 7.6.2. Market Size Absolute $ Opportunity Analysis and Forecast, Country , 2016-2032
- 7.6.2.1. China
- 7.6.2.2. Japan
- 7.6.2.3. South Korea
- 7.6.2.4. India
- 7.6.2.5. Australia & New Zeland
- 7.6.2.6. Indonesia
- 7.6.2.7. Malaysia
- 7.6.2.8. Philippines
- 7.6.2.9. Singapore
- 7.6.2.10. Thailand
- 7.6.2.11. Vietnam
- 7.6.2.12. Rest of APAC
- 8. Latin America Zebrafish Market Analysis, Opportunity and Forecast, 2016-2032
- 8.1. Latin America Zebrafish Market Analysis, 2016-2021
- 8.2. Latin America Zebrafish Market Opportunity and Forecast, 2023-2032
- 8.3. Latin America Zebrafish Market Analysis, Opportunity and Forecast, By Type, 2016-2032
- 8.3.1. Latin America Zebrafish Market Analysis by Type: Introduction
- 8.3.2. Market Size Absolute $ Opportunity Analysis and Forecast, By Type, 2016-2032
- 8.3.3. Wild-Type Zebrafish
- 8.3.4. Mutant Zebrafish
- 8.3.5. Transgenic Zebrafish
- 8.4. Latin America Zebrafish Market Analysis, Opportunity and Forecast, By Application, 2016-2032
- 8.4.1. Latin America Zebrafish Market Analysis by Application: Introduction
- 8.4.2. Market Size Absolute $ Opportunity Analysis and Forecast, By Application, 2016-2032
- 8.4.3. Drug Discovery and Development
- 8.4.4. Toxicology Studies
- 8.4.5. Disease Modeling
- 8.4.6. Genetic Studies
- 8.4.7. Developmental Biology Research
- 8.4.8. Regenerative Medicine Research
- 8.4.9. Behavioral Studies
- 8.4.10. Others
- 8.5. Latin America Zebrafish Market Analysis, Opportunity and Forecast, By End Users, 2016-2032
- 8.5.1. Latin America Zebrafish Market Analysis by End Users: Introduction
- 8.5.2. Market Size Absolute $ Opportunity Analysis and Forecast, By End Users, 2016-2032
- 8.5.3. Pharmaceutical and Biotechnology Companies
- 8.5.4. Academic and Research Institutes
- 8.5.5. Contract Research Organizations (CROs)
- 8.5.6. Government Agencies and Regulatory Bodies
- 8.5.7. Others
- 8.6. Latin America Zebrafish Market Analysis, Opportunity and Forecast, By Country , 2016-2032
- 8.6.1. Latin America Zebrafish Market Analysis by Country : Introduction
- 8.6.2. Market Size Absolute $ Opportunity Analysis and Forecast, Country , 2016-2032
- 8.6.2.1. Brazil
- 8.6.2.2. Colombia
- 8.6.2.3. Chile
- 8.6.2.4. Argentina
- 8.6.2.5. Costa Rica
- 8.6.2.6. Rest of Latin America
- 9. Middle East & Africa Zebrafish Market Analysis, Opportunity and Forecast, 2016-2032
- 9.1. Middle East & Africa Zebrafish Market Analysis, 2016-2021
- 9.2. Middle East & Africa Zebrafish Market Opportunity and Forecast, 2023-2032
- 9.3. Middle East & Africa Zebrafish Market Analysis, Opportunity and Forecast, By Type, 2016-2032
- 9.3.1. Middle East & Africa Zebrafish Market Analysis by Type: Introduction
- 9.3.2. Market Size Absolute $ Opportunity Analysis and Forecast, By Type, 2016-2032
- 9.3.3. Wild-Type Zebrafish
- 9.3.4. Mutant Zebrafish
- 9.3.5. Transgenic Zebrafish
- 9.4. Middle East & Africa Zebrafish Market Analysis, Opportunity and Forecast, By Application, 2016-2032
- 9.4.1. Middle East & Africa Zebrafish Market Analysis by Application: Introduction
- 9.4.2. Market Size Absolute $ Opportunity Analysis and Forecast, By Application, 2016-2032
- 9.4.3. Drug Discovery and Development
- 9.4.4. Toxicology Studies
- 9.4.5. Disease Modeling
- 9.4.6. Genetic Studies
- 9.4.7. Developmental Biology Research
- 9.4.8. Regenerative Medicine Research
- 9.4.9. Behavioral Studies
- 9.4.10. Others
- 9.5. Middle East & Africa Zebrafish Market Analysis, Opportunity and Forecast, By End Users, 2016-2032
- 9.5.1. Middle East & Africa Zebrafish Market Analysis by End Users: Introduction
- 9.5.2. Market Size Absolute $ Opportunity Analysis and Forecast, By End Users, 2016-2032
- 9.5.3. Pharmaceutical and Biotechnology Companies
- 9.5.4. Academic and Research Institutes
- 9.5.5. Contract Research Organizations (CROs)
- 9.5.6. Government Agencies and Regulatory Bodies
- 9.5.7. Others
- 9.6. Middle East & Africa Zebrafish Market Analysis, Opportunity and Forecast, By Country , 2016-2032
- 9.6.1. Middle East & Africa Zebrafish Market Analysis by Country : Introduction
- 9.6.2. Market Size Absolute $ Opportunity Analysis and Forecast, Country , 2016-2032
- 9.6.2.1. Algeria
- 9.6.2.2. Egypt
- 9.6.2.3. Israel
- 9.6.2.4. Kuwait
- 9.6.2.5. Nigeria
- 9.6.2.6. Saudi Arabia
- 9.6.2.7. South Africa
- 9.6.2.8. Turkey
- 9.6.2.9. The UAE
- 9.6.2.10. Rest of MEA
- 10. Global Zebrafish Market Analysis, Opportunity and Forecast, By Region , 2016-2032
- 10.1. Global Zebrafish Market Analysis by Region : Introduction
- 10.2. Market Size Absolute $ Opportunity Analysis and Forecast, By Region , 2016-2032
- 10.2.1. North America
- 10.2.2. Western Europe
- 10.2.3. Eastern Europe
- 10.2.4. APAC
- 10.2.5. Latin America
- 10.2.6. Middle East & Africa
- 11. Global Zebrafish Market Competitive Landscape, Market Share Analysis, and Company Profiles
- 11.1. Market Share Analysis
- 11.2. Company Profiles
- 11.3. InVivo Biosystems
- 11.3.1. Company Overview
- 11.3.2. Financial Highlights
- 11.3.3. Product Portfolio
- 11.3.4. SWOT Analysis
- 11.3.5. Key Strategies and Developments
- 11.4. Hangzhou Hunter Biotechnology Co., Ltd.
- 11.4.1. Company Overview
- 11.4.2. Financial Highlights
- 11.4.3. Product Portfolio
- 11.4.4. SWOT Analysis
- 11.4.5. Key Strategies and Developments
- 11.5. Shanghai Model Organisms Center Inc.
- 11.5.1. Company Overview
- 11.5.2. Financial Highlights
- 11.5.3. Product Portfolio
- 11.5.4. SWOT Analysis
- 11.5.5. Key Strategies and Developments
- 11.6. Biobide Company
- 11.6.1. Company Overview
- 11.6.2. Financial Highlights
- 11.6.3. Product Portfolio
- 11.6.4. SWOT Analysis
- 11.6.5. Key Strategies and Developments
- 11.7. Charles River Laboratories Company
- 11.7.1. Company Overview
- 11.7.2. Financial Highlights
- 11.7.3. Product Portfolio
- 11.7.4. SWOT Analysis
- 11.7.5. Key Strategies and Developments
- 11.8. Eze-Rinka Company
- 11.8.1. Company Overview
- 11.8.2. Financial Highlights
- 11.8.3. Product Portfolio
- 11.8.4. SWOT Analysis
- 11.8.5. Key Strategies and Developments
- 11.9. Tecniplast
- 11.9.1. Company Overview
- 11.9.2. Financial Highlights
- 11.9.3. Product Portfolio
- 11.9.4. SWOT Analysis
- 11.9.5. Key Strategies and Developments
- 11.10. Zeon Biotech
- 11.10.1. Company Overview
- 11.10.2. Financial Highlights
- 11.10.3. Product Portfolio
- 11.10.4. SWOT Analysis
- 11.10.5. Key Strategies and Developments
- 11.11. EkkWill Waterlife Resources
- 11.11.1. Company Overview
- 11.11.2. Financial Highlights
- 11.11.3. Product Portfolio
- 11.11.4. SWOT Analysis
- 11.11.5. Key Strategies and Developments
- 11.12. Segrest Farms
- 11.12.1. Company Overview
- 11.12.2. Financial Highlights
- 11.12.3. Product Portfolio
- 11.12.4. SWOT Analysis
- 11.12.5. Key Strategies and Developments
- 11.13.1. Company Overview
- 11.13.2. Financial Highlights
- 11.13.3. Product Portfolio
- 11.13.4. SWOT Analysis
- 11.13.5. Key Strategies and Developments
- 11.14. Aquatic Enterprises Inc.
- 11.14.1. Company Overview
- 11.14.2. Financial Highlights
- 11.14.3. Product Portfolio
- 11.14.4. SWOT Analysis
- 11.14.5. Key Strategies and Developments
- 11.15. Bluefin
- 11.15.1. Company Overview
- 11.15.2. Financial Highlights
- 11.15.3. Product Portfolio
- 11.15.4. SWOT Analysis
- 11.15.5. Key Strategies and Developments
- 11.16. Aquaneering Inc.
- 11.16.1. Company Overview
- 11.16.2. Financial Highlights
- 11.16.3. Product Portfolio
- 11.16.4. SWOT Analysis
- 11.16.5. Key Strategies and Developments
- 12. Assumptions and Acronyms
- 13. Research Methodology
- 14. Contact
- List of Figures
- Figure 1: Global Zebrafish Market Revenue (US$ Mn) Market Share by Type in 2022
- Figure 2: Global Zebrafish Market Attractiveness Analysis by Type, 2016-2032
- Figure 3: Global Zebrafish Market Revenue (US$ Mn) Market Share by Applicationin 2022
- Figure 4: Global Zebrafish Market Attractiveness Analysis by Application, 2016-2032
- Figure 5: Global Zebrafish Market Revenue (US$ Mn) Market Share by End Usersin 2022
- Figure 6: Global Zebrafish Market Attractiveness Analysis by End Users, 2016-2032
- Figure 7: Global Zebrafish Market Revenue (US$ Mn) Market Share by Region in 2022
- Figure 8: Global Zebrafish Market Attractiveness Analysis by Region, 2016-2032
- Figure 9: Global Zebrafish Market Revenue (US$ Mn) (2016-2032)
- Figure 10: Global Zebrafish Market Revenue (US$ Mn) Comparison by Region (2016-2032)
- Figure 11: Global Zebrafish Market Revenue (US$ Mn) Comparison by Type (2016-2032)
- Figure 12: Global Zebrafish Market Revenue (US$ Mn) Comparison by Application (2016-2032)
- Figure 13: Global Zebrafish Market Revenue (US$ Mn) Comparison by End Users (2016-2032)
- Figure 14: Global Zebrafish Market Y-o-Y Growth Rate Comparison by Region (2016-2032)
- Figure 15: Global Zebrafish Market Y-o-Y Growth Rate Comparison by Type (2016-2032)
- Figure 16: Global Zebrafish Market Y-o-Y Growth Rate Comparison by Application (2016-2032)
- Figure 17: Global Zebrafish Market Y-o-Y Growth Rate Comparison by End Users (2016-2032)
- Figure 18: Global Zebrafish Market Share Comparison by Region (2016-2032)
- Figure 19: Global Zebrafish Market Share Comparison by Type (2016-2032)
- Figure 20: Global Zebrafish Market Share Comparison by Application (2016-2032)
- Figure 21: Global Zebrafish Market Share Comparison by End Users (2016-2032)
- Figure 22: North America Zebrafish Market Revenue (US$ Mn) Market Share by Typein 2022
- Figure 23: North America Zebrafish Market Attractiveness Analysis by Type, 2016-2032
- Figure 24: North America Zebrafish Market Revenue (US$ Mn) Market Share by Applicationin 2022
- Figure 25: North America Zebrafish Market Attractiveness Analysis by Application, 2016-2032
- Figure 26: North America Zebrafish Market Revenue (US$ Mn) Market Share by End Usersin 2022
- Figure 27: North America Zebrafish Market Attractiveness Analysis by End Users, 2016-2032
- Figure 28: North America Zebrafish Market Revenue (US$ Mn) Market Share by Country in 2022
- Figure 29: North America Zebrafish Market Attractiveness Analysis by Country, 2016-2032
- Figure 30: North America Zebrafish Market Revenue (US$ Mn) (2016-2032)
- Figure 31: North America Zebrafish Market Revenue (US$ Mn) Comparison by Country (2016-2032)
- Figure 32: North America Zebrafish Market Revenue (US$ Mn) Comparison by Type (2016-2032)
- Figure 33: North America Zebrafish Market Revenue (US$ Mn) Comparison by Application (2016-2032)
- Figure 34: North America Zebrafish Market Revenue (US$ Mn) Comparison by End Users (2016-2032)
- Figure 35: North America Zebrafish Market Y-o-Y Growth Rate Comparison by Country (2016-2032)
- Figure 36: North America Zebrafish Market Y-o-Y Growth Rate Comparison by Type (2016-2032)
- Figure 37: North America Zebrafish Market Y-o-Y Growth Rate Comparison by Application (2016-2032)
- Figure 38: North America Zebrafish Market Y-o-Y Growth Rate Comparison by End Users (2016-2032)
- Figure 39: North America Zebrafish Market Share Comparison by Country (2016-2032)
- Figure 40: North America Zebrafish Market Share Comparison by Type (2016-2032)
- Figure 41: North America Zebrafish Market Share Comparison by Application (2016-2032)
- Figure 42: North America Zebrafish Market Share Comparison by End Users (2016-2032)
- Figure 43: Western Europe Zebrafish Market Revenue (US$ Mn) Market Share by Typein 2022
- Figure 44: Western Europe Zebrafish Market Attractiveness Analysis by Type, 2016-2032
- Figure 45: Western Europe Zebrafish Market Revenue (US$ Mn) Market Share by Applicationin 2022
- Figure 46: Western Europe Zebrafish Market Attractiveness Analysis by Application, 2016-2032
- Figure 47: Western Europe Zebrafish Market Revenue (US$ Mn) Market Share by End Usersin 2022
- Figure 48: Western Europe Zebrafish Market Attractiveness Analysis by End Users, 2016-2032
- Figure 49: Western Europe Zebrafish Market Revenue (US$ Mn) Market Share by Country in 2022
- Figure 50: Western Europe Zebrafish Market Attractiveness Analysis by Country, 2016-2032
- Figure 51: Western Europe Zebrafish Market Revenue (US$ Mn) (2016-2032)
- Figure 52: Western Europe Zebrafish Market Revenue (US$ Mn) Comparison by Country (2016-2032)
- Figure 53: Western Europe Zebrafish Market Revenue (US$ Mn) Comparison by Type (2016-2032)
- Figure 54: Western Europe Zebrafish Market Revenue (US$ Mn) Comparison by Application (2016-2032)
- Figure 55: Western Europe Zebrafish Market Revenue (US$ Mn) Comparison by End Users (2016-2032)
- Figure 56: Western Europe Zebrafish Market Y-o-Y Growth Rate Comparison by Country (2016-2032)
- Figure 57: Western Europe Zebrafish Market Y-o-Y Growth Rate Comparison by Type (2016-2032)
- Figure 58: Western Europe Zebrafish Market Y-o-Y Growth Rate Comparison by Application (2016-2032)
- Figure 59: Western Europe Zebrafish Market Y-o-Y Growth Rate Comparison by End Users (2016-2032)
- Figure 60: Western Europe Zebrafish Market Share Comparison by Country (2016-2032)
- Figure 61: Western Europe Zebrafish Market Share Comparison by Type (2016-2032)
- Figure 62: Western Europe Zebrafish Market Share Comparison by Application (2016-2032)
- Figure 63: Western Europe Zebrafish Market Share Comparison by End Users (2016-2032)
- Figure 64: Eastern Europe Zebrafish Market Revenue (US$ Mn) Market Share by Typein 2022
- Figure 65: Eastern Europe Zebrafish Market Attractiveness Analysis by Type, 2016-2032
- Figure 66: Eastern Europe Zebrafish Market Revenue (US$ Mn) Market Share by Applicationin 2022
- Figure 67: Eastern Europe Zebrafish Market Attractiveness Analysis by Application, 2016-2032
- Figure 68: Eastern Europe Zebrafish Market Revenue (US$ Mn) Market Share by End Usersin 2022
- Figure 69: Eastern Europe Zebrafish Market Attractiveness Analysis by End Users, 2016-2032
- Figure 70: Eastern Europe Zebrafish Market Revenue (US$ Mn) Market Share by Country in 2022
- Figure 71: Eastern Europe Zebrafish Market Attractiveness Analysis by Country, 2016-2032
- Figure 72: Eastern Europe Zebrafish Market Revenue (US$ Mn) (2016-2032)
- Figure 73: Eastern Europe Zebrafish Market Revenue (US$ Mn) Comparison by Country (2016-2032)
- Figure 74: Eastern Europe Zebrafish Market Revenue (US$ Mn) Comparison by Type (2016-2032)
- Figure 75: Eastern Europe Zebrafish Market Revenue (US$ Mn) Comparison by Application (2016-2032)
- Figure 76: Eastern Europe Zebrafish Market Revenue (US$ Mn) Comparison by End Users (2016-2032)
- Figure 77: Eastern Europe Zebrafish Market Y-o-Y Growth Rate Comparison by Country (2016-2032)
- Figure 78: Eastern Europe Zebrafish Market Y-o-Y Growth Rate Comparison by Type (2016-2032)
- Figure 79: Eastern Europe Zebrafish Market Y-o-Y Growth Rate Comparison by Application (2016-2032)
- Figure 80: Eastern Europe Zebrafish Market Y-o-Y Growth Rate Comparison by End Users (2016-2032)
- Figure 81: Eastern Europe Zebrafish Market Share Comparison by Country (2016-2032)
- Figure 82: Eastern Europe Zebrafish Market Share Comparison by Type (2016-2032)
- Figure 83: Eastern Europe Zebrafish Market Share Comparison by Application (2016-2032)
- Figure 84: Eastern Europe Zebrafish Market Share Comparison by End Users (2016-2032)
- Figure 85: APAC Zebrafish Market Revenue (US$ Mn) Market Share by Typein 2022
- Figure 86: APAC Zebrafish Market Attractiveness Analysis by Type, 2016-2032
- Figure 87: APAC Zebrafish Market Revenue (US$ Mn) Market Share by Applicationin 2022
- Figure 88: APAC Zebrafish Market Attractiveness Analysis by Application, 2016-2032
- Figure 89: APAC Zebrafish Market Revenue (US$ Mn) Market Share by End Usersin 2022
- Figure 90: APAC Zebrafish Market Attractiveness Analysis by End Users, 2016-2032
- Figure 91: APAC Zebrafish Market Revenue (US$ Mn) Market Share by Country in 2022
- Figure 92: APAC Zebrafish Market Attractiveness Analysis by Country, 2016-2032
- Figure 93: APAC Zebrafish Market Revenue (US$ Mn) (2016-2032)
- Figure 94: APAC Zebrafish Market Revenue (US$ Mn) Comparison by Country (2016-2032)
- Figure 95: APAC Zebrafish Market Revenue (US$ Mn) Comparison by Type (2016-2032)
- Figure 96: APAC Zebrafish Market Revenue (US$ Mn) Comparison by Application (2016-2032)
- Figure 97: APAC Zebrafish Market Revenue (US$ Mn) Comparison by End Users (2016-2032)
- Figure 98: APAC Zebrafish Market Y-o-Y Growth Rate Comparison by Country (2016-2032)
- Figure 99: APAC Zebrafish Market Y-o-Y Growth Rate Comparison by Type (2016-2032)
- Figure 100: APAC Zebrafish Market Y-o-Y Growth Rate Comparison by Application (2016-2032)
- Figure 101: APAC Zebrafish Market Y-o-Y Growth Rate Comparison by End Users (2016-2032)
- Figure 102: APAC Zebrafish Market Share Comparison by Country (2016-2032)
- Figure 103: APAC Zebrafish Market Share Comparison by Type (2016-2032)
- Figure 104: APAC Zebrafish Market Share Comparison by Application (2016-2032)
- Figure 105: APAC Zebrafish Market Share Comparison by End Users (2016-2032)
- Figure 106: Latin America Zebrafish Market Revenue (US$ Mn) Market Share by Typein 2022
- Figure 107: Latin America Zebrafish Market Attractiveness Analysis by Type, 2016-2032
- Figure 108: Latin America Zebrafish Market Revenue (US$ Mn) Market Share by Applicationin 2022
- Figure 109: Latin America Zebrafish Market Attractiveness Analysis by Application, 2016-2032
- Figure 110: Latin America Zebrafish Market Revenue (US$ Mn) Market Share by End Usersin 2022
- Figure 111: Latin America Zebrafish Market Attractiveness Analysis by End Users, 2016-2032
- Figure 112: Latin America Zebrafish Market Revenue (US$ Mn) Market Share by Country in 2022
- Figure 113: Latin America Zebrafish Market Attractiveness Analysis by Country, 2016-2032
- Figure 114: Latin America Zebrafish Market Revenue (US$ Mn) (2016-2032)
- Figure 115: Latin America Zebrafish Market Revenue (US$ Mn) Comparison by Country (2016-2032)
- Figure 116: Latin America Zebrafish Market Revenue (US$ Mn) Comparison by Type (2016-2032)
- Figure 117: Latin America Zebrafish Market Revenue (US$ Mn) Comparison by Application (2016-2032)
- Figure 118: Latin America Zebrafish Market Revenue (US$ Mn) Comparison by End Users (2016-2032)
- Figure 119: Latin America Zebrafish Market Y-o-Y Growth Rate Comparison by Country (2016-2032)
- Figure 120: Latin America Zebrafish Market Y-o-Y Growth Rate Comparison by Type (2016-2032)
- Figure 121: Latin America Zebrafish Market Y-o-Y Growth Rate Comparison by Application (2016-2032)
- Figure 122: Latin America Zebrafish Market Y-o-Y Growth Rate Comparison by End Users (2016-2032)
- Figure 123: Latin America Zebrafish Market Share Comparison by Country (2016-2032)
- Figure 124: Latin America Zebrafish Market Share Comparison by Type (2016-2032)
- Figure 125: Latin America Zebrafish Market Share Comparison by Application (2016-2032)
- Figure 126: Latin America Zebrafish Market Share Comparison by End Users (2016-2032)
- Figure 127: Middle East & Africa Zebrafish Market Revenue (US$ Mn) Market Share by Typein 2022
- Figure 128: Middle East & Africa Zebrafish Market Attractiveness Analysis by Type, 2016-2032
- Figure 129: Middle East & Africa Zebrafish Market Revenue (US$ Mn) Market Share by Applicationin 2022
- Figure 130: Middle East & Africa Zebrafish Market Attractiveness Analysis by Application, 2016-2032
- Figure 131: Middle East & Africa Zebrafish Market Revenue (US$ Mn) Market Share by End Usersin 2022
- Figure 132: Middle East & Africa Zebrafish Market Attractiveness Analysis by End Users, 2016-2032
- Figure 133: Middle East & Africa Zebrafish Market Revenue (US$ Mn) Market Share by Country in 2022
- Figure 134: Middle East & Africa Zebrafish Market Attractiveness Analysis by Country, 2016-2032
- Figure 135: Middle East & Africa Zebrafish Market Revenue (US$ Mn) (2016-2032)
- Figure 136: Middle East & Africa Zebrafish Market Revenue (US$ Mn) Comparison by Country (2016-2032)
- Figure 137: Middle East & Africa Zebrafish Market Revenue (US$ Mn) Comparison by Type (2016-2032)
- Figure 138: Middle East & Africa Zebrafish Market Revenue (US$ Mn) Comparison by Application (2016-2032)
- Figure 139: Middle East & Africa Zebrafish Market Revenue (US$ Mn) Comparison by End Users (2016-2032)
- Figure 140: Middle East & Africa Zebrafish Market Y-o-Y Growth Rate Comparison by Country (2016-2032)
- Figure 141: Middle East & Africa Zebrafish Market Y-o-Y Growth Rate Comparison by Type (2016-2032)
- Figure 142: Middle East & Africa Zebrafish Market Y-o-Y Growth Rate Comparison by Application (2016-2032)
- Figure 143: Middle East & Africa Zebrafish Market Y-o-Y Growth Rate Comparison by End Users (2016-2032)
- Figure 144: Middle East & Africa Zebrafish Market Share Comparison by Country (2016-2032)
- Figure 145: Middle East & Africa Zebrafish Market Share Comparison by Type (2016-2032)
- Figure 146: Middle East & Africa Zebrafish Market Share Comparison by Application (2016-2032)
- Figure 147: Middle East & Africa Zebrafish Market Share Comparison by End Users (2016-2032)
- List of Tables
- Table 1: Global Zebrafish Market Comparison by Type (2016-2032)
- Table 2: Global Zebrafish Market Comparison by Application (2016-2032)
- Table 3: Global Zebrafish Market Comparison by End Users (2016-2032)
- Table 4: Global Zebrafish Market Revenue (US$ Mn) Comparison by Region (2016-2032)
- Table 5: Global Zebrafish Market Revenue (US$ Mn) (2016-2032)
- Table 6: Global Zebrafish Market Revenue (US$ Mn) Comparison by Region (2016-2032)
- Table 7: Global Zebrafish Market Revenue (US$ Mn) Comparison by Type (2016-2032)
- Table 8: Global Zebrafish Market Revenue (US$ Mn) Comparison by Application (2016-2032)
- Table 9: Global Zebrafish Market Revenue (US$ Mn) Comparison by End Users (2016-2032)
- Table 10: Global Zebrafish Market Y-o-Y Growth Rate Comparison by Region (2016-2032)
- Table 11: Global Zebrafish Market Y-o-Y Growth Rate Comparison by Type (2016-2032)
- Table 12: Global Zebrafish Market Y-o-Y Growth Rate Comparison by Application (2016-2032)
- Table 13: Global Zebrafish Market Y-o-Y Growth Rate Comparison by End Users (2016-2032)
- Table 14: Global Zebrafish Market Share Comparison by Region (2016-2032)
- Table 15: Global Zebrafish Market Share Comparison by Type (2016-2032)
- Table 16: Global Zebrafish Market Share Comparison by Application (2016-2032)
- Table 17: Global Zebrafish Market Share Comparison by End Users (2016-2032)
- Table 18: North America Zebrafish Market Comparison by Application (2016-2032)
- Table 19: North America Zebrafish Market Comparison by End Users (2016-2032)
- Table 20: North America Zebrafish Market Revenue (US$ Mn) Comparison by Country (2016-2032)
- Table 21: North America Zebrafish Market Revenue (US$ Mn) (2016-2032)
- Table 22: North America Zebrafish Market Revenue (US$ Mn) Comparison by Country (2016-2032)
- Table 23: North America Zebrafish Market Revenue (US$ Mn) Comparison by Type (2016-2032)
- Table 24: North America Zebrafish Market Revenue (US$ Mn) Comparison by Application (2016-2032)
- Table 25: North America Zebrafish Market Revenue (US$ Mn) Comparison by End Users (2016-2032)
- Table 26: North America Zebrafish Market Y-o-Y Growth Rate Comparison by Country (2016-2032)
- Table 27: North America Zebrafish Market Y-o-Y Growth Rate Comparison by Type (2016-2032)
- Table 28: North America Zebrafish Market Y-o-Y Growth Rate Comparison by Application (2016-2032)
- Table 29: North America Zebrafish Market Y-o-Y Growth Rate Comparison by End Users (2016-2032)
- Table 30: North America Zebrafish Market Share Comparison by Country (2016-2032)
- Table 31: North America Zebrafish Market Share Comparison by Type (2016-2032)
- Table 32: North America Zebrafish Market Share Comparison by Application (2016-2032)
- Table 33: North America Zebrafish Market Share Comparison by End Users (2016-2032)
- Table 34: Western Europe Zebrafish Market Comparison by Type (2016-2032)
- Table 35: Western Europe Zebrafish Market Comparison by Application (2016-2032)
- Table 36: Western Europe Zebrafish Market Comparison by End Users (2016-2032)
- Table 37: Western Europe Zebrafish Market Revenue (US$ Mn) Comparison by Country (2016-2032)
- Table 38: Western Europe Zebrafish Market Revenue (US$ Mn) (2016-2032)
- Table 39: Western Europe Zebrafish Market Revenue (US$ Mn) Comparison by Country (2016-2032)
- Table 40: Western Europe Zebrafish Market Revenue (US$ Mn) Comparison by Type (2016-2032)
- Table 41: Western Europe Zebrafish Market Revenue (US$ Mn) Comparison by Application (2016-2032)
- Table 42: Western Europe Zebrafish Market Revenue (US$ Mn) Comparison by End Users (2016-2032)
- Table 43: Western Europe Zebrafish Market Y-o-Y Growth Rate Comparison by Country (2016-2032)
- Table 44: Western Europe Zebrafish Market Y-o-Y Growth Rate Comparison by Type (2016-2032)
- Table 45: Western Europe Zebrafish Market Y-o-Y Growth Rate Comparison by Application (2016-2032)
- Table 46: Western Europe Zebrafish Market Y-o-Y Growth Rate Comparison by End Users (2016-2032)
- Table 47: Western Europe Zebrafish Market Share Comparison by Country (2016-2032)
- Table 48: Western Europe Zebrafish Market Share Comparison by Type (2016-2032)
- Table 49: Western Europe Zebrafish Market Share Comparison by Application (2016-2032)
- Table 50: Western Europe Zebrafish Market Share Comparison by End Users (2016-2032)
- Table 51: Eastern Europe Zebrafish Market Comparison by Type (2016-2032)
- Table 52: Eastern Europe Zebrafish Market Comparison by Application (2016-2032)
- Table 53: Eastern Europe Zebrafish Market Comparison by End Users (2016-2032)
- Table 54: Eastern Europe Zebrafish Market Revenue (US$ Mn) Comparison by Country (2016-2032)
- Table 55: Eastern Europe Zebrafish Market Revenue (US$ Mn) (2016-2032)
- Table 56: Eastern Europe Zebrafish Market Revenue (US$ Mn) Comparison by Country (2016-2032)
- Table 57: Eastern Europe Zebrafish Market Revenue (US$ Mn) Comparison by Type (2016-2032)
- Table 58: Eastern Europe Zebrafish Market Revenue (US$ Mn) Comparison by Application (2016-2032)
- Table 59: Eastern Europe Zebrafish Market Revenue (US$ Mn) Comparison by End Users (2016-2032)
- Table 60: Eastern Europe Zebrafish Market Y-o-Y Growth Rate Comparison by Country (2016-2032)
- Table 61: Eastern Europe Zebrafish Market Y-o-Y Growth Rate Comparison by Type (2016-2032)
- Table 62: Eastern Europe Zebrafish Market Y-o-Y Growth Rate Comparison by Application (2016-2032)
- Table 63: Eastern Europe Zebrafish Market Y-o-Y Growth Rate Comparison by End Users (2016-2032)
- Table 64: Eastern Europe Zebrafish Market Share Comparison by Country (2016-2032)
- Table 65: Eastern Europe Zebrafish Market Share Comparison by Type (2016-2032)
- Table 66: Eastern Europe Zebrafish Market Share Comparison by Application (2016-2032)
- Table 67: Eastern Europe Zebrafish Market Share Comparison by End Users (2016-2032)
- Table 68: APAC Zebrafish Market Comparison by Type (2016-2032)
- Table 69: APAC Zebrafish Market Comparison by Application (2016-2032)
- Table 70: APAC Zebrafish Market Comparison by End Users (2016-2032)
- Table 71: APAC Zebrafish Market Revenue (US$ Mn) Comparison by Country (2016-2032)
- Table 72: APAC Zebrafish Market Revenue (US$ Mn) (2016-2032)
- Table 73: APAC Zebrafish Market Revenue (US$ Mn) Comparison by Country (2016-2032)
- Table 74: APAC Zebrafish Market Revenue (US$ Mn) Comparison by Type (2016-2032)
- Table 75: APAC Zebrafish Market Revenue (US$ Mn) Comparison by Application (2016-2032)
- Table 76: APAC Zebrafish Market Revenue (US$ Mn) Comparison by End Users (2016-2032)
- Table 77: APAC Zebrafish Market Y-o-Y Growth Rate Comparison by Country (2016-2032)
- Table 78: APAC Zebrafish Market Y-o-Y Growth Rate Comparison by Type (2016-2032)
- Table 79: APAC Zebrafish Market Y-o-Y Growth Rate Comparison by Application (2016-2032)
- Table 80: APAC Zebrafish Market Y-o-Y Growth Rate Comparison by End Users (2016-2032)
- Table 81: APAC Zebrafish Market Share Comparison by Country (2016-2032)
- Table 82: APAC Zebrafish Market Share Comparison by Type (2016-2032)
- Table 83: APAC Zebrafish Market Share Comparison by Application (2016-2032)
- Table 84: APAC Zebrafish Market Share Comparison by End Users (2016-2032)
- Table 85: Latin America Zebrafish Market Comparison by Type (2016-2032)
- Table 86: Latin America Zebrafish Market Comparison by Application (2016-2032)
- Table 87: Latin America Zebrafish Market Comparison by End Users (2016-2032)
- Table 88: Latin America Zebrafish Market Revenue (US$ Mn) Comparison by Country (2016-2032)
- Table 89: Latin America Zebrafish Market Revenue (US$ Mn) (2016-2032)
- Table 90: Latin America Zebrafish Market Revenue (US$ Mn) Comparison by Country (2016-2032)
- Table 91: Latin America Zebrafish Market Revenue (US$ Mn) Comparison by Type (2016-2032)
- Table 92: Latin America Zebrafish Market Revenue (US$ Mn) Comparison by Application (2016-2032)
- Table 93: Latin America Zebrafish Market Revenue (US$ Mn) Comparison by End Users (2016-2032)
- Table 94: Latin America Zebrafish Market Y-o-Y Growth Rate Comparison by Country (2016-2032)
- Table 95: Latin America Zebrafish Market Y-o-Y Growth Rate Comparison by Type (2016-2032)
- Table 96: Latin America Zebrafish Market Y-o-Y Growth Rate Comparison by Application (2016-2032)
- Table 97: Latin America Zebrafish Market Y-o-Y Growth Rate Comparison by End Users (2016-2032)
- Table 98: Latin America Zebrafish Market Share Comparison by Country (2016-2032)
- Table 99: Latin America Zebrafish Market Share Comparison by Type (2016-2032)
- Table 100: Latin America Zebrafish Market Share Comparison by Application (2016-2032)
- Table 101: Latin America Zebrafish Market Share Comparison by End Users (2016-2032)
- Table 102: Middle East & Africa Zebrafish Market Comparison by Type (2016-2032)
- Table 103: Middle East & Africa Zebrafish Market Comparison by Application (2016-2032)
- Table 104: Middle East & Africa Zebrafish Market Comparison by End Users (2016-2032)
- Table 105: Middle East & Africa Zebrafish Market Revenue (US$ Mn) Comparison by Country (2016-2032)
- Table 106: Middle East & Africa Zebrafish Market Revenue (US$ Mn) (2016-2032)
- Table 107: Middle East & Africa Zebrafish Market Revenue (US$ Mn) Comparison by Country (2016-2032)
- Table 108: Middle East & Africa Zebrafish Market Revenue (US$ Mn) Comparison by Type (2016-2032)
- Table 109: Middle East & Africa Zebrafish Market Revenue (US$ Mn) Comparison by Application (2016-2032)
- Table 110: Middle East & Africa Zebrafish Market Revenue (US$ Mn) Comparison by End Users (2016-2032)
- Table 111: Middle East & Africa Zebrafish Market Y-o-Y Growth Rate Comparison by Country (2016-2032)
- Table 112: Middle East & Africa Zebrafish Market Y-o-Y Growth Rate Comparison by Type (2016-2032)
- Table 113: Middle East & Africa Zebrafish Market Y-o-Y Growth Rate Comparison by Application (2016-2032)
- Table 114: Middle East & Africa Zebrafish Market Y-o-Y Growth Rate Comparison by End Users (2016-2032)
- Table 115: Middle East & Africa Zebrafish Market Share Comparison by Country (2016-2032)
- Table 116: Middle East & Africa Zebrafish Market Share Comparison by Type (2016-2032)
- Table 117: Middle East & Africa Zebrafish Market Share Comparison by Application (2016-2032)
- Table 118: Middle East & Africa Zebrafish Market Share Comparison by End Users (2016-2032)
- 1. Executive Summary
-
- InVivo Biosystems
- Hangzhou Hunter Biotechnology Co., Ltd.
- Shanghai Model Organisms Center Inc.
- Biobide Company
- Charles River Laboratories Company
- Eze-Rinka Company
- Tecniplast
- Zeon Biotech
- EkkWill Waterlife Resources
- Segrest Farms
- Aquatic Enterprises Inc.
- Aquatic Habitats
- Bluefin
- Aquaneering Inc.
- Aquatic Solutions Hawaii
Our Clients


View Our Licence Options
