Waterless Cosmetics Market By Product (Haircare, Skincare, Makeup, Others), By Gender (Men, Women, Unisex), By Nature (Synthetic, Organic), By Distribution Channel (Online Retail, Hypermarket/Supermarket, Convenience stores, Speciality Stores, Others), By Region And Companies - Industry Segment Outlook, Market Assessment, Competition Scenario, Trends, And Forecast 2024-2033
-
47403
-
June 2024
-
300
-


-
This report was compiled by Research Team Research team of over 50 passionate professionals leverages advanced research methodologies and analytical expertise to deliver insightful, data-driven market intelligence that empowers businesses across diverse industries to make strategic, well-informed Correspondence Research Team Linkedin | Detailed Market research Methodology Our methodology involves a mix of primary research, including interviews with leading mental health experts, and secondary research from reputable medical journals and databases. View Detailed Methodology Page
-
Quick Navigation
Report Overview
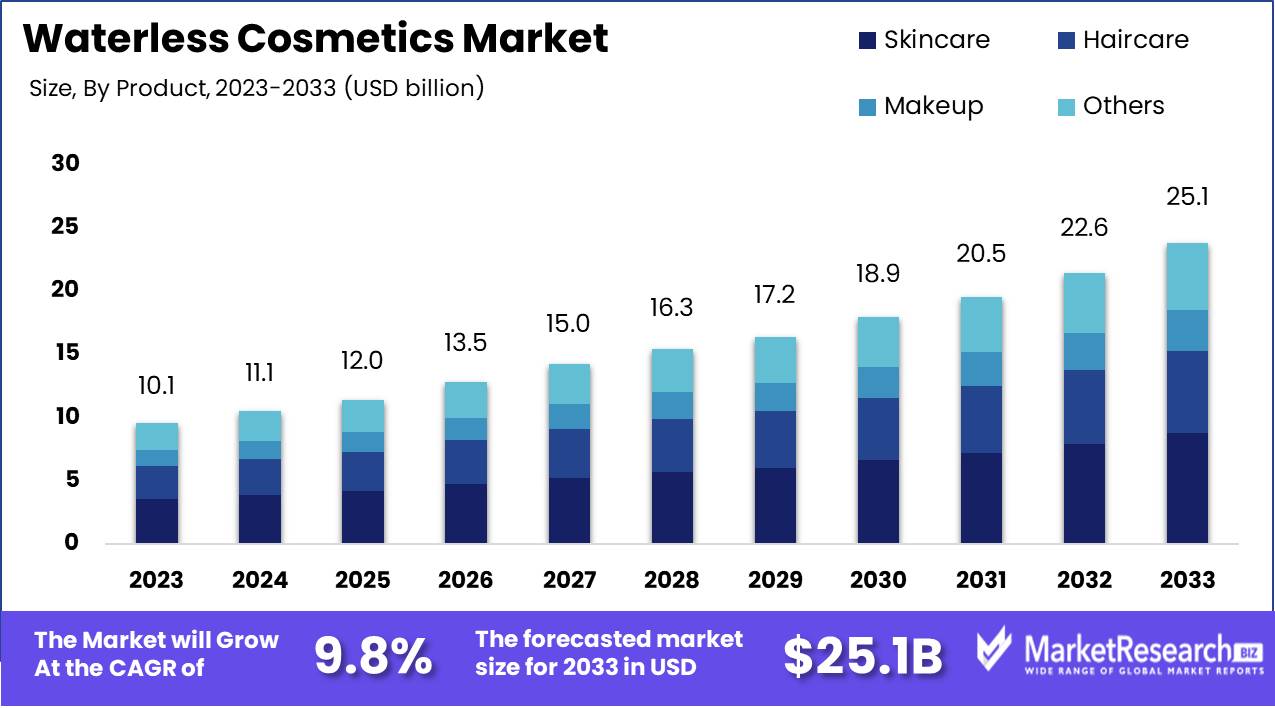
The Waterless Cosmetics Market was valued at USD 10.1 Billion in 2023. It is expected to reach USD 25.1 Billion by 2033, with a CAGR of 9.8% during the forecast period from 2024 to 2033.
The Waterless Cosmetics Market refers to a segment of the beauty and personal care industry focused on products formulated without water. This innovative approach addresses sustainability by reducing water usage, improving product efficacy, and extending shelf life. Waterless cosmetics include powders, balms, oils, and solid formulations, offering concentrated benefits and minimizing the need for preservatives. This market is driven by increasing consumer awareness of environmental issues, demand for travel-friendly and durable products, and advancements in formulation technology.
The waterless cosmetics market is emerging as a significant segment within the broader beauty industry, driven by a confluence of environmental and technological factors. Growing awareness of water scarcity and the environmental impact of water usage in cosmetics production has catalyzed both consumer demand and corporate responsibility initiatives. As consumers become increasingly eco-conscious, the appeal of waterless cosmetics products formulated without water has surged. This trend aligns with a broader shift towards sustainability, reflecting changing consumer preferences for environmentally friendly products.
However, the development of effective waterless formulations presents challenges, requiring substantial R&D investment to ensure product efficacy and stability. The industry is responding with innovative approaches, leveraging advancements in formulation technologies to create high-performance, waterless alternatives.
The market for waterless cosmetics is poised for robust growth, underpinned by several key drivers. Technological advancements in product formulations are enabling the creation of sophisticated waterless products that meet consumer expectations for quality and performance. Additionally, increasing environmental awareness among consumers is accelerating the adoption of sustainable practices, further propelling market expansion. The shift towards sustainable consumer practices is not only a reflection of changing values but also an opportunity for brands to differentiate themselves in a competitive market.
Companies that can successfully navigate the complexities of waterless formulation and effectively communicate their environmental benefits are well-positioned to capture significant market share in this burgeoning segment. Overall, the waterless cosmetics market represents a promising area of growth, combining innovation, sustainability, and consumer demand in a powerful value proposition.
Key Takeaways
- Market Growth: The Waterless Cosmetics Market was valued at USD 10.1 Billion in 2023. It is expected to reach USD 25.1 Billion by 2033, with a CAGR of 9.8% during the forecast period from 2024 to 2033.
- By Product: Skin Care Products dominated the waterless cosmetics market by product segment.
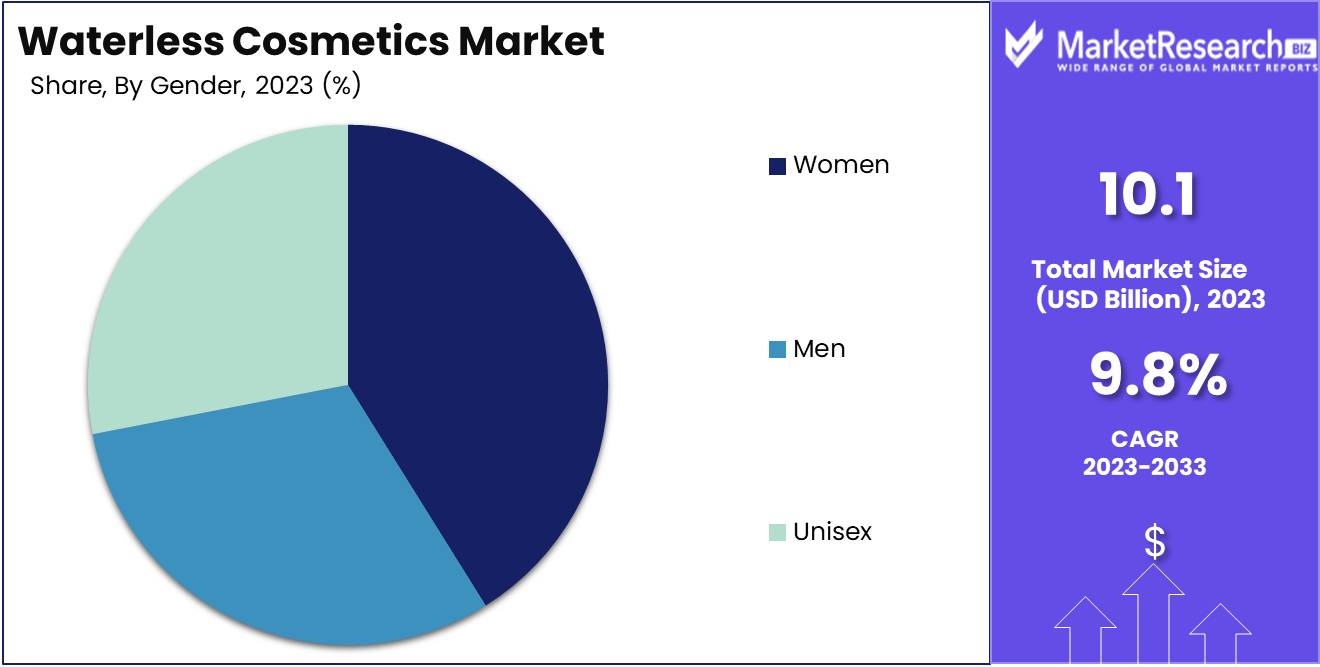
- By Gender: Women dominated the waterless cosmetics market by gender.
- By Nature: Synthetic Ingredients dominate the waterless cosmetics market by nature.
- By Distribution Channel: Online Retail dominated the Waterless Cosmetics Market distribution channels.
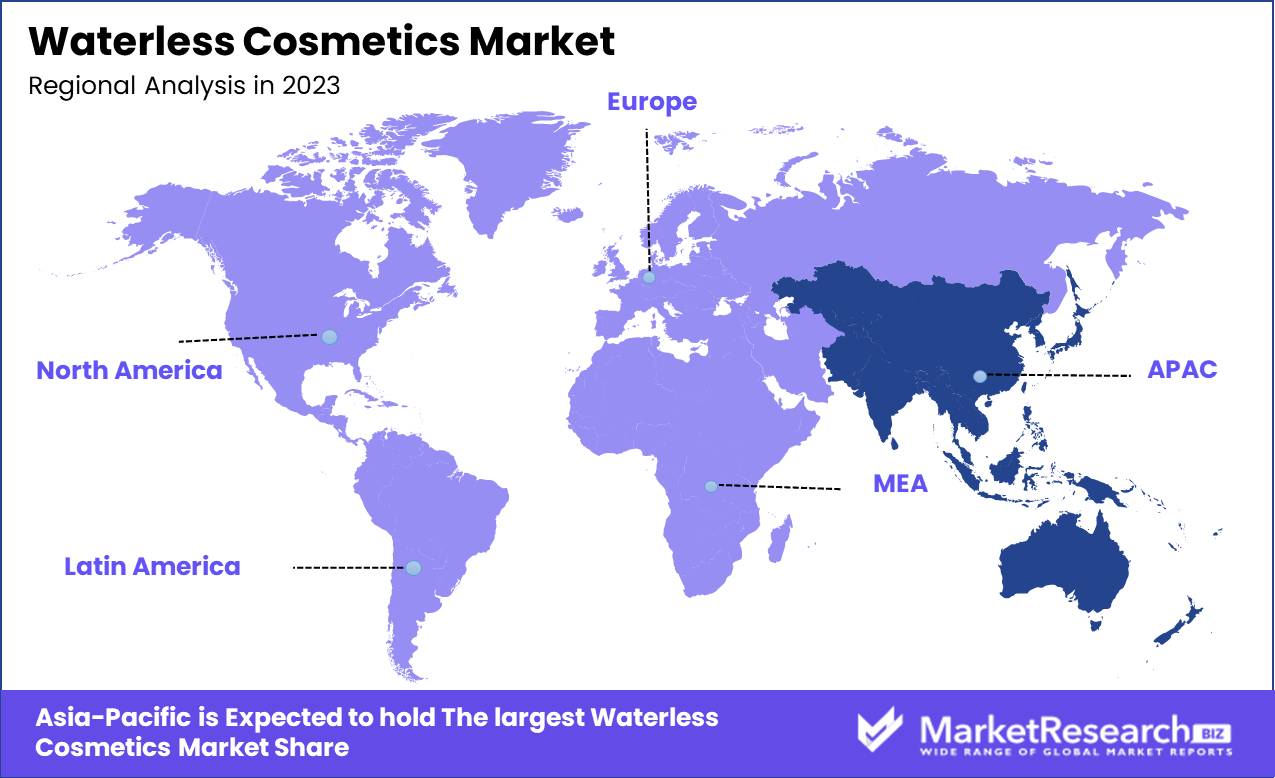
- Regional Dominance: Asia Pacific leads the waterless cosmetics market with a 45% largest share.
- Growth Opportunity: The waterless cosmetics market is set to grow, driven by sustainability-focused consumer preferences.
Driving factors
Growing Environmental Concerns and Sustainability Initiatives Propel Market Growth
The global push towards sustainability and heightened environmental awareness has significantly catalyzed the expansion of the waterless cosmetics market. Consumers, increasingly cognizant of ecological footprints, seek products aligned with their eco-conscious values. Consequently, the waterless cosmetics sector has witnessed robust growth, with a substantial portion of consumers favoring products that minimize water consumption and packaging waste.
Major players in the industry have responded by innovating formulas that eliminate the need for water, reducing the overall carbon footprint of their products. Additionally, brands are adopting sustainable packaging solutions, such as recyclable materials and minimalist designs, further resonating with environmentally conscious consumers.
Rising Demand for Convenient and Travel-Friendly Products Fuels Market Expansion
The escalating preference for convenience and portability has emerged as a pivotal factor propelling the growth of the waterless cosmetics market. Modern lifestyles characterized by busy schedules and frequent travel have intensified the need for on-the-go beauty solutions that offer ease of use and hassle-free portability. As a result, waterless cosmetics, typically presented in solid or powder forms, have gained immense popularity among consumers seeking practicality without compromising efficacy.
Statistics indicate a notable surge in the demand for travel-friendly beauty products, with the waterless cosmetics segment experiencing remarkable growth. This upward trajectory underscores the pivotal role of convenience-driven consumer preferences in shaping market dynamics and driving innovation across the waterless cosmetics landscape.
Increasing Demand for Natural and Organic Products Drives Market Expansion
The escalating consumer preference for natural and organic ingredients has emerged as a significant driver of growth within the waterless cosmetics market. Heightened awareness regarding the potential health risks associated with synthetic chemicals has prompted consumers to gravitate towards cleaner, more transparent beauty formulations. Waterless cosmetics, inherently devoid of preservatives and emulsifiers often found in traditional formulations, resonate with this growing segment of health-conscious consumers seeking safer alternatives.
Market research indicates a substantial uptick in demand for natural and organic cosmetics, with the waterless segment capturing a notable share of this burgeoning market. This surge in demand underscores the pivotal role of consumer preferences for natural and organic offerings in driving market expansion and shaping industry trends.
Restraining Factors
Texture and Application Issues: Challenges in Consumer Acceptance and Satisfaction
The growth of the waterless cosmetics market is significantly hindered by texture and application issues. Consumers often expect a certain feel and ease of application from their cosmetic products. Traditional water-based products tend to have smoother textures and are easier to spread on the skin, offering a familiar experience to users. In contrast, waterless cosmetics, due to their concentrated nature, can sometimes be perceived as thicker, more difficult to apply, and less comfortable on the skin. This textural difference can lead to dissatisfaction among consumers who prioritize product feel and application ease, potentially deterring repeat purchases and wider market adoption.
Moreover, waterless formulations may require consumers to adjust their application techniques, which can be a barrier for those accustomed to the simplicity of conventional products. This adjustment period can discourage initial trial and impede the transition to waterless options, thereby slowing market penetration. Additionally, the efficacy of the product can be perceived as less reliable if the application process is deemed cumbersome, further affecting consumer trust and loyalty.
Lack of Adequate Product Options: Limited Choices Restrict Market Appeal
The waterless cosmetics market is currently constrained by a limited range of product options, which restricts its appeal to a broader audience. This lack of variety can be attributed to several factors, including the complexities involved in developing effective waterless formulations and the higher costs associated with research and development. Without a diverse array of products that cater to different skin types, preferences, and needs, consumers may find it challenging to fully embrace the waterless cosmetics trend.
The limited product range means that not all skincare concerns and cosmetic preferences are addressed, reducing the attractiveness of waterless options for consumers seeking specific benefits, such as anti-aging properties, hydration, or acne treatment. This gap in the market can lead to potential customers sticking with traditional water-based products that offer a wider selection and more targeted solutions.
By Product Analysis
In 2023, Skincare Products dominated the waterless cosmetics market by product segment.
In 2023, Skincare Products held a dominant market position in the "By Product" segment of the Waterless Cosmetics Market. This leadership is attributable to the increasing consumer preference for sustainable and environmentally friendly products. Waterless Skincare product formulations, including moisturizers, serums, and cleansers, have seen a significant shift towards waterless variants due to their longer shelf life and concentrated active ingredients, which enhance product efficacy.
Haircare products, though substantial, follow in prominence as innovations like dry shampoos and conditioning bars gain traction. Makeup products are emerging strongly, driven by demand for portable and easy-to-apply solutions such as powder foundations and solid lip balms. The "Others" category, encompassing products like deodorants and oral care, is gradually expanding as brands diversify their offerings to include waterless options. The trend towards waterless cosmetics across all these segments is propelled by rising environmental awareness, regulatory pressures to reduce water usage, and consumer desire for effective, high-quality skincare solutions that align with sustainable living principles.
By Gender Analysis
In 2023, Women dominated the waterless cosmetics market by gender.
In 2023, Women held a dominant market position in the "By Gender" segment of the waterless cosmetics market. This predominance can be attributed to a higher demand for sustainable and innovative beauty products among female consumers, driven by heightened awareness and advocacy for eco-friendly beauty solutions. Women's preference for waterless cosmetics is bolstered by their extensive beauty routines, where the efficiency and portability of these products offer significant advantages.
Men represent a growing subsegment, reflecting a shift in male grooming habits towards more sophisticated and environmentally conscious choices. As the stigma around male cosmetics diminishes, and with increased marketing efforts targeting this demographic, the adoption rate among men is expected to rise, though it currently lags behind that of women.
The unisex category, designed to appeal to all genders, is gaining traction as brands aim to cater to a broader audience. These products, characterized by neutral packaging and versatile formulations, appeal to a diverse consumer base seeking inclusivity and simplicity. This segment is poised for significant growth, driven by the rising trend toward gender-neutral beauty products and the desire for universal skincare solutions.
By Nature Analysis
In 2023, Synthetic Ingredients dominated the waterless cosmetics market by nature.
In 2023, Synthetic Ingredients held a dominant market position in the "By Nature" segment of the Waterless Cosmetics Market. Synthetic formulations are favored for their consistency, stability, and cost-effectiveness, which make them attractive to manufacturers and consumers alike. These ingredients offer precise control over the product's texture, shelf life, and performance, ensuring a reliable consumer experience. Moreover, synthetic compounds are often easier to source and produce at scale, reducing production costs and enabling competitive pricing strategies.
Conversely, the organic segment, though smaller, is experiencing robust infrastructure growth driven by increasing consumer demand for natural and sustainable products. Organic waterless cosmetics appeal to eco-conscious consumers seeking products free from harmful chemicals and synthetic additives. These products are often marketed as safer for the skin and the environment, leveraging the growing trend towards clean beauty. While organic formulations may face challenges in terms of consistency and higher production costs, their premium positioning allows brands to command higher price points, catering to a niche yet expanding market segment focused on health and sustainability.
Both segments exhibit unique advantages, reflecting diverse consumer preferences and shaping the competitive landscape of the waterless cosmetics market.
By Distribution Channel Analysis
In 2023, Online Retail dominated the Waterless Cosmetics Market distribution channels.
In 2023, Online Retail held a dominant market position in the By Distribution Channel segment of the Waterless Cosmetics Market. The convenience, extensive product variety, and competitive pricing offered by online platforms have significantly attracted consumers. This channel's growth is further propelled by the increasing penetration of smartphones and the internet, coupled with advancements in logistics and delivery services.
Hypermarkets/Supermarkets also play a vital role, leveraging their broad reach and ability to offer a tactile shopping experience, which is particularly important for new product trials. Convenience Stores cater to immediate purchase needs, benefiting from their ubiquitous presence and ease of access.
Specialty Stores provide a unique advantage through their focus on specific product categories and expert customer service, enhancing the consumer experience with personalized recommendations. Lastly, the Others category, encompassing department stores, direct sales, and other unconventional retail formats, contributes to market diversity by offering multiple touchpoints for consumer interaction.
Together, these channels ensure comprehensive market coverage, enabling diverse consumer preferences and shopping behaviors to be effectively addressed within the Waterless Cosmetics Market.
Key Market Segments
By Product
- Haircare
- Skincare
- Makeup
- Others
By Gender
- Men
- Women
- Unisex
By Nature
- Synthetic
- Organic
By Distribution Channel
- Online Retail
- Hypermarket/Supermarket
- Convenience stores
- Speciality Stores
- Others
Growth Opportunity
Rising Consumer Preferences for Natural and Organic Products
The global waterless cosmetics market is poised for significant growth, driven by the increasing consumer demand for natural and organic products. As sustainability becomes a central concern for consumers, products that minimize water usage align with broader environmental values. Waterless cosmetics, which often feature high concentrations of natural ingredients, cater to this shift. According to market analysis, consumers are gravitating towards these products not only for their eco-friendly appeal but also for their potency and efficacy, as the absence of water can enhance ingredient stability and effectiveness. This trend presents an expansive opportunity for brands to innovate and capture market share by emphasizing their commitment to sustainability and natural formulations.
Growing Popularity of Solid and Powdered Products
Another key driver for the waterless cosmetics market is the growing popularity of solid and powdered products. These formats offer several advantages, including longer shelf life, reduced packaging needs, and improved portability. Solid shampoos, powdered foundations, and deodorant sticks are gaining traction among consumers seeking convenient, travel-friendly, and waste-reducing alternatives. The compact nature of these products also translates to lower shipping costs and reduced carbon footprint, aligning with the increasing consumer focus on sustainability.
Latest Trends
Growing Environmental Concerns and Sustainability Initiatives
The waterless cosmetics market is poised for substantial growth, driven primarily by increasing environmental concerns and a global shift toward sustainability. As water scarcity becomes a more pressing issue worldwide, consumers and manufacturers alike are prioritizing products that minimize water usage. This trend is evident in the rise of solid shampoos, concentrated skincare products, and powdered formulations, all of which offer significant reductions in water content compared to traditional cosmetics. Companies are leveraging eco-friendly packaging and sustainable sourcing of ingredients to enhance their environmental credentials. This focus not only addresses consumer demand for greener products but also aligns with broader corporate social responsibility goals, making waterless cosmetics an attractive proposition for both consumers and businesses.
Growing Popularity of Synthetic Products
Simultaneously, there is an increasing acceptance and popularity of synthetic ingredients in waterless cosmetics. Advances in biotechnology and synthetic chemistry have enabled the creation of high-performance, stable, and safe ingredients that do not rely on natural resources. These innovations are crucial in developing products that are both effective and environmentally friendly. Synthetic ingredients can be tailored to deliver specific benefits, such as enhanced skin hydration and improved texture, without the need for water. Moreover, the use of synthetics can alleviate the pressure on natural resources, providing a sustainable alternative that meets the performance expectations of modern consumers.
Regional Analysis
Asia Pacific leads the waterless cosmetics market with a 45% largest share.
The waterless cosmetics market is experiencing robust growth across various regions, each with unique driving factors and market dynamics. In North America, the market is propelled by increasing consumer awareness of sustainable beauty products and strong distribution networks. The region's adoption rate of waterless cosmetics is expected to grow, supported by a high disposable income and preference for innovative personal care products. In Europe, stringent environmental regulations and a strong emphasis on eco-friendly products are major drivers. Countries like Germany and the UK are leading in market share due to high consumer consciousness about the environmental impact of traditional cosmetics.
Asia Pacific dominates the waterless cosmetics market, accounting for approximately 45% of the largest market share. This dominance is attributed to the region's large population, rising disposable incomes, and increasing demand for premium beauty products, particularly in China, Japan, and South Korea. The cultural inclination towards traditional beauty routines that use minimal water also supports market growth. The Middle East & Africa region shows moderate growth, driven by the rising beauty consciousness and increasing urbanization, with the UAE and South Africa being key contributors. Latin America is witnessing steady growth, primarily driven by Brazil and Mexico, where the growing middle-class population is adopting more sophisticated beauty regimes.
Key Regions and Countries
North America
- The US
- Canada
- Rest of North America
Europe
- Germany
- France
- The UK
- Spain
- Netherlands
- Russia
- Italy
- Rest of Europe
Asia-Pacific
- China
- Japan
- Singapore
- Thailand
- South Korea
- Vietnam
- India
- New Zealand
- The rest of Asia Pacific
Latin America
- Mexico
- Brazil
- Rest of Latin America
Middle East & Africa
- Saudi Arabia
- South Africa
- UAE
- Rest of the Middle East & Africa
Key Players Analysis
The global waterless cosmetics market in 2024 is set to be shaped by a diverse group of key players, each bringing unique strengths and strategic approaches to this emerging sector.
L'Oréal and Unilever Plc are anticipated to leverage their extensive resources and established market presence to drive innovation and consumer adoption of waterless products. Their focus on sustainability aligns with increasing consumer demand for eco-friendly solutions, positioning them as leaders in this market shift.
The Procter & Gamble Company is expected to emphasize its strong R&D capabilities to develop advanced formulations that deliver superior performance without water. This approach aims to cater to both eco-conscious consumers and those seeking high efficacy.
Allies Group Pte. Ltd., True Botanicals, and Ruby’s Organics are likely to capitalize on their niche positioning and loyal customer bases to expand their market share. Their emphasis on natural ingredients and ethical production processes resonates well with the growing preference for clean beauty products.
Kao Corporation and Azafran Innovacion may focus on integrating traditional beauty wisdom with modern technology, enhancing their appeal in diverse markets, particularly in Asia-Pacific regions where traditional beauty practices are highly valued.
Innovative startups like Clensta, Loli, and The Waterless Beauty Company are poised to disrupt the market with novel product offerings and agile market strategies, potentially setting new trends and standards within the industry.
Collectively, these companies are driving the evolution of the waterless cosmetics market, responding to global sustainability trends and changing consumer preferences with strategic innovation and robust market engagement. Their varied approaches and strengths will likely fuel significant growth and transformation in the sector.
Market Key Players
- Allies Group Pte. Ltd.
- Azafran Innovacion
- Carter + Jane
- Clensta
- Kao Corporation
- Ktein
- L’Oréal
- Lavedo Cosmetics
- Loli
- May Coop
- Niconi
- No Cosmetics
- Pinch of Colour
- Ruby’s Organics
- Taiki USA
- The Procter & Gamble Company
- The Waterless Beauty Company
- True Botanicals
- Unilever Plc
- VAPOUR BEAUTY
- Others
Recent Development
- In February 2024, L'Oréal announced a significant expansion of its waterless product line, focusing on sustainable and eco-friendly beauty solutions. The new range includes waterless shampoos, conditioners, and skincare products aimed at reducing water consumption in both production and use.
- In October 2023, Unilever launched the "Positive Beauty Bar," a waterless, plastic-free shampoo bar made from bamboo fibers and cocoa butter. They also initiated a recycling program for empty waterless beauty product packaging in the UK in partnership with TerraCycle, expanding their sustainable product offerings.
- In September 2023, Estée Lauder acquired the Korean waterless beauty brand Dr. Jart+ for $500 million. This acquisition allows Estée Lauder to enhance its presence in the Asian market and increase the use of waterless formulas in its Clinique and Origins brands by 20% by 2025.
Report Scope
Report Features Description Market Value (2023) USD 10.1 Billion Forecast Revenue (2033) USD 25.1 Billion CAGR (2024-2032) 9.8% Base Year for Estimation 2023 Historic Period 2016-2023 Forecast Period 2024-2033 Report Coverage Revenue Forecast, Market Dynamics, COVID-19 Impact, Competitive Landscape, Recent Developments Segments Covered By Product (Haircare, Skincare, Makeup, Others), By Gender (Men, Women, Unisex), By Nature (Synthetic, Organic), By Distribution Channel (Online Retail, Hypermarket/Supermarket, Convenience stores, Speciality Stores, Others) Regional Analysis North America - The US, Canada, Rest of North America, Europe - Germany, France, The UK, Spain, Italy, Russia, Netherlands, Rest of Europe, Asia-Pacific - China, Japan, South Korea, India, New Zealand, Singapore, Thailand, Vietnam, Rest of Asia Pacific, Latin America - Brazil, Mexico, Rest of Latin America, Middle East & Africa - South Africa, Saudi Arabia, UAE, Rest of Middle East & Africa Competitive Landscape Allies Group Pte. Ltd., Azafran Innovacion, Carter + Jane, Clensta, Kao Corporation, Ktein, L’Oréal, Lavedo Cosmetics, Loli, May Coop, Niconi, No Cosmetics, Pinch of Colour, Ruby’s Organics, Taiki USA, The Procter & Gamble Company, The Waterless Beauty Company, True Botanicals, Unilever Plc, VAPOUR BEAUTY, Others Customization Scope Customization for segments, region/country-level will be provided. Moreover, additional customization can be done based on the requirements. Purchase Options We have three licenses to opt for Single User License, Multi-User License (Up to 5 Users), Corporate Use License (Unlimited User and Printable PDF) -
- 1. Executive Summary
- 1.1. Definition
- 1.2. Taxonomy
- 1.3. Research Scope
- 1.4. Key Analysis
- 1.5. Key Findings by Major Segments
- 1.6. Top strategies by Major Players
- 2. Global Waterless Cosmetics Market Overview
- 2.1. Waterless Cosmetics Market Dynamics
- 2.1.1. Drivers
- 2.1.2. Opportunities
- 2.1.3. Restraints
- 2.1.4. Challenges
- 2.2. Macro-economic Factors
- 2.3. Regulatory Framework
- 2.4. Market Investment Feasibility Index
- 2.5. PEST Analysis
- 2.6. PORTER’S Five Force Analysis
- 2.7. Drivers & Restraints Impact Analysis
- 2.8. Industry Chain Analysis
- 2.9. Cost Structure Analysis
- 2.10. Marketing Strategy
- 2.11. Russia-Ukraine War Impact Analysis
- 2.12. Opportunity Map Analysis
- 2.13. Market Competition Scenario Analysis
- 2.14. Product Life Cycle Analysis
- 2.15. Opportunity Orbits
- 2.16. Manufacturer Intensity Map
- 2.17. Major Companies sales by Value & Volume
- 2.1. Waterless Cosmetics Market Dynamics
- 3. Global Waterless Cosmetics Market Analysis, Opportunity and Forecast, 2016-2032
- 3.1. Global Waterless Cosmetics Market Analysis, 2016-2021
- 3.2. Global Waterless Cosmetics Market Opportunity and Forecast, 2023-2032
- 3.3. Global Waterless Cosmetics Market Analysis, Opportunity and Forecast, By Product, 2016-2032
- 3.3.1. Global Waterless Cosmetics Market Analysis by Product: Introduction
- 3.3.2. Market Size Absolute $ Opportunity Analysis and Forecast, By Product, 2016-2032
- 3.3.3. Haircare
- 3.3.4. Skincare
- 3.3.5. Makeup
- 3.3.6. Others
- 3.4. Global Waterless Cosmetics Market Analysis, Opportunity and Forecast, By Gender, 2016-2032
- 3.4.1. Global Waterless Cosmetics Market Analysis by Gender: Introduction
- 3.4.2. Market Size Absolute $ Opportunity Analysis and Forecast, By Gender, 2016-2032
- 3.4.3. Men
- 3.4.4. Women
- 3.4.5. Unisex
- 3.5. Global Waterless Cosmetics Market Analysis, Opportunity and Forecast, By Nature, 2016-2032
- 3.5.1. Global Waterless Cosmetics Market Analysis by Nature: Introduction
- 3.5.2. Market Size Absolute $ Opportunity Analysis and Forecast, By Nature, 2016-2032
- 3.5.3. Synthetic
- 3.5.4. Organic
- 3.6. Global Waterless Cosmetics Market Analysis, Opportunity and Forecast, By Distribution Channel, 2016-2032
- 3.6.1. Global Waterless Cosmetics Market Analysis by Distribution Channel: Introduction
- 3.6.2. Market Size Absolute $ Opportunity Analysis and Forecast, By Distribution Channel, 2016-2032
- 3.6.3. Online Retail
- 3.6.4. Hypermarket/Supermarket
- 3.6.5. Convenience stores
- 3.6.6. Speciality Stores
- 3.6.7. Others
- 4. North America Waterless Cosmetics Market Analysis, Opportunity and Forecast, 2016-2032
- 4.1. North America Waterless Cosmetics Market Analysis, 2016-2021
- 4.2. North America Waterless Cosmetics Market Opportunity and Forecast, 2023-2032
- 4.3. North America Waterless Cosmetics Market Analysis, Opportunity and Forecast, By Product, 2016-2032
- 4.3.1. North America Waterless Cosmetics Market Analysis by Product: Introduction
- 4.3.2. Market Size Absolute $ Opportunity Analysis and Forecast, By Product, 2016-2032
- 4.3.3. Haircare
- 4.3.4. Skincare
- 4.3.5. Makeup
- 4.3.6. Others
- 4.4. North America Waterless Cosmetics Market Analysis, Opportunity and Forecast, By Gender, 2016-2032
- 4.4.1. North America Waterless Cosmetics Market Analysis by Gender: Introduction
- 4.4.2. Market Size Absolute $ Opportunity Analysis and Forecast, By Gender, 2016-2032
- 4.4.3. Men
- 4.4.4. Women
- 4.4.5. Unisex
- 4.5. North America Waterless Cosmetics Market Analysis, Opportunity and Forecast, By Nature, 2016-2032
- 4.5.1. North America Waterless Cosmetics Market Analysis by Nature: Introduction
- 4.5.2. Market Size Absolute $ Opportunity Analysis and Forecast, By Nature, 2016-2032
- 4.5.3. Synthetic
- 4.5.4. Organic
- 4.6. North America Waterless Cosmetics Market Analysis, Opportunity and Forecast, By Distribution Channel, 2016-2032
- 4.6.1. North America Waterless Cosmetics Market Analysis by Distribution Channel: Introduction
- 4.6.2. Market Size Absolute $ Opportunity Analysis and Forecast, By Distribution Channel, 2016-2032
- 4.6.3. Online Retail
- 4.6.4. Hypermarket/Supermarket
- 4.6.5. Convenience stores
- 4.6.6. Speciality Stores
- 4.6.7. Others
- 4.7. North America Waterless Cosmetics Market Analysis, Opportunity and Forecast, By Country , 2016-2032
- 4.7.1. North America Waterless Cosmetics Market Analysis by Country : Introduction
- 4.7.2. Market Size Absolute $ Opportunity Analysis and Forecast, Country , 2016-2032
- 4.7.2.1. The US
- 4.7.2.2. Canada
- 4.7.2.3. Mexico
- 5. Western Europe Waterless Cosmetics Market Analysis, Opportunity and Forecast, 2016-2032
- 5.1. Western Europe Waterless Cosmetics Market Analysis, 2016-2021
- 5.2. Western Europe Waterless Cosmetics Market Opportunity and Forecast, 2023-2032
- 5.3. Western Europe Waterless Cosmetics Market Analysis, Opportunity and Forecast, By Product, 2016-2032
- 5.3.1. Western Europe Waterless Cosmetics Market Analysis by Product: Introduction
- 5.3.2. Market Size Absolute $ Opportunity Analysis and Forecast, By Product, 2016-2032
- 5.3.3. Haircare
- 5.3.4. Skincare
- 5.3.5. Makeup
- 5.3.6. Others
- 5.4. Western Europe Waterless Cosmetics Market Analysis, Opportunity and Forecast, By Gender, 2016-2032
- 5.4.1. Western Europe Waterless Cosmetics Market Analysis by Gender: Introduction
- 5.4.2. Market Size Absolute $ Opportunity Analysis and Forecast, By Gender, 2016-2032
- 5.4.3. Men
- 5.4.4. Women
- 5.4.5. Unisex
- 5.5. Western Europe Waterless Cosmetics Market Analysis, Opportunity and Forecast, By Nature, 2016-2032
- 5.5.1. Western Europe Waterless Cosmetics Market Analysis by Nature: Introduction
- 5.5.2. Market Size Absolute $ Opportunity Analysis and Forecast, By Nature, 2016-2032
- 5.5.3. Synthetic
- 5.5.4. Organic
- 5.6. Western Europe Waterless Cosmetics Market Analysis, Opportunity and Forecast, By Distribution Channel, 2016-2032
- 5.6.1. Western Europe Waterless Cosmetics Market Analysis by Distribution Channel: Introduction
- 5.6.2. Market Size Absolute $ Opportunity Analysis and Forecast, By Distribution Channel, 2016-2032
- 5.6.3. Online Retail
- 5.6.4. Hypermarket/Supermarket
- 5.6.5. Convenience stores
- 5.6.6. Speciality Stores
- 5.6.7. Others
- 5.7. Western Europe Waterless Cosmetics Market Analysis, Opportunity and Forecast, By Country , 2016-2032
- 5.7.1. Western Europe Waterless Cosmetics Market Analysis by Country : Introduction
- 5.7.2. Market Size Absolute $ Opportunity Analysis and Forecast, Country , 2016-2032
- 5.7.2.1. Germany
- 5.7.2.2. France
- 5.7.2.3. The UK
- 5.7.2.4. Spain
- 5.7.2.5. Italy
- 5.7.2.6. Portugal
- 5.7.2.7. Ireland
- 5.7.2.8. Austria
- 5.7.2.9. Switzerland
- 5.7.2.10. Benelux
- 5.7.2.11. Nordic
- 5.7.2.12. Rest of Western Europe
- 6. Eastern Europe Waterless Cosmetics Market Analysis, Opportunity and Forecast, 2016-2032
- 6.1. Eastern Europe Waterless Cosmetics Market Analysis, 2016-2021
- 6.2. Eastern Europe Waterless Cosmetics Market Opportunity and Forecast, 2023-2032
- 6.3. Eastern Europe Waterless Cosmetics Market Analysis, Opportunity and Forecast, By Product, 2016-2032
- 6.3.1. Eastern Europe Waterless Cosmetics Market Analysis by Product: Introduction
- 6.3.2. Market Size Absolute $ Opportunity Analysis and Forecast, By Product, 2016-2032
- 6.3.3. Haircare
- 6.3.4. Skincare
- 6.3.5. Makeup
- 6.3.6. Others
- 6.4. Eastern Europe Waterless Cosmetics Market Analysis, Opportunity and Forecast, By Gender, 2016-2032
- 6.4.1. Eastern Europe Waterless Cosmetics Market Analysis by Gender: Introduction
- 6.4.2. Market Size Absolute $ Opportunity Analysis and Forecast, By Gender, 2016-2032
- 6.4.3. Men
- 6.4.4. Women
- 6.4.5. Unisex
- 6.5. Eastern Europe Waterless Cosmetics Market Analysis, Opportunity and Forecast, By Nature, 2016-2032
- 6.5.1. Eastern Europe Waterless Cosmetics Market Analysis by Nature: Introduction
- 6.5.2. Market Size Absolute $ Opportunity Analysis and Forecast, By Nature, 2016-2032
- 6.5.3. Synthetic
- 6.5.4. Organic
- 6.6. Eastern Europe Waterless Cosmetics Market Analysis, Opportunity and Forecast, By Distribution Channel, 2016-2032
- 6.6.1. Eastern Europe Waterless Cosmetics Market Analysis by Distribution Channel: Introduction
- 6.6.2. Market Size Absolute $ Opportunity Analysis and Forecast, By Distribution Channel, 2016-2032
- 6.6.3. Online Retail
- 6.6.4. Hypermarket/Supermarket
- 6.6.5. Convenience stores
- 6.6.6. Speciality Stores
- 6.6.7. Others
- 6.7. Eastern Europe Waterless Cosmetics Market Analysis, Opportunity and Forecast, By Country , 2016-2032
- 6.7.1. Eastern Europe Waterless Cosmetics Market Analysis by Country : Introduction
- 6.7.2. Market Size Absolute $ Opportunity Analysis and Forecast, Country , 2016-2032
- 6.7.2.1. Russia
- 6.7.2.2. Poland
- 6.7.2.3. The Czech Republic
- 6.7.2.4. Greece
- 6.7.2.5. Rest of Eastern Europe
- 7. APAC Waterless Cosmetics Market Analysis, Opportunity and Forecast, 2016-2032
- 7.1. APAC Waterless Cosmetics Market Analysis, 2016-2021
- 7.2. APAC Waterless Cosmetics Market Opportunity and Forecast, 2023-2032
- 7.3. APAC Waterless Cosmetics Market Analysis, Opportunity and Forecast, By Product, 2016-2032
- 7.3.1. APAC Waterless Cosmetics Market Analysis by Product: Introduction
- 7.3.2. Market Size Absolute $ Opportunity Analysis and Forecast, By Product, 2016-2032
- 7.3.3. Haircare
- 7.3.4. Skincare
- 7.3.5. Makeup
- 7.3.6. Others
- 7.4. APAC Waterless Cosmetics Market Analysis, Opportunity and Forecast, By Gender, 2016-2032
- 7.4.1. APAC Waterless Cosmetics Market Analysis by Gender: Introduction
- 7.4.2. Market Size Absolute $ Opportunity Analysis and Forecast, By Gender, 2016-2032
- 7.4.3. Men
- 7.4.4. Women
- 7.4.5. Unisex
- 7.5. APAC Waterless Cosmetics Market Analysis, Opportunity and Forecast, By Nature, 2016-2032
- 7.5.1. APAC Waterless Cosmetics Market Analysis by Nature: Introduction
- 7.5.2. Market Size Absolute $ Opportunity Analysis and Forecast, By Nature, 2016-2032
- 7.5.3. Synthetic
- 7.5.4. Organic
- 7.6. APAC Waterless Cosmetics Market Analysis, Opportunity and Forecast, By Distribution Channel, 2016-2032
- 7.6.1. APAC Waterless Cosmetics Market Analysis by Distribution Channel: Introduction
- 7.6.2. Market Size Absolute $ Opportunity Analysis and Forecast, By Distribution Channel, 2016-2032
- 7.6.3. Online Retail
- 7.6.4. Hypermarket/Supermarket
- 7.6.5. Convenience stores
- 7.6.6. Speciality Stores
- 7.6.7. Others
- 7.7. APAC Waterless Cosmetics Market Analysis, Opportunity and Forecast, By Country , 2016-2032
- 7.7.1. APAC Waterless Cosmetics Market Analysis by Country : Introduction
- 7.7.2. Market Size Absolute $ Opportunity Analysis and Forecast, Country , 2016-2032
- 7.7.2.1. China
- 7.7.2.2. Japan
- 7.7.2.3. South Korea
- 7.7.2.4. India
- 7.7.2.5. Australia & New Zeland
- 7.7.2.6. Indonesia
- 7.7.2.7. Malaysia
- 7.7.2.8. Philippines
- 7.7.2.9. Singapore
- 7.7.2.10. Thailand
- 7.7.2.11. Vietnam
- 7.7.2.12. Rest of APAC
- 8. Latin America Waterless Cosmetics Market Analysis, Opportunity and Forecast, 2016-2032
- 8.1. Latin America Waterless Cosmetics Market Analysis, 2016-2021
- 8.2. Latin America Waterless Cosmetics Market Opportunity and Forecast, 2023-2032
- 8.3. Latin America Waterless Cosmetics Market Analysis, Opportunity and Forecast, By Product, 2016-2032
- 8.3.1. Latin America Waterless Cosmetics Market Analysis by Product: Introduction
- 8.3.2. Market Size Absolute $ Opportunity Analysis and Forecast, By Product, 2016-2032
- 8.3.3. Haircare
- 8.3.4. Skincare
- 8.3.5. Makeup
- 8.3.6. Others
- 8.4. Latin America Waterless Cosmetics Market Analysis, Opportunity and Forecast, By Gender, 2016-2032
- 8.4.1. Latin America Waterless Cosmetics Market Analysis by Gender: Introduction
- 8.4.2. Market Size Absolute $ Opportunity Analysis and Forecast, By Gender, 2016-2032
- 8.4.3. Men
- 8.4.4. Women
- 8.4.5. Unisex
- 8.5. Latin America Waterless Cosmetics Market Analysis, Opportunity and Forecast, By Nature, 2016-2032
- 8.5.1. Latin America Waterless Cosmetics Market Analysis by Nature: Introduction
- 8.5.2. Market Size Absolute $ Opportunity Analysis and Forecast, By Nature, 2016-2032
- 8.5.3. Synthetic
- 8.5.4. Organic
- 8.6. Latin America Waterless Cosmetics Market Analysis, Opportunity and Forecast, By Distribution Channel, 2016-2032
- 8.6.1. Latin America Waterless Cosmetics Market Analysis by Distribution Channel: Introduction
- 8.6.2. Market Size Absolute $ Opportunity Analysis and Forecast, By Distribution Channel, 2016-2032
- 8.6.3. Online Retail
- 8.6.4. Hypermarket/Supermarket
- 8.6.5. Convenience stores
- 8.6.6. Speciality Stores
- 8.6.7. Others
- 8.7. Latin America Waterless Cosmetics Market Analysis, Opportunity and Forecast, By Country , 2016-2032
- 8.7.1. Latin America Waterless Cosmetics Market Analysis by Country : Introduction
- 8.7.2. Market Size Absolute $ Opportunity Analysis and Forecast, Country , 2016-2032
- 8.7.2.1. Brazil
- 8.7.2.2. Colombia
- 8.7.2.3. Chile
- 8.7.2.4. Argentina
- 8.7.2.5. Costa Rica
- 8.7.2.6. Rest of Latin America
- 9. Middle East & Africa Waterless Cosmetics Market Analysis, Opportunity and Forecast, 2016-2032
- 9.1. Middle East & Africa Waterless Cosmetics Market Analysis, 2016-2021
- 9.2. Middle East & Africa Waterless Cosmetics Market Opportunity and Forecast, 2023-2032
- 9.3. Middle East & Africa Waterless Cosmetics Market Analysis, Opportunity and Forecast, By Product, 2016-2032
- 9.3.1. Middle East & Africa Waterless Cosmetics Market Analysis by Product: Introduction
- 9.3.2. Market Size Absolute $ Opportunity Analysis and Forecast, By Product, 2016-2032
- 9.3.3. Haircare
- 9.3.4. Skincare
- 9.3.5. Makeup
- 9.3.6. Others
- 9.4. Middle East & Africa Waterless Cosmetics Market Analysis, Opportunity and Forecast, By Gender, 2016-2032
- 9.4.1. Middle East & Africa Waterless Cosmetics Market Analysis by Gender: Introduction
- 9.4.2. Market Size Absolute $ Opportunity Analysis and Forecast, By Gender, 2016-2032
- 9.4.3. Men
- 9.4.4. Women
- 9.4.5. Unisex
- 9.5. Middle East & Africa Waterless Cosmetics Market Analysis, Opportunity and Forecast, By Nature, 2016-2032
- 9.5.1. Middle East & Africa Waterless Cosmetics Market Analysis by Nature: Introduction
- 9.5.2. Market Size Absolute $ Opportunity Analysis and Forecast, By Nature, 2016-2032
- 9.5.3. Synthetic
- 9.5.4. Organic
- 9.6. Middle East & Africa Waterless Cosmetics Market Analysis, Opportunity and Forecast, By Distribution Channel, 2016-2032
- 9.6.1. Middle East & Africa Waterless Cosmetics Market Analysis by Distribution Channel: Introduction
- 9.6.2. Market Size Absolute $ Opportunity Analysis and Forecast, By Distribution Channel, 2016-2032
- 9.6.3. Online Retail
- 9.6.4. Hypermarket/Supermarket
- 9.6.5. Convenience stores
- 9.6.6. Speciality Stores
- 9.6.7. Others
- 9.7. Middle East & Africa Waterless Cosmetics Market Analysis, Opportunity and Forecast, By Country , 2016-2032
- 9.7.1. Middle East & Africa Waterless Cosmetics Market Analysis by Country : Introduction
- 9.7.2. Market Size Absolute $ Opportunity Analysis and Forecast, Country , 2016-2032
- 9.7.2.1. Algeria
- 9.7.2.2. Egypt
- 9.7.2.3. Israel
- 9.7.2.4. Kuwait
- 9.7.2.5. Nigeria
- 9.7.2.6. Saudi Arabia
- 9.7.2.7. South Africa
- 9.7.2.8. Turkey
- 9.7.2.9. The UAE
- 9.7.2.10. Rest of MEA
- 10. Global Waterless Cosmetics Market Analysis, Opportunity and Forecast, By Region , 2016-2032
- 10.1. Global Waterless Cosmetics Market Analysis by Region : Introduction
- 10.2. Market Size Absolute $ Opportunity Analysis and Forecast, By Region , 2016-2032
- 10.2.1. North America
- 10.2.2. Western Europe
- 10.2.3. Eastern Europe
- 10.2.4. APAC
- 10.2.5. Latin America
- 10.2.6. Middle East & Africa
- 11. Global Waterless Cosmetics Market Competitive Landscape, Market Share Analysis, and Company Profiles
- 11.1. Market Share Analysis
- 11.2. Company Profiles
- 11.3. Allies Group Pte. Ltd.
- 11.3.1. Company Overview
- 11.3.2. Financial Highlights
- 11.3.3. Product Portfolio
- 11.3.4. SWOT Analysis
- 11.3.5. Key Strategies and Developments
- 11.4. Azafran Innovacion
- 11.4.1. Company Overview
- 11.4.2. Financial Highlights
- 11.4.3. Product Portfolio
- 11.4.4. SWOT Analysis
- 11.4.5. Key Strategies and Developments
- 11.5. Carter + Jane
- 11.5.1. Company Overview
- 11.5.2. Financial Highlights
- 11.5.3. Product Portfolio
- 11.5.4. SWOT Analysis
- 11.5.5. Key Strategies and Developments
- 11.6. Clensta
- 11.6.1. Company Overview
- 11.6.2. Financial Highlights
- 11.6.3. Product Portfolio
- 11.6.4. SWOT Analysis
- 11.6.5. Key Strategies and Developments
- 11.7. Kao Corporation
- 11.7.1. Company Overview
- 11.7.2. Financial Highlights
- 11.7.3. Product Portfolio
- 11.7.4. SWOT Analysis
- 11.7.5. Key Strategies and Developments
- 11.8. Ktein
- 11.8.1. Company Overview
- 11.8.2. Financial Highlights
- 11.8.3. Product Portfolio
- 11.8.4. SWOT Analysis
- 11.8.5. Key Strategies and Developments
- 11.9. L’Oréal
- 11.9.1. Company Overview
- 11.9.2. Financial Highlights
- 11.9.3. Product Portfolio
- 11.9.4. SWOT Analysis
- 11.9.5. Key Strategies and Developments
- 11.10. Lavedo Cosmetics
- 11.10.1. Company Overview
- 11.10.2. Financial Highlights
- 11.10.3. Product Portfolio
- 11.10.4. SWOT Analysis
- 11.10.5. Key Strategies and Developments
- 11.11. Loli
- 11.11.1. Company Overview
- 11.11.2. Financial Highlights
- 11.11.3. Product Portfolio
- 11.11.4. SWOT Analysis
- 11.11.5. Key Strategies and Developments
- 11.12. May Coop
- 11.12.1. Company Overview
- 11.12.2. Financial Highlights
- 11.12.3. Product Portfolio
- 11.12.4. SWOT Analysis
- 11.12.5. Key Strategies and Developments
- 11.13.1. Company Overview
- 11.13.2. Financial Highlights
- 11.13.3. Product Portfolio
- 11.13.4. SWOT Analysis
- 11.13.5. Key Strategies and Developments
- 11.14. Niconi
- 11.14.1. Company Overview
- 11.14.2. Financial Highlights
- 11.14.3. Product Portfolio
- 11.14.4. SWOT Analysis
- 11.14.5. Key Strategies and Developments
- 11.15. Pinch of Colour
- 11.15.1. Company Overview
- 11.15.2. Financial Highlights
- 11.15.3. Product Portfolio
- 11.15.4. SWOT Analysis
- 11.15.5. Key Strategies and Developments
- 11.16. Ruby’s Organics
- 11.16.1. Company Overview
- 11.16.2. Financial Highlights
- 11.16.3. Product Portfolio
- 11.16.4. SWOT Analysis
- 11.16.5. Key Strategies and Developments
- 11.17. Taiki USA
- 11.17.1. Company Overview
- 11.17.2. Financial Highlights
- 11.17.3. Product Portfolio
- 11.17.4. SWOT Analysis
- 11.17.5. Key Strategies and Developments
- 11.18. The Procter & Gamble Company
- 11.18.1. Company Overview
- 11.18.2. Financial Highlights
- 11.18.3. Product Portfolio
- 11.18.4. SWOT Analysis
- 11.18.5. Key Strategies and Developments
- 11.19. The Waterless Beauty Company
- 11.19.1. Company Overview
- 11.19.2. Financial Highlights
- 11.19.3. Product Portfolio
- 11.19.4. SWOT Analysis
- 11.19.5. Key Strategies and Developments
- 11.20. True Botanicals
- 11.20.1. Company Overview
- 11.20.2. Financial Highlights
- 11.20.3. Product Portfolio
- 11.20.4. SWOT Analysis
- 11.20.5. Key Strategies and Developments
- 11.21. Unilever Plc
- 11.21.1. Company Overview
- 11.21.2. Financial Highlights
- 11.21.3. Product Portfolio
- 11.21.4. SWOT Analysis
- 11.21.5. Key Strategies and Developments
- 11.22. VAPOUR BEAUTY
- 11.22.1. Company Overview
- 11.22.2. Financial Highlights
- 11.22.3. Product Portfolio
- 11.22.4. SWOT Analysis
- 11.22.5. Key Strategies and Developments
- 12. Assumptions and Acronyms
- 13. Research Methodology
- 14. Contact
"
- List of Figures
- "
- Figure 1: Global Waterless Cosmetics Market Revenue (US$ Mn) Market Share by Product in 2022
- Figure 2: Global Waterless Cosmetics Market Market Attractiveness Analysis by Product, 2016-2032
- Figure 3: Global Waterless Cosmetics Market Revenue (US$ Mn) Market Share by Genderin 2022
- Figure 4: Global Waterless Cosmetics Market Market Attractiveness Analysis by Gender, 2016-2032
- Figure 5: Global Waterless Cosmetics Market Revenue (US$ Mn) Market Share by Naturein 2022
- Figure 6: Global Waterless Cosmetics Market Market Attractiveness Analysis by Nature, 2016-2032
- Figure 7: Global Waterless Cosmetics Market Revenue (US$ Mn) Market Share by Distribution Channelin 2022
- Figure 8: Global Waterless Cosmetics Market Market Attractiveness Analysis by Distribution Channel, 2016-2032
- Figure 9: Global Waterless Cosmetics Market Revenue (US$ Mn) Market Share by Region in 2022
- Figure 10: Global Waterless Cosmetics Market Market Attractiveness Analysis by Region, 2016-2032
- Figure 11: Global Waterless Cosmetics Market Market Revenue (US$ Mn) (2016-2032)
- Figure 12: Global Waterless Cosmetics Market Market Revenue (US$ Mn) Comparison by Region (2016-2032)
- Figure 13: Global Waterless Cosmetics Market Market Revenue (US$ Mn) Comparison by Product (2016-2032)
- Figure 14: Global Waterless Cosmetics Market Market Revenue (US$ Mn) Comparison by Gender (2016-2032)
- Figure 15: Global Waterless Cosmetics Market Market Revenue (US$ Mn) Comparison by Nature (2016-2032)
- Figure 16: Global Waterless Cosmetics Market Market Revenue (US$ Mn) Comparison by Distribution Channel (2016-2032)
- Figure 17: Global Waterless Cosmetics Market Market Y-o-Y Growth Rate Comparison by Region (2016-2032)
- Figure 18: Global Waterless Cosmetics Market Market Y-o-Y Growth Rate Comparison by Product (2016-2032)
- Figure 19: Global Waterless Cosmetics Market Market Y-o-Y Growth Rate Comparison by Gender (2016-2032)
- Figure 20: Global Waterless Cosmetics Market Market Y-o-Y Growth Rate Comparison by Nature (2016-2032)
- Figure 21: Global Waterless Cosmetics Market Market Y-o-Y Growth Rate Comparison by Distribution Channel (2016-2032)
- Figure 22: Global Waterless Cosmetics Market Market Share Comparison by Region (2016-2032)
- Figure 23: Global Waterless Cosmetics Market Market Share Comparison by Product (2016-2032)
- Figure 24: Global Waterless Cosmetics Market Market Share Comparison by Gender (2016-2032)
- Figure 25: Global Waterless Cosmetics Market Market Share Comparison by Nature (2016-2032)
- Figure 26: Global Waterless Cosmetics Market Market Share Comparison by Distribution Channel (2016-2032)
- Figure 27: North America Waterless Cosmetics Market Revenue (US$ Mn) Market Share by Productin 2022
- Figure 28: North America Waterless Cosmetics Market Market Attractiveness Analysis by Product, 2016-2032
- Figure 29: North America Waterless Cosmetics Market Revenue (US$ Mn) Market Share by Genderin 2022
- Figure 30: North America Waterless Cosmetics Market Market Attractiveness Analysis by Gender, 2016-2032
- Figure 31: North America Waterless Cosmetics Market Revenue (US$ Mn) Market Share by Naturein 2022
- Figure 32: North America Waterless Cosmetics Market Market Attractiveness Analysis by Nature, 2016-2032
- Figure 33: North America Waterless Cosmetics Market Revenue (US$ Mn) Market Share by Distribution Channelin 2022
- Figure 34: North America Waterless Cosmetics Market Market Attractiveness Analysis by Distribution Channel, 2016-2032
- Figure 35: North America Waterless Cosmetics Market Revenue (US$ Mn) Market Share by Country in 2022
- Figure 36: North America Waterless Cosmetics Market Market Attractiveness Analysis by Country, 2016-2032
- Figure 37: North America Waterless Cosmetics Market Market Revenue (US$ Mn) (2016-2032)
- Figure 38: North America Waterless Cosmetics Market Market Revenue (US$ Mn) Comparison by Country (2016-2032)
- Figure 39: North America Waterless Cosmetics Market Market Revenue (US$ Mn) Comparison by Product (2016-2032)
- Figure 40: North America Waterless Cosmetics Market Market Revenue (US$ Mn) Comparison by Gender (2016-2032)
- Figure 41: North America Waterless Cosmetics Market Market Revenue (US$ Mn) Comparison by Nature (2016-2032)
- Figure 42: North America Waterless Cosmetics Market Market Revenue (US$ Mn) Comparison by Distribution Channel (2016-2032)
- Figure 43: North America Waterless Cosmetics Market Market Y-o-Y Growth Rate Comparison by Country (2016-2032)
- Figure 44: North America Waterless Cosmetics Market Market Y-o-Y Growth Rate Comparison by Product (2016-2032)
- Figure 45: North America Waterless Cosmetics Market Market Y-o-Y Growth Rate Comparison by Gender (2016-2032)
- Figure 46: North America Waterless Cosmetics Market Market Y-o-Y Growth Rate Comparison by Nature (2016-2032)
- Figure 47: North America Waterless Cosmetics Market Market Y-o-Y Growth Rate Comparison by Distribution Channel (2016-2032)
- Figure 48: North America Waterless Cosmetics Market Market Share Comparison by Country (2016-2032)
- Figure 49: North America Waterless Cosmetics Market Market Share Comparison by Product (2016-2032)
- Figure 50: North America Waterless Cosmetics Market Market Share Comparison by Gender (2016-2032)
- Figure 51: North America Waterless Cosmetics Market Market Share Comparison by Nature (2016-2032)
- Figure 52: North America Waterless Cosmetics Market Market Share Comparison by Distribution Channel (2016-2032)
- Figure 53: Western Europe Waterless Cosmetics Market Revenue (US$ Mn) Market Share by Productin 2022
- Figure 54: Western Europe Waterless Cosmetics Market Market Attractiveness Analysis by Product, 2016-2032
- Figure 55: Western Europe Waterless Cosmetics Market Revenue (US$ Mn) Market Share by Genderin 2022
- Figure 56: Western Europe Waterless Cosmetics Market Market Attractiveness Analysis by Gender, 2016-2032
- Figure 57: Western Europe Waterless Cosmetics Market Revenue (US$ Mn) Market Share by Naturein 2022
- Figure 58: Western Europe Waterless Cosmetics Market Market Attractiveness Analysis by Nature, 2016-2032
- Figure 59: Western Europe Waterless Cosmetics Market Revenue (US$ Mn) Market Share by Distribution Channelin 2022
- Figure 60: Western Europe Waterless Cosmetics Market Market Attractiveness Analysis by Distribution Channel, 2016-2032
- Figure 61: Western Europe Waterless Cosmetics Market Revenue (US$ Mn) Market Share by Country in 2022
- Figure 62: Western Europe Waterless Cosmetics Market Market Attractiveness Analysis by Country, 2016-2032
- Figure 63: Western Europe Waterless Cosmetics Market Market Revenue (US$ Mn) (2016-2032)
- Figure 64: Western Europe Waterless Cosmetics Market Market Revenue (US$ Mn) Comparison by Country (2016-2032)
- Figure 65: Western Europe Waterless Cosmetics Market Market Revenue (US$ Mn) Comparison by Product (2016-2032)
- Figure 66: Western Europe Waterless Cosmetics Market Market Revenue (US$ Mn) Comparison by Gender (2016-2032)
- Figure 67: Western Europe Waterless Cosmetics Market Market Revenue (US$ Mn) Comparison by Nature (2016-2032)
- Figure 68: Western Europe Waterless Cosmetics Market Market Revenue (US$ Mn) Comparison by Distribution Channel (2016-2032)
- Figure 69: Western Europe Waterless Cosmetics Market Market Y-o-Y Growth Rate Comparison by Country (2016-2032)
- Figure 70: Western Europe Waterless Cosmetics Market Market Y-o-Y Growth Rate Comparison by Product (2016-2032)
- Figure 71: Western Europe Waterless Cosmetics Market Market Y-o-Y Growth Rate Comparison by Gender (2016-2032)
- Figure 72: Western Europe Waterless Cosmetics Market Market Y-o-Y Growth Rate Comparison by Nature (2016-2032)
- Figure 73: Western Europe Waterless Cosmetics Market Market Y-o-Y Growth Rate Comparison by Distribution Channel (2016-2032)
- Figure 74: Western Europe Waterless Cosmetics Market Market Share Comparison by Country (2016-2032)
- Figure 75: Western Europe Waterless Cosmetics Market Market Share Comparison by Product (2016-2032)
- Figure 76: Western Europe Waterless Cosmetics Market Market Share Comparison by Gender (2016-2032)
- Figure 77: Western Europe Waterless Cosmetics Market Market Share Comparison by Nature (2016-2032)
- Figure 78: Western Europe Waterless Cosmetics Market Market Share Comparison by Distribution Channel (2016-2032)
- Figure 79: Eastern Europe Waterless Cosmetics Market Revenue (US$ Mn) Market Share by Productin 2022
- Figure 80: Eastern Europe Waterless Cosmetics Market Market Attractiveness Analysis by Product, 2016-2032
- Figure 81: Eastern Europe Waterless Cosmetics Market Revenue (US$ Mn) Market Share by Genderin 2022
- Figure 82: Eastern Europe Waterless Cosmetics Market Market Attractiveness Analysis by Gender, 2016-2032
- Figure 83: Eastern Europe Waterless Cosmetics Market Revenue (US$ Mn) Market Share by Naturein 2022
- Figure 84: Eastern Europe Waterless Cosmetics Market Market Attractiveness Analysis by Nature, 2016-2032
- Figure 85: Eastern Europe Waterless Cosmetics Market Revenue (US$ Mn) Market Share by Distribution Channelin 2022
- Figure 86: Eastern Europe Waterless Cosmetics Market Market Attractiveness Analysis by Distribution Channel, 2016-2032
- Figure 87: Eastern Europe Waterless Cosmetics Market Revenue (US$ Mn) Market Share by Country in 2022
- Figure 88: Eastern Europe Waterless Cosmetics Market Market Attractiveness Analysis by Country, 2016-2032
- Figure 89: Eastern Europe Waterless Cosmetics Market Market Revenue (US$ Mn) (2016-2032)
- Figure 90: Eastern Europe Waterless Cosmetics Market Market Revenue (US$ Mn) Comparison by Country (2016-2032)
- Figure 91: Eastern Europe Waterless Cosmetics Market Market Revenue (US$ Mn) Comparison by Product (2016-2032)
- Figure 92: Eastern Europe Waterless Cosmetics Market Market Revenue (US$ Mn) Comparison by Gender (2016-2032)
- Figure 93: Eastern Europe Waterless Cosmetics Market Market Revenue (US$ Mn) Comparison by Nature (2016-2032)
- Figure 94: Eastern Europe Waterless Cosmetics Market Market Revenue (US$ Mn) Comparison by Distribution Channel (2016-2032)
- Figure 95: Eastern Europe Waterless Cosmetics Market Market Y-o-Y Growth Rate Comparison by Country (2016-2032)
- Figure 96: Eastern Europe Waterless Cosmetics Market Market Y-o-Y Growth Rate Comparison by Product (2016-2032)
- Figure 97: Eastern Europe Waterless Cosmetics Market Market Y-o-Y Growth Rate Comparison by Gender (2016-2032)
- Figure 98: Eastern Europe Waterless Cosmetics Market Market Y-o-Y Growth Rate Comparison by Nature (2016-2032)
- Figure 99: Eastern Europe Waterless Cosmetics Market Market Y-o-Y Growth Rate Comparison by Distribution Channel (2016-2032)
- Figure 100: Eastern Europe Waterless Cosmetics Market Market Share Comparison by Country (2016-2032)
- Figure 101: Eastern Europe Waterless Cosmetics Market Market Share Comparison by Product (2016-2032)
- Figure 102: Eastern Europe Waterless Cosmetics Market Market Share Comparison by Gender (2016-2032)
- Figure 103: Eastern Europe Waterless Cosmetics Market Market Share Comparison by Nature (2016-2032)
- Figure 104: Eastern Europe Waterless Cosmetics Market Market Share Comparison by Distribution Channel (2016-2032)
- Figure 105: APAC Waterless Cosmetics Market Revenue (US$ Mn) Market Share by Productin 2022
- Figure 106: APAC Waterless Cosmetics Market Market Attractiveness Analysis by Product, 2016-2032
- Figure 107: APAC Waterless Cosmetics Market Revenue (US$ Mn) Market Share by Genderin 2022
- Figure 108: APAC Waterless Cosmetics Market Market Attractiveness Analysis by Gender, 2016-2032
- Figure 109: APAC Waterless Cosmetics Market Revenue (US$ Mn) Market Share by Naturein 2022
- Figure 110: APAC Waterless Cosmetics Market Market Attractiveness Analysis by Nature, 2016-2032
- Figure 111: APAC Waterless Cosmetics Market Revenue (US$ Mn) Market Share by Distribution Channelin 2022
- Figure 112: APAC Waterless Cosmetics Market Market Attractiveness Analysis by Distribution Channel, 2016-2032
- Figure 113: APAC Waterless Cosmetics Market Revenue (US$ Mn) Market Share by Country in 2022
- Figure 114: APAC Waterless Cosmetics Market Market Attractiveness Analysis by Country, 2016-2032
- Figure 115: APAC Waterless Cosmetics Market Market Revenue (US$ Mn) (2016-2032)
- Figure 116: APAC Waterless Cosmetics Market Market Revenue (US$ Mn) Comparison by Country (2016-2032)
- Figure 117: APAC Waterless Cosmetics Market Market Revenue (US$ Mn) Comparison by Product (2016-2032)
- Figure 118: APAC Waterless Cosmetics Market Market Revenue (US$ Mn) Comparison by Gender (2016-2032)
- Figure 119: APAC Waterless Cosmetics Market Market Revenue (US$ Mn) Comparison by Nature (2016-2032)
- Figure 120: APAC Waterless Cosmetics Market Market Revenue (US$ Mn) Comparison by Distribution Channel (2016-2032)
- Figure 121: APAC Waterless Cosmetics Market Market Y-o-Y Growth Rate Comparison by Country (2016-2032)
- Figure 122: APAC Waterless Cosmetics Market Market Y-o-Y Growth Rate Comparison by Product (2016-2032)
- Figure 123: APAC Waterless Cosmetics Market Market Y-o-Y Growth Rate Comparison by Gender (2016-2032)
- Figure 124: APAC Waterless Cosmetics Market Market Y-o-Y Growth Rate Comparison by Nature (2016-2032)
- Figure 125: APAC Waterless Cosmetics Market Market Y-o-Y Growth Rate Comparison by Distribution Channel (2016-2032)
- Figure 126: APAC Waterless Cosmetics Market Market Share Comparison by Country (2016-2032)
- Figure 127: APAC Waterless Cosmetics Market Market Share Comparison by Product (2016-2032)
- Figure 128: APAC Waterless Cosmetics Market Market Share Comparison by Gender (2016-2032)
- Figure 129: APAC Waterless Cosmetics Market Market Share Comparison by Nature (2016-2032)
- Figure 130: APAC Waterless Cosmetics Market Market Share Comparison by Distribution Channel (2016-2032)
- Figure 131: Latin America Waterless Cosmetics Market Revenue (US$ Mn) Market Share by Productin 2022
- Figure 132: Latin America Waterless Cosmetics Market Market Attractiveness Analysis by Product, 2016-2032
- Figure 133: Latin America Waterless Cosmetics Market Revenue (US$ Mn) Market Share by Genderin 2022
- Figure 134: Latin America Waterless Cosmetics Market Market Attractiveness Analysis by Gender, 2016-2032
- Figure 135: Latin America Waterless Cosmetics Market Revenue (US$ Mn) Market Share by Naturein 2022
- Figure 136: Latin America Waterless Cosmetics Market Market Attractiveness Analysis by Nature, 2016-2032
- Figure 137: Latin America Waterless Cosmetics Market Revenue (US$ Mn) Market Share by Distribution Channelin 2022
- Figure 138: Latin America Waterless Cosmetics Market Market Attractiveness Analysis by Distribution Channel, 2016-2032
- Figure 139: Latin America Waterless Cosmetics Market Revenue (US$ Mn) Market Share by Country in 2022
- Figure 140: Latin America Waterless Cosmetics Market Market Attractiveness Analysis by Country, 2016-2032
- Figure 141: Latin America Waterless Cosmetics Market Market Revenue (US$ Mn) (2016-2032)
- Figure 142: Latin America Waterless Cosmetics Market Market Revenue (US$ Mn) Comparison by Country (2016-2032)
- Figure 143: Latin America Waterless Cosmetics Market Market Revenue (US$ Mn) Comparison by Product (2016-2032)
- Figure 144: Latin America Waterless Cosmetics Market Market Revenue (US$ Mn) Comparison by Gender (2016-2032)
- Figure 145: Latin America Waterless Cosmetics Market Market Revenue (US$ Mn) Comparison by Nature (2016-2032)
- Figure 146: Latin America Waterless Cosmetics Market Market Revenue (US$ Mn) Comparison by Distribution Channel (2016-2032)
- Figure 147: Latin America Waterless Cosmetics Market Market Y-o-Y Growth Rate Comparison by Country (2016-2032)
- Figure 148: Latin America Waterless Cosmetics Market Market Y-o-Y Growth Rate Comparison by Product (2016-2032)
- Figure 149: Latin America Waterless Cosmetics Market Market Y-o-Y Growth Rate Comparison by Gender (2016-2032)
- Figure 150: Latin America Waterless Cosmetics Market Market Y-o-Y Growth Rate Comparison by Nature (2016-2032)
- Figure 151: Latin America Waterless Cosmetics Market Market Y-o-Y Growth Rate Comparison by Distribution Channel (2016-2032)
- Figure 152: Latin America Waterless Cosmetics Market Market Share Comparison by Country (2016-2032)
- Figure 153: Latin America Waterless Cosmetics Market Market Share Comparison by Product (2016-2032)
- Figure 154: Latin America Waterless Cosmetics Market Market Share Comparison by Gender (2016-2032)
- Figure 155: Latin America Waterless Cosmetics Market Market Share Comparison by Nature (2016-2032)
- Figure 156: Latin America Waterless Cosmetics Market Market Share Comparison by Distribution Channel (2016-2032)
- Figure 157: Middle East & Africa Waterless Cosmetics Market Revenue (US$ Mn) Market Share by Productin 2022
- Figure 158: Middle East & Africa Waterless Cosmetics Market Market Attractiveness Analysis by Product, 2016-2032
- Figure 159: Middle East & Africa Waterless Cosmetics Market Revenue (US$ Mn) Market Share by Genderin 2022
- Figure 160: Middle East & Africa Waterless Cosmetics Market Market Attractiveness Analysis by Gender, 2016-2032
- Figure 161: Middle East & Africa Waterless Cosmetics Market Revenue (US$ Mn) Market Share by Naturein 2022
- Figure 162: Middle East & Africa Waterless Cosmetics Market Market Attractiveness Analysis by Nature, 2016-2032
- Figure 163: Middle East & Africa Waterless Cosmetics Market Revenue (US$ Mn) Market Share by Distribution Channelin 2022
- Figure 164: Middle East & Africa Waterless Cosmetics Market Market Attractiveness Analysis by Distribution Channel, 2016-2032
- Figure 165: Middle East & Africa Waterless Cosmetics Market Revenue (US$ Mn) Market Share by Country in 2022
- Figure 166: Middle East & Africa Waterless Cosmetics Market Market Attractiveness Analysis by Country, 2016-2032
- Figure 167: Middle East & Africa Waterless Cosmetics Market Market Revenue (US$ Mn) (2016-2032)
- Figure 168: Middle East & Africa Waterless Cosmetics Market Market Revenue (US$ Mn) Comparison by Country (2016-2032)
- Figure 169: Middle East & Africa Waterless Cosmetics Market Market Revenue (US$ Mn) Comparison by Product (2016-2032)
- Figure 170: Middle East & Africa Waterless Cosmetics Market Market Revenue (US$ Mn) Comparison by Gender (2016-2032)
- Figure 171: Middle East & Africa Waterless Cosmetics Market Market Revenue (US$ Mn) Comparison by Nature (2016-2032)
- Figure 172: Middle East & Africa Waterless Cosmetics Market Market Revenue (US$ Mn) Comparison by Distribution Channel (2016-2032)
- Figure 173: Middle East & Africa Waterless Cosmetics Market Market Y-o-Y Growth Rate Comparison by Country (2016-2032)
- Figure 174: Middle East & Africa Waterless Cosmetics Market Market Y-o-Y Growth Rate Comparison by Product (2016-2032)
- Figure 175: Middle East & Africa Waterless Cosmetics Market Market Y-o-Y Growth Rate Comparison by Gender (2016-2032)
- Figure 176: Middle East & Africa Waterless Cosmetics Market Market Y-o-Y Growth Rate Comparison by Nature (2016-2032)
- Figure 177: Middle East & Africa Waterless Cosmetics Market Market Y-o-Y Growth Rate Comparison by Distribution Channel (2016-2032)
- Figure 178: Middle East & Africa Waterless Cosmetics Market Market Share Comparison by Country (2016-2032)
- Figure 179: Middle East & Africa Waterless Cosmetics Market Market Share Comparison by Product (2016-2032)
- Figure 180: Middle East & Africa Waterless Cosmetics Market Market Share Comparison by Gender (2016-2032)
- Figure 181: Middle East & Africa Waterless Cosmetics Market Market Share Comparison by Nature (2016-2032)
- Figure 182: Middle East & Africa Waterless Cosmetics Market Market Share Comparison by Distribution Channel (2016-2032)
"
- List of Tables
- "
- Table 1: Global Waterless Cosmetics Market Market Comparison by Product (2016-2032)
- Table 2: Global Waterless Cosmetics Market Market Comparison by Gender (2016-2032)
- Table 3: Global Waterless Cosmetics Market Market Comparison by Nature (2016-2032)
- Table 4: Global Waterless Cosmetics Market Market Comparison by Distribution Channel (2016-2032)
- Table 5: Global Waterless Cosmetics Market Revenue (US$ Mn) Comparison by Region (2016-2032)
- Table 6: Global Waterless Cosmetics Market Market Revenue (US$ Mn) (2016-2032)
- Table 7: Global Waterless Cosmetics Market Market Revenue (US$ Mn) Comparison by Region (2016-2032)
- Table 8: Global Waterless Cosmetics Market Market Revenue (US$ Mn) Comparison by Product (2016-2032)
- Table 9: Global Waterless Cosmetics Market Market Revenue (US$ Mn) Comparison by Gender (2016-2032)
- Table 10: Global Waterless Cosmetics Market Market Revenue (US$ Mn) Comparison by Nature (2016-2032)
- Table 11: Global Waterless Cosmetics Market Market Revenue (US$ Mn) Comparison by Distribution Channel (2016-2032)
- Table 12: Global Waterless Cosmetics Market Market Y-o-Y Growth Rate Comparison by Region (2016-2032)
- Table 13: Global Waterless Cosmetics Market Market Y-o-Y Growth Rate Comparison by Product (2016-2032)
- Table 14: Global Waterless Cosmetics Market Market Y-o-Y Growth Rate Comparison by Gender (2016-2032)
- Table 15: Global Waterless Cosmetics Market Market Y-o-Y Growth Rate Comparison by Nature (2016-2032)
- Table 16: Global Waterless Cosmetics Market Market Y-o-Y Growth Rate Comparison by Distribution Channel (2016-2032)
- Table 17: Global Waterless Cosmetics Market Market Share Comparison by Region (2016-2032)
- Table 18: Global Waterless Cosmetics Market Market Share Comparison by Product (2016-2032)
- Table 19: Global Waterless Cosmetics Market Market Share Comparison by Gender (2016-2032)
- Table 20: Global Waterless Cosmetics Market Market Share Comparison by Nature (2016-2032)
- Table 21: Global Waterless Cosmetics Market Market Share Comparison by Distribution Channel (2016-2032)
- Table 22: North America Waterless Cosmetics Market Market Comparison by Gender (2016-2032)
- Table 23: North America Waterless Cosmetics Market Market Comparison by Nature (2016-2032)
- Table 24: North America Waterless Cosmetics Market Market Comparison by Distribution Channel (2016-2032)
- Table 25: North America Waterless Cosmetics Market Revenue (US$ Mn) Comparison by Country (2016-2032)
- Table 26: North America Waterless Cosmetics Market Market Revenue (US$ Mn) (2016-2032)
- Table 27: North America Waterless Cosmetics Market Market Revenue (US$ Mn) Comparison by Country (2016-2032)
- Table 28: North America Waterless Cosmetics Market Market Revenue (US$ Mn) Comparison by Product (2016-2032)
- Table 29: North America Waterless Cosmetics Market Market Revenue (US$ Mn) Comparison by Gender (2016-2032)
- Table 30: North America Waterless Cosmetics Market Market Revenue (US$ Mn) Comparison by Nature (2016-2032)
- Table 31: North America Waterless Cosmetics Market Market Revenue (US$ Mn) Comparison by Distribution Channel (2016-2032)
- Table 32: North America Waterless Cosmetics Market Market Y-o-Y Growth Rate Comparison by Country (2016-2032)
- Table 33: North America Waterless Cosmetics Market Market Y-o-Y Growth Rate Comparison by Product (2016-2032)
- Table 34: North America Waterless Cosmetics Market Market Y-o-Y Growth Rate Comparison by Gender (2016-2032)
- Table 35: North America Waterless Cosmetics Market Market Y-o-Y Growth Rate Comparison by Nature (2016-2032)
- Table 36: North America Waterless Cosmetics Market Market Y-o-Y Growth Rate Comparison by Distribution Channel (2016-2032)
- Table 37: North America Waterless Cosmetics Market Market Share Comparison by Country (2016-2032)
- Table 38: North America Waterless Cosmetics Market Market Share Comparison by Product (2016-2032)
- Table 39: North America Waterless Cosmetics Market Market Share Comparison by Gender (2016-2032)
- Table 40: North America Waterless Cosmetics Market Market Share Comparison by Nature (2016-2032)
- Table 41: North America Waterless Cosmetics Market Market Share Comparison by Distribution Channel (2016-2032)
- Table 42: Western Europe Waterless Cosmetics Market Market Comparison by Product (2016-2032)
- Table 43: Western Europe Waterless Cosmetics Market Market Comparison by Gender (2016-2032)
- Table 44: Western Europe Waterless Cosmetics Market Market Comparison by Nature (2016-2032)
- Table 45: Western Europe Waterless Cosmetics Market Market Comparison by Distribution Channel (2016-2032)
- Table 46: Western Europe Waterless Cosmetics Market Revenue (US$ Mn) Comparison by Country (2016-2032)
- Table 47: Western Europe Waterless Cosmetics Market Market Revenue (US$ Mn) (2016-2032)
- Table 48: Western Europe Waterless Cosmetics Market Market Revenue (US$ Mn) Comparison by Country (2016-2032)
- Table 49: Western Europe Waterless Cosmetics Market Market Revenue (US$ Mn) Comparison by Product (2016-2032)
- Table 50: Western Europe Waterless Cosmetics Market Market Revenue (US$ Mn) Comparison by Gender (2016-2032)
- Table 51: Western Europe Waterless Cosmetics Market Market Revenue (US$ Mn) Comparison by Nature (2016-2032)
- Table 52: Western Europe Waterless Cosmetics Market Market Revenue (US$ Mn) Comparison by Distribution Channel (2016-2032)
- Table 53: Western Europe Waterless Cosmetics Market Market Y-o-Y Growth Rate Comparison by Country (2016-2032)
- Table 54: Western Europe Waterless Cosmetics Market Market Y-o-Y Growth Rate Comparison by Product (2016-2032)
- Table 55: Western Europe Waterless Cosmetics Market Market Y-o-Y Growth Rate Comparison by Gender (2016-2032)
- Table 56: Western Europe Waterless Cosmetics Market Market Y-o-Y Growth Rate Comparison by Nature (2016-2032)
- Table 57: Western Europe Waterless Cosmetics Market Market Y-o-Y Growth Rate Comparison by Distribution Channel (2016-2032)
- Table 58: Western Europe Waterless Cosmetics Market Market Share Comparison by Country (2016-2032)
- Table 59: Western Europe Waterless Cosmetics Market Market Share Comparison by Product (2016-2032)
- Table 60: Western Europe Waterless Cosmetics Market Market Share Comparison by Gender (2016-2032)
- Table 61: Western Europe Waterless Cosmetics Market Market Share Comparison by Nature (2016-2032)
- Table 62: Western Europe Waterless Cosmetics Market Market Share Comparison by Distribution Channel (2016-2032)
- Table 63: Eastern Europe Waterless Cosmetics Market Market Comparison by Product (2016-2032)
- Table 64: Eastern Europe Waterless Cosmetics Market Market Comparison by Gender (2016-2032)
- Table 65: Eastern Europe Waterless Cosmetics Market Market Comparison by Nature (2016-2032)
- Table 66: Eastern Europe Waterless Cosmetics Market Market Comparison by Distribution Channel (2016-2032)
- Table 67: Eastern Europe Waterless Cosmetics Market Revenue (US$ Mn) Comparison by Country (2016-2032)
- Table 68: Eastern Europe Waterless Cosmetics Market Market Revenue (US$ Mn) (2016-2032)
- Table 69: Eastern Europe Waterless Cosmetics Market Market Revenue (US$ Mn) Comparison by Country (2016-2032)
- Table 70: Eastern Europe Waterless Cosmetics Market Market Revenue (US$ Mn) Comparison by Product (2016-2032)
- Table 71: Eastern Europe Waterless Cosmetics Market Market Revenue (US$ Mn) Comparison by Gender (2016-2032)
- Table 72: Eastern Europe Waterless Cosmetics Market Market Revenue (US$ Mn) Comparison by Nature (2016-2032)
- Table 73: Eastern Europe Waterless Cosmetics Market Market Revenue (US$ Mn) Comparison by Distribution Channel (2016-2032)
- Table 74: Eastern Europe Waterless Cosmetics Market Market Y-o-Y Growth Rate Comparison by Country (2016-2032)
- Table 75: Eastern Europe Waterless Cosmetics Market Market Y-o-Y Growth Rate Comparison by Product (2016-2032)
- Table 76: Eastern Europe Waterless Cosmetics Market Market Y-o-Y Growth Rate Comparison by Gender (2016-2032)
- Table 77: Eastern Europe Waterless Cosmetics Market Market Y-o-Y Growth Rate Comparison by Nature (2016-2032)
- Table 78: Eastern Europe Waterless Cosmetics Market Market Y-o-Y Growth Rate Comparison by Distribution Channel (2016-2032)
- Table 79: Eastern Europe Waterless Cosmetics Market Market Share Comparison by Country (2016-2032)
- Table 80: Eastern Europe Waterless Cosmetics Market Market Share Comparison by Product (2016-2032)
- Table 81: Eastern Europe Waterless Cosmetics Market Market Share Comparison by Gender (2016-2032)
- Table 82: Eastern Europe Waterless Cosmetics Market Market Share Comparison by Nature (2016-2032)
- Table 83: Eastern Europe Waterless Cosmetics Market Market Share Comparison by Distribution Channel (2016-2032)
- Table 84: APAC Waterless Cosmetics Market Market Comparison by Product (2016-2032)
- Table 85: APAC Waterless Cosmetics Market Market Comparison by Gender (2016-2032)
- Table 86: APAC Waterless Cosmetics Market Market Comparison by Nature (2016-2032)
- Table 87: APAC Waterless Cosmetics Market Market Comparison by Distribution Channel (2016-2032)
- Table 88: APAC Waterless Cosmetics Market Revenue (US$ Mn) Comparison by Country (2016-2032)
- Table 89: APAC Waterless Cosmetics Market Market Revenue (US$ Mn) (2016-2032)
- Table 90: APAC Waterless Cosmetics Market Market Revenue (US$ Mn) Comparison by Country (2016-2032)
- Table 91: APAC Waterless Cosmetics Market Market Revenue (US$ Mn) Comparison by Product (2016-2032)
- Table 92: APAC Waterless Cosmetics Market Market Revenue (US$ Mn) Comparison by Gender (2016-2032)
- Table 93: APAC Waterless Cosmetics Market Market Revenue (US$ Mn) Comparison by Nature (2016-2032)
- Table 94: APAC Waterless Cosmetics Market Market Revenue (US$ Mn) Comparison by Distribution Channel (2016-2032)
- Table 95: APAC Waterless Cosmetics Market Market Y-o-Y Growth Rate Comparison by Country (2016-2032)
- Table 96: APAC Waterless Cosmetics Market Market Y-o-Y Growth Rate Comparison by Product (2016-2032)
- Table 97: APAC Waterless Cosmetics Market Market Y-o-Y Growth Rate Comparison by Gender (2016-2032)
- Table 98: APAC Waterless Cosmetics Market Market Y-o-Y Growth Rate Comparison by Nature (2016-2032)
- Table 99: APAC Waterless Cosmetics Market Market Y-o-Y Growth Rate Comparison by Distribution Channel (2016-2032)
- Table 100: APAC Waterless Cosmetics Market Market Share Comparison by Country (2016-2032)
- Table 101: APAC Waterless Cosmetics Market Market Share Comparison by Product (2016-2032)
- Table 102: APAC Waterless Cosmetics Market Market Share Comparison by Gender (2016-2032)
- Table 103: APAC Waterless Cosmetics Market Market Share Comparison by Nature (2016-2032)
- Table 104: APAC Waterless Cosmetics Market Market Share Comparison by Distribution Channel (2016-2032)
- Table 105: Latin America Waterless Cosmetics Market Market Comparison by Product (2016-2032)
- Table 106: Latin America Waterless Cosmetics Market Market Comparison by Gender (2016-2032)
- Table 107: Latin America Waterless Cosmetics Market Market Comparison by Nature (2016-2032)
- Table 108: Latin America Waterless Cosmetics Market Market Comparison by Distribution Channel (2016-2032)
- Table 109: Latin America Waterless Cosmetics Market Revenue (US$ Mn) Comparison by Country (2016-2032)
- Table 110: Latin America Waterless Cosmetics Market Market Revenue (US$ Mn) (2016-2032)
- Table 111: Latin America Waterless Cosmetics Market Market Revenue (US$ Mn) Comparison by Country (2016-2032)
- Table 112: Latin America Waterless Cosmetics Market Market Revenue (US$ Mn) Comparison by Product (2016-2032)
- Table 113: Latin America Waterless Cosmetics Market Market Revenue (US$ Mn) Comparison by Gender (2016-2032)
- Table 114: Latin America Waterless Cosmetics Market Market Revenue (US$ Mn) Comparison by Nature (2016-2032)
- Table 115: Latin America Waterless Cosmetics Market Market Revenue (US$ Mn) Comparison by Distribution Channel (2016-2032)
- Table 116: Latin America Waterless Cosmetics Market Market Y-o-Y Growth Rate Comparison by Country (2016-2032)
- Table 117: Latin America Waterless Cosmetics Market Market Y-o-Y Growth Rate Comparison by Product (2016-2032)
- Table 118: Latin America Waterless Cosmetics Market Market Y-o-Y Growth Rate Comparison by Gender (2016-2032)
- Table 119: Latin America Waterless Cosmetics Market Market Y-o-Y Growth Rate Comparison by Nature (2016-2032)
- Table 120: Latin America Waterless Cosmetics Market Market Y-o-Y Growth Rate Comparison by Distribution Channel (2016-2032)
- Table 121: Latin America Waterless Cosmetics Market Market Share Comparison by Country (2016-2032)
- Table 122: Latin America Waterless Cosmetics Market Market Share Comparison by Product (2016-2032)
- Table 123: Latin America Waterless Cosmetics Market Market Share Comparison by Gender (2016-2032)
- Table 124: Latin America Waterless Cosmetics Market Market Share Comparison by Nature (2016-2032)
- Table 125: Latin America Waterless Cosmetics Market Market Share Comparison by Distribution Channel (2016-2032)
- Table 126: Middle East & Africa Waterless Cosmetics Market Market Comparison by Product (2016-2032)
- Table 127: Middle East & Africa Waterless Cosmetics Market Market Comparison by Gender (2016-2032)
- Table 128: Middle East & Africa Waterless Cosmetics Market Market Comparison by Nature (2016-2032)
- Table 129: Middle East & Africa Waterless Cosmetics Market Market Comparison by Distribution Channel (2016-2032)
- Table 130: Middle East & Africa Waterless Cosmetics Market Revenue (US$ Mn) Comparison by Country (2016-2032)
- Table 131: Middle East & Africa Waterless Cosmetics Market Market Revenue (US$ Mn) (2016-2032)
- Table 132: Middle East & Africa Waterless Cosmetics Market Market Revenue (US$ Mn) Comparison by Country (2016-2032)
- Table 133: Middle East & Africa Waterless Cosmetics Market Market Revenue (US$ Mn) Comparison by Product (2016-2032)
- Table 134: Middle East & Africa Waterless Cosmetics Market Market Revenue (US$ Mn) Comparison by Gender (2016-2032)
- Table 135: Middle East & Africa Waterless Cosmetics Market Market Revenue (US$ Mn) Comparison by Nature (2016-2032)
- Table 136: Middle East & Africa Waterless Cosmetics Market Market Revenue (US$ Mn) Comparison by Distribution Channel (2016-2032)
- Table 137: Middle East & Africa Waterless Cosmetics Market Market Y-o-Y Growth Rate Comparison by Country (2016-2032)
- Table 138: Middle East & Africa Waterless Cosmetics Market Market Y-o-Y Growth Rate Comparison by Product (2016-2032)
- Table 139: Middle East & Africa Waterless Cosmetics Market Market Y-o-Y Growth Rate Comparison by Gender (2016-2032)
- Table 140: Middle East & Africa Waterless Cosmetics Market Market Y-o-Y Growth Rate Comparison by Nature (2016-2032)
- Table 141: Middle East & Africa Waterless Cosmetics Market Market Y-o-Y Growth Rate Comparison by Distribution Channel (2016-2032)
- Table 142: Middle East & Africa Waterless Cosmetics Market Market Share Comparison by Country (2016-2032)
- Table 143: Middle East & Africa Waterless Cosmetics Market Market Share Comparison by Product (2016-2032)
- Table 144: Middle East & Africa Waterless Cosmetics Market Market Share Comparison by Gender (2016-2032)
- Table 145: Middle East & Africa Waterless Cosmetics Market Market Share Comparison by Nature (2016-2032)
- Table 146: Middle East & Africa Waterless Cosmetics Market Market Share Comparison by Distribution Channel (2016-2032)
- 1. Executive Summary
-
- Allies Group Pte. Ltd.
- Azafran Innovacion
- Carter + Jane
- Clensta
- Kao Corporation
- Ktein
- L’Oréal
- Lavedo Cosmetics
- Loli
- May Coop
- Niconi
- No Cosmetics
- Pinch of Colour
- Ruby’s Organics
- Taiki USA
- The Procter & Gamble Company
- The Waterless Beauty Company
- True Botanicals
- Unilever Plc
- VAPOUR BEAUTY
- Others
Our Clients


View Our Licence Options
