
Virtual Extensible LAN (VXLAN) Market By Component (Hardware, Software, Services), By Enterprise Size (Large Enterprises, SMEs), By Application (Multi-tenancy, Workload mobility, Software-defined networking (SDN) overlays, Network Function Virtualization (NFV), Disaster Recovery, Others), By End User (BFSI, Healthcare, IT & Telecommunications, Government, Retail, Others), By Region And Companies - Industry Segment Outlook, Market Assessment, Competition Scenario, Trends, And Forecast 2024-2033
-
51227
-
September 2024
-
300
-


-
This report was compiled by Vishwa Gaul Vishwa is an experienced market research and consulting professional with over 8 years of expertise in the ICT industry, contributing to over 700 reports across telecommunications, software, hardware, and digital solutions. Correspondence Team Lead- ICT Linkedin | Detailed Market research Methodology Our methodology involves a mix of primary research, including interviews with leading mental health experts, and secondary research from reputable medical journals and databases. View Detailed Methodology Page
-
Quick Navigation
Report Overview
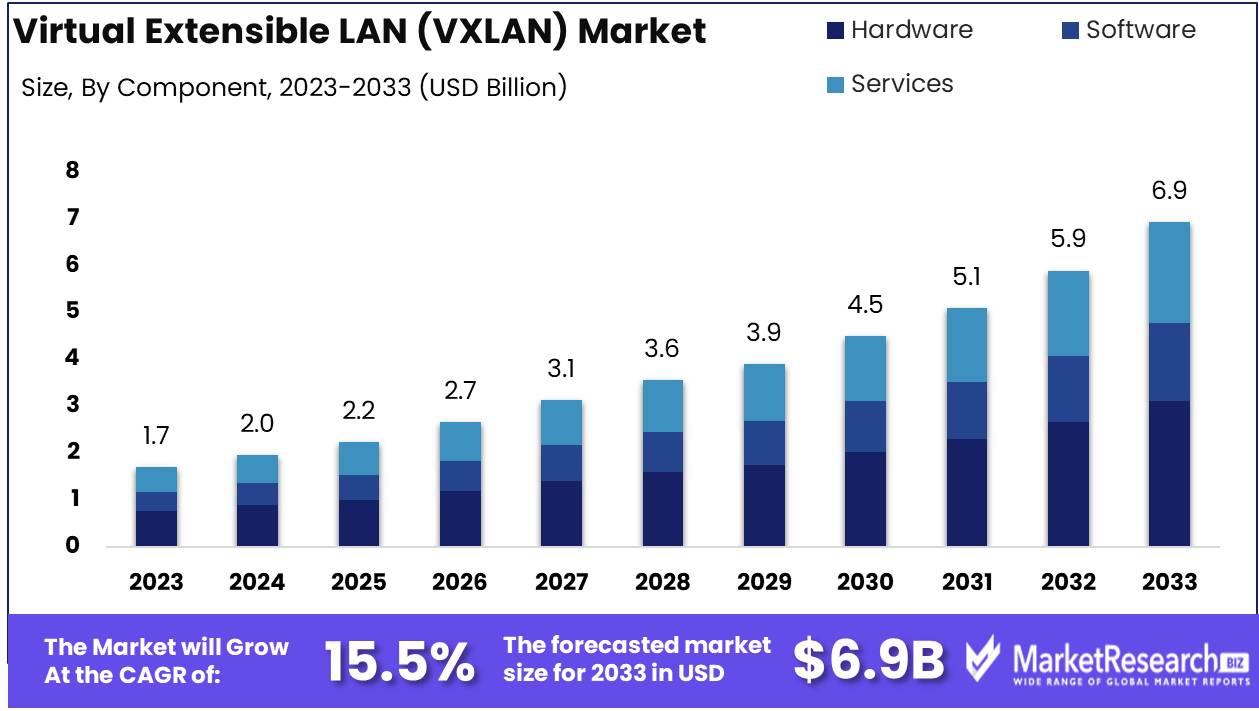
The Virtual Extensible LAN (VXLAN) Market was valued at USD 1.7 billion in 2023. It is expected to reach USD 6.9 billion by 2033, with a CAGR of 15.5% during the forecast period from 2024 to 2033.
The Virtual Extensible LAN (VXLAN) market refers to the industry focused on solutions that enable scalable and efficient Layer 2 overlay networks over a Layer 3 infrastructure. VXLAN technology is designed to address the limitations of traditional VLANs, particularly in large-scale data centers and cloud environments. By providing enhanced network segmentation, greater scalability, and improved isolation, VXLAN plays a crucial role in modernizing network architecture to support increased demand for virtualization and cloud services.
The Virtual Extensible LAN (VXLAN) market is poised for significant growth, driven by the escalating demand for data center virtualization and the increasing reliance on cloud computing infrastructures. As organizations scale their digital transformation efforts, the need for scalable, agile, and efficient network solutions becomes paramount, positioning VXLAN as a crucial technology to meet evolving enterprise needs. The surge in cloud computing has intensified the complexity of network management, necessitating the adoption of VXLAN to simplify overlay networks while maintaining high performance and scalability. VXLAN’s ability to extend Layer 2 networks over Layer 3 infrastructures enhances the flexibility and efficiency of network architectures, especially in multi-cloud and hybrid cloud environments.
Additionally, increased investments in cloud and data center infrastructures globally have further accelerated the deployment of VXLAN solutions, reflecting its growing importance in modern networking ecosystems.
The convergence of VXLAN with Software-Defined Networking (SDN) and automation is also a critical factor contributing to its market expansion. As organizations increasingly seek to automate network provisioning and management, VXLAN’s compatibility with SDN technologies offers enhanced automation capabilities, enabling more efficient and streamlined operations. This convergence not only addresses the complexity in network management but also supports the growing emphasis on operational efficiency within data centers. Furthermore, as enterprises continue to invest in both cloud technologies and data center infrastructure, the demand for flexible, secure, and scalable networking solutions like VXLAN will remain strong, positioning it as a key enabler in the evolution of network architectures.
Key Takeaways
- Market Growth: The Virtual Extensible LAN (VXLAN) Market was valued at USD 1.7 billion in 2023. It is expected to reach USD 6.9 billion by 2033, with a CAGR of 15.5% during the forecast period from 2024 to 2033.
- By Component: Hardware dominated the VXLAN market, followed by Services.
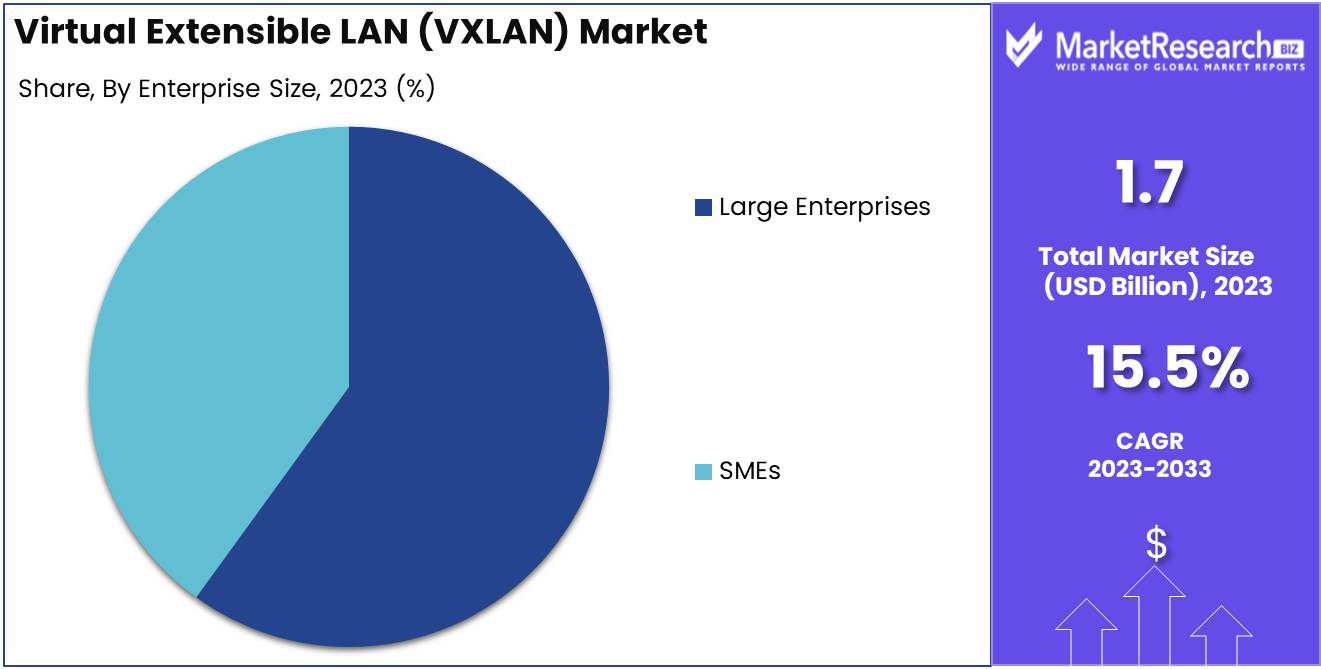
- By Enterprise Size: Large Enterprises dominated the VXLAN market by size.
- By Application: Multi-tenancy dominated VXLAN applications, driving market growth.
- By End User: BFSI dominated VXLAN adoption across various end-user segments.
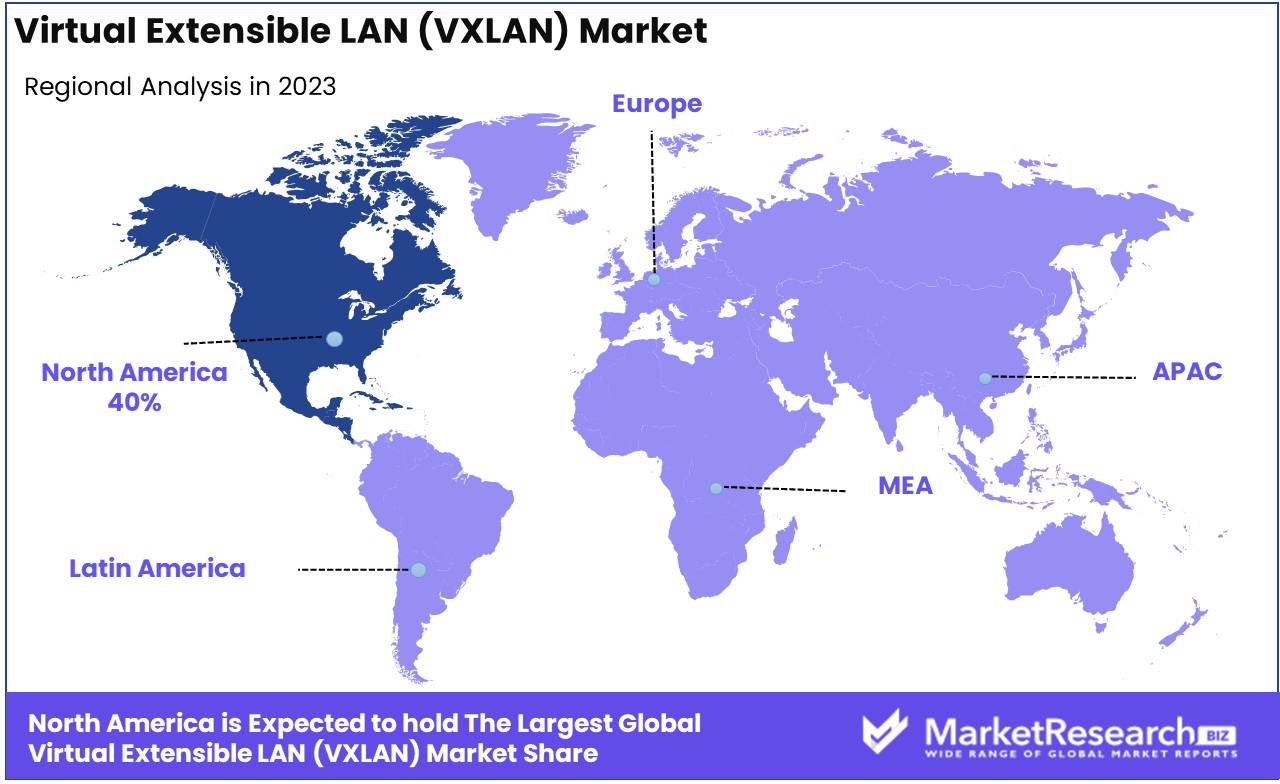
- Regional Dominance: North America dominates the VXLAN market with a 40% largest market share.
- Growth Opportunity: The global VXLAN market will see significant growth, driven by cloud computing expansion and increasing demand for multi-tenancy, offering substantial opportunities for networking providers and vendors.
Driving factors
Increasing Demand for Multi-Tenancy Support Driving Market Growth
The increasing demand for multi-tenancy support is a crucial driver for the growth of the Virtual Extensible LAN (VXLAN) market. Multi-tenancy, which allows multiple customers (or tenants) to share the same infrastructure while maintaining data isolation and security, is critical for modern enterprises, particularly those operating in cloud computing environments. VXLAN plays a vital role in facilitating network virtualization by enabling the creation of isolated virtual networks on shared physical infrastructure, making it well-suited to support multi-tenancy.
As organizations increasingly adopt cloud-based solutions, the need for flexible, scalable, and secure network architectures has surged. VXLAN provides the necessary scalability through its ability to extend the number of available virtual networks significantly, addressing the limitations of traditional VLANs, which are restricted to a maximum of 4,094 VLANs. VXLAN's ability to create up to 16 million virtual networks has made it a preferred solution for large-scale multi-tenant data centers. This shift towards more sophisticated network environments has been directly linked to the rise in demand for VXLAN technology, as it offers enhanced network flexibility and segmentation required for cloud service providers and enterprises operating in multi-tenant architectures.
Modernization of Data Centers Fuels VXLAN Market Expansion
The ongoing modernization of data centers is another key factor contributing to the growth of the VXLAN market. As businesses look to optimize their data center operations for improved efficiency, scalability, and agility, they are increasingly turning to advanced networking solutions like VXLAN. This technology supports the transition from traditional, hardware-defined networking models to virtualized environments that can accommodate the needs of modern applications and services.
Data center modernization often involves the consolidation of resources, increased use of virtualization, and the deployment of cloud-native applications. VXLAN enables seamless communication between virtual machines and applications spread across different data center locations, offering a scalable and flexible overlay network that can span multiple geographic areas. Moreover, VXLAN's compatibility with cloud architectures makes it an essential tool in building and maintaining hybrid cloud environments, where workloads are distributed between on-premises and cloud data centers.
As the digital transformation of enterprises accelerates, particularly with the rise of edge computing and 5G technologies, data centers are evolving to meet the growing demand for low-latency, high-bandwidth applications. The need for agile and scalable networking solutions provided by VXLAN is therefore becoming increasingly important. This modernization trend is expected to significantly propel the VXLAN market, as businesses seek to upgrade their networking infrastructure to support next-generation applications.
Adoption of Software-Defined Networking (SDN) Enhances VXLAN Utilization
The growing adoption of Software-Defined Networking (SDN) is another pivotal factor driving the VXLAN market. SDN separates the network control plane from the data plane, enabling centralized network management and greater automation. VXLAN complements SDN by acting as a flexible overlay protocol that enhances network scalability and efficiency in virtualized environments. When combined with SDN, VXLAN enables dynamic network provisioning, rapid scalability, and simplified management of network resources across large, distributed environments.
Organizations adopting SDN solutions are increasingly leveraging VXLAN as a critical component in creating programmable and automated network infrastructures. VXLAN’s ability to encapsulate Layer 2 traffic over Layer 3 networks aligns with SDN's objectives of simplifying and optimizing network operations. This combination allows for improved resource utilization, faster network deployment, and reduced operational complexity in data centers and cloud environments.
The integration of SDN and VXLAN is particularly valuable for enterprises seeking to implement network automation and intent-based networking strategies. As SDN adoption increases, the demand for VXLAN is expected to grow in tandem, as it provides the scalable network fabric required to support virtualized and cloud-based workloads. The combined capabilities of SDN and VXLAN are becoming increasingly critical in addressing the networking challenges of modern, distributed IT environments.
Restraining Factors
Complex Deployment and Configuration Hampering Adoption Rates
The Virtual Extensible LAN (VXLAN) market faces significant challenges due to the complex nature of its deployment and configuration processes. VXLAN, while offering enhanced scalability and flexibility in modern data centers, involves intricate technical setups, which necessitate high levels of expertise. This complexity can deter organizations from adopting the technology, especially small- to medium-sized enterprises (SMEs) that may lack the necessary resources or in-house skills.
Configuring VXLAN often requires specialized knowledge of networking protocols, such as the integration of underlay and overlay networks, multicast dependencies, and complex routing tables. This creates a steep learning curve, limiting the accessibility of VXLAN solutions to a broader range of potential users. As a result, the rate of market growth is slowed, as businesses are hesitant to transition from simpler network models to a VXLAN-enabled infrastructure.
Moreover, the need for constant monitoring, troubleshooting, and optimization of VXLAN networks further increases operational costs and complexity. Enterprises may face delays in realizing the cost-saving benefits of network virtualization, as initial deployment costs, including both hardware investments and human capital, tend to be significant. This complexity can stall the adoption of VXLAN, particularly in less resource-intensive sectors, thereby restraining the market’s overall expansion potential.
Interoperability Challenges Limiting Scalability and Cross-Platform Integration
Interoperability issues present a substantial barrier to the growth of the VXLAN market, particularly as organizations seek to integrate various hardware and software solutions from multiple vendors. VXLAN, being a Layer 2 overlay network running over a Layer 3 infrastructure, interacts with diverse networking components, making it essential for the technology to be compatible with existing IT ecosystems. However, ensuring seamless interoperability across different networking devices, virtual switches, and cloud platforms remains a challenge.
Vendors often implement VXLAN protocols with proprietary extensions or optimizations, which can result in inconsistent performance across different environments. For example, networking equipment from one manufacturer may not fully support or integrate with the VXLAN implementations of another, leading to fragmentation in the network infrastructure. This lack of standardization hinders the scalability of VXLAN-based solutions, as organizations find it difficult to extend their networks across multiple data centers or cloud environments.
Additionally, interoperability challenges complicate network management and increase the risk of operational failures, as systems from different providers may not communicate effectively. This can lead to increased downtime, higher maintenance costs, and performance bottlenecks, further discouraging businesses from embracing VXLAN solutions. Without improved standardization and cross-vendor compatibility, the VXLAN market's growth is likely to be constrained, as organizations opt for alternative, less complex networking technologies.
By Component Analysis
In 2023, Hardware dominated the VXLAN market, followed by Services.
In 2023, Hardware held a dominant market position in the By Component segment of the Virtual Extensible LAN (VXLAN) market. This leadership can be attributed to the critical role hardware plays in supporting high-performance network infrastructures required for VXLAN deployment. Hardware components, such as switches, routers, and network interface cards (NICs), provide the backbone for scalable and flexible network architectures. Their robustness and ability to manage increased traffic loads contribute significantly to the adoption of VXLAN in data centers.
Software, while a vital part of the VXLAN ecosystem, exhibited moderate growth in 2023. It is essential for enabling VXLAN overlay functionalities, network virtualization, and automation, providing flexibility and seamless network management. The integration of VXLAN software solutions in cloud-based services has expanded its use in software-defined networking (SDN) environments.
Services represent the fastest-growing segment, driven by increasing demand for consulting, integration, and support services. As organizations adopt complex VXLAN solutions, the need for specialized expertise in configuration, management, and troubleshooting becomes paramount, contributing to the growth of the services segment in the market.
By Enterprise Size Analysis
In 2023, Large Enterprises dominated the VXLAN market by size.
In 2023, Large Enterprises held a dominant market position in the By Enterprise Size segment of the Virtual Extensible LAN (VXLAN) Market. This segment's growth can be attributed to the extensive adoption of VXLAN technology by large organizations to support their expansive, complex network infrastructures. Large enterprises require scalable network solutions to accommodate increasing data traffic, multi-cloud environments, and remote workforce demands. VXLAN, with its capability to create virtualized Layer 2 networks over Layer 3 infrastructure, has proven essential in addressing these needs, enhancing both network flexibility and scalability.
Conversely, Small and Medium Enterprises (SMEs) are also expected to experience significant growth within the VXLAN market, driven by the rising need for cost-efficient network management solutions. However, their market share remains comparatively lower due to budget constraints and limited technological resources. While SMEs are progressively adopting cloud services and virtual networking solutions, their demand for VXLAN technology is anticipated to grow more gradually compared to large enterprises. The overall market dynamics indicate that large enterprises will continue to dominate the VXLAN market, with SMEs showing a steady increase in adoption rates.
By Application Analysis
In 2023, Multi-tenancy dominated VXLAN applications, driving market growth.
In 2023, Multi-tenancy held a dominant market position in the By Application segment of the Virtual Extensible LAN (VXLAN) market, driven by its ability to enable multiple clients or tenants to share the same network infrastructure while maintaining data isolation and security. Multi-tenancy allows for optimal resource utilization and cost efficiency, making it a crucial solution for large-scale enterprises and cloud service providers.
Additionally, Workload Mobility is gaining traction due to the increasing need for seamless data movement across diverse network environments, while Software-Defined Networking (SDN) Overlays are becoming essential in simplifying network management and enabling network programmability. Network Function Virtualization (NFV) further strengthens the VXLAN market by allowing flexible, software-based control over network functions, reducing dependency on traditional hardware.
Moreover, Disaster Recovery applications benefit from VXLAN’s ability to provide reliable and scalable solutions for business continuity, minimizing downtime and data loss. Other use cases, such as the integration of various network architectures and protocols, also contribute to the overall market growth, providing versatility across industries. This multi-faceted application growth ensures sustained expansion for VXLAN solutions across sectors.
By End User Analysis
In 2023, BFSI dominated VXLAN adoption across various end-user segments.
In 2023, BFSI held a dominant market position in the end-user segment of the Virtual Extensible LAN (VXLAN) market. The BFSI sector has increasingly relied on VXLAN technology to enhance data center efficiency and scalability, driven by the growing demand for secure and high-performance network infrastructure to support digital transformation initiatives. This dominance can be attributed to the need for seamless connectivity, improved data management, and stringent security measures.
The Healthcare segment has also shown significant adoption of VXLAN solutions, with the increasing need for scalable networks to manage large volumes of medical data and the rise of telemedicine. Meanwhile, the IT & Telecommunications sector continues to be a strong contender, as companies look to support cloud services, IoT applications, and virtualized network environments.
The Government segment has demonstrated a growing interest in VXLAN for secure, large-scale public sector networks. The Retail industry, while still developing, benefits from VXLAN in supporting e-commerce platforms and customer analytics. Finally, Others, including education and manufacturing, represent a growing market for VXLAN, with increasing reliance on virtualization and large data center networks.
Key Market Segments
By Component
- Hardware
- Software
- Services
By Enterprise Size
- Large Enterprises
- SMEs
By Application
- Multi-tenancy
- Workload mobility
- Software-defined networking (SDN) overlays
- Network Function Virtualization (NFV)
- Disaster recovery
- Others
By End User
- BFSI
- Healthcare
- IT & Telecommunications
- Government
- Retail
- Others
Growth Opportunity
Cloud Computing Expansion Accelerates VXLAN Adoption
The rapid expansion of cloud computing is one of the primary drivers of VXLAN market growth. Cloud service providers are increasingly relying on VXLAN technology to support scalable and flexible networks across multiple data centers. By enabling layer 2 overlay networks on top of existing layer 3 infrastructure, VXLANs allow cloud providers to extend the reach of their networks without geographical limitations. According to industry data, the cloud computing market is expected to grow at a compound annual growth rate (CAGR) of 15.7% by 2027. This surge in cloud demand will directly increase the need for scalable and adaptable networking solutions, solidifying VXLAN as a critical component of future infrastructure.
Enhanced Support for Multi-Tenancy Drives Market Growth
Multi-tenancy is a key feature supported by VXLAN, enabling the efficient segmentation of networks for different users or clients within the same physical infrastructure. This capability is essential for enterprises managing hybrid or public cloud environments. As multi-tenancy becomes more common in both cloud and data center environments, the need for robust network virtualization technologies like VXLAN will rise, presenting a lucrative growth opportunity for vendors. The ability to isolate and manage traffic for multiple tenants efficiently will continue to push demand for VXLAN-enabled solutions and beyond.
Latest Trends
Increased Demand for Network Virtualization
The demand for network virtualization is projected to drive significant growth in the VXLAN market. As organizations continue their transition to cloud environments, the need for scalable, flexible, and cost-effective network solutions has intensified. VXLAN, which supports virtual network overlays and enhances scalability by expanding the available address space, is increasingly becoming the solution of choice for enterprises managing hybrid or multi-cloud architectures. The rise in demand for software-defined networking (SDN) solutions, coupled with VXLAN’s ability to enable seamless communication between on-premise data centers and cloud environments, is a key factor propelling this trend.
Healthcare Sector Dominance
The healthcare sector is expected to be a dominant player in the adoption of VXLAN technologies. The increasing need for secure, scalable, and high-performance network solutions in healthcare facilities is driving this trend. Healthcare organizations are increasingly leveraging VXLAN for its ability to isolate sensitive patient data through network segmentation, enhancing security protocols in compliance with regulatory standards such as HIPAA. Furthermore, the rise of telemedicine and the rapid digitalization of healthcare records necessitate robust, virtualized networking infrastructures, positioning VXLAN as a critical component in addressing the sector’s evolving needs.
Regional Analysis
North America dominates the VXLAN market with a 40% largest market share.
The Virtual Extensible LAN (VXLAN) market has seen substantial growth across various regions, with North America emerging as the dominant market. North America, driven by high adoption of advanced networking technologies and cloud computing, holds the largest market share, accounting for approximately 40% of the global VXLAN market. The presence of key industry players such as Cisco Systems, Arista Networks, and VMware, coupled with significant investments in data center expansion, drives market demand in this region. The increasing adoption of software-defined networking (SDN) solutions further supports the region’s dominance.
In Europe, the VXLAN market is experiencing steady growth due to the growing demand for advanced network infrastructure across industries such as healthcare, automotive, and BFSI (Banking, Financial Services, and Insurance). Government initiatives aimed at digital transformation are further fostering market expansion. Key markets within the region include Germany, the United Kingdom, and France.
The Asia-Pacific region is anticipated to witness the highest growth rate, driven by rapid digitization, increasing investments in IT infrastructure, and the expansion of data centers in countries such as China, India, and Japan. The region’s adoption of cloud-based solutions and IoT technologies is also expected to contribute to market growth.
The Middle East & Africa and Latin America regions are exhibiting moderate growth, primarily driven by rising cloud adoption and network infrastructure modernization efforts. However, these regions currently account for a smaller market share compared to North America and Europe, due to lower technological penetration and investment levels.
Key Regions and Countries
North America
- The US
- Canada
- Rest of North America
Europe
- Germany
- France
- The UK
- Spain
- Netherlands
- Russia
- Italy
- Rest of Europe
Asia-Pacific
- China
- Japan
- Singapore
- Thailand
- South Korea
- Vietnam
- India
- New Zealand
- Rest of Asia Pacific
Latin America
- Mexico
- Brazil
- Rest of Latin America
Middle East & Africa
- Saudi Arabia
- South Africa
- UAE
- Rest of the Middle East & Africa
Key Players Analysis
The global Virtual Extensible LAN (VXLAN) market is expected to witness significant growth, driven by increasing demand for scalable network solutions, cloud-based services, and the rising adoption of data center virtualization. Key players, such as Accenture plc, Arista Networks, Cisco Systems Inc., and VMware (Broadcom), are at the forefront of innovation and expansion in this space.
Cisco Systems Inc. holds a dominant position due to its robust VXLAN technology offerings, extensive customer base, and commitment to expanding its product portfolio. The company's integration of VXLAN within its SDN (Software-Defined Networking) solutions provides scalability and flexibility, catering to enterprise and cloud service providers.
Similarly, Arista Networks and VMware (Broadcom) leverage their expertise in networking and cloud environments, offering VXLAN-based solutions that enhance network segmentation and automation. VMware’s integration of VXLAN with its NSX platform for cloud networking has made it a crucial player in driving virtualized network infrastructures.
Fortinet Inc. and Palo Alto Networks, known for their cybersecurity solutions, are capitalizing on the demand for secure VXLAN deployments, especially within multi-cloud environments. Both companies are expected to play a pivotal role in addressing security concerns associated with large-scale VXLAN implementations.
Meanwhile, companies like Hewlett Packard Enterprise (HPE), Huawei Technologies Co., Ltd., and Juniper Networks are enhancing their VXLAN capabilities by focusing on next-gen data centers and cloud-based applications, reflecting their strategic focus on network scalability and performance.
Market Key Players
- Accenture plc
- Arista Networks
- Cisco Systems Inc.
- Extreme Networks Inc.
- Fortinet Inc.
- Hewlett Packard Enterprise (HPE)
- Huawei Technologies Co., Ltd.
- Juniper Networks
- Nokia Corporation
- Palo Alto Networks, Inc.
- VMware (Broadcom)
Recent Development
- In June 2024, Dell Technologies introduced a new suite of networking solutions that incorporate VXLAN to enhance edge computing deployments. These solutions are aimed at providing improved scalability and security for IoT and edge applications, which are becoming increasingly critical for modern enterprises. This development supports dynamic and flexible network segmentation, which is essential for managing distributed edge devices.
- In May 2024, Juniper Networks expanded its Junos OS support for VXLAN to improve interoperability in multi-cloud environments. This development enables enterprises to integrate various cloud providers more effectively while maintaining secure and scalable virtualized networks. The upgrade includes tools for managing VXLAN encapsulation and decapsulation, critical for optimizing cloud-native applications.
- In April 2024, Arista Networks announced new VXLAN support within its CloudVision platform. The company integrated enhanced features to simplify network automation and improve operational efficiency across multi-cloud infrastructures. These updates allow for seamless integration with existing network virtualization setups, providing more scalability for enterprise and service provider networks.
Report Scope
Report Features Description Market Value (2023) USD 1.7 Billion Forecast Revenue (2033) USD 6.9 Billion CAGR (2024-2032) 15.5% Base Year for Estimation 2023 Historic Period 2016-2023 Forecast Period 2024-2033 Report Coverage Revenue Forecast, Market Dynamics, COVID-19 Impact, Competitive Landscape, Recent Developments Segments Covered By Component (Hardware, Software, Services), By Enterprise Size (Large Enterprises, SMEs), By Application (Multi-tenancy, Workload mobility, Software-defined networking (SDN) overlays, Network Function Virtualization (NFV), Disaster Recovery, Others), By End User (BFSI, Healthcare, IT & Telecommunications, Government, Retail, Others) Regional Analysis North America - The US, Canada, Rest of North America, Europe - Germany, France, The UK, Spain, Italy, Russia, Netherlands, Rest of Europe, Asia-Pacific - China, Japan, South Korea, India, New Zealand, Singapore, Thailand, Vietnam, Rest of Asia Pacific, Latin America - Brazil, Mexico, Rest of Latin America, Middle East & Africa - South Africa, Saudi Arabia, UAE, Rest of Middle East & Africa Competitive Landscape Accenture plc, Arista Networks, Cisco Systems Inc., Extreme Networks Inc., Fortinet Inc., Hewlett Packard Enterprise (HPE), Huawei Technologies Co., Ltd., Juniper Networks, Nokia Corporation, Palo Alto Networks, Inc., VMware (Broadcom) Customization Scope Customization for segments, region/country-level will be provided. Moreover, additional customization can be done based on the requirements. Purchase Options We have three licenses to opt for Single User License, Multi-User License (Up to 5 Users), Corporate Use License (Unlimited User and Printable PDF) -
- 1. Executive Summary
- 1.1. Definition
- 1.2. Taxonomy
- 1.3. Research Scope
- 1.4. Key Analysis
- 1.5. Key Findings by Major Segments
- 1.6. Top strategies by Major Players
- 2. Global Virtual Extensible LAN (VXLAN) Market Overview
- 2.1. Virtual Extensible LAN (VXLAN) Market Dynamics
- 2.1.1. Drivers
- 2.1.2. Opportunities
- 2.1.3. Restraints
- 2.1.4. Challenges
- 2.2. Macro-economic Factors
- 2.3. Regulatory Framework
- 2.4. Market Investment Feasibility Index
- 2.5. PEST Analysis
- 2.6. PORTER’S Five Force Analysis
- 2.7. Drivers & Restraints Impact Analysis
- 2.8. Industry Chain Analysis
- 2.9. Cost Structure Analysis
- 2.10. Marketing Strategy
- 2.11. Russia-Ukraine War Impact Analysis
- 2.12. Opportunity Map Analysis
- 2.13. Market Competition Scenario Analysis
- 2.14. Product Life Cycle Analysis
- 2.15. Opportunity Orbits
- 2.16. Manufacturer Intensity Map
- 2.17. Major Companies sales by Value & Volume
- 2.1. Virtual Extensible LAN (VXLAN) Market Dynamics
- 3. Global Virtual Extensible LAN (VXLAN) Market Analysis, Opportunity and Forecast, 2016-2032
- 3.1. Global Virtual Extensible LAN (VXLAN) Market Analysis, 2016-2021
- 3.2. Global Virtual Extensible LAN (VXLAN) Market Opportunity and Forecast, 2023-2032
- 3.3. Global Virtual Extensible LAN (VXLAN) Market Analysis, Opportunity and Forecast, By Component, 2016-2032
- 3.3.1. Global Virtual Extensible LAN (VXLAN) Market Analysis by Component: Introduction
- 3.3.2. Market Size Absolute $ Opportunity Analysis and Forecast, By Component, 2016-2032
- 3.3.3. Hardware
- 3.3.4. Software
- 3.3.5. Services
- 3.4. Global Virtual Extensible LAN (VXLAN) Market Analysis, Opportunity and Forecast, By Enterprise Size, 2016-2032
- 3.4.1. Global Virtual Extensible LAN (VXLAN) Market Analysis by Enterprise Size: Introduction
- 3.4.2. Market Size Absolute $ Opportunity Analysis and Forecast, By Enterprise Size, 2016-2032
- 3.4.3. Large Enterprises
- 3.4.4. SMEs
- 3.5. Global Virtual Extensible LAN (VXLAN) Market Analysis, Opportunity and Forecast, By Application, 2016-2032
- 3.5.1. Global Virtual Extensible LAN (VXLAN) Market Analysis by Application: Introduction
- 3.5.2. Market Size Absolute $ Opportunity Analysis and Forecast, By Application, 2016-2032
- 3.5.3. Multi-tenancy
- 3.5.4. Workload mobility
- 3.5.5. Software-defined networking (SDN) overlays
- 3.5.6. Network Function Virtualization (NFV)
- 3.5.7. Disaster recovery
- 3.5.8. Others
- 3.6. Global Virtual Extensible LAN (VXLAN) Market Analysis, Opportunity and Forecast, By End User, 2016-2032
- 3.6.1. Global Virtual Extensible LAN (VXLAN) Market Analysis by End User: Introduction
- 3.6.2. Market Size Absolute $ Opportunity Analysis and Forecast, By End User, 2016-2032
- 3.6.3. BFSI
- 3.6.4. Healthcare
- 3.6.5. IT & Telecommunications
- 3.6.6. Government
- 3.6.7. Retail
- 3.6.8. Others
- 4. North America Virtual Extensible LAN (VXLAN) Market Analysis, Opportunity and Forecast, 2016-2032
- 4.1. North America Virtual Extensible LAN (VXLAN) Market Analysis, 2016-2021
- 4.2. North America Virtual Extensible LAN (VXLAN) Market Opportunity and Forecast, 2023-2032
- 4.3. North America Virtual Extensible LAN (VXLAN) Market Analysis, Opportunity and Forecast, By Component, 2016-2032
- 4.3.1. North America Virtual Extensible LAN (VXLAN) Market Analysis by Component: Introduction
- 4.3.2. Market Size Absolute $ Opportunity Analysis and Forecast, By Component, 2016-2032
- 4.3.3. Hardware
- 4.3.4. Software
- 4.3.5. Services
- 4.4. North America Virtual Extensible LAN (VXLAN) Market Analysis, Opportunity and Forecast, By Enterprise Size, 2016-2032
- 4.4.1. North America Virtual Extensible LAN (VXLAN) Market Analysis by Enterprise Size: Introduction
- 4.4.2. Market Size Absolute $ Opportunity Analysis and Forecast, By Enterprise Size, 2016-2032
- 4.4.3. Large Enterprises
- 4.4.4. SMEs
- 4.5. North America Virtual Extensible LAN (VXLAN) Market Analysis, Opportunity and Forecast, By Application, 2016-2032
- 4.5.1. North America Virtual Extensible LAN (VXLAN) Market Analysis by Application: Introduction
- 4.5.2. Market Size Absolute $ Opportunity Analysis and Forecast, By Application, 2016-2032
- 4.5.3. Multi-tenancy
- 4.5.4. Workload mobility
- 4.5.5. Software-defined networking (SDN) overlays
- 4.5.6. Network Function Virtualization (NFV)
- 4.5.7. Disaster recovery
- 4.5.8. Others
- 4.6. North America Virtual Extensible LAN (VXLAN) Market Analysis, Opportunity and Forecast, By End User, 2016-2032
- 4.6.1. North America Virtual Extensible LAN (VXLAN) Market Analysis by End User: Introduction
- 4.6.2. Market Size Absolute $ Opportunity Analysis and Forecast, By End User, 2016-2032
- 4.6.3. BFSI
- 4.6.4. Healthcare
- 4.6.5. IT & Telecommunications
- 4.6.6. Government
- 4.6.7. Retail
- 4.6.8. Others
- 4.7. North America Virtual Extensible LAN (VXLAN) Market Analysis, Opportunity and Forecast, By Country , 2016-2032
- 4.7.1. North America Virtual Extensible LAN (VXLAN) Market Analysis by Country : Introduction
- 4.7.2. Market Size Absolute $ Opportunity Analysis and Forecast, Country , 2016-2032
- 4.7.2.1. The US
- 4.7.2.2. Canada
- 4.7.2.3. Mexico
- 5. Western Europe Virtual Extensible LAN (VXLAN) Market Analysis, Opportunity and Forecast, 2016-2032
- 5.1. Western Europe Virtual Extensible LAN (VXLAN) Market Analysis, 2016-2021
- 5.2. Western Europe Virtual Extensible LAN (VXLAN) Market Opportunity and Forecast, 2023-2032
- 5.3. Western Europe Virtual Extensible LAN (VXLAN) Market Analysis, Opportunity and Forecast, By Component, 2016-2032
- 5.3.1. Western Europe Virtual Extensible LAN (VXLAN) Market Analysis by Component: Introduction
- 5.3.2. Market Size Absolute $ Opportunity Analysis and Forecast, By Component, 2016-2032
- 5.3.3. Hardware
- 5.3.4. Software
- 5.3.5. Services
- 5.4. Western Europe Virtual Extensible LAN (VXLAN) Market Analysis, Opportunity and Forecast, By Enterprise Size, 2016-2032
- 5.4.1. Western Europe Virtual Extensible LAN (VXLAN) Market Analysis by Enterprise Size: Introduction
- 5.4.2. Market Size Absolute $ Opportunity Analysis and Forecast, By Enterprise Size, 2016-2032
- 5.4.3. Large Enterprises
- 5.4.4. SMEs
- 5.5. Western Europe Virtual Extensible LAN (VXLAN) Market Analysis, Opportunity and Forecast, By Application, 2016-2032
- 5.5.1. Western Europe Virtual Extensible LAN (VXLAN) Market Analysis by Application: Introduction
- 5.5.2. Market Size Absolute $ Opportunity Analysis and Forecast, By Application, 2016-2032
- 5.5.3. Multi-tenancy
- 5.5.4. Workload mobility
- 5.5.5. Software-defined networking (SDN) overlays
- 5.5.6. Network Function Virtualization (NFV)
- 5.5.7. Disaster recovery
- 5.5.8. Others
- 5.6. Western Europe Virtual Extensible LAN (VXLAN) Market Analysis, Opportunity and Forecast, By End User, 2016-2032
- 5.6.1. Western Europe Virtual Extensible LAN (VXLAN) Market Analysis by End User: Introduction
- 5.6.2. Market Size Absolute $ Opportunity Analysis and Forecast, By End User, 2016-2032
- 5.6.3. BFSI
- 5.6.4. Healthcare
- 5.6.5. IT & Telecommunications
- 5.6.6. Government
- 5.6.7. Retail
- 5.6.8. Others
- 5.7. Western Europe Virtual Extensible LAN (VXLAN) Market Analysis, Opportunity and Forecast, By Country , 2016-2032
- 5.7.1. Western Europe Virtual Extensible LAN (VXLAN) Market Analysis by Country : Introduction
- 5.7.2. Market Size Absolute $ Opportunity Analysis and Forecast, Country , 2016-2032
- 5.7.2.1. Germany
- 5.7.2.2. France
- 5.7.2.3. The UK
- 5.7.2.4. Spain
- 5.7.2.5. Italy
- 5.7.2.6. Portugal
- 5.7.2.7. Ireland
- 5.7.2.8. Austria
- 5.7.2.9. Switzerland
- 5.7.2.10. Benelux
- 5.7.2.11. Nordic
- 5.7.2.12. Rest of Western Europe
- 6. Eastern Europe Virtual Extensible LAN (VXLAN) Market Analysis, Opportunity and Forecast, 2016-2032
- 6.1. Eastern Europe Virtual Extensible LAN (VXLAN) Market Analysis, 2016-2021
- 6.2. Eastern Europe Virtual Extensible LAN (VXLAN) Market Opportunity and Forecast, 2023-2032
- 6.3. Eastern Europe Virtual Extensible LAN (VXLAN) Market Analysis, Opportunity and Forecast, By Component, 2016-2032
- 6.3.1. Eastern Europe Virtual Extensible LAN (VXLAN) Market Analysis by Component: Introduction
- 6.3.2. Market Size Absolute $ Opportunity Analysis and Forecast, By Component, 2016-2032
- 6.3.3. Hardware
- 6.3.4. Software
- 6.3.5. Services
- 6.4. Eastern Europe Virtual Extensible LAN (VXLAN) Market Analysis, Opportunity and Forecast, By Enterprise Size, 2016-2032
- 6.4.1. Eastern Europe Virtual Extensible LAN (VXLAN) Market Analysis by Enterprise Size: Introduction
- 6.4.2. Market Size Absolute $ Opportunity Analysis and Forecast, By Enterprise Size, 2016-2032
- 6.4.3. Large Enterprises
- 6.4.4. SMEs
- 6.5. Eastern Europe Virtual Extensible LAN (VXLAN) Market Analysis, Opportunity and Forecast, By Application, 2016-2032
- 6.5.1. Eastern Europe Virtual Extensible LAN (VXLAN) Market Analysis by Application: Introduction
- 6.5.2. Market Size Absolute $ Opportunity Analysis and Forecast, By Application, 2016-2032
- 6.5.3. Multi-tenancy
- 6.5.4. Workload mobility
- 6.5.5. Software-defined networking (SDN) overlays
- 6.5.6. Network Function Virtualization (NFV)
- 6.5.7. Disaster recovery
- 6.5.8. Others
- 6.6. Eastern Europe Virtual Extensible LAN (VXLAN) Market Analysis, Opportunity and Forecast, By End User, 2016-2032
- 6.6.1. Eastern Europe Virtual Extensible LAN (VXLAN) Market Analysis by End User: Introduction
- 6.6.2. Market Size Absolute $ Opportunity Analysis and Forecast, By End User, 2016-2032
- 6.6.3. BFSI
- 6.6.4. Healthcare
- 6.6.5. IT & Telecommunications
- 6.6.6. Government
- 6.6.7. Retail
- 6.6.8. Others
- 6.7. Eastern Europe Virtual Extensible LAN (VXLAN) Market Analysis, Opportunity and Forecast, By Country , 2016-2032
- 6.7.1. Eastern Europe Virtual Extensible LAN (VXLAN) Market Analysis by Country : Introduction
- 6.7.2. Market Size Absolute $ Opportunity Analysis and Forecast, Country , 2016-2032
- 6.7.2.1. Russia
- 6.7.2.2. Poland
- 6.7.2.3. The Czech Republic
- 6.7.2.4. Greece
- 6.7.2.5. Rest of Eastern Europe
- 7. APAC Virtual Extensible LAN (VXLAN) Market Analysis, Opportunity and Forecast, 2016-2032
- 7.1. APAC Virtual Extensible LAN (VXLAN) Market Analysis, 2016-2021
- 7.2. APAC Virtual Extensible LAN (VXLAN) Market Opportunity and Forecast, 2023-2032
- 7.3. APAC Virtual Extensible LAN (VXLAN) Market Analysis, Opportunity and Forecast, By Component, 2016-2032
- 7.3.1. APAC Virtual Extensible LAN (VXLAN) Market Analysis by Component: Introduction
- 7.3.2. Market Size Absolute $ Opportunity Analysis and Forecast, By Component, 2016-2032
- 7.3.3. Hardware
- 7.3.4. Software
- 7.3.5. Services
- 7.4. APAC Virtual Extensible LAN (VXLAN) Market Analysis, Opportunity and Forecast, By Enterprise Size, 2016-2032
- 7.4.1. APAC Virtual Extensible LAN (VXLAN) Market Analysis by Enterprise Size: Introduction
- 7.4.2. Market Size Absolute $ Opportunity Analysis and Forecast, By Enterprise Size, 2016-2032
- 7.4.3. Large Enterprises
- 7.4.4. SMEs
- 7.5. APAC Virtual Extensible LAN (VXLAN) Market Analysis, Opportunity and Forecast, By Application, 2016-2032
- 7.5.1. APAC Virtual Extensible LAN (VXLAN) Market Analysis by Application: Introduction
- 7.5.2. Market Size Absolute $ Opportunity Analysis and Forecast, By Application, 2016-2032
- 7.5.3. Multi-tenancy
- 7.5.4. Workload mobility
- 7.5.5. Software-defined networking (SDN) overlays
- 7.5.6. Network Function Virtualization (NFV)
- 7.5.7. Disaster recovery
- 7.5.8. Others
- 7.6. APAC Virtual Extensible LAN (VXLAN) Market Analysis, Opportunity and Forecast, By End User, 2016-2032
- 7.6.1. APAC Virtual Extensible LAN (VXLAN) Market Analysis by End User: Introduction
- 7.6.2. Market Size Absolute $ Opportunity Analysis and Forecast, By End User, 2016-2032
- 7.6.3. BFSI
- 7.6.4. Healthcare
- 7.6.5. IT & Telecommunications
- 7.6.6. Government
- 7.6.7. Retail
- 7.6.8. Others
- 7.7. APAC Virtual Extensible LAN (VXLAN) Market Analysis, Opportunity and Forecast, By Country , 2016-2032
- 7.7.1. APAC Virtual Extensible LAN (VXLAN) Market Analysis by Country : Introduction
- 7.7.2. Market Size Absolute $ Opportunity Analysis and Forecast, Country , 2016-2032
- 7.7.2.1. China
- 7.7.2.2. Japan
- 7.7.2.3. South Korea
- 7.7.2.4. India
- 7.7.2.5. Australia & New Zeland
- 7.7.2.6. Indonesia
- 7.7.2.7. Malaysia
- 7.7.2.8. Philippines
- 7.7.2.9. Singapore
- 7.7.2.10. Thailand
- 7.7.2.11. Vietnam
- 7.7.2.12. Rest of APAC
- 8. Latin America Virtual Extensible LAN (VXLAN) Market Analysis, Opportunity and Forecast, 2016-2032
- 8.1. Latin America Virtual Extensible LAN (VXLAN) Market Analysis, 2016-2021
- 8.2. Latin America Virtual Extensible LAN (VXLAN) Market Opportunity and Forecast, 2023-2032
- 8.3. Latin America Virtual Extensible LAN (VXLAN) Market Analysis, Opportunity and Forecast, By Component, 2016-2032
- 8.3.1. Latin America Virtual Extensible LAN (VXLAN) Market Analysis by Component: Introduction
- 8.3.2. Market Size Absolute $ Opportunity Analysis and Forecast, By Component, 2016-2032
- 8.3.3. Hardware
- 8.3.4. Software
- 8.3.5. Services
- 8.4. Latin America Virtual Extensible LAN (VXLAN) Market Analysis, Opportunity and Forecast, By Enterprise Size, 2016-2032
- 8.4.1. Latin America Virtual Extensible LAN (VXLAN) Market Analysis by Enterprise Size: Introduction
- 8.4.2. Market Size Absolute $ Opportunity Analysis and Forecast, By Enterprise Size, 2016-2032
- 8.4.3. Large Enterprises
- 8.4.4. SMEs
- 8.5. Latin America Virtual Extensible LAN (VXLAN) Market Analysis, Opportunity and Forecast, By Application, 2016-2032
- 8.5.1. Latin America Virtual Extensible LAN (VXLAN) Market Analysis by Application: Introduction
- 8.5.2. Market Size Absolute $ Opportunity Analysis and Forecast, By Application, 2016-2032
- 8.5.3. Multi-tenancy
- 8.5.4. Workload mobility
- 8.5.5. Software-defined networking (SDN) overlays
- 8.5.6. Network Function Virtualization (NFV)
- 8.5.7. Disaster recovery
- 8.5.8. Others
- 8.6. Latin America Virtual Extensible LAN (VXLAN) Market Analysis, Opportunity and Forecast, By End User, 2016-2032
- 8.6.1. Latin America Virtual Extensible LAN (VXLAN) Market Analysis by End User: Introduction
- 8.6.2. Market Size Absolute $ Opportunity Analysis and Forecast, By End User, 2016-2032
- 8.6.3. BFSI
- 8.6.4. Healthcare
- 8.6.5. IT & Telecommunications
- 8.6.6. Government
- 8.6.7. Retail
- 8.6.8. Others
- 8.7. Latin America Virtual Extensible LAN (VXLAN) Market Analysis, Opportunity and Forecast, By Country , 2016-2032
- 8.7.1. Latin America Virtual Extensible LAN (VXLAN) Market Analysis by Country : Introduction
- 8.7.2. Market Size Absolute $ Opportunity Analysis and Forecast, Country , 2016-2032
- 8.7.2.1. Brazil
- 8.7.2.2. Colombia
- 8.7.2.3. Chile
- 8.7.2.4. Argentina
- 8.7.2.5. Costa Rica
- 8.7.2.6. Rest of Latin America
- 9. Middle East & Africa Virtual Extensible LAN (VXLAN) Market Analysis, Opportunity and Forecast, 2016-2032
- 9.1. Middle East & Africa Virtual Extensible LAN (VXLAN) Market Analysis, 2016-2021
- 9.2. Middle East & Africa Virtual Extensible LAN (VXLAN) Market Opportunity and Forecast, 2023-2032
- 9.3. Middle East & Africa Virtual Extensible LAN (VXLAN) Market Analysis, Opportunity and Forecast, By Component, 2016-2032
- 9.3.1. Middle East & Africa Virtual Extensible LAN (VXLAN) Market Analysis by Component: Introduction
- 9.3.2. Market Size Absolute $ Opportunity Analysis and Forecast, By Component, 2016-2032
- 9.3.3. Hardware
- 9.3.4. Software
- 9.3.5. Services
- 9.4. Middle East & Africa Virtual Extensible LAN (VXLAN) Market Analysis, Opportunity and Forecast, By Enterprise Size, 2016-2032
- 9.4.1. Middle East & Africa Virtual Extensible LAN (VXLAN) Market Analysis by Enterprise Size: Introduction
- 9.4.2. Market Size Absolute $ Opportunity Analysis and Forecast, By Enterprise Size, 2016-2032
- 9.4.3. Large Enterprises
- 9.4.4. SMEs
- 9.5. Middle East & Africa Virtual Extensible LAN (VXLAN) Market Analysis, Opportunity and Forecast, By Application, 2016-2032
- 9.5.1. Middle East & Africa Virtual Extensible LAN (VXLAN) Market Analysis by Application: Introduction
- 9.5.2. Market Size Absolute $ Opportunity Analysis and Forecast, By Application, 2016-2032
- 9.5.3. Multi-tenancy
- 9.5.4. Workload mobility
- 9.5.5. Software-defined networking (SDN) overlays
- 9.5.6. Network Function Virtualization (NFV)
- 9.5.7. Disaster recovery
- 9.5.8. Others
- 9.6. Middle East & Africa Virtual Extensible LAN (VXLAN) Market Analysis, Opportunity and Forecast, By End User, 2016-2032
- 9.6.1. Middle East & Africa Virtual Extensible LAN (VXLAN) Market Analysis by End User: Introduction
- 9.6.2. Market Size Absolute $ Opportunity Analysis and Forecast, By End User, 2016-2032
- 9.6.3. BFSI
- 9.6.4. Healthcare
- 9.6.5. IT & Telecommunications
- 9.6.6. Government
- 9.6.7. Retail
- 9.6.8. Others
- 9.7. Middle East & Africa Virtual Extensible LAN (VXLAN) Market Analysis, Opportunity and Forecast, By Country , 2016-2032
- 9.7.1. Middle East & Africa Virtual Extensible LAN (VXLAN) Market Analysis by Country : Introduction
- 9.7.2. Market Size Absolute $ Opportunity Analysis and Forecast, Country , 2016-2032
- 9.7.2.1. Algeria
- 9.7.2.2. Egypt
- 9.7.2.3. Israel
- 9.7.2.4. Kuwait
- 9.7.2.5. Nigeria
- 9.7.2.6. Saudi Arabia
- 9.7.2.7. South Africa
- 9.7.2.8. Turkey
- 9.7.2.9. The UAE
- 9.7.2.10. Rest of MEA
- 10. Global Virtual Extensible LAN (VXLAN) Market Analysis, Opportunity and Forecast, By Region , 2016-2032
- 10.1. Global Virtual Extensible LAN (VXLAN) Market Analysis by Region : Introduction
- 10.2. Market Size Absolute $ Opportunity Analysis and Forecast, By Region , 2016-2032
- 10.2.1. North America
- 10.2.2. Western Europe
- 10.2.3. Eastern Europe
- 10.2.4. APAC
- 10.2.5. Latin America
- 10.2.6. Middle East & Africa
- 11. Global Virtual Extensible LAN (VXLAN) Market Competitive Landscape, Market Share Analysis, and Company Profiles
- 11.1. Market Share Analysis
- 11.2. Company Profiles
- 11.3. Accenture plc
- 11.3.1. Company Overview
- 11.3.2. Financial Highlights
- 11.3.3. Product Portfolio
- 11.3.4. SWOT Analysis
- 11.3.5. Key Strategies and Developments
- 11.4. Arista Networks
- 11.4.1. Company Overview
- 11.4.2. Financial Highlights
- 11.4.3. Product Portfolio
- 11.4.4. SWOT Analysis
- 11.4.5. Key Strategies and Developments
- 11.5. Cisco Systems Inc.
- 11.5.1. Company Overview
- 11.5.2. Financial Highlights
- 11.5.3. Product Portfolio
- 11.5.4. SWOT Analysis
- 11.5.5. Key Strategies and Developments
- 11.6. Extreme Networks Inc.
- 11.6.1. Company Overview
- 11.6.2. Financial Highlights
- 11.6.3. Product Portfolio
- 11.6.4. SWOT Analysis
- 11.6.5. Key Strategies and Developments
- 11.7. Fortinet Inc.
- 11.7.1. Company Overview
- 11.7.2. Financial Highlights
- 11.7.3. Product Portfolio
- 11.7.4. SWOT Analysis
- 11.7.5. Key Strategies and Developments
- 11.8. Hewlett Packard Enterprise (HPE)
- 11.8.1. Company Overview
- 11.8.2. Financial Highlights
- 11.8.3. Product Portfolio
- 11.8.4. SWOT Analysis
- 11.8.5. Key Strategies and Developments
- 11.9. Huawei Technologies Co., Ltd.
- 11.9.1. Company Overview
- 11.9.2. Financial Highlights
- 11.9.3. Product Portfolio
- 11.9.4. SWOT Analysis
- 11.9.5. Key Strategies and Developments
- 11.10. Juniper Networks
- 11.10.1. Company Overview
- 11.10.2. Financial Highlights
- 11.10.3. Product Portfolio
- 11.10.4. SWOT Analysis
- 11.10.5. Key Strategies and Developments
- 11.11. Nokia Corporation
- 11.11.1. Company Overview
- 11.11.2. Financial Highlights
- 11.11.3. Product Portfolio
- 11.11.4. SWOT Analysis
- 11.11.5. Key Strategies and Developments
- 11.12. Palo Alto Networks, Inc.
- 11.12.1. Company Overview
- 11.12.2. Financial Highlights
- 11.12.3. Product Portfolio
- 11.12.4. SWOT Analysis
- 11.12.5. Key Strategies and Developments
- 11.13.1. Company Overview
- 11.13.2. Financial Highlights
- 11.13.3. Product Portfolio
- 11.13.4. SWOT Analysis
- 11.13.5. Key Strategies and Developments
- 11.14. VMware (Broadcom)
- 11.14.1. Company Overview
- 11.14.2. Financial Highlights
- 11.14.3. Product Portfolio
- 11.14.4. SWOT Analysis
- 11.14.5. Key Strategies and Developments
- 12. Assumptions and Acronyms
- 13. Research Methodology
- 14. Contact
"
- List of Figures
- "
- Figure 1: Global Virtual Extensible LAN (VXLAN) Market Revenue (US$ Mn) Market Share by Component in 2022
- Figure 2: Global Virtual Extensible LAN (VXLAN) Market Market Attractiveness Analysis by Component, 2016-2032
- Figure 3: Global Virtual Extensible LAN (VXLAN) Market Revenue (US$ Mn) Market Share by Enterprise Sizein 2022
- Figure 4: Global Virtual Extensible LAN (VXLAN) Market Market Attractiveness Analysis by Enterprise Size, 2016-2032
- Figure 5: Global Virtual Extensible LAN (VXLAN) Market Revenue (US$ Mn) Market Share by Applicationin 2022
- Figure 6: Global Virtual Extensible LAN (VXLAN) Market Market Attractiveness Analysis by Application, 2016-2032
- Figure 7: Global Virtual Extensible LAN (VXLAN) Market Revenue (US$ Mn) Market Share by End Userin 2022
- Figure 8: Global Virtual Extensible LAN (VXLAN) Market Market Attractiveness Analysis by End User, 2016-2032
- Figure 9: Global Virtual Extensible LAN (VXLAN) Market Revenue (US$ Mn) Market Share by Region in 2022
- Figure 10: Global Virtual Extensible LAN (VXLAN) Market Market Attractiveness Analysis by Region, 2016-2032
- Figure 11: Global Virtual Extensible LAN (VXLAN) Market Market Revenue (US$ Mn) (2016-2032)
- Figure 12: Global Virtual Extensible LAN (VXLAN) Market Market Revenue (US$ Mn) Comparison by Region (2016-2032)
- Figure 13: Global Virtual Extensible LAN (VXLAN) Market Market Revenue (US$ Mn) Comparison by Component (2016-2032)
- Figure 14: Global Virtual Extensible LAN (VXLAN) Market Market Revenue (US$ Mn) Comparison by Enterprise Size (2016-2032)
- Figure 15: Global Virtual Extensible LAN (VXLAN) Market Market Revenue (US$ Mn) Comparison by Application (2016-2032)
- Figure 16: Global Virtual Extensible LAN (VXLAN) Market Market Revenue (US$ Mn) Comparison by End User (2016-2032)
- Figure 17: Global Virtual Extensible LAN (VXLAN) Market Market Y-o-Y Growth Rate Comparison by Region (2016-2032)
- Figure 18: Global Virtual Extensible LAN (VXLAN) Market Market Y-o-Y Growth Rate Comparison by Component (2016-2032)
- Figure 19: Global Virtual Extensible LAN (VXLAN) Market Market Y-o-Y Growth Rate Comparison by Enterprise Size (2016-2032)
- Figure 20: Global Virtual Extensible LAN (VXLAN) Market Market Y-o-Y Growth Rate Comparison by Application (2016-2032)
- Figure 21: Global Virtual Extensible LAN (VXLAN) Market Market Y-o-Y Growth Rate Comparison by End User (2016-2032)
- Figure 22: Global Virtual Extensible LAN (VXLAN) Market Market Share Comparison by Region (2016-2032)
- Figure 23: Global Virtual Extensible LAN (VXLAN) Market Market Share Comparison by Component (2016-2032)
- Figure 24: Global Virtual Extensible LAN (VXLAN) Market Market Share Comparison by Enterprise Size (2016-2032)
- Figure 25: Global Virtual Extensible LAN (VXLAN) Market Market Share Comparison by Application (2016-2032)
- Figure 26: Global Virtual Extensible LAN (VXLAN) Market Market Share Comparison by End User (2016-2032)
- Figure 27: North America Virtual Extensible LAN (VXLAN) Market Revenue (US$ Mn) Market Share by Componentin 2022
- Figure 28: North America Virtual Extensible LAN (VXLAN) Market Market Attractiveness Analysis by Component, 2016-2032
- Figure 29: North America Virtual Extensible LAN (VXLAN) Market Revenue (US$ Mn) Market Share by Enterprise Sizein 2022
- Figure 30: North America Virtual Extensible LAN (VXLAN) Market Market Attractiveness Analysis by Enterprise Size, 2016-2032
- Figure 31: North America Virtual Extensible LAN (VXLAN) Market Revenue (US$ Mn) Market Share by Applicationin 2022
- Figure 32: North America Virtual Extensible LAN (VXLAN) Market Market Attractiveness Analysis by Application, 2016-2032
- Figure 33: North America Virtual Extensible LAN (VXLAN) Market Revenue (US$ Mn) Market Share by End Userin 2022
- Figure 34: North America Virtual Extensible LAN (VXLAN) Market Market Attractiveness Analysis by End User, 2016-2032
- Figure 35: North America Virtual Extensible LAN (VXLAN) Market Revenue (US$ Mn) Market Share by Country in 2022
- Figure 36: North America Virtual Extensible LAN (VXLAN) Market Market Attractiveness Analysis by Country, 2016-2032
- Figure 37: North America Virtual Extensible LAN (VXLAN) Market Market Revenue (US$ Mn) (2016-2032)
- Figure 38: North America Virtual Extensible LAN (VXLAN) Market Market Revenue (US$ Mn) Comparison by Country (2016-2032)
- Figure 39: North America Virtual Extensible LAN (VXLAN) Market Market Revenue (US$ Mn) Comparison by Component (2016-2032)
- Figure 40: North America Virtual Extensible LAN (VXLAN) Market Market Revenue (US$ Mn) Comparison by Enterprise Size (2016-2032)
- Figure 41: North America Virtual Extensible LAN (VXLAN) Market Market Revenue (US$ Mn) Comparison by Application (2016-2032)
- Figure 42: North America Virtual Extensible LAN (VXLAN) Market Market Revenue (US$ Mn) Comparison by End User (2016-2032)
- Figure 43: North America Virtual Extensible LAN (VXLAN) Market Market Y-o-Y Growth Rate Comparison by Country (2016-2032)
- Figure 44: North America Virtual Extensible LAN (VXLAN) Market Market Y-o-Y Growth Rate Comparison by Component (2016-2032)
- Figure 45: North America Virtual Extensible LAN (VXLAN) Market Market Y-o-Y Growth Rate Comparison by Enterprise Size (2016-2032)
- Figure 46: North America Virtual Extensible LAN (VXLAN) Market Market Y-o-Y Growth Rate Comparison by Application (2016-2032)
- Figure 47: North America Virtual Extensible LAN (VXLAN) Market Market Y-o-Y Growth Rate Comparison by End User (2016-2032)
- Figure 48: North America Virtual Extensible LAN (VXLAN) Market Market Share Comparison by Country (2016-2032)
- Figure 49: North America Virtual Extensible LAN (VXLAN) Market Market Share Comparison by Component (2016-2032)
- Figure 50: North America Virtual Extensible LAN (VXLAN) Market Market Share Comparison by Enterprise Size (2016-2032)
- Figure 51: North America Virtual Extensible LAN (VXLAN) Market Market Share Comparison by Application (2016-2032)
- Figure 52: North America Virtual Extensible LAN (VXLAN) Market Market Share Comparison by End User (2016-2032)
- Figure 53: Western Europe Virtual Extensible LAN (VXLAN) Market Revenue (US$ Mn) Market Share by Componentin 2022
- Figure 54: Western Europe Virtual Extensible LAN (VXLAN) Market Market Attractiveness Analysis by Component, 2016-2032
- Figure 55: Western Europe Virtual Extensible LAN (VXLAN) Market Revenue (US$ Mn) Market Share by Enterprise Sizein 2022
- Figure 56: Western Europe Virtual Extensible LAN (VXLAN) Market Market Attractiveness Analysis by Enterprise Size, 2016-2032
- Figure 57: Western Europe Virtual Extensible LAN (VXLAN) Market Revenue (US$ Mn) Market Share by Applicationin 2022
- Figure 58: Western Europe Virtual Extensible LAN (VXLAN) Market Market Attractiveness Analysis by Application, 2016-2032
- Figure 59: Western Europe Virtual Extensible LAN (VXLAN) Market Revenue (US$ Mn) Market Share by End Userin 2022
- Figure 60: Western Europe Virtual Extensible LAN (VXLAN) Market Market Attractiveness Analysis by End User, 2016-2032
- Figure 61: Western Europe Virtual Extensible LAN (VXLAN) Market Revenue (US$ Mn) Market Share by Country in 2022
- Figure 62: Western Europe Virtual Extensible LAN (VXLAN) Market Market Attractiveness Analysis by Country, 2016-2032
- Figure 63: Western Europe Virtual Extensible LAN (VXLAN) Market Market Revenue (US$ Mn) (2016-2032)
- Figure 64: Western Europe Virtual Extensible LAN (VXLAN) Market Market Revenue (US$ Mn) Comparison by Country (2016-2032)
- Figure 65: Western Europe Virtual Extensible LAN (VXLAN) Market Market Revenue (US$ Mn) Comparison by Component (2016-2032)
- Figure 66: Western Europe Virtual Extensible LAN (VXLAN) Market Market Revenue (US$ Mn) Comparison by Enterprise Size (2016-2032)
- Figure 67: Western Europe Virtual Extensible LAN (VXLAN) Market Market Revenue (US$ Mn) Comparison by Application (2016-2032)
- Figure 68: Western Europe Virtual Extensible LAN (VXLAN) Market Market Revenue (US$ Mn) Comparison by End User (2016-2032)
- Figure 69: Western Europe Virtual Extensible LAN (VXLAN) Market Market Y-o-Y Growth Rate Comparison by Country (2016-2032)
- Figure 70: Western Europe Virtual Extensible LAN (VXLAN) Market Market Y-o-Y Growth Rate Comparison by Component (2016-2032)
- Figure 71: Western Europe Virtual Extensible LAN (VXLAN) Market Market Y-o-Y Growth Rate Comparison by Enterprise Size (2016-2032)
- Figure 72: Western Europe Virtual Extensible LAN (VXLAN) Market Market Y-o-Y Growth Rate Comparison by Application (2016-2032)
- Figure 73: Western Europe Virtual Extensible LAN (VXLAN) Market Market Y-o-Y Growth Rate Comparison by End User (2016-2032)
- Figure 74: Western Europe Virtual Extensible LAN (VXLAN) Market Market Share Comparison by Country (2016-2032)
- Figure 75: Western Europe Virtual Extensible LAN (VXLAN) Market Market Share Comparison by Component (2016-2032)
- Figure 76: Western Europe Virtual Extensible LAN (VXLAN) Market Market Share Comparison by Enterprise Size (2016-2032)
- Figure 77: Western Europe Virtual Extensible LAN (VXLAN) Market Market Share Comparison by Application (2016-2032)
- Figure 78: Western Europe Virtual Extensible LAN (VXLAN) Market Market Share Comparison by End User (2016-2032)
- Figure 79: Eastern Europe Virtual Extensible LAN (VXLAN) Market Revenue (US$ Mn) Market Share by Componentin 2022
- Figure 80: Eastern Europe Virtual Extensible LAN (VXLAN) Market Market Attractiveness Analysis by Component, 2016-2032
- Figure 81: Eastern Europe Virtual Extensible LAN (VXLAN) Market Revenue (US$ Mn) Market Share by Enterprise Sizein 2022
- Figure 82: Eastern Europe Virtual Extensible LAN (VXLAN) Market Market Attractiveness Analysis by Enterprise Size, 2016-2032
- Figure 83: Eastern Europe Virtual Extensible LAN (VXLAN) Market Revenue (US$ Mn) Market Share by Applicationin 2022
- Figure 84: Eastern Europe Virtual Extensible LAN (VXLAN) Market Market Attractiveness Analysis by Application, 2016-2032
- Figure 85: Eastern Europe Virtual Extensible LAN (VXLAN) Market Revenue (US$ Mn) Market Share by End Userin 2022
- Figure 86: Eastern Europe Virtual Extensible LAN (VXLAN) Market Market Attractiveness Analysis by End User, 2016-2032
- Figure 87: Eastern Europe Virtual Extensible LAN (VXLAN) Market Revenue (US$ Mn) Market Share by Country in 2022
- Figure 88: Eastern Europe Virtual Extensible LAN (VXLAN) Market Market Attractiveness Analysis by Country, 2016-2032
- Figure 89: Eastern Europe Virtual Extensible LAN (VXLAN) Market Market Revenue (US$ Mn) (2016-2032)
- Figure 90: Eastern Europe Virtual Extensible LAN (VXLAN) Market Market Revenue (US$ Mn) Comparison by Country (2016-2032)
- Figure 91: Eastern Europe Virtual Extensible LAN (VXLAN) Market Market Revenue (US$ Mn) Comparison by Component (2016-2032)
- Figure 92: Eastern Europe Virtual Extensible LAN (VXLAN) Market Market Revenue (US$ Mn) Comparison by Enterprise Size (2016-2032)
- Figure 93: Eastern Europe Virtual Extensible LAN (VXLAN) Market Market Revenue (US$ Mn) Comparison by Application (2016-2032)
- Figure 94: Eastern Europe Virtual Extensible LAN (VXLAN) Market Market Revenue (US$ Mn) Comparison by End User (2016-2032)
- Figure 95: Eastern Europe Virtual Extensible LAN (VXLAN) Market Market Y-o-Y Growth Rate Comparison by Country (2016-2032)
- Figure 96: Eastern Europe Virtual Extensible LAN (VXLAN) Market Market Y-o-Y Growth Rate Comparison by Component (2016-2032)
- Figure 97: Eastern Europe Virtual Extensible LAN (VXLAN) Market Market Y-o-Y Growth Rate Comparison by Enterprise Size (2016-2032)
- Figure 98: Eastern Europe Virtual Extensible LAN (VXLAN) Market Market Y-o-Y Growth Rate Comparison by Application (2016-2032)
- Figure 99: Eastern Europe Virtual Extensible LAN (VXLAN) Market Market Y-o-Y Growth Rate Comparison by End User (2016-2032)
- Figure 100: Eastern Europe Virtual Extensible LAN (VXLAN) Market Market Share Comparison by Country (2016-2032)
- Figure 101: Eastern Europe Virtual Extensible LAN (VXLAN) Market Market Share Comparison by Component (2016-2032)
- Figure 102: Eastern Europe Virtual Extensible LAN (VXLAN) Market Market Share Comparison by Enterprise Size (2016-2032)
- Figure 103: Eastern Europe Virtual Extensible LAN (VXLAN) Market Market Share Comparison by Application (2016-2032)
- Figure 104: Eastern Europe Virtual Extensible LAN (VXLAN) Market Market Share Comparison by End User (2016-2032)
- Figure 105: APAC Virtual Extensible LAN (VXLAN) Market Revenue (US$ Mn) Market Share by Componentin 2022
- Figure 106: APAC Virtual Extensible LAN (VXLAN) Market Market Attractiveness Analysis by Component, 2016-2032
- Figure 107: APAC Virtual Extensible LAN (VXLAN) Market Revenue (US$ Mn) Market Share by Enterprise Sizein 2022
- Figure 108: APAC Virtual Extensible LAN (VXLAN) Market Market Attractiveness Analysis by Enterprise Size, 2016-2032
- Figure 109: APAC Virtual Extensible LAN (VXLAN) Market Revenue (US$ Mn) Market Share by Applicationin 2022
- Figure 110: APAC Virtual Extensible LAN (VXLAN) Market Market Attractiveness Analysis by Application, 2016-2032
- Figure 111: APAC Virtual Extensible LAN (VXLAN) Market Revenue (US$ Mn) Market Share by End Userin 2022
- Figure 112: APAC Virtual Extensible LAN (VXLAN) Market Market Attractiveness Analysis by End User, 2016-2032
- Figure 113: APAC Virtual Extensible LAN (VXLAN) Market Revenue (US$ Mn) Market Share by Country in 2022
- Figure 114: APAC Virtual Extensible LAN (VXLAN) Market Market Attractiveness Analysis by Country, 2016-2032
- Figure 115: APAC Virtual Extensible LAN (VXLAN) Market Market Revenue (US$ Mn) (2016-2032)
- Figure 116: APAC Virtual Extensible LAN (VXLAN) Market Market Revenue (US$ Mn) Comparison by Country (2016-2032)
- Figure 117: APAC Virtual Extensible LAN (VXLAN) Market Market Revenue (US$ Mn) Comparison by Component (2016-2032)
- Figure 118: APAC Virtual Extensible LAN (VXLAN) Market Market Revenue (US$ Mn) Comparison by Enterprise Size (2016-2032)
- Figure 119: APAC Virtual Extensible LAN (VXLAN) Market Market Revenue (US$ Mn) Comparison by Application (2016-2032)
- Figure 120: APAC Virtual Extensible LAN (VXLAN) Market Market Revenue (US$ Mn) Comparison by End User (2016-2032)
- Figure 121: APAC Virtual Extensible LAN (VXLAN) Market Market Y-o-Y Growth Rate Comparison by Country (2016-2032)
- Figure 122: APAC Virtual Extensible LAN (VXLAN) Market Market Y-o-Y Growth Rate Comparison by Component (2016-2032)
- Figure 123: APAC Virtual Extensible LAN (VXLAN) Market Market Y-o-Y Growth Rate Comparison by Enterprise Size (2016-2032)
- Figure 124: APAC Virtual Extensible LAN (VXLAN) Market Market Y-o-Y Growth Rate Comparison by Application (2016-2032)
- Figure 125: APAC Virtual Extensible LAN (VXLAN) Market Market Y-o-Y Growth Rate Comparison by End User (2016-2032)
- Figure 126: APAC Virtual Extensible LAN (VXLAN) Market Market Share Comparison by Country (2016-2032)
- Figure 127: APAC Virtual Extensible LAN (VXLAN) Market Market Share Comparison by Component (2016-2032)
- Figure 128: APAC Virtual Extensible LAN (VXLAN) Market Market Share Comparison by Enterprise Size (2016-2032)
- Figure 129: APAC Virtual Extensible LAN (VXLAN) Market Market Share Comparison by Application (2016-2032)
- Figure 130: APAC Virtual Extensible LAN (VXLAN) Market Market Share Comparison by End User (2016-2032)
- Figure 131: Latin America Virtual Extensible LAN (VXLAN) Market Revenue (US$ Mn) Market Share by Componentin 2022
- Figure 132: Latin America Virtual Extensible LAN (VXLAN) Market Market Attractiveness Analysis by Component, 2016-2032
- Figure 133: Latin America Virtual Extensible LAN (VXLAN) Market Revenue (US$ Mn) Market Share by Enterprise Sizein 2022
- Figure 134: Latin America Virtual Extensible LAN (VXLAN) Market Market Attractiveness Analysis by Enterprise Size, 2016-2032
- Figure 135: Latin America Virtual Extensible LAN (VXLAN) Market Revenue (US$ Mn) Market Share by Applicationin 2022
- Figure 136: Latin America Virtual Extensible LAN (VXLAN) Market Market Attractiveness Analysis by Application, 2016-2032
- Figure 137: Latin America Virtual Extensible LAN (VXLAN) Market Revenue (US$ Mn) Market Share by End Userin 2022
- Figure 138: Latin America Virtual Extensible LAN (VXLAN) Market Market Attractiveness Analysis by End User, 2016-2032
- Figure 139: Latin America Virtual Extensible LAN (VXLAN) Market Revenue (US$ Mn) Market Share by Country in 2022
- Figure 140: Latin America Virtual Extensible LAN (VXLAN) Market Market Attractiveness Analysis by Country, 2016-2032
- Figure 141: Latin America Virtual Extensible LAN (VXLAN) Market Market Revenue (US$ Mn) (2016-2032)
- Figure 142: Latin America Virtual Extensible LAN (VXLAN) Market Market Revenue (US$ Mn) Comparison by Country (2016-2032)
- Figure 143: Latin America Virtual Extensible LAN (VXLAN) Market Market Revenue (US$ Mn) Comparison by Component (2016-2032)
- Figure 144: Latin America Virtual Extensible LAN (VXLAN) Market Market Revenue (US$ Mn) Comparison by Enterprise Size (2016-2032)
- Figure 145: Latin America Virtual Extensible LAN (VXLAN) Market Market Revenue (US$ Mn) Comparison by Application (2016-2032)
- Figure 146: Latin America Virtual Extensible LAN (VXLAN) Market Market Revenue (US$ Mn) Comparison by End User (2016-2032)
- Figure 147: Latin America Virtual Extensible LAN (VXLAN) Market Market Y-o-Y Growth Rate Comparison by Country (2016-2032)
- Figure 148: Latin America Virtual Extensible LAN (VXLAN) Market Market Y-o-Y Growth Rate Comparison by Component (2016-2032)
- Figure 149: Latin America Virtual Extensible LAN (VXLAN) Market Market Y-o-Y Growth Rate Comparison by Enterprise Size (2016-2032)
- Figure 150: Latin America Virtual Extensible LAN (VXLAN) Market Market Y-o-Y Growth Rate Comparison by Application (2016-2032)
- Figure 151: Latin America Virtual Extensible LAN (VXLAN) Market Market Y-o-Y Growth Rate Comparison by End User (2016-2032)
- Figure 152: Latin America Virtual Extensible LAN (VXLAN) Market Market Share Comparison by Country (2016-2032)
- Figure 153: Latin America Virtual Extensible LAN (VXLAN) Market Market Share Comparison by Component (2016-2032)
- Figure 154: Latin America Virtual Extensible LAN (VXLAN) Market Market Share Comparison by Enterprise Size (2016-2032)
- Figure 155: Latin America Virtual Extensible LAN (VXLAN) Market Market Share Comparison by Application (2016-2032)
- Figure 156: Latin America Virtual Extensible LAN (VXLAN) Market Market Share Comparison by End User (2016-2032)
- Figure 157: Middle East & Africa Virtual Extensible LAN (VXLAN) Market Revenue (US$ Mn) Market Share by Componentin 2022
- Figure 158: Middle East & Africa Virtual Extensible LAN (VXLAN) Market Market Attractiveness Analysis by Component, 2016-2032
- Figure 159: Middle East & Africa Virtual Extensible LAN (VXLAN) Market Revenue (US$ Mn) Market Share by Enterprise Sizein 2022
- Figure 160: Middle East & Africa Virtual Extensible LAN (VXLAN) Market Market Attractiveness Analysis by Enterprise Size, 2016-2032
- Figure 161: Middle East & Africa Virtual Extensible LAN (VXLAN) Market Revenue (US$ Mn) Market Share by Applicationin 2022
- Figure 162: Middle East & Africa Virtual Extensible LAN (VXLAN) Market Market Attractiveness Analysis by Application, 2016-2032
- Figure 163: Middle East & Africa Virtual Extensible LAN (VXLAN) Market Revenue (US$ Mn) Market Share by End Userin 2022
- Figure 164: Middle East & Africa Virtual Extensible LAN (VXLAN) Market Market Attractiveness Analysis by End User, 2016-2032
- Figure 165: Middle East & Africa Virtual Extensible LAN (VXLAN) Market Revenue (US$ Mn) Market Share by Country in 2022
- Figure 166: Middle East & Africa Virtual Extensible LAN (VXLAN) Market Market Attractiveness Analysis by Country, 2016-2032
- Figure 167: Middle East & Africa Virtual Extensible LAN (VXLAN) Market Market Revenue (US$ Mn) (2016-2032)
- Figure 168: Middle East & Africa Virtual Extensible LAN (VXLAN) Market Market Revenue (US$ Mn) Comparison by Country (2016-2032)
- Figure 169: Middle East & Africa Virtual Extensible LAN (VXLAN) Market Market Revenue (US$ Mn) Comparison by Component (2016-2032)
- Figure 170: Middle East & Africa Virtual Extensible LAN (VXLAN) Market Market Revenue (US$ Mn) Comparison by Enterprise Size (2016-2032)
- Figure 171: Middle East & Africa Virtual Extensible LAN (VXLAN) Market Market Revenue (US$ Mn) Comparison by Application (2016-2032)
- Figure 172: Middle East & Africa Virtual Extensible LAN (VXLAN) Market Market Revenue (US$ Mn) Comparison by End User (2016-2032)
- Figure 173: Middle East & Africa Virtual Extensible LAN (VXLAN) Market Market Y-o-Y Growth Rate Comparison by Country (2016-2032)
- Figure 174: Middle East & Africa Virtual Extensible LAN (VXLAN) Market Market Y-o-Y Growth Rate Comparison by Component (2016-2032)
- Figure 175: Middle East & Africa Virtual Extensible LAN (VXLAN) Market Market Y-o-Y Growth Rate Comparison by Enterprise Size (2016-2032)
- Figure 176: Middle East & Africa Virtual Extensible LAN (VXLAN) Market Market Y-o-Y Growth Rate Comparison by Application (2016-2032)
- Figure 177: Middle East & Africa Virtual Extensible LAN (VXLAN) Market Market Y-o-Y Growth Rate Comparison by End User (2016-2032)
- Figure 178: Middle East & Africa Virtual Extensible LAN (VXLAN) Market Market Share Comparison by Country (2016-2032)
- Figure 179: Middle East & Africa Virtual Extensible LAN (VXLAN) Market Market Share Comparison by Component (2016-2032)
- Figure 180: Middle East & Africa Virtual Extensible LAN (VXLAN) Market Market Share Comparison by Enterprise Size (2016-2032)
- Figure 181: Middle East & Africa Virtual Extensible LAN (VXLAN) Market Market Share Comparison by Application (2016-2032)
- Figure 182: Middle East & Africa Virtual Extensible LAN (VXLAN) Market Market Share Comparison by End User (2016-2032)
"
- List of Tables
- "
- Table 1: Global Virtual Extensible LAN (VXLAN) Market Market Comparison by Component (2016-2032)
- Table 2: Global Virtual Extensible LAN (VXLAN) Market Market Comparison by Enterprise Size (2016-2032)
- Table 3: Global Virtual Extensible LAN (VXLAN) Market Market Comparison by Application (2016-2032)
- Table 4: Global Virtual Extensible LAN (VXLAN) Market Market Comparison by End User (2016-2032)
- Table 5: Global Virtual Extensible LAN (VXLAN) Market Revenue (US$ Mn) Comparison by Region (2016-2032)
- Table 6: Global Virtual Extensible LAN (VXLAN) Market Market Revenue (US$ Mn) (2016-2032)
- Table 7: Global Virtual Extensible LAN (VXLAN) Market Market Revenue (US$ Mn) Comparison by Region (2016-2032)
- Table 8: Global Virtual Extensible LAN (VXLAN) Market Market Revenue (US$ Mn) Comparison by Component (2016-2032)
- Table 9: Global Virtual Extensible LAN (VXLAN) Market Market Revenue (US$ Mn) Comparison by Enterprise Size (2016-2032)
- Table 10: Global Virtual Extensible LAN (VXLAN) Market Market Revenue (US$ Mn) Comparison by Application (2016-2032)
- Table 11: Global Virtual Extensible LAN (VXLAN) Market Market Revenue (US$ Mn) Comparison by End User (2016-2032)
- Table 12: Global Virtual Extensible LAN (VXLAN) Market Market Y-o-Y Growth Rate Comparison by Region (2016-2032)
- Table 13: Global Virtual Extensible LAN (VXLAN) Market Market Y-o-Y Growth Rate Comparison by Component (2016-2032)
- Table 14: Global Virtual Extensible LAN (VXLAN) Market Market Y-o-Y Growth Rate Comparison by Enterprise Size (2016-2032)
- Table 15: Global Virtual Extensible LAN (VXLAN) Market Market Y-o-Y Growth Rate Comparison by Application (2016-2032)
- Table 16: Global Virtual Extensible LAN (VXLAN) Market Market Y-o-Y Growth Rate Comparison by End User (2016-2032)
- Table 17: Global Virtual Extensible LAN (VXLAN) Market Market Share Comparison by Region (2016-2032)
- Table 18: Global Virtual Extensible LAN (VXLAN) Market Market Share Comparison by Component (2016-2032)
- Table 19: Global Virtual Extensible LAN (VXLAN) Market Market Share Comparison by Enterprise Size (2016-2032)
- Table 20: Global Virtual Extensible LAN (VXLAN) Market Market Share Comparison by Application (2016-2032)
- Table 21: Global Virtual Extensible LAN (VXLAN) Market Market Share Comparison by End User (2016-2032)
- Table 22: North America Virtual Extensible LAN (VXLAN) Market Market Comparison by Enterprise Size (2016-2032)
- Table 23: North America Virtual Extensible LAN (VXLAN) Market Market Comparison by Application (2016-2032)
- Table 24: North America Virtual Extensible LAN (VXLAN) Market Market Comparison by End User (2016-2032)
- Table 25: North America Virtual Extensible LAN (VXLAN) Market Revenue (US$ Mn) Comparison by Country (2016-2032)
- Table 26: North America Virtual Extensible LAN (VXLAN) Market Market Revenue (US$ Mn) (2016-2032)
- Table 27: North America Virtual Extensible LAN (VXLAN) Market Market Revenue (US$ Mn) Comparison by Country (2016-2032)
- Table 28: North America Virtual Extensible LAN (VXLAN) Market Market Revenue (US$ Mn) Comparison by Component (2016-2032)
- Table 29: North America Virtual Extensible LAN (VXLAN) Market Market Revenue (US$ Mn) Comparison by Enterprise Size (2016-2032)
- Table 30: North America Virtual Extensible LAN (VXLAN) Market Market Revenue (US$ Mn) Comparison by Application (2016-2032)
- Table 31: North America Virtual Extensible LAN (VXLAN) Market Market Revenue (US$ Mn) Comparison by End User (2016-2032)
- Table 32: North America Virtual Extensible LAN (VXLAN) Market Market Y-o-Y Growth Rate Comparison by Country (2016-2032)
- Table 33: North America Virtual Extensible LAN (VXLAN) Market Market Y-o-Y Growth Rate Comparison by Component (2016-2032)
- Table 34: North America Virtual Extensible LAN (VXLAN) Market Market Y-o-Y Growth Rate Comparison by Enterprise Size (2016-2032)
- Table 35: North America Virtual Extensible LAN (VXLAN) Market Market Y-o-Y Growth Rate Comparison by Application (2016-2032)
- Table 36: North America Virtual Extensible LAN (VXLAN) Market Market Y-o-Y Growth Rate Comparison by End User (2016-2032)
- Table 37: North America Virtual Extensible LAN (VXLAN) Market Market Share Comparison by Country (2016-2032)
- Table 38: North America Virtual Extensible LAN (VXLAN) Market Market Share Comparison by Component (2016-2032)
- Table 39: North America Virtual Extensible LAN (VXLAN) Market Market Share Comparison by Enterprise Size (2016-2032)
- Table 40: North America Virtual Extensible LAN (VXLAN) Market Market Share Comparison by Application (2016-2032)
- Table 41: North America Virtual Extensible LAN (VXLAN) Market Market Share Comparison by End User (2016-2032)
- Table 42: Western Europe Virtual Extensible LAN (VXLAN) Market Market Comparison by Component (2016-2032)
- Table 43: Western Europe Virtual Extensible LAN (VXLAN) Market Market Comparison by Enterprise Size (2016-2032)
- Table 44: Western Europe Virtual Extensible LAN (VXLAN) Market Market Comparison by Application (2016-2032)
- Table 45: Western Europe Virtual Extensible LAN (VXLAN) Market Market Comparison by End User (2016-2032)
- Table 46: Western Europe Virtual Extensible LAN (VXLAN) Market Revenue (US$ Mn) Comparison by Country (2016-2032)
- Table 47: Western Europe Virtual Extensible LAN (VXLAN) Market Market Revenue (US$ Mn) (2016-2032)
- Table 48: Western Europe Virtual Extensible LAN (VXLAN) Market Market Revenue (US$ Mn) Comparison by Country (2016-2032)
- Table 49: Western Europe Virtual Extensible LAN (VXLAN) Market Market Revenue (US$ Mn) Comparison by Component (2016-2032)
- Table 50: Western Europe Virtual Extensible LAN (VXLAN) Market Market Revenue (US$ Mn) Comparison by Enterprise Size (2016-2032)
- Table 51: Western Europe Virtual Extensible LAN (VXLAN) Market Market Revenue (US$ Mn) Comparison by Application (2016-2032)
- Table 52: Western Europe Virtual Extensible LAN (VXLAN) Market Market Revenue (US$ Mn) Comparison by End User (2016-2032)
- Table 53: Western Europe Virtual Extensible LAN (VXLAN) Market Market Y-o-Y Growth Rate Comparison by Country (2016-2032)
- Table 54: Western Europe Virtual Extensible LAN (VXLAN) Market Market Y-o-Y Growth Rate Comparison by Component (2016-2032)
- Table 55: Western Europe Virtual Extensible LAN (VXLAN) Market Market Y-o-Y Growth Rate Comparison by Enterprise Size (2016-2032)
- Table 56: Western Europe Virtual Extensible LAN (VXLAN) Market Market Y-o-Y Growth Rate Comparison by Application (2016-2032)
- Table 57: Western Europe Virtual Extensible LAN (VXLAN) Market Market Y-o-Y Growth Rate Comparison by End User (2016-2032)
- Table 58: Western Europe Virtual Extensible LAN (VXLAN) Market Market Share Comparison by Country (2016-2032)
- Table 59: Western Europe Virtual Extensible LAN (VXLAN) Market Market Share Comparison by Component (2016-2032)
- Table 60: Western Europe Virtual Extensible LAN (VXLAN) Market Market Share Comparison by Enterprise Size (2016-2032)
- Table 61: Western Europe Virtual Extensible LAN (VXLAN) Market Market Share Comparison by Application (2016-2032)
- Table 62: Western Europe Virtual Extensible LAN (VXLAN) Market Market Share Comparison by End User (2016-2032)
- Table 63: Eastern Europe Virtual Extensible LAN (VXLAN) Market Market Comparison by Component (2016-2032)
- Table 64: Eastern Europe Virtual Extensible LAN (VXLAN) Market Market Comparison by Enterprise Size (2016-2032)
- Table 65: Eastern Europe Virtual Extensible LAN (VXLAN) Market Market Comparison by Application (2016-2032)
- Table 66: Eastern Europe Virtual Extensible LAN (VXLAN) Market Market Comparison by End User (2016-2032)
- Table 67: Eastern Europe Virtual Extensible LAN (VXLAN) Market Revenue (US$ Mn) Comparison by Country (2016-2032)
- Table 68: Eastern Europe Virtual Extensible LAN (VXLAN) Market Market Revenue (US$ Mn) (2016-2032)
- Table 69: Eastern Europe Virtual Extensible LAN (VXLAN) Market Market Revenue (US$ Mn) Comparison by Country (2016-2032)
- Table 70: Eastern Europe Virtual Extensible LAN (VXLAN) Market Market Revenue (US$ Mn) Comparison by Component (2016-2032)
- Table 71: Eastern Europe Virtual Extensible LAN (VXLAN) Market Market Revenue (US$ Mn) Comparison by Enterprise Size (2016-2032)
- Table 72: Eastern Europe Virtual Extensible LAN (VXLAN) Market Market Revenue (US$ Mn) Comparison by Application (2016-2032)
- Table 73: Eastern Europe Virtual Extensible LAN (VXLAN) Market Market Revenue (US$ Mn) Comparison by End User (2016-2032)
- Table 74: Eastern Europe Virtual Extensible LAN (VXLAN) Market Market Y-o-Y Growth Rate Comparison by Country (2016-2032)
- Table 75: Eastern Europe Virtual Extensible LAN (VXLAN) Market Market Y-o-Y Growth Rate Comparison by Component (2016-2032)
- Table 76: Eastern Europe Virtual Extensible LAN (VXLAN) Market Market Y-o-Y Growth Rate Comparison by Enterprise Size (2016-2032)
- Table 77: Eastern Europe Virtual Extensible LAN (VXLAN) Market Market Y-o-Y Growth Rate Comparison by Application (2016-2032)
- Table 78: Eastern Europe Virtual Extensible LAN (VXLAN) Market Market Y-o-Y Growth Rate Comparison by End User (2016-2032)
- Table 79: Eastern Europe Virtual Extensible LAN (VXLAN) Market Market Share Comparison by Country (2016-2032)
- Table 80: Eastern Europe Virtual Extensible LAN (VXLAN) Market Market Share Comparison by Component (2016-2032)
- Table 81: Eastern Europe Virtual Extensible LAN (VXLAN) Market Market Share Comparison by Enterprise Size (2016-2032)
- Table 82: Eastern Europe Virtual Extensible LAN (VXLAN) Market Market Share Comparison by Application (2016-2032)
- Table 83: Eastern Europe Virtual Extensible LAN (VXLAN) Market Market Share Comparison by End User (2016-2032)
- Table 84: APAC Virtual Extensible LAN (VXLAN) Market Market Comparison by Component (2016-2032)
- Table 85: APAC Virtual Extensible LAN (VXLAN) Market Market Comparison by Enterprise Size (2016-2032)
- Table 86: APAC Virtual Extensible LAN (VXLAN) Market Market Comparison by Application (2016-2032)
- Table 87: APAC Virtual Extensible LAN (VXLAN) Market Market Comparison by End User (2016-2032)
- Table 88: APAC Virtual Extensible LAN (VXLAN) Market Revenue (US$ Mn) Comparison by Country (2016-2032)
- Table 89: APAC Virtual Extensible LAN (VXLAN) Market Market Revenue (US$ Mn) (2016-2032)
- Table 90: APAC Virtual Extensible LAN (VXLAN) Market Market Revenue (US$ Mn) Comparison by Country (2016-2032)
- Table 91: APAC Virtual Extensible LAN (VXLAN) Market Market Revenue (US$ Mn) Comparison by Component (2016-2032)
- Table 92: APAC Virtual Extensible LAN (VXLAN) Market Market Revenue (US$ Mn) Comparison by Enterprise Size (2016-2032)
- Table 93: APAC Virtual Extensible LAN (VXLAN) Market Market Revenue (US$ Mn) Comparison by Application (2016-2032)
- Table 94: APAC Virtual Extensible LAN (VXLAN) Market Market Revenue (US$ Mn) Comparison by End User (2016-2032)
- Table 95: APAC Virtual Extensible LAN (VXLAN) Market Market Y-o-Y Growth Rate Comparison by Country (2016-2032)
- Table 96: APAC Virtual Extensible LAN (VXLAN) Market Market Y-o-Y Growth Rate Comparison by Component (2016-2032)
- Table 97: APAC Virtual Extensible LAN (VXLAN) Market Market Y-o-Y Growth Rate Comparison by Enterprise Size (2016-2032)
- Table 98: APAC Virtual Extensible LAN (VXLAN) Market Market Y-o-Y Growth Rate Comparison by Application (2016-2032)
- Table 99: APAC Virtual Extensible LAN (VXLAN) Market Market Y-o-Y Growth Rate Comparison by End User (2016-2032)
- Table 100: APAC Virtual Extensible LAN (VXLAN) Market Market Share Comparison by Country (2016-2032)
- Table 101: APAC Virtual Extensible LAN (VXLAN) Market Market Share Comparison by Component (2016-2032)
- Table 102: APAC Virtual Extensible LAN (VXLAN) Market Market Share Comparison by Enterprise Size (2016-2032)
- Table 103: APAC Virtual Extensible LAN (VXLAN) Market Market Share Comparison by Application (2016-2032)
- Table 104: APAC Virtual Extensible LAN (VXLAN) Market Market Share Comparison by End User (2016-2032)
- Table 105: Latin America Virtual Extensible LAN (VXLAN) Market Market Comparison by Component (2016-2032)
- Table 106: Latin America Virtual Extensible LAN (VXLAN) Market Market Comparison by Enterprise Size (2016-2032)
- Table 107: Latin America Virtual Extensible LAN (VXLAN) Market Market Comparison by Application (2016-2032)
- Table 108: Latin America Virtual Extensible LAN (VXLAN) Market Market Comparison by End User (2016-2032)
- Table 109: Latin America Virtual Extensible LAN (VXLAN) Market Revenue (US$ Mn) Comparison by Country (2016-2032)
- Table 110: Latin America Virtual Extensible LAN (VXLAN) Market Market Revenue (US$ Mn) (2016-2032)
- Table 111: Latin America Virtual Extensible LAN (VXLAN) Market Market Revenue (US$ Mn) Comparison by Country (2016-2032)
- Table 112: Latin America Virtual Extensible LAN (VXLAN) Market Market Revenue (US$ Mn) Comparison by Component (2016-2032)
- Table 113: Latin America Virtual Extensible LAN (VXLAN) Market Market Revenue (US$ Mn) Comparison by Enterprise Size (2016-2032)
- Table 114: Latin America Virtual Extensible LAN (VXLAN) Market Market Revenue (US$ Mn) Comparison by Application (2016-2032)
- Table 115: Latin America Virtual Extensible LAN (VXLAN) Market Market Revenue (US$ Mn) Comparison by End User (2016-2032)
- Table 116: Latin America Virtual Extensible LAN (VXLAN) Market Market Y-o-Y Growth Rate Comparison by Country (2016-2032)
- Table 117: Latin America Virtual Extensible LAN (VXLAN) Market Market Y-o-Y Growth Rate Comparison by Component (2016-2032)
- Table 118: Latin America Virtual Extensible LAN (VXLAN) Market Market Y-o-Y Growth Rate Comparison by Enterprise Size (2016-2032)
- Table 119: Latin America Virtual Extensible LAN (VXLAN) Market Market Y-o-Y Growth Rate Comparison by Application (2016-2032)
- Table 120: Latin America Virtual Extensible LAN (VXLAN) Market Market Y-o-Y Growth Rate Comparison by End User (2016-2032)
- Table 121: Latin America Virtual Extensible LAN (VXLAN) Market Market Share Comparison by Country (2016-2032)
- Table 122: Latin America Virtual Extensible LAN (VXLAN) Market Market Share Comparison by Component (2016-2032)
- Table 123: Latin America Virtual Extensible LAN (VXLAN) Market Market Share Comparison by Enterprise Size (2016-2032)
- Table 124: Latin America Virtual Extensible LAN (VXLAN) Market Market Share Comparison by Application (2016-2032)
- Table 125: Latin America Virtual Extensible LAN (VXLAN) Market Market Share Comparison by End User (2016-2032)
- Table 126: Middle East & Africa Virtual Extensible LAN (VXLAN) Market Market Comparison by Component (2016-2032)
- Table 127: Middle East & Africa Virtual Extensible LAN (VXLAN) Market Market Comparison by Enterprise Size (2016-2032)
- Table 128: Middle East & Africa Virtual Extensible LAN (VXLAN) Market Market Comparison by Application (2016-2032)
- Table 129: Middle East & Africa Virtual Extensible LAN (VXLAN) Market Market Comparison by End User (2016-2032)
- Table 130: Middle East & Africa Virtual Extensible LAN (VXLAN) Market Revenue (US$ Mn) Comparison by Country (2016-2032)
- Table 131: Middle East & Africa Virtual Extensible LAN (VXLAN) Market Market Revenue (US$ Mn) (2016-2032)
- Table 132: Middle East & Africa Virtual Extensible LAN (VXLAN) Market Market Revenue (US$ Mn) Comparison by Country (2016-2032)
- Table 133: Middle East & Africa Virtual Extensible LAN (VXLAN) Market Market Revenue (US$ Mn) Comparison by Component (2016-2032)
- Table 134: Middle East & Africa Virtual Extensible LAN (VXLAN) Market Market Revenue (US$ Mn) Comparison by Enterprise Size (2016-2032)
- Table 135: Middle East & Africa Virtual Extensible LAN (VXLAN) Market Market Revenue (US$ Mn) Comparison by Application (2016-2032)
- Table 136: Middle East & Africa Virtual Extensible LAN (VXLAN) Market Market Revenue (US$ Mn) Comparison by End User (2016-2032)
- Table 137: Middle East & Africa Virtual Extensible LAN (VXLAN) Market Market Y-o-Y Growth Rate Comparison by Country (2016-2032)
- Table 138: Middle East & Africa Virtual Extensible LAN (VXLAN) Market Market Y-o-Y Growth Rate Comparison by Component (2016-2032)
- Table 139: Middle East & Africa Virtual Extensible LAN (VXLAN) Market Market Y-o-Y Growth Rate Comparison by Enterprise Size (2016-2032)
- Table 140: Middle East & Africa Virtual Extensible LAN (VXLAN) Market Market Y-o-Y Growth Rate Comparison by Application (2016-2032)
- Table 141: Middle East & Africa Virtual Extensible LAN (VXLAN) Market Market Y-o-Y Growth Rate Comparison by End User (2016-2032)
- Table 142: Middle East & Africa Virtual Extensible LAN (VXLAN) Market Market Share Comparison by Country (2016-2032)
- Table 143: Middle East & Africa Virtual Extensible LAN (VXLAN) Market Market Share Comparison by Component (2016-2032)
- Table 144: Middle East & Africa Virtual Extensible LAN (VXLAN) Market Market Share Comparison by Enterprise Size (2016-2032)
- Table 145: Middle East & Africa Virtual Extensible LAN (VXLAN) Market Market Share Comparison by Application (2016-2032)
- Table 146: Middle East & Africa Virtual Extensible LAN (VXLAN) Market Market Share Comparison by End User (2016-2032)
- 1. Executive Summary
-
- ccenture plc
- Arista Networks
- Cisco Systems Inc.
- Extreme Networks Inc.
- Fortinet Inc.
- Hewlett Packard Enterprise (HPE)
- Huawei Technologies Co., Ltd.
- Juniper Networks
- Nokia Corporation
- Palo Alto Networks, Inc.
- VMware (Broadcom)
Our Clients


View Our Licence Options
